CENLA ECONOMIC DASHBOARD
March 18, 2021.
Dr.RandallDupont Dean,CollegeofBusiness
LouisianaStateUniversityofAlexandria
rdupont@lsua.edu

Topics on Central Louisiana:
History of CenLa, Government, and Legislative Process

Education and Workforce Development
Business, Industry, and Economy
Art, Culture, and Tourism
Criminal Justice and Law Enforcement
Healthcare and Community Needs
Understanding Leadership

Strategic Leadership Simulation
Dates: April 29, May 27, June 17, August 26, September 23, October 28, November 18, 2021, Legislative Day at Capitol to be determined (mid-May)
Cost: $1,500 covers seven sessions and Legislative Day trip Light breakfast & Lunch provided
Location: The Wesley Center, Woodworth, LA
Apply at lsua.it/LeadershipCenLA2021
KEYFINDINGS
March 18, 2021 CENLA Economic Dashboard
COVID-19
• In Region 6, 13.5% of the population has been vaccinated or initiated the series of vaccinations, compared to 17.6% statewide.
• Region 6 exceeds the state average in individuals 70+ who have been vaccinated, 42.4% compared to 39.1%.
• 9.1% of the population in Region 6 (Cenla) have completed vaccination. Rapides and Natchitoches have the highest percentage of completed vaccinations in Region 6 at 11%.
EMPLOYMENT
• Statewide average weekly initial unemployment claims filed in February fell to 7,249 from 16,957 in January, a 57% decrease, while average weekly continued unemployment claims in February fell to 55,439 from 69,077 in January, a 20% decrease.
• In CENLA, average weekly initial unemployment claims in central Louisiana fell to 414 in February from 976 in January, a 58% decrease, while average weekly continued unemployment claims in central Louisiana fell to 3,655 in February from 4,701 in January, a 22% decrease.
• At 5.2%, the Alexandria MSA had the lowest unemployment rate among the state’s major metro areas for the ninth consecutive month, well below the state’s 7.6% rate.
• Louisiana’s unemployment rate fell 0.3% in January to 7.6% from 7.9% in December.
TAX REVENUE
• As expected, tremendous consumer spending in December resulted in an across the board decline in January sales taxes revenue for all tax jurisdictions. However, when compared to the same month in previous year and year-to-date, nearly all parishes and cities were higher. February tax data reflects sales activity in January.
• All nine jurisdictions in central Louisiana reported lower tax revenues in February, reflecting decreased consumer spending in January. Decreases ranged from 14% to 27%.
• Occupational license revenue was down 22% in February year-to-date.

KEYFINDINGS… continued
March 18, 2021 CENLA Economic Dashboard
• Vehicle sales tax revenue was down in January in Evangeline, Avoyelles, and Rapides ranging from -1% to -6%. However, year-over-year vehicle tax revenue was up 10% to 15% in these parishes. St. Landry experienced a 10% increase in February compared to January, but was down 3% compared to last February.
BUILDING PERMITS
• Rapides Parish permit valuations in January were $195 million, up 442% over December 2020 which stood at $36 million. TheAcadian Gas Pipeline System being built in the parish accounted for $193 of the $195 million. Valuation of the pipeline skews the percentage of valuation change. Excluding the pipeline, Rapides permits were up 73% over February 2020.
• Residential construction permits in CENLAin January were up 351% over the same month a year ago.
• InAlexandria, commercial permit valuations were up 322% year-to-date in February, while residential permits were up 52% over the same time period.
HOUSING
• Indicators continue to point to a strong real estate market despite what would normally be a seasonally slow period. The housing market is still relatively strong in the Alexandria metro area. Compared to February of last year, active listings are down 60%, pending listings are up 316%, and the median days on the market remained unchanged.
• The median listing price is up 12% over the past year, while the average price is up 25%. Median listing prices peaked in October at $231,950 and are currently 11% off the peak.
TRAVEL
• Hotel occupancy in Rapides decreased 31% in January compared to a year earlier, with Avoyelles experiencing a 63% decline. Occupancy tax revenue is used as a proxy for occupancy rates.
KEYFINDINGS… continued
March 18, 2021 CENLA Economic Dashboard
• Total passenger traffic at Alexandria International airport (AEX) averaged 54% of last February’s level compared to only 37% nationwide. The 54% relative passenger throughput was remarkable considering ice storms closed AEX for five days.
• AEX had the second highest percentage passenger throughput rate in the state when compared with 2020 traffic.
LOCAL& LOUISIANA
• The number of new businesses established in Rapides in February 2021 was the same as a year ago, but 30% lower than in February 2019.
• According to a study of business closings in Rapides between 2018-2020, 31% of new businesses had a life of less than 2 years, 40% less than 3 years, and 52% less than 5 years.
• Total consumer spending in Louisiana is up 6.4% compared to January 2020, with retail spending up 29%. Entertainment and recreation spending is down 40%.
• Small business revenue in Louisiana was down 42% in late February compared to January 2020 with leisure and hospitality small business revenue down 68%.
• The percent of time employees in Rapides spent at work during winter storms Uri and Viola was down -57% compared to -51% for Hurricane Laura. Natchitoches was hardest hit at -61.6% followed by Grant (-58.4%), Rapides (-57%), and Vernon (-52.6%).
• In December 2020, Louisiana gasoline sales decreased -0.7% from November and was 5.8% below December 2019. Gasoline sales in Louisiana in 2020 exceeded 2019 in only two month – January andAugust.
• The Baker Hughes exploration rig count in Louisiana increased 4.4% in February. Likewise, the rig count nationwide increased 9.3% from a month ago, but remains54% down from a year ago.
• Gaming revenue in Louisiana increased 9% in January over December but was still down 5% compared to last year.
COVID-19
COVID-19VACCINATIONS
COVID-19 vaccinations as a percent of region population (left) and statewide (right) as of March 15, 2021.
In Region 6, 42.4% of individuals 70+ have had vaccinations initiated compared to 39.1% statewide.
In Region 6, 25.6% of individuals 60-69 have had vaccinations initiated compared to 27.0% statewide.
Source: Louisiana Office of Public Health, Region 6 (Central Louisiana), Regional Administrator/Medical Director, David J. Holcombe, MD, MSA, March 15, 2021.
COVID-19VACCINATIONSBYPARISH
COVID-19 vaccinations as a percent of parish population as of March 15, 2021.
Rapides and Natchitoches have the highest percentage of completed vaccinations in Region 6 at 11%.
In Region 6, 13.5% of the population has been vaccinated or initiated the series of vaccinations, compared to 17.6% statewide.
Source: Louisiana Office of Public Health, Region 6 (Central Louisiana), March 15, 2021.
COVID-19CASESBYK-12SCHOOLS
Covid-19 cases reported by K-12 schools in Region 6 from March 1 -7, 2021.
Source: Louisiana Office of Public Health, Region 6 (Central Louisiana), March 1-7, 2021.
COVID-19CASESBYCOLLECTIONDATE
COVID-19 cases by collection date as of March 12, 2021 in Region 6 with a 7-day moving average.
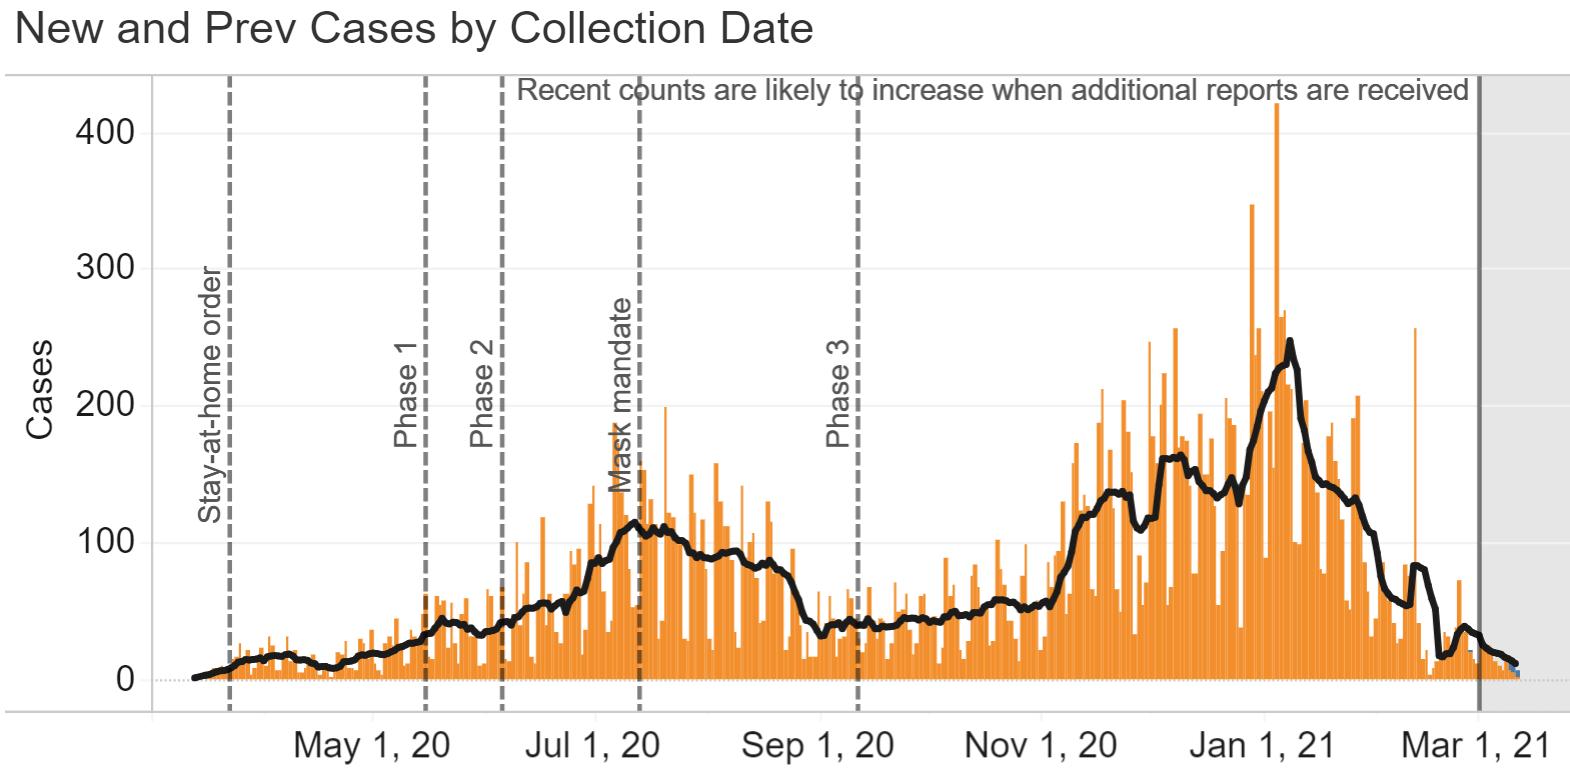
Source: Louisiana Office of Public Health, Region 6 (Central Louisiana), March 12, 2021.
:
COVID-19REGION6CASESBYAGEGROUP
Cases over time by age group in Region 6 through March 8, 2021.
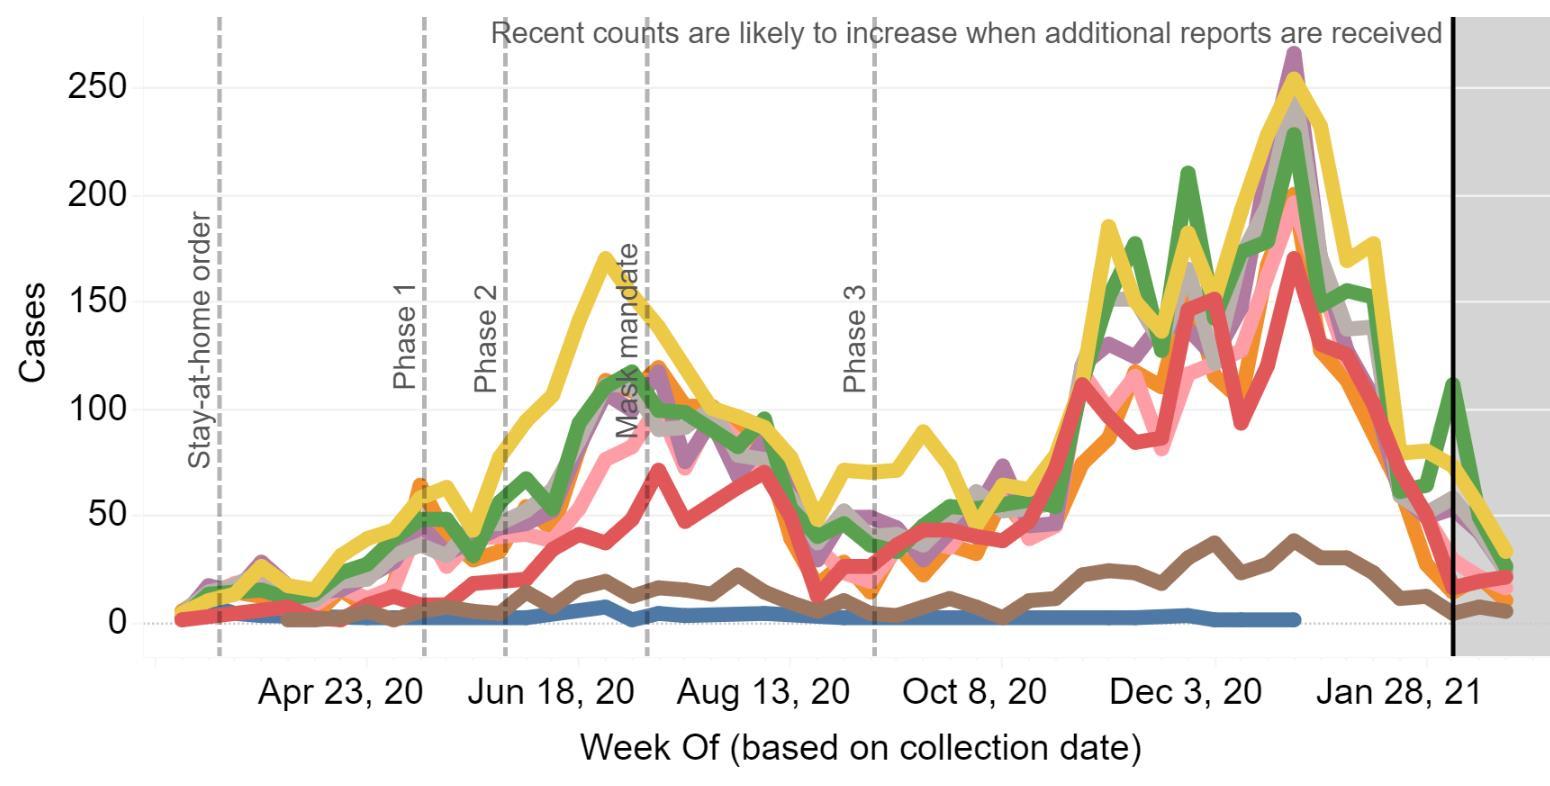
Source: Louisiana Office of Public Health, Region 6 (Central Louisiana), March 8, 2021.
:
COVID-19PERCENTPOSITIVEANDTESTVOLUME
COVID-19 percent positive and test volume in Region 6 as of March 12, 2021.
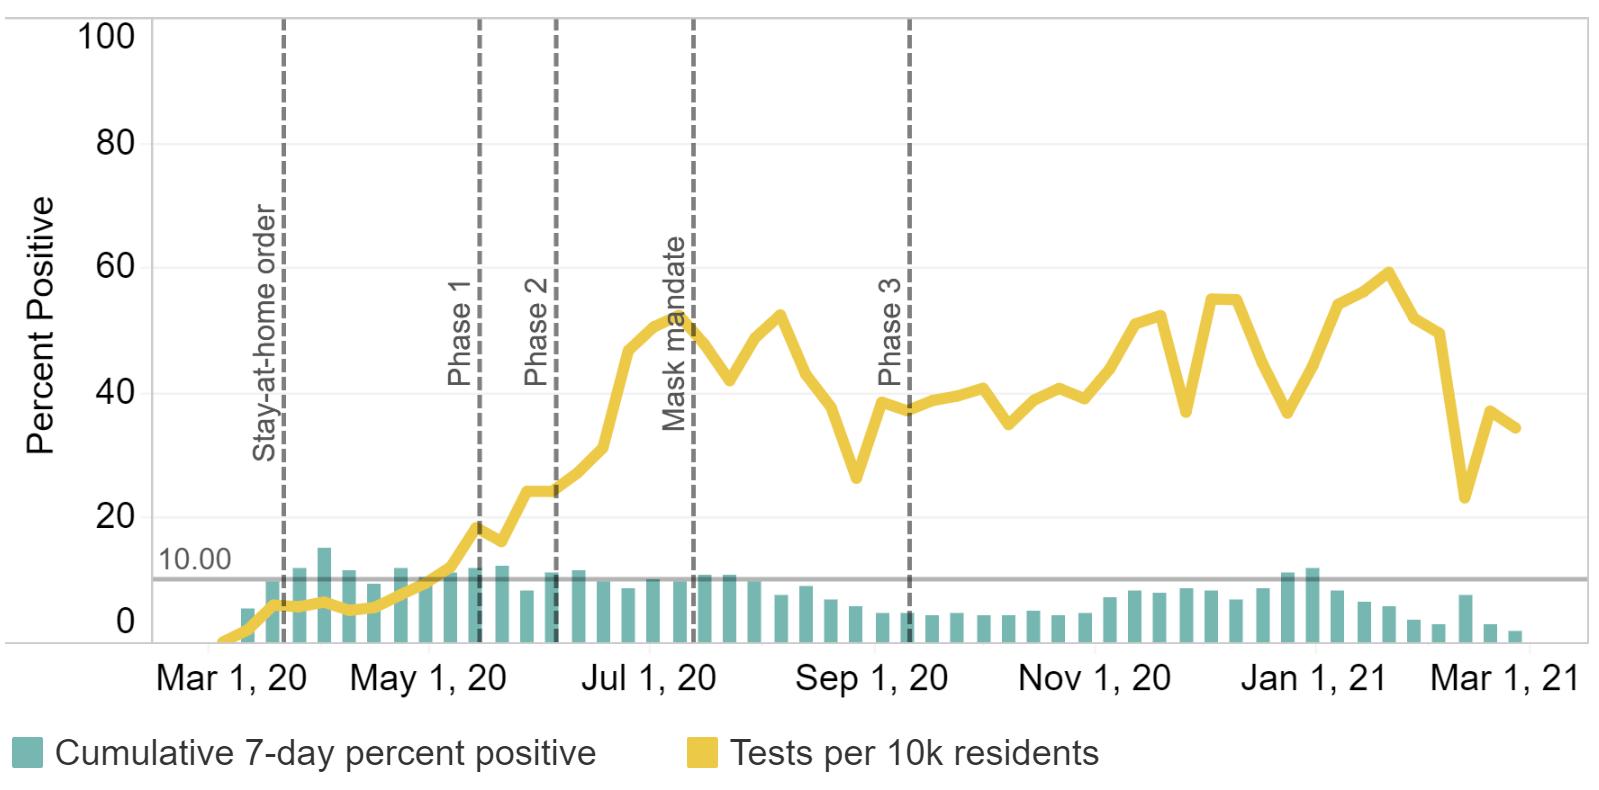
Source: Louisiana Office of Public Health, Region 6 (Central Louisiana), March 12, 2021..
:
COVID-19CASESBYAGEGROUP
COVID-19 cases statewide by age group as of March 12, 2021.
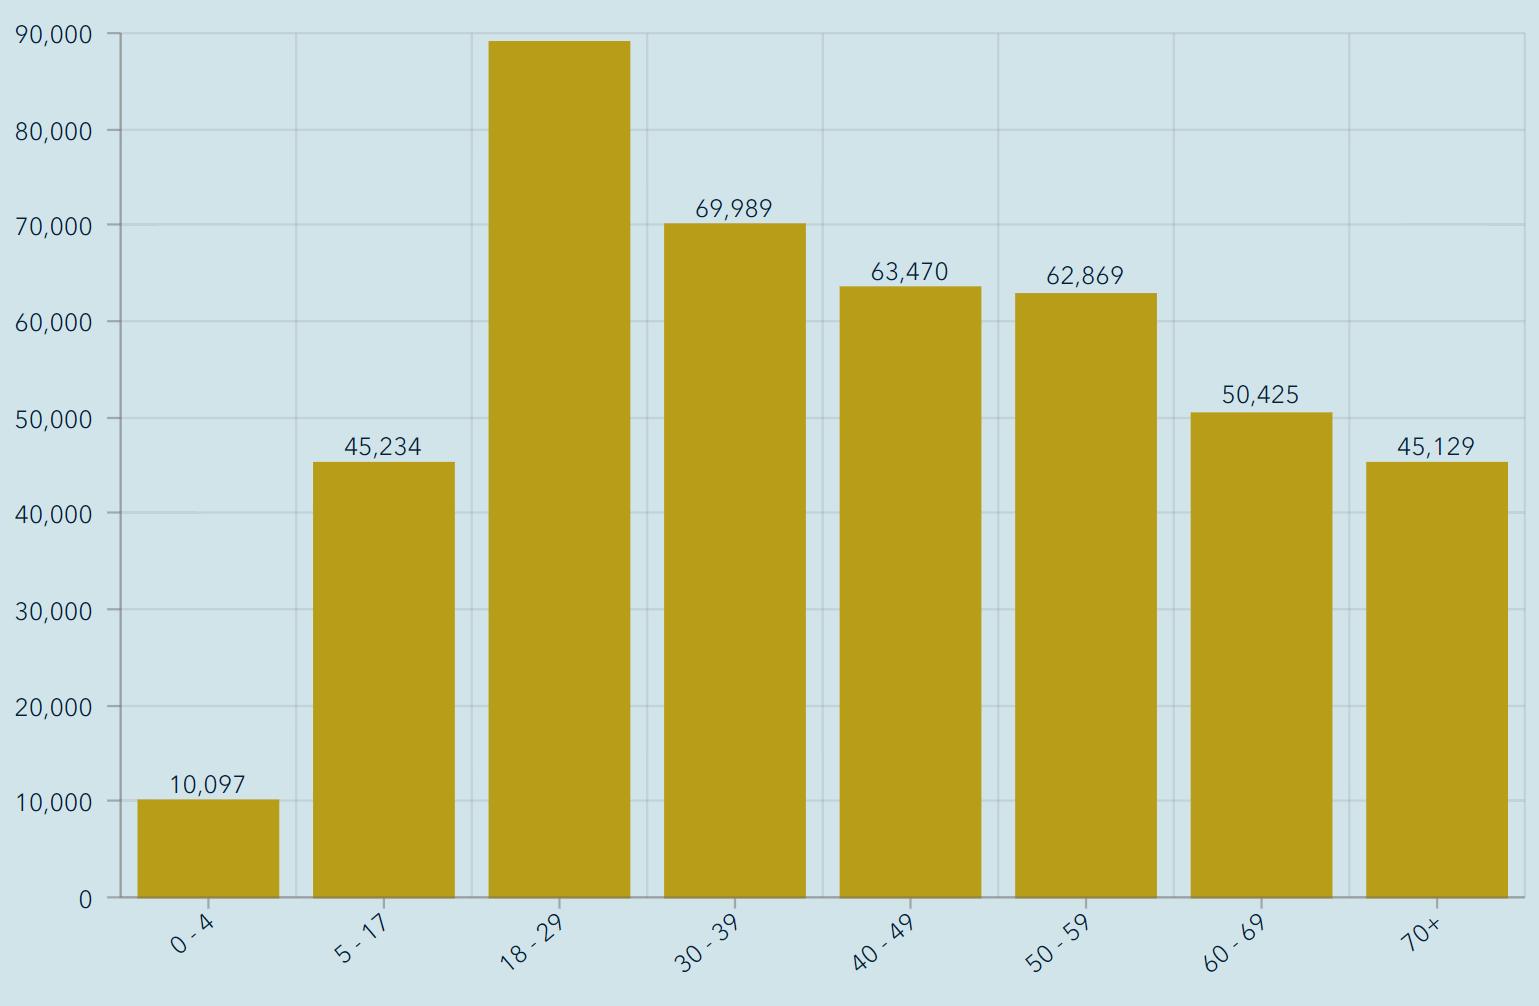
Source: Louisiana Office of Public Health, Region 6 (Central Louisiana), March 12, 2021.
:
COVID-19HOSPITALIZED&VENTILATED
Number of cases hospitalized (green line) and ventilated (yellow line) in Region 6 as of March 12, 2021.
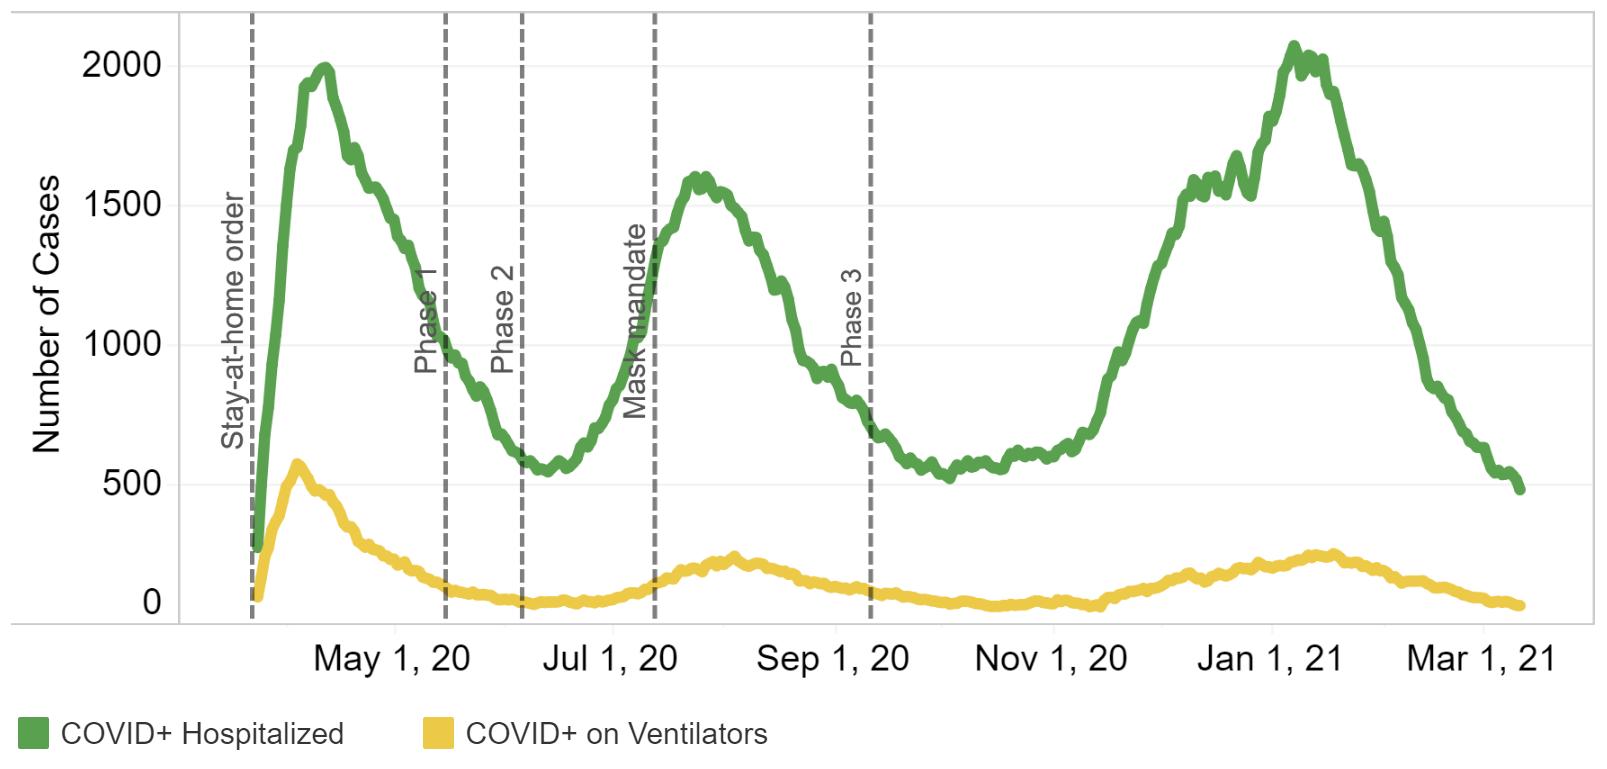
Source: Louisiana Office of Public Health, Region 6 (Central Louisiana), March 12, 2021.
:
COVID-19AVAILABLEBEDSBYLDHREGION

Available beds by Louisiana Department of Health region as of March 12, 2021.
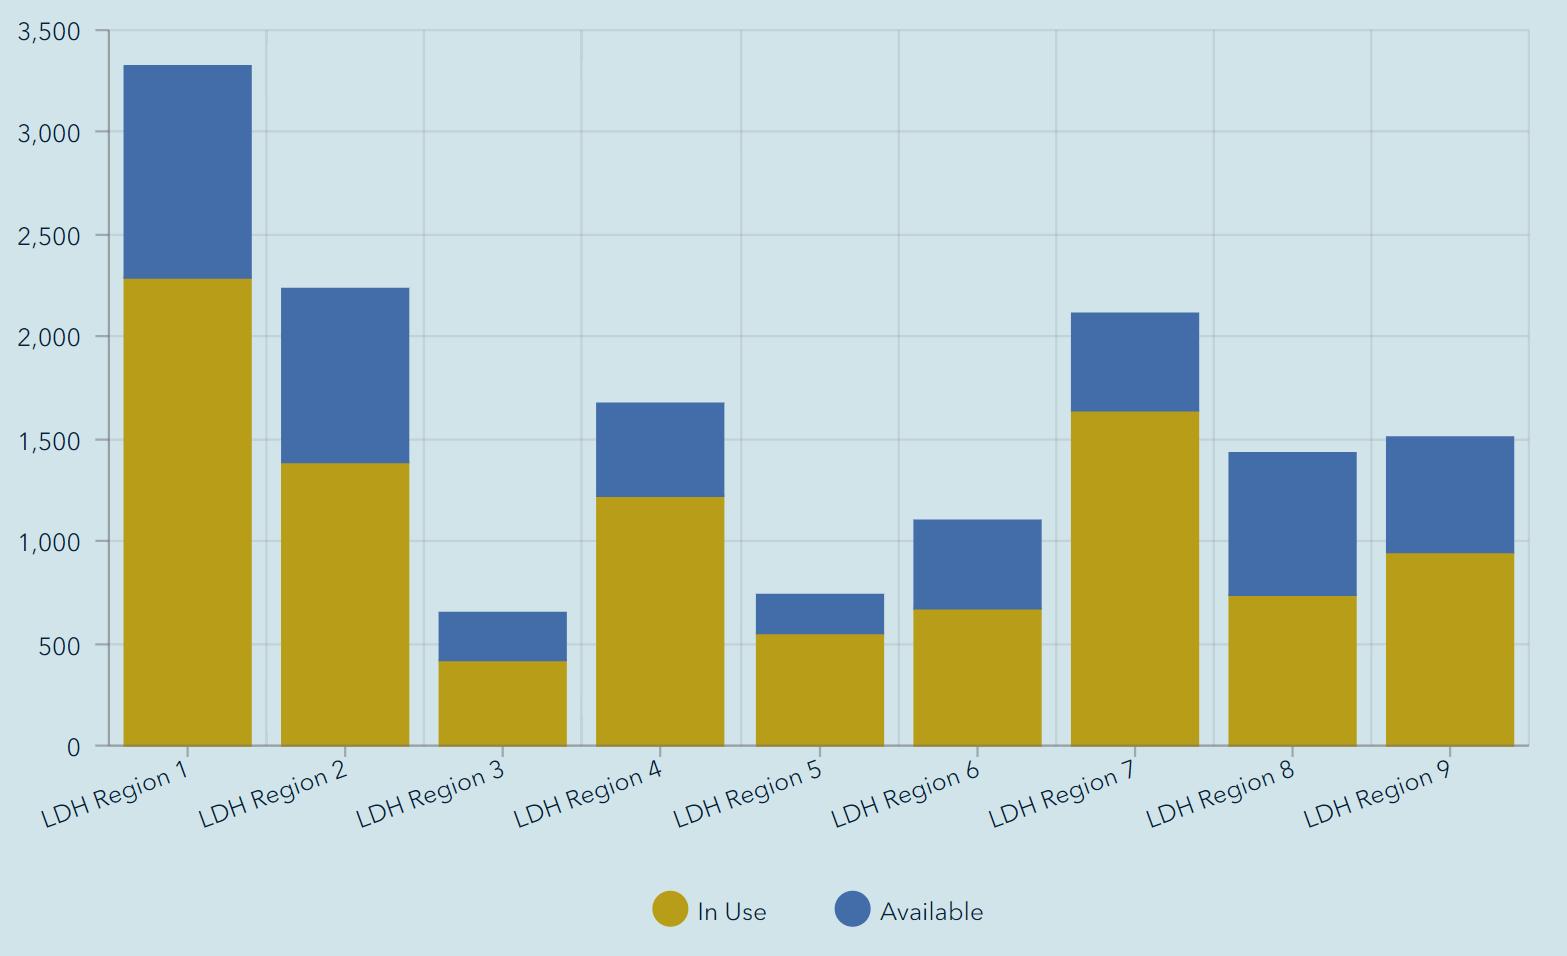
Source: Louisiana Office of Public Health, Region 6 (Central Louisiana), March 12, 2021.
:
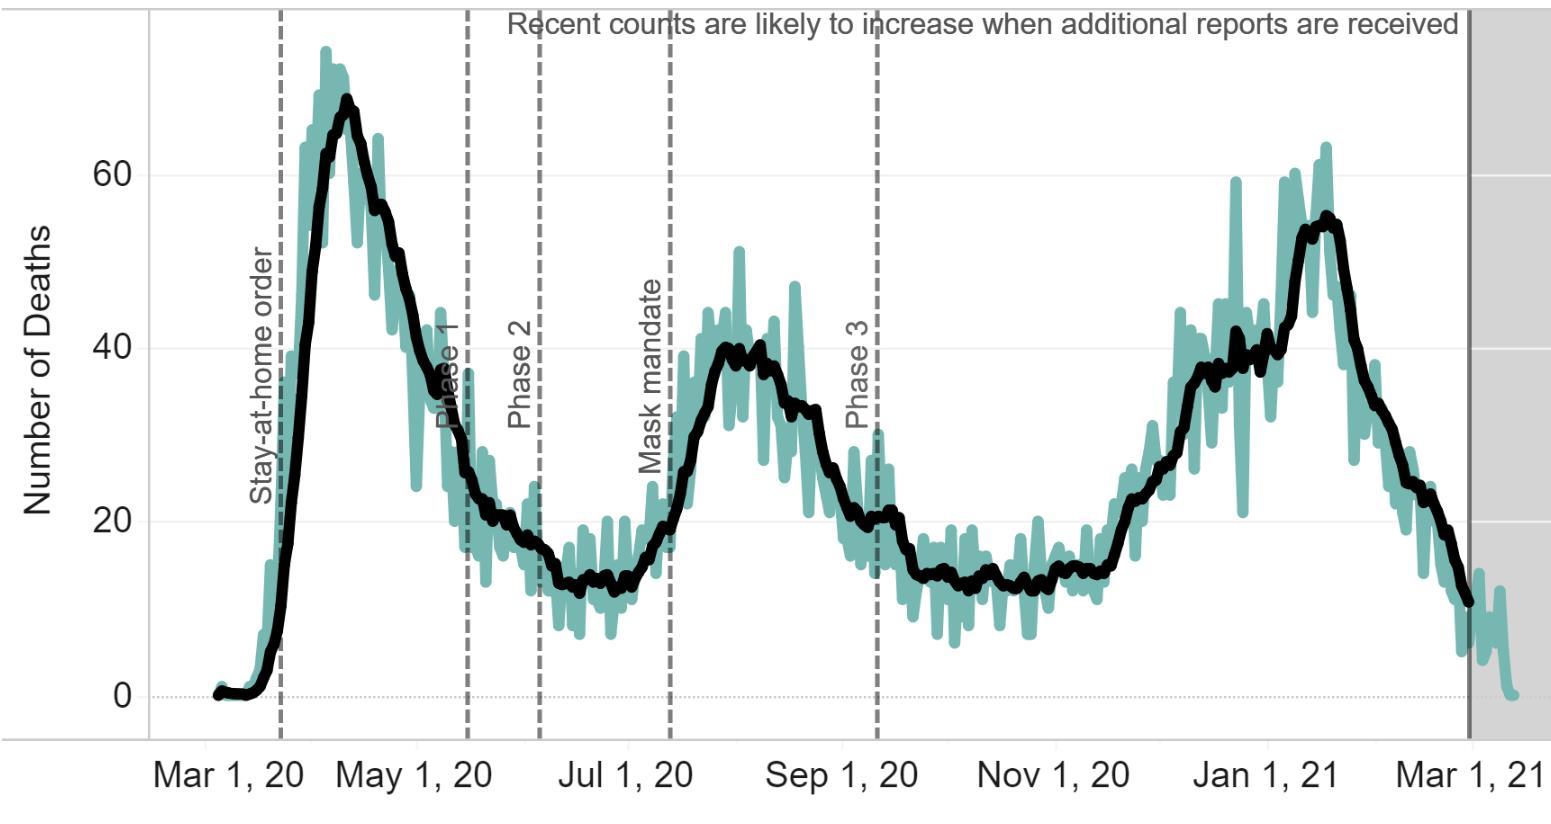
COVID-19DEATHSSTATEWIDEBYDATE
COVID-19 deaths by date of death statewide as of March 12, 2021.
Source: Louisiana Office of Public Health, Region 6 (Central Louisiana), March 12, 2021.
:
COVID-19DEATHSBYAGEGROUP
COVID-19 deaths statewide by age group as of March 12, 2021.
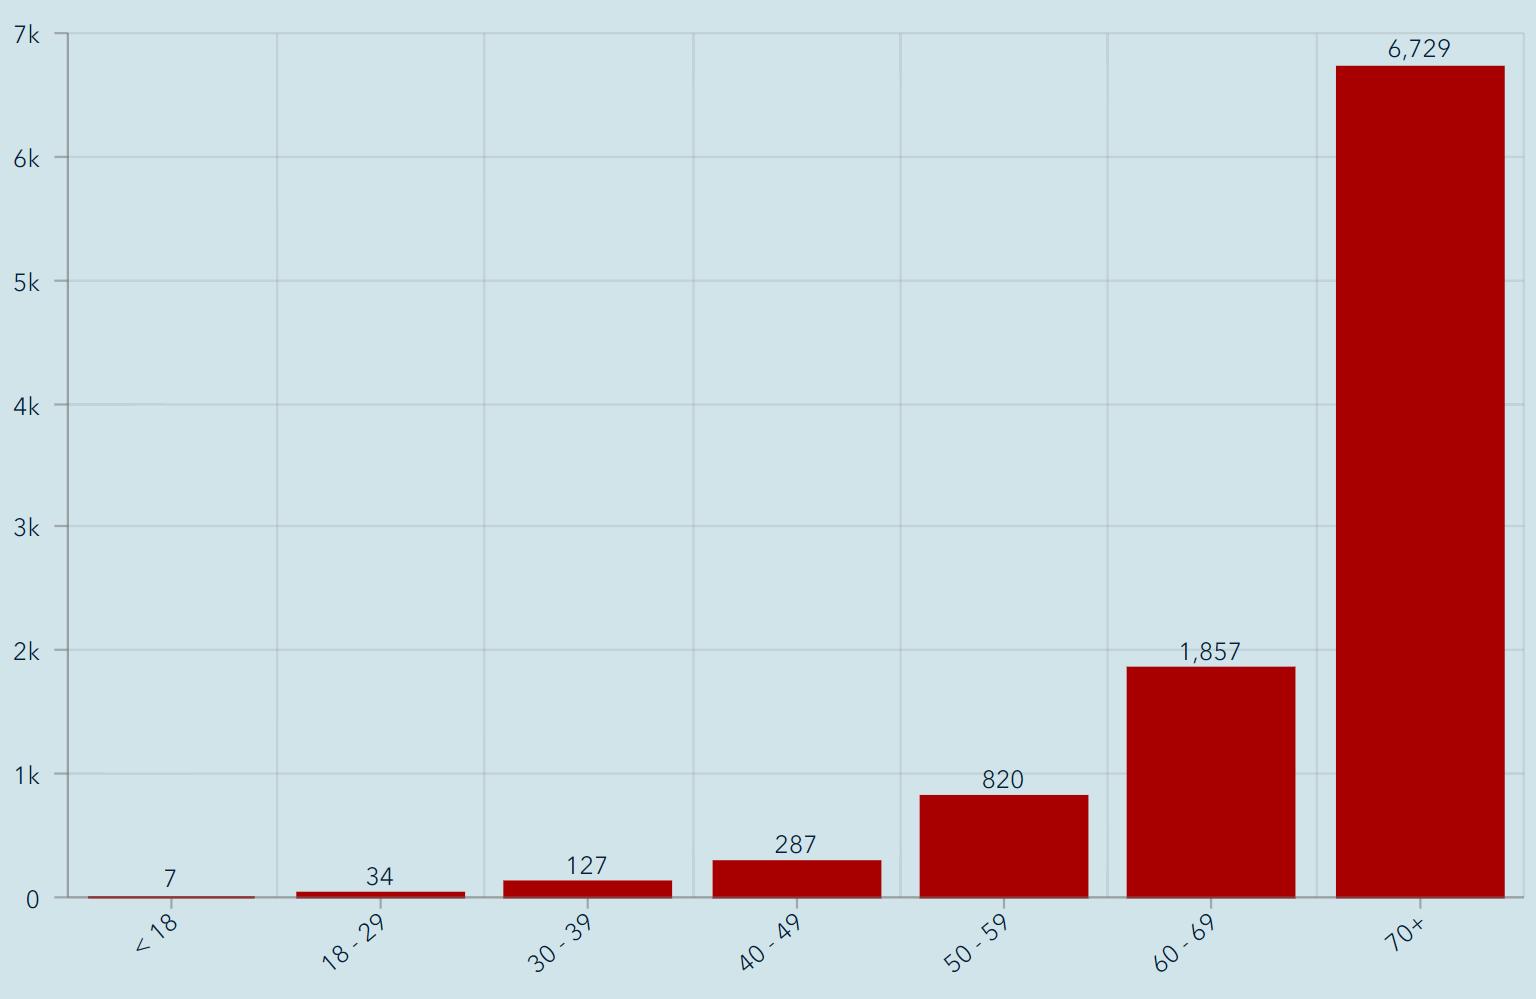
Source: Louisiana Office of Public Health, Region 6 (Central Louisiana), March 12, 2021.
:
EMPLOYMENT
UNEMPLOYMENTCLAIMSINLOUISIANA
Initial and continued unemployment claims in Louisiana from March 14, 2020 through February 27, 2021.


Statewide average weekly initial unemployment claims filed in February fell to 7,249 from 16,957 in January, a 57% decrease.
Statewide average weekly continued unemployment claims in February fell to 55,439 from 69,077 in January, a 20% decrease.
Source: Louisiana Workforce Commission, March 15, 2021
0 20,000 40,000 60,000 80,000 100,000 120,000 0 50,000 100,000 150,000 200,000 250,000 300,000 350,000 Initial Claims Continued Claims
Continued Initial
Unemployment Claims in Louisiana
UNEMPLOYMENTCLAIMSINCENLA
Initial and continued unemployment claims in central Louisiana from March 14, 2020 through January 30, 2021.

Average weekly initial unemployment claims in central Louisiana fell to 414 in February from 976 in January, a 58% decrease.
Average weekly continued unemployment claims in central Louisiana fell to 3,655 in February from 4,701 in January, a 22% decrease.
Source: Louisiana Workforce Commission, March 15, 2021
Unemployment Claims in CENLA
0 1,000 2,000 3,000 4,000 5,000 6,000 7,000 0 5,000 10,000 15,000 20,000 25,000 3/14/2020 3/28/2020 4/11/2020 4/25/2020 5/9/2020 5/23/2020 6/6/2020 6/20/2020 7/4/2020 7/18/2020 8/1/2020 8/15/2020 8/29/2020 9/12/2020 9/26/2020 10/10/2020 10/24/2020 11/7/2020 11/21/2020 12/5/2020 12/19/2020 1/2/2021 1/16/2021 1/30/2021 2/13/2021 2/27/2021 Initial Claims Continued Claims
Continued Initial
UNEMPLOYMENTRATEAMONGLAMETROS
The table below shows January 2021 preliminary unemployment rate, labor force, and employment data for Metropolitan Statistical Areas in Louisiana.
At 5.2%, the Alexandria MSA had the lowest unemployment rate among the state’s major metro areas for the ninth consecutive month, well below the state’s 7.6% rate. Louisiana’s unemployment rate fell 0.3% in January to 7.6% from 7.9% in December.
Data Source: Louisiana Workforce Commission, March 15, 2021.
Unemployment Rate Employment Change Jan-21 Dec-20 Jan-20 Since January 2020 Alexandria 5.2 5.1 5.6 -1,900 Baton Rouge 6.7 6.4 4.7 -19,400 Hammond 8.7 8.2 6 -1,000 Houma 6.7 6.3 4.9 -6,000 Lafayette 7.0 6.6 5.1 -17,800 Lake Charles 8.2 8.4 4.8 -20,800 Monroe 6.6 6.3 5.8 -3,800 New Orleans 9.1 8.7 4.7 -67,100 Shreveport 7.4 7.1 5.5 -15,300
TAXREVENUE
TAXREVENUEOVERVIEW
An overview of sales, vehicle sales, and hotel occupancy taxes collected in the February 2021 reflecting sales activity in January 2021.
Note: February tax revenue reflects sales activity in January. N/a = Not available
Data Source noted in detailed reports.
Sales Tax M/M Y/Y YTD Vehicle Sales Tax M/M Y/Y YTD Alexandria -27.0% 7.6% 8.9% Avoyelles -5.1% 14.8% 24.9% Avoyelles -24.9% 28.4% 18.7% Evangeline -0.8% 11.7% 18.5% Catahoula -13.9% 13.1% 15.8% Rapides -6.4% 9.5% 19.8% Concordia -27.5% 13.2% 22.3% St. Landry 10.4% -3.3% 0.9% Evangeline -19.6% 10.3% 15.2% La Salle -19.1% 10.7% 15.2% Hotel Occupancy Tax Pineville -17.0% 5.7% 11.3% Avoyelles -50.5% -63.5% -40.6% Rapides -24.2% 9.6% 12.9% Rapides -3.5% -31.4% -20.9% St. Landry -22.7% 16.9% 4.7% February 2021
RAPIDESPARISHTOWNS&CITIES


An overview of sales tax revenue in Rapides Parish other towns and cities in February 2021 (excluding Alexandria and Pineville).
Note: Current tax revenue reflects sales activity in prior month.
February Feb-20 Jan-21 Feb-21 % M/M % Y/Y %YTD Ball $58,292 $79,050 $73,013 -7.6% 25.3% 30.9% Boyce $25,530 $51,728 $40,084 -22.5% 57.0% 48.4% Cheneyville $2,328 $3,036 $2,187 -28.0% -6.1% -23.5% Glenmora $20,266 $26,352 $17,917 -32.0% -11.6% 7.7% Lecompte $24,503 $30,578 $20,730 -32.2% -15.4% 9.1% Woodworth $25,546 $49,232 $46,760 -5.0% 83.0% 58.9%
$40 $50 $60 $70 $80 $90 Jan Feb Mar Apr May Jun Jul Aug Sep Oct Nov Dec Thousands Ball 2019 2020 2021 $10 $20 $30 $40 $50 $60 Jan Feb Mar Apr May Jun Jul Aug Sep Oct Nov Dec Thousands Woodworth 2019 2020 2021
Data Source: Rapides Parish Police Jury Treasurer’s Reports.
ALEXANDRIASALESTAX


(TR) Alexandria total sales tax revenue for February with previous month, year, and YTD comparisons.
(BR) Alexandria total monthly sales tax revenue from 2019 to present.
Note: February sales tax revenue reflects sales activity in January.
Data Source: Rapides Parish Police Jury Treasurer’s Reports.
$$1 $2 $3 $4 $5 Millions Alexandria Sales Tax Revenue 2019-2021 2019 2020 2021
February -27%% Feb. YoY 7.6% Feb. YTD 8.9% February
2018 2019 2020 2021 February $ 3,061,380 $ 2,868,635 $ 3,079,930 $ 3,313,658 January $ 4,032,605 $ 4,140,983 $ 4,132,795 $ 4,542,155 % Chg over Prev Month -24.1% -30.7% -25.5% -27.0% % Chg over Prev Year -6.3% 7.4% 7.6% YTD (Jan - Dec) $ 7,093,985 $ 7,009,618 $ 7,212,725 $ 7,855,813 % Chg over Prev YTD -1.2% 2.9% 8.9%
AVOYELLESSALESTAX
Avoyelles Parish total sales tax revenue for February with previous month, year, and year-to-date comparisons. Vehicle and hotel tax revenues are excluded. Data Source: Avoyelles Parish School Board. March 2021.
Note: February sales tax revenue reflects sales activity in January.
February -24.9% Feb. YoY 28.4% Feb. YTD 18.7% February
2017 2018 2019 2020 2021 February $ 1,211,961 $ 1,113,435 $ 1,177,667 $ 1,212,841 $ 1,557,712 January $ 1,684,821 $ 1,761,723 $ 1,896,263 $ 1,847,251 $ 2,074,759 % Chg over Prev Month -28.1% -36.8% -37.9% -34.3% -24.9% % Chg over Prev Year -8.1% 5.8% 3.0% 28.4% YTD (Jan - Dec) $ 2,896,781 $ 2,875,157 $ 3,073,930 $ 3,060,093 $ 3,632,471 % Chg over Prev YTD -0.7% 6.9% -0.5% 18.7%
AVOYELLESVEHICLESALESTAX
Avoyelles Parish vehicle sales tax revenue for February with previous month, year, and year-to-date comparisons.
Note: February sales tax revenue reflects sales activity in January.
Data Source: Avoyelles Parish School Board. March 2021
February -5.1% Feb. YoY 14.8% Feb. YTD 24.9% February
2017 2018 2019 2020 2021 February $ 268,296 $ 236,976 $ 287,839 $ 287,866 $ 330,453 January $ 283,451 $ 229,782 $ 191,942 $ 255,336 $ 348,146 % Chg over Prev Month -5.3% 3.1% 50.0% 12.7% -5.1% % Chg over Prev Year -11.7% 21.5% 0.0% 14.8% YTD (Jan - Dec) $ 552,085 $ 466,758 $ 479,782 $ 543,203 $ 678,599 % Chg over Prev YTD -15.5% 2.8% 13.2% 24.9%
CATAHOULASALESTAX
Catahoula Parish total sales tax revenue for February with previous month, year, and year-todate comparisons.
Note: February sales tax revenue reflects sales activity in January.
Data Source: Catahoula Parish Tax Administrator March 2021
February -13.9% Feb.
13.1% Feb.
15.8% February
YoY
YTD
2018 2019 2020 2021 February $ 431,138 $ 424,857 $ 460,357 $ 520,518 January $ 523,082 $ 514,971 $ 511,212 $ 604,484 % Chg over Prev Month -17.6% -17.5% -9.9% -13.9% % Chg over Prev Year -1.5% 8.4% 13.1% YTD (Jan - Dec) $ 954,220 $ 939,828 $ 971,569 $ 1,125,002 % Chg over Prev YTD -1.5% 3.4% 15.8%
CONCORDIASALESTAX
Concordia Parish total sales tax revenue for February with previous month, year, and year-to-date comparisons.
Note: February sales tax revenue reflects sales activity in January.
Data Source: Concordia Parish Tax Administrator. March 2021
February -27.5% Feb. YoY 13.2% Feb. YTD 22.3% February
2018 2019 2020 2021 February $ 824,230 $ 894,512 $ 936,784 $ 1,060,357 January $ 1,084,657 $ 1,305,652 $ 1,125,374 $ 1,462,464 % Chg over Prev Month -24.0% -31.5% -16.8% -27.5% % Chg over Prev Year 8.5% 4.7% 13.2% YTD (Jan - Dec) $ 1,908,887 $ 2,200,164 $ 2,062,158 $ 2,522,821 % Chg over Prev YTD 15.3% -6.3% 22.3%
EVANGELINESALESTAX
Evangeline Parish total sales tax revenue for February with previous month, year and YTD comparisons.
Note: February sales tax revenue reflects sales activity in January.
Data Source: Evangeline Parish Sales Tax Commissioner. March 2021
February -19.6% Feb YoY 10.3% Feb YTD 15.2% February
2017 2018 2019 2020 2021 February $ 1,386,858 $ 1,297,401 $ 1,421,713 $ 1,457,691 $ 1,608,232 January $ 1,790,457 $ 1,733,668 $ 1,684,820 $ 1,674,965 $ 2,001,054 % Chg over Prev Month -22.5% -25.2% -15.6% -13.0% -19.6% % Chg over Prev Year -6.5% 9.6% 2.5% 10.3% YTD (Jan - Dec) $ 3,177,315 $ 3,031,069 $ 3,106,533 $ 3,132,656 $ 3,609,286 % Chg over Prev YTD -4.6% 2.5% 0.8% 15.2%
EVANGELINEVEHICLESALESTAX
Evangeline Parish vehicle sales tax revenue for February with previous month, year and YTD comparisons.
Note: February sales tax revenue reflects sales activity in January.
Data Source: Evangeline Parish Sales Tax Commissioner. March 2021
February -0.8% Feb,
11.7% Feb.
18.5% February
YoY
YTD
2017 2018 2019 2020 2021 February $ 290,233 $ 272,076 $ 347,675 $ 320,877 $ 358,527 January $ 289,407 $ 259,767 $ 292,397 $ 286,825 $ 361,503 % Chg over Prev Month 0.3% 4.7% 18.9% 11.9% -0.8% % Chg over Prev Year -6.3% 27.8% -7.7% 11.7% YTD (Jan - Dec) $ 579,640 $ 531,843 $ 640,072 $ 607,702 $ 720,030 % Chg over Prev YTD -8.2% 20.3% -5.1% 18.5%
LASALLESALESTAX
La Salle Parish total sales tax revenue for February with previous month, year, and year-todate comparisons.
Note: February sales tax revenue reflects sales activity in January.
Data Source: La Salle Parish Tax Administrator March 2021
February -19.1% Feb. YoY 10.7% Feb. YTD 15.2% February
2018 2019 2020 2021 February $ 604,999 $ 783,427 $ 814,504 $ 901,836 January $ 823,918 $ 1,239,753 $ 936,466 $ 1,115,428 % Chg over Prev Month -26.6% -36.8% -13.0% -19.1% % Chg over Prev Year 29.5% 4.0% 10.7% YTD (Jan - Dec) $ 1,428,917 $ 2,023,180 $ 1,750,971 $ 2,017,264 % Chg over Prev YTD 41.6% -13.5% 15.2%
PINEVILLESALESTAX

(TR) Pineville sales tax revenue for February with previous month, year, and YTD comparisons.
(BR) Pineville monthly sales tax revenue from 2019 to present.
Note: Current sales tax revenue reflects sales activity in the prior month.
Data Source: Rapides Parish Police
Reports. February -17.0% Feb. YoY 5.7% Feb. YTD 11.3% 2018 2019 2020 2021 February $ 819,413 $ 796,423 $ 1,004,243 $ 1,061,220 January $ 1,012,295 $ 1,026,165 $ 1,098,450 $ 1,278,518 % Chg over Prev Month -19.1% -22.4% -8.6% -17.0% % Chg over Prev Year -2.8% 26.1% 5.7% YTD (Jan - Dec) $ 1,831,708 $ 1,822,588 $ 2,102,693 $ 2,339,738 % Chg over Prev YTD -0.5% 15.4% 11.3% February
Jury Treasurer’s
0.6 0.7 0.8 0.9 1.0 1.1 1.2 1.3 1.4 Millions Pineville Sales Tax Revenue 2019-2021 2019 2020 2021
RAPIDESOCCUPATIONALLICENSES
Rapides Parish occupational license revenue YTD with previous YTD comparisons.
Note: February YTD occupational license revenue reflects licenses issued YTD in January. Rapides reflects unincorporated areas.
Data Source: Rapides Parish Police Jury Treasurer’s Reports.
Rapides (rural) -12.6% Alexandria -25.3% Pineville -24.4% February Year-to-Date Other -7.6% Total -22.3% 2018 2019 2020 2021 Parish $ 260,124 $ 292,920 $ 297,307 $ 259,910 % Chg over Prev YTD 12.6% 1.5% -12.6% Alexandria $ 972,753 $ 1,098,911 $ 1,049,381 $ 783,412 % Chg over Prev YTD 13.0% -4.5% -25.3% Pineville $ 172,510 $ 251,960 $ 265,616 $ 200,712 % Chg over Prev YTD 46.1% 5.4% -24.4% Other $ 52,057 $ 66,376 $ 58,937 $ 54,440 % Chg over Prev YTD 27.5% -11.2% -7.6% Total $ 1,457,444 $ 1,710,167 $ 1,671,241 $ 1,298,474 % Chg over Prev YTD 17.3% -2.3% -22.3%
RAPIDESSALESTAX
(TR) Rapides Parish sales tax revenue for February with previous month, year, and YTD comparisons.
(BR) Rapides monthly sales tax revenue from 2019 to present.
Note: Current sales tax revenue reflects sales activity in the prior month.
$9 $10 $11 $12 $13 $14 $15 $16 $17 Millions Rapides Parish Total Sales Tax Revenue 2019 - 2021 2019 2020 2021
Data Source: Rapides Parish Police Jury
Reports. February -24.2% Feb. YoY 9.6% Feb. YTD 12.9% 2018 2019 2020 2021 February $ 9,777,757 $ 9,878,422 $ 11,163,593 $ 12,235,503 January $ 13,343,467 $ 13,858,944 $ 13,981,762 $ 16,147,576 % Chg over Prev Month -26.7% -28.7% -20.2% -24.2% % Chg over Prev Year 1.0% 13.0% 9.6% YTD (Jan - Dec) $ 23,121,224 $ 23,737,366 $ 25,145,355 $ 28,383,079 % Chg over Prev YTD 2.7% 5.9% 12.9% February
Treasurer’s
RAPIDESVEHICLESALESTAX
Rapides Parish vehicle sales tax revenue for February with previous month, year, and YTD comparisons.
*Note: January vehicle sales tax revenue reflects sales activity in December. November sales activity in 2019 and 2020 are included in December tax revenues and thus December activity is assumed to be half of the November-December total, which was collected in January 2021.
Data Source: Tax revenue data from Rapides Parish Police Jury Treasurer’s Reports.
February -6.4% Feb. YoY 9.5% Feb. YTD 19.8% February
2018 2019 2020* 2021* February $ 1,010,781 $ 1,142,474 $ 1,171,176 $ 1,282,207 January $ 991,523 $ 874,305 $ 1,042,217 $ 1,369,214 % Chg over Prev Month 1.9% 30.7% 12.4% -6.4% % Chg over Prev Year 13.0% 2.5% 9.5% YTD (Jan - Dec) $ 2,002,305 $ 2,016,780 $ 2,213,393 $ 2,651,422 % Chg over Prev YTD 0.7% 9.7% 19.8%
ST.LANDRYSALESTAX
St. Landry Parish sales tax revenue for February with previous month, year, and YTD comparisons.
Note: January sales tax revenue reflects sales activity in December.
Data Source: Tax revenue data from St. Landry Parish School Board. March 2021
February -22.7% Feb. YoY 16.9% Feb. YTD 4.7% February
2018 2019 2020 2021 February $ 4,724,384 $ 5,191,009 $ 5,224,951 $ 6,107,045 January $ 6,556,004 $ 7,019,121 $ 8,146,901 $ 7,895,905 % Chg over Prev Month -27.9% -26.0% -35.9% -22.7% % Chg over Prev Year 9.9% 0.7% 16.9% YTD (Jan - Dec) $11,280,388 $12,210,130 $13,371,852 $14,002,950 % Chg over Prev YTD 8.2% 9.5% 4.7%
ST.LANDRYVEHICLESALESTAX
St. Landry Parish vehicle sales tax revenue for February with previous month, year, and YTD comparisons.
Note: February sales tax revenue reflects sales activity in January.
Data Source: Tax revenue data from St. Landry Parish School Board. March 2021
February 10.4% Feb. YoY -3.3% Feb. YTD 0.9% February
2018 2019 2020 2021 February $ 879,480 $ 815,297 $ 983,889 $ 951,000 January $ 730,772 $ 676,376 $ 812,912 $ 861,140 % Chg over Prev Month 20.3% 20.5% 21.0% 10.4% % Chg over Prev Year -7.3% 20.7% -3.3% YTD (Jan - Dec) $ 1,610,252 $ 1,491,673 $ 1,796,801 $ 1,812,140 % Chg over Prev YTD -7.4% 20.5% 0.9%
BUILDINGPERMITS
ALLENPARISHPERMITVALUATIONS
This chart shows the valuation of permits issued by Rapides Area Planning Commission in Allen Parish in February between 2018-2021 with monthto-month, year-to-year, and year-to-date comparisons.
Data Source: RapidesArea Planning Commission, March, 2021
February 209% Feb. YoY 766% Feb. YTD 373% February 2018 2019 2020 2021 February $ 479,500 $ - $ 250,000 $2,164,000 January $ 566,170 $ 728,000 $ 355,919 $ 699,250 % Chg Prev Month -15% -30% 209% % Chg from Prev Year 766% YTD (Jan - Dec) $1,045,670 $ 728,000 $ 605,919 $2,863,250 % Chg over Prev YTD -30% -17% 373%
AVOYELLESPARISHPERMITVALUATIONS
This chart shows the valuation of permits issued by Rapides Area Planning Commission in Avoyelles Parish in February between 2019-2021 with month-to-month, year-to-year, and year-to-date comparisons.
Data Source: RapidesArea Planning Commission, March 2021.
February -81% Feb. YoY -22% Feb. YTD 1902% February 2019 2020 2021 February $ 2,991,003 $ 2,656,118 $ 2,078,210 January $ 2,645,648 $ 355,919 $ 11,066,424 % Chg Prev Month 13% 646% -81% % Chg from Prev Year -11% -22% YTD (Jan - Dec) $ 5,636,651 $ 656,673 $ 13,144,634 % Chg over Prev YTD -88% 1902%
EVANGELINEPARISHPERMITVALUATIONS
This chart shows the valuation of permits issued by Rapides Area Planning Commission in Evangeline Parish in February between 2018-2021 with month-tomonth, year-to-year, and year-to-date comparisons.
Data Source: RapidesArea Planning Commission, March 2021.
February 380% Feb. YoY 335% Feb. YTD 148% February 2018 2019 2020 2021 February $ 1,601,409 $ 743,170 $ 310,000 $ 1,348,110 January $ 640,500 $ 255,000 $ 346,673 $ 281,005 % Chg Prev Month 150% 191% -11% 380% % Chg from Prev Year -54% -58% 335% YTD (Jan - Dec) $ 2,241,909 $ 998,170 $ 656,673 $ 1,629,115 % Chg over Prev YTD -55% -34% 148%
PINEVILLEPERMITVALUATIONS
This chart shows the valuation of permits issued by Rapides Area Planning Commission in the City of Pineville in February between 2018-2021 with month-to-month, year-to-year, and year-to-date comparisons.
Data Source: RapidesArea Planning Commission, March 2021.
February 185% Feb. YoY -56% Feb. YTD -71% February 2018 2019 2020 2021 February $ 648,036 $1,192,034 $ 1,224,755 $ 534,875 January $ 273,330 $1,253,600 $ 1,297,500 $ 187,560 % Chg Prev Month 137% -5% -6% 185% % Chg from Prev Year 84% 3% -56% YTD (Jan - Dec) $ 921,366 $2,445,634 $ 2,522,255 $ 722,435 % Chg over Prev YTD 165% 3% -71%
RAPIDESPARISHPERMITVALUATIONS
This charts shows the valuation of permits issued by Rapides Area Planning Commission in Rapides Parish (excluding Alexandria) in February between 2018-2021 with month-to-month, year-to-year, and year-to-date comparisons.
Data Source: RapidesArea Planning Commission, March 2021.
February -98% Feb. YoY 73% Feb. YTD 2965% February 2018 2019 2020 2021 February $ 1,296,292 $ 743,170 $ 2,656,118 $ 4,595,002 January $ 2,675,661 $ 3,246,119 $ 2,468,233 $195,523,179 % Chg Prev Month -52% -77% 8% -98% % Chg from Prev Year -43% 257% 73% YTD (Jan - Dec) $ 3,971,953 $36,175,822 $ 6,528,866 $200,118,181 % Chg over Prev YTD 811% -82% 2965%
RESIDENTIALCONSTRUCTIONPERMITSBYAREA
New residential construction permit valuation (estimated development cost) issued by Rapides Area Planning Commission by jurisdiction in February 2021 compared to February 2020.
Valuation of New Residential Construction
February 2020 vs February 2021
Note: City ofAlexandria permits are accounted for separately.
Data Source: RapidesArea Planning Commission, March 2021.
Year-over-year value of residential construction in the RAPC jurisdiction. 351% Feb-20 Feb-21 Change % Change Allen $ 250,000 $ 2,164,000 $ 1,914,000 766% Avoyelles $ 60,000 $ 527,000 $ 467,000 778% Pineville $ 672,000 $ 500,000 $ (172,000) -26% Evangeline $ 280,000 $ 1,081,920 $ 801,920 286% LaSalle $ - $ 475,000 $ 475,000 Rapides $ 585,000 $ 3,589,960 $ 3,004,960 514%
ALEXANDRIACOMMERCIALPERMITS
The valuation (estimated development cost) of new commercial construction permits issued by the City of Alexandria in February 2021 with previous month, year, and YTD comparisons.
Data Source: City ofAlexandria Planning Division. March 2021 February 310% Feb. YoY 631% Feb. YTD 322% February 2018 2019 2020 2021 February $ 527,100 $ 4,694,401 $ 1,163,472 $ 8,499,638 January $ 1,585,773 $ 1,402,884 $ 1,340,555 $ 2,072,746 % Chg over Prev Month 235% -13% 310% % Chg over Prev Year 791% -75% 631% YTD (Jan - Dec) $ 2,112,873 $ 6,097,285 $ 2,504,027 $ 10,572,384 % Chg over Prev YTD 189% -59% 322%
ALEXANDRIARESIDENTIALPERMITS
The valuation (estimated development cost) of new residential construction permits issued by the City of Alexandria in February 2021 with previous month, year, and YTD comparisons.
Data Source: City ofAlexandria Planning Division. March, 2021 February 24.6% Feb. YoY 89.3% Feb. YTD 51.9% February 2018 2019 2020 2021 February $ 2,281,705 $ 1,857,830 $ 969,361 $ 1,834,964 January $ 2,185,004 $ 1,402,884 $ 1,207,410 $ 1,472,183 % Chg over Prev Month 4.4% 32.4% -19.7% 24.6% % Chg over Prev Year -18.6% -47.8% 89.3% YTD (Jan - Dec) $ 4,466,709 $ 3,260,714 $ 2,176,771 $ 3,307,147 % Chg over Prev YTD -27.0% -33.2% 51.9%
HOUSING
ALEXANDRIAACTIVELISTINGS

The count of active single-family and condo/townhome listings for Alexandria MSA (excludes pending listings) for February 2018-2021 with month-to-month and year-over-year comparisons.
Active listings decreased 60% since February 2020.
Data Source: Realtor.com. Retrieved from FRED, Federal Reserve Bank of St. Louis. March 10, 2021 February -11.7% Feb YoY -60.4% 2018 2019 2020 2021 February 468 470 475 188 January 458 467 459 213 % Chg Prev Month 2.2% 0.6% 3.5% -11.7% % Chg from Prev Year 0.4% 1.1% -60.4% February
150 250 350 450 550 650 2016-07-01 2017-02-01 2017-09-01 2018-04-01 2018-11-01 2019-06-01 2020-01-01 2020-08-01 Active Listings Count in Alexandria July 2016 - February 2021
ALEXANDRIAPENDINGLISTINGS
The count of pending single-family and condo/townhome listings for Alexandria MSA for February 2018-2021 with month-tomonth and year-over-year comparisons.
Pending Listing Count in Alexandria July 2016 - February 2021

Pending listings increased 316% over February 2020, from 49 to 204.
Data Source: Realtor.com. Retrieved from FRED, Federal Reserve Bank of St. Louis. March 10, 2021 February 12.7% Feb YoY 316% 2018 2019 2020 2021 February 126 138 49 204 January 105 127 71 181 % Chg Prev Month 20.0% 8.7% -31.0% 12.7% % Chg from Prev Year 9.5% -64.5% 316.3% February
0 50 100 150 200 250 300 2016-07-01 2017-07-01 2018-07-01 2019-07-01 2020-07-01
ALEXANDRIAMEDIANDAYSONMARKET

The median number of days property listings spend on the market in Alexandria MSA for February 2018-2021 with month-to-month and year-over-year comparisons.
Data Source: Realtor.com. Retrieved from FRED, Federal Reserve Bank of St. Louis. March 10, 2021 February 0.0% Feb YoY 1.1% 2018 2019 2020 2021 February 99 105 93 94 January 95 108 96 94 % Chg Prev Month 4.2% -2.3% -2.6% 0.0% % Chg from Prev Year 6.6% -11.4% 1.1% February
50 60 70 80 90 100 110 120 2016-07-01 2017-07-01 2018-07-01 2019-07-01 2020-07-01 Median Days on Market in Alexandria July 2016 - February 2021
Median days on the market increased 1.1% over February 2020.
ALEXANDRIAMEDIANLISTINGPRICE

The median listing price of houses in Alexandria MSA for February 2018-2021 with month-to-month and year-over-year comparisons.
The median listing price increased 12.4% since February 2020 from $184,550 to $207,500, but fell 1.2% since last month.
Data Source: Realtor.com. Retrieved from FRED, Federal Reserve Bank of St. Louis. March 10, 2021. February -1.2% Feb YoY 12.4% 2018 2019 2020 2021 February $ 189,950 $ 183,250 $ 184,550 $ 207,500 January $ 187,050 $ 179,550 $ 179,950 $ 210,050 % Chg Prev Month 1.6% 2.1% 2.6% -1.2% % Chg from Prev Year -3.5% 0.7% 12.4% February
$170,000 $180,000 $190,000 $200,000 $210,000 $220,000 $230,000 $240,000 2016-07-01 2017-07-01 2018-07-01 2019-07-01 2020-07-01 Median Listing Price in Alexandria July 2016 - February 2021
ALEXANDRIAAVERAGELISTINGPRICE

The average listing price of houses in Alexandria MSA for February 2018-2021 with month-to-month and year-over-year comparisons.
The average listing price increased 25% since February 2020 from $216,432 to $270,473, and +1.0% since last month.
Data Source: Realtor.com. Retrieved from FRED, Federal Reserve Bank of St. Louis. March 10, 2021. February 1.0% Feb YoY 25.0% 2018 2019 2020 2021 February $ 237,917 $ 224,055 $ 216,432 $ 270,473 January $ 234,620 $ 225,096 $ 217,927 $ 267,908 % Chg Prev Month 1.4% -0.5% -0.7% 1.0% % Chg from Prev Year -5.8% -3.4% 25.0% February
$200,000 $210,000 $220,000 $230,000 $240,000 $250,000 $260,000 $270,000 $280,000 $290,000 2016-07-01 2017-07-01 2018-07-01 2019-07-01 2020-07-01 Average Listing Price in Alexandria July 2016 - February 2021
MORTGAGEDELINQUENCIESINLOUISIANA


This chart represents non-current mortgages (delinquencies) in Louisiana and the U.S. during 2020 and 2021.
Non-Current Mortgages in Louisiana 2020-2021
Delinquency Rate in January
U.S. 6.2% LA 9.9%
Louisiana’s non-current mortgage delinquency rate dropped 1.9% percentage points in January from its pandemic high of 11.8% in May.
Nationally, mortgage delinquencies increased in January 2021 to 6.2%, the first increase in eight months.
Data Source: Mortgage Monitor Reports October 2019 – October 2020, Black Knight Financial Technology Solutions, March 10, 2021.
7.2% 7.2% 7.5% 10.9% 11.8% 11.7% 10.8% 11.3% 11.2% 11.0% 10.7% 10.3% 9.9% 3.2% 3.3% 3.4% 6.5% 7.8% 7.6% 6.9% 6.9% 6.7% 6.4% 6.3% 6.1% 6.2% 0% 2% 4% 6% 8% 10% 12% 14% January-20 March-20 May-20 July-20 September-20 November-20 January-21
Louisiana U.S.
TRAVEL
AVOYELLESHOTELOCCUPANCYTAX
Avoyelles Parish hotel occupancy tax revenue for February with previous month, year, and year-to-date comparisons.
Note: February tax revenue reflects hotel occupancy activity in January. Hotel occupancy tax revenue is used as a proxy for hotel occupancy rate.
Data Source: Avoyelles Parish School Board. March 2021.
February -50.5% Feb. YoY -63.5% Feb. YTD -40.6% February 2017 2018 2019 2020 2021 February $ 9,660 $ 6,684 $ 6,704 $ 9,093 $ 3,319 January $ 10,381 $ 7,894 $ 8,274 $ 7,801 $ 6,711 % Chg over Prev Month -6.9% -15.3% -19.0% 16.6% -50.5% % Chg over Prev Year -30.8% 0.3% 35.6% -63.5% YTD (Jan - Dec) $ 20,041 $ 14,578 $ 14,978 $ 16,893 $ 10,030 % Chg over Prev YTD -27.3% 2.7% 12.8% -40.6%
RAPIDESHOTELOCCUPANCYTAX
Rapides Parish hotel occupancy tax revenue for February 2020 with previous month, year, and YTD comparisons.
Note: February tax revenue reflects hotel occupancy activity in January. Hotel occupancy tax revenue is used as a proxy for hotel occupancy rate.
Data Source: Rapides Parish Police Jury Treasurer’s Reports, March 2021.
0 50 100 150 200 250 300 Thousands Hotel Occupancy Tax Revenue 2019-2021 2019 2020 2021
February -3.5% Feb. YoY -31.4% Feb. YTD -20.9% 2018 2019 2020 2021 February $ 164,117 $ 170,915 $ 176,249 $ 120,971 January $ 92,719 $ 114,162 $ 135,281 $ 125,361 % Chg over Prev Month 77.0% 49.7% 30.3% -3.5% % Chg over Prev Year 4.1% 3.1% -31.4% YTD (Jan - Dec) $ 256,836 $ 285,077 $ 311,530 $ 246,332 % Chg over Prev YTD 11.0% 9.3% -20.9% February
PASSENGERTRAFFICATLOUISIANAAIRPORTS
This chart shows total passenger throughput at Louisiana airports and nationwide in February 2021 as a percent of traffic a year ago. AEX is the solid black line. Data
Passenger Throughput as a Percent a Year Ago in Louisiana (February 2021)

Source: Alexandria International
March 14,
Airport % of 2020 Traffic US 37% AEX 54% MSY 34% BTR 42% LCH 57% LFT 52% MLU 42% SHV 39% 0% 20% 40% 60% 80% 100% 120% 140% 160% 180% 200% 2/1/2021 2/2/2021 2/3/2021 2/4/2021 2/5/2021 2/6/2021 2/7/2021 2/8/2021 2/9/2021 2/10/2021 2/11/2021 2/12/2021 2/13/2021 2/14/2021 2/15/2021 2/16/2021 2/17/2021 2/18/2021 2/19/2021 2/20/2021 2/21/2021 2/22/2021 2/23/2021 2/24/2021 2/25/2021 2/26/2021 2/27/2021 2/28/2021
Airport,
2021
US AEX MSY MSY BTR LFT MLU
AIRTRAVELERSTATS

Nationwide air passenger traffic in February 2021 was 40% of last year’s level, compared to 38% in January.
Percentage of daily passenger throughput compared to previous year has increased every month since April 2020.
Nationwide daily percentage of passengers passing through current TSA checkpoints expressed as a percentage of previous year’s traffic. Data Source:
TSA Airport Total Traveler Throughput as a Percent of Previous Year
12,
DHS, Transportation Security Administration, https://www.tsa.gov/coronavirus/passenger-throughput, March
2021
0% 20% 40% 60% 80% 100% 120% 3/1/2020 4/1/2020 5/1/2020 6/1/2020 7/1/2020 8/1/2020 9/1/2020 10/1/2020 11/1/2020 12/1/2020 1/1/2021 2/1/2021 Passengers
LOCAL& LOUISIANA
NEWBUSINESSESINRAPIDES
The chart below represents the number of new businesses established each month in Rapides from January 2019 through February 2021.


The number of new businesses established in Rapides in February 2021 was the same as a year ago, but was 30% lower than in February 2019.
Data Source: Rapides Parish Sales and Use Tax Department, March 2, 2021.
0 5 10 15 20 25 30 35 40 45 50 Jan Feb Mar Apr May Jun Jul Aug Sep Oct Nov Dec New Businesses in Rapides 2019-2021 2019 2020 2021
BUSINESSESLIFEINRAPIDES
The chart below represents the length of operations of 294 businesses in Rapides that closed between January 2018 and January 2021.
Length of Business Operations
Rapides Parish
According to the graph, 31% of new businesses had a life of less than 2 years, 40% less than 3 years, and 52% less than 5 years.
Note: The data does not reflect changes in ownership of a continuing business.
Data Source: Rapides Parish Sales and Use Tax Department, March 2, 2021.
Jan 2018 - Jan 2021 (N=294)
17% 31% 40% 46% 52% 56% 61%63% 68%69% 72%73%74%77%78% 81%82%84% 87%
0.0% 10.0% 20.0% 30.0% 40.0% 50.0% 60.0% 70.0% 80.0% 90.0% 100.0% 0 1 2 3 4 5 6 7 8 9 10 11 12 13 14 15 16 17 18 19 20 21 22 23 24 25 26 27 28 29 30 31 32 33 34 35 36 Years in Operation
91%92%92%94%96%97%97%97%97%97%97%98%98%98%98%99%99%100%
CONSUMERSPENDINGINLOUISIANA
These graphs represents the percent change in average consumer credit and debit card spending in Louisiana as of February 28, 2021 with January 2020 as the baseline.
• Total consumer spending on Feb. 28, 2021 in Louisiana is up 6.4% compared to January 2020, with retail spending up 28% whileentertainment and recreation spending is down 40%. Grocery spending was up 19.1%, health care up 9.4%, and restaurants down-4.5%.
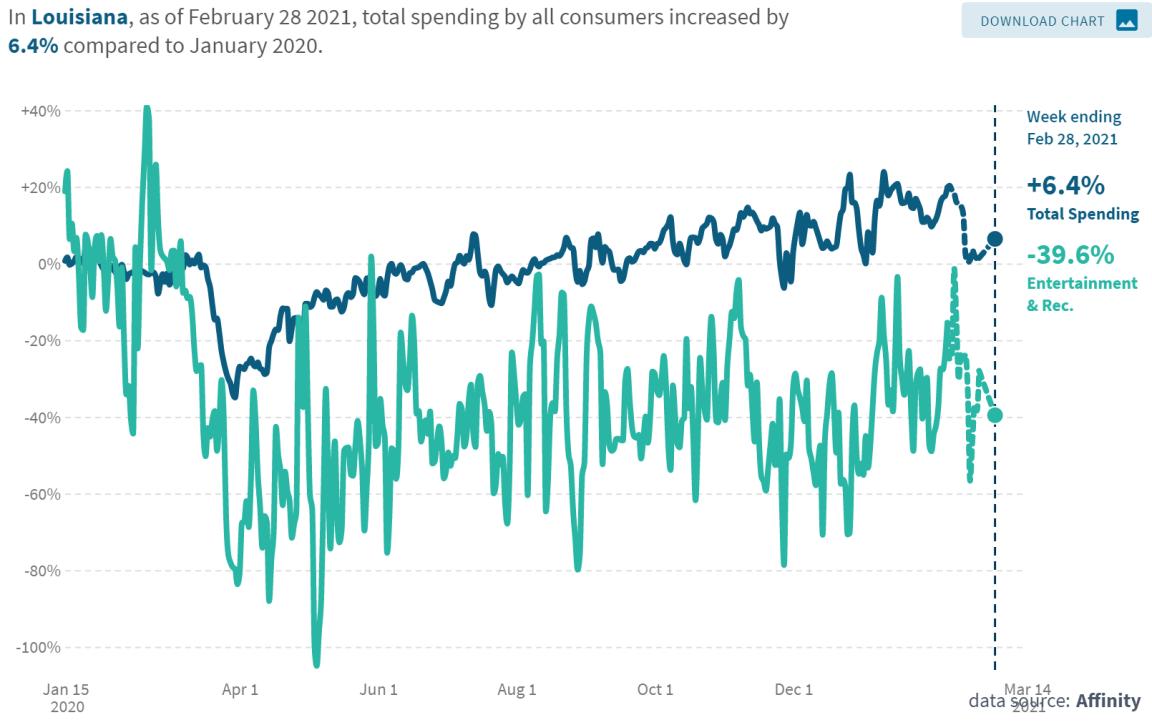
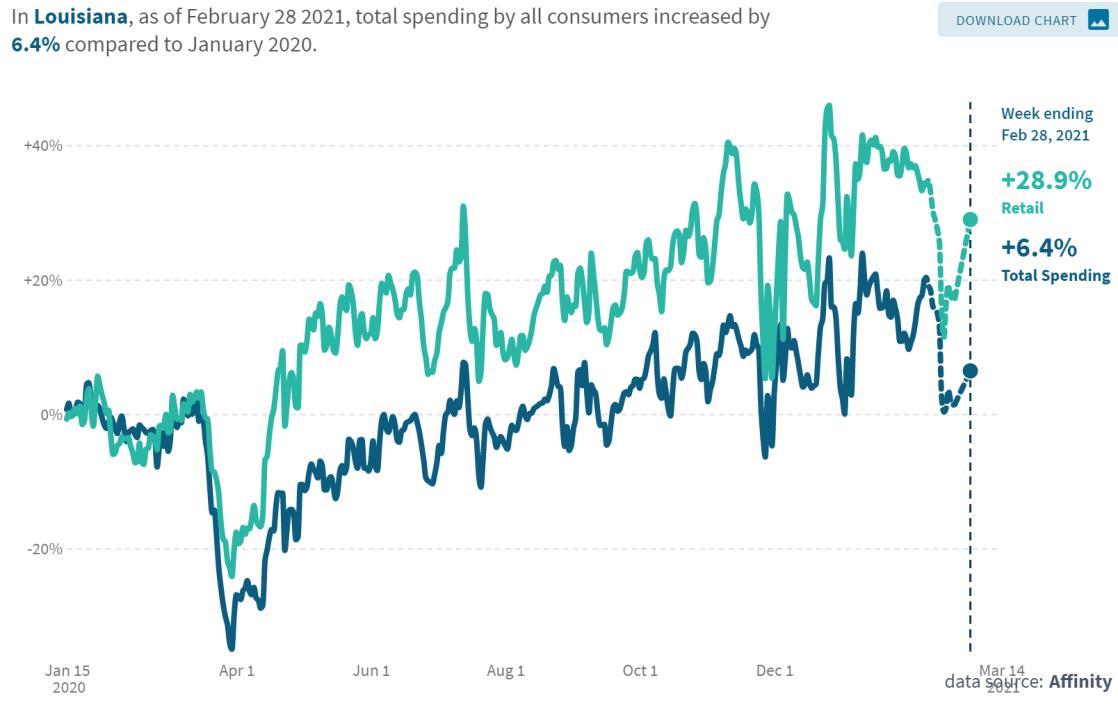
Data Source: Opportunity Insights Economic Tracker, https://www.tracktherecovery.org/. Data Source: Affinity Solutions. Retrieved March 14, 2021
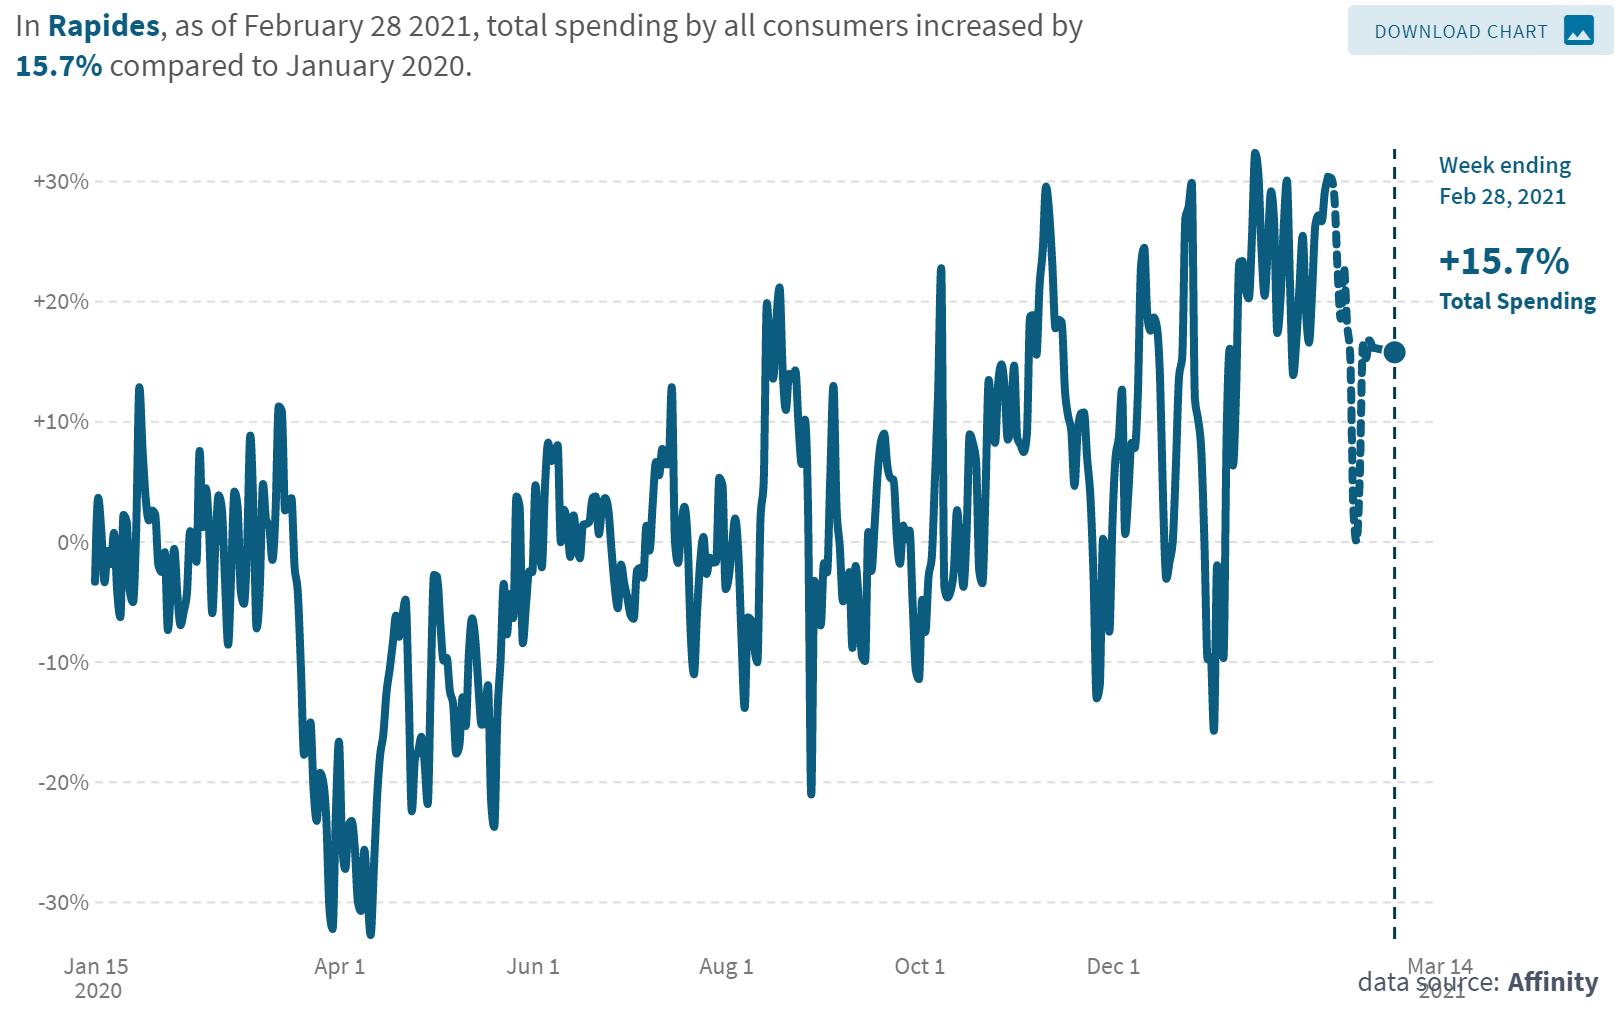
ALLCONSUMERSPENDINGINCENLA
The table and chart represents the percent change in average consumer credit and debit card spending in Cenla as of February 28, 2021 with January 2020 as the baseline, while the chart represents Rapides.
Data Source: Opportunity Insights Economic Tracker, https://www.tracktherecovery.org/. Data Source: Affinity Solutions. Retrieved March 14, 2021
Catahoula -3.2% Evangeline -20.3% Grant +23.3% La Salle -0.3% Natchitoches -3.7% Rapides +15.7% St. Landry -21.7% Vernon -1.4%
Change in Spending
SMALLBUSINESSREVENUEINLOUISIANA
The chart below represents the percent change in small business revenue in Louisiana as of March 3, 2021 with January 2020 as the baseline. The table shows the percentage change for small business revenue by industry.
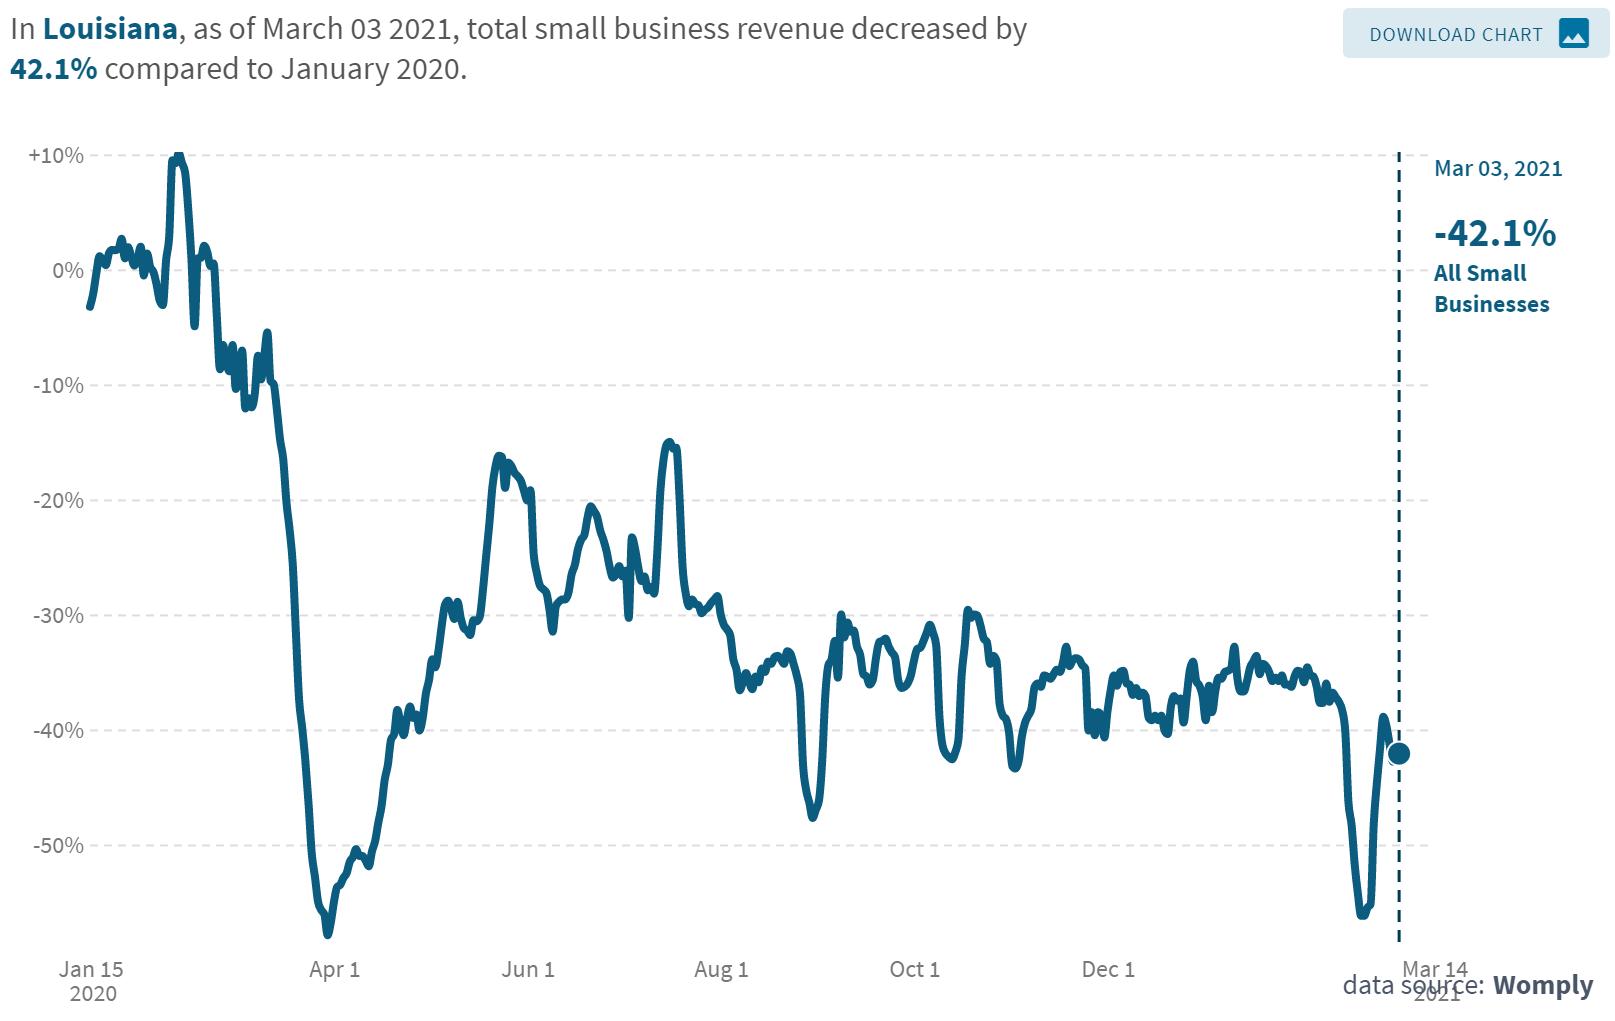
Source: Opportunity Insights Economic Tracker, https://www.tracktherecovery.org/ Date Source: Womply. Retrieved March 14, 2021. Industry % Change Education & Health Services -29% Retail -39% Leisure & Hospitality Professional -68% -21%
TIMESPENTATWORKINRAPIDES
The chart represents the percent of time employees in Rapides Parish spent at work as of March 9, 2021 with January 2020 as the baseline. The table provides comparable data for other central Louisiana parishes.
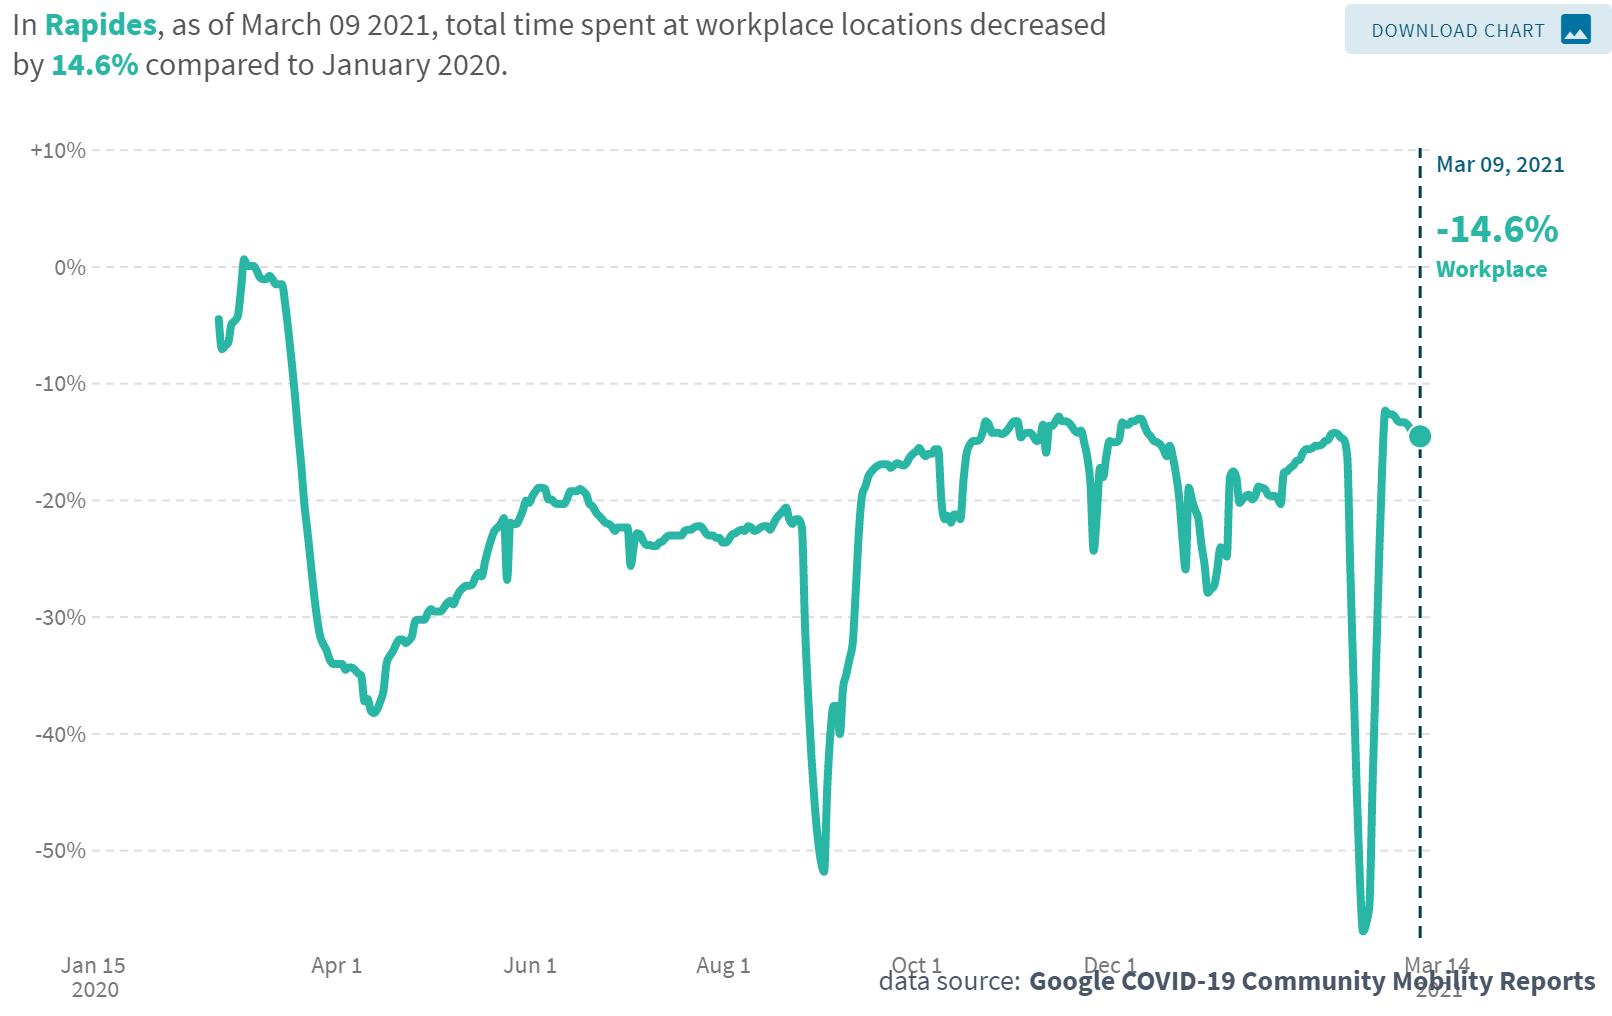
The percent of time employees in Rapides spent at work during winter storms Uri and Viola was down -57% compared to -51% for Hurricane Laura. Natchitoches was hardest hit at -61.6% followed by Grant (-58.4%), Rapides (-57%), and Vernon (-52.6%).
Source: Opportunity Insights Economic Tracker, https://www.tracktherecovery.org/ Date Source: Womply. Retrieved March 14, 2021.
Avoyelles -14.4% Concordia -18.9% Evangeline -14.9% Grant -14.1% Natchitoches -12.6% Rapides -14.6% St. Landry -12.0% Vernon -10.3% Winter storms Uri & Viola Hurricane Laura
Change in Time at Work
LOUISIANAGASOLINESALES
Total gasoline sales in Louisiana in 2019 and 2020.


In December 2020, Louisiana gasoline sales decreased -0.7% from November and was 5.8% below December 2019.
Gasoline sales in LA in 2020 exceeded 2019 in only two month – January and August.
Gasoline sales for 2020 were down 5.8% compared to 2019.
Data Source: U.S. Energy Information Administration, March 10, 2021
4,000 5,000 6,000 7,000 8,000 Thousands of Gallons / Day
2019 2020
Gasoline Sales in Louisiana
BAKERHUGHESRIGCOUNT
Represents the number of drilling rigs actively exploring for or developing oil or natural gas in Louisiana and the U.S.


Exploration rig count in Louisiana increased 4.4% in February. Likewise, the rig count nationwide increased 9.3% from a month ago, but remains -54% down from a year ago.
Source: Baker Hughes, https://rigcount.bakerhughes.com/na-rig-count, March 14, 2021
2020-2021
US
Feb 20 Jan 21 Feb 21 N. LA-Land 28 29 32 S. LA –Int’l Water 0 2 1 S. LA-Land 2 0 0 S. LA-Offshore 22 15 15 TOTAL LOUISIANA 51 45 47 TOTAL US 790 363 397
0 10 20 30 40 50 60 70 0 100 200 300 400 500 600 700 800 900 3-Jan 3-Feb 3-Mar 3-Apr 3-May 3-Jun 3-Jul 3-Aug 3-Sep 3-Oct 3-Nov 3-Dec 3-Jan 3-Feb Louisiana Rig Count US Rig Count
Rig Count in Louisiana &
LOUISIANAGAMINGREVENUE
Gaming revenue in Louisiana for January 2021 with previous month and year comparisons.
Data Source: Louisiana Gaming Control Board, March 14, 2021. http://lgcb.dps.louisiana.gov/revenue_reports.html
January 9.0% January 2021 Jan. YoY -4.9% 20-Jan 20-Dec 21-Jan % Change MoM % Change YoY Video Poker $52,069,825 $54,498,613 $61,258,981 12.4% 17.6% Riverboat $143,963,554 $121,903,398 $132,566,676 8.7% -7.9% Landbased $24,441,634 $16,513,895 $14,851,851 -10.1% -39.2% Slots $27,574,260 $23,457,363 $27,135,312 15.7% -1.6% Total $248,049,273 $216,373,269 $235,812,820 9.0% -4.9%
NATIONAL
NATIONALECONOMICINDICATORS
Monthly
U.S. economic indicators for January 2021.
Data Source: U.S. Census, https://www.census.gov/economic-indicators/, March 14, 2021.
Indicator Dec-20 Jan-21 Monthly Wholesale Trade 0.6% 1.3% Manufacturers Shipments, Inventories, and Orders 1.6% 2.6% Construction Spending 1.1% 1.7% Advance Monthly Wholesale Inventories 0.5% 1.3% Advance Monthly Retail Inventories 1.9% -0.6% Advance Durable Goods Manf. Shipments, Inventories, and Orders 1.2% 3.4% New Residential Sales 5.5% 4.3% New Residential Construction 8.2% -6.0% Advance Monthly Sales for Retail and Food Services -1.0% 5.3% Durable Goods 3.4% Residential Sales 4.3% Residential Construction -6.0%
CONTRIBUTORS
The data presented throughout the CENLA Economic Dashboard reflects contributions from the following local organizations.
• Rapides Parish Policy Jury Treasurer
• Rapides Sales TaxAdministrator
• Avoyelles Parish School Board
• Alexandria International Airport
• RapidesArea Planning Commission
• City ofAlexandria Planning Division
• Evangeline Parish Sales Tax Commissioner
• Concordia, Catahoula, & La Salle TaxAdministrator
• Louisiana Office of Public Health, Region 6
• St. Landry Parish School Board
THANKYOU
Also, special thanks to the following partners for distributing the dashboard.
Next Issue: Week of April 12th
• LSUAFoundation
• Central Louisiana Regional Chamber of Commerce
• Marksville Chamber of Commerce
• Bunkie Chamber of Commerce
• Evangeline Chamber of Commerce
• Concordia Chamber of Commerce
• St. Landry Chamber of Commerce
• Greater Vernon Chamber of Commerce
Current and past issues of the CENLAEconomic Dashboard can be found at http://www.lsua.edu/coronavirus/cenla-economic-dashboard/