CENLA ECONOMIC DASHBOARD
February 22, 2021.
Dr.RandallDupont Dean,CollegeofBusiness
LouisianaStateUniversityofAlexandria
rdupont@lsua.edu

Topics on Central Louisiana:
History of CenLa, Government, and Legislative Process

Education and Workforce Development
Business, Industry, and Economy
Art, Culture, and Tourism
Criminal Justice and Law Enforcement
Healthcare and Community Needs
Understanding Leadership
Strategic Leadership Simulation
Dates: April 29, May 27, June 24, August 26, September 23, October 28, November 18, 2021, Legislative Day at Capitol to be determined (early- to mid-May)
Cost: $1,500 covers seven sessions and Legislative Day trip Light breakfast & Lunch provided
Location: The Wesley Center, Woodworth, LA
Nominations now being accepted at lsua.it/LeadershipNomination

KEYFINDINGS
February 22, 2021 CENLA Economic Dashboard
COVID-19
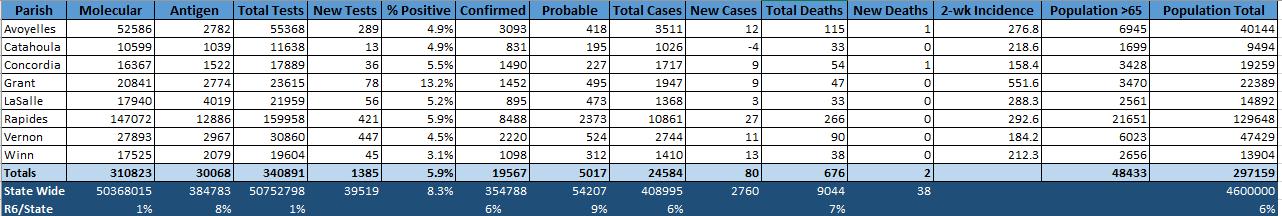
• The positivity rate for COVID-19 in Region 6 (Cenla) fell significantly in January from a high in excess of 11% in early January to 8.3% on February 4. Rapides posted a 5.9% positivity rate.
EMPLOYMENT
• Statewide, average weekly initial unemployment claims filed in January rose to 16,957 from 8,671 in December, a 96% increase, while average weekly continued unemployment claims in January rose to 69,077 from 66,909 in December, a 3% increase.
• In CENLA, average weekly initial unemployment claims in central Louisiana rose to 976 from 486 in December, a 101% increase, while average weekly continued unemployment claims in central Louisiana fell to 4,701 in January from 4,773 in December, a 1.5% decrease.
• In December, parishes in central Louisiana had an average unemployment rate of 5.9% compared to 6.9% statewide.
• At 5.0%, the Alexandria MSA had the lowest unemployment rate among the state’s major metro areas for the eighth straight month, well below the state’s 6.9% rate.
• Louisiana’s unemployment rate fell 1.2% in December to 6.9% from 8.1% in November.
• Alexandria’s metro area continues to have the tightest labor market in the state with only 0.68 unemployed per job opening compared to 1.78 statewide. In other words, there are two unemployed for every three job openings in Cenla.

TAX REVENUE
• January sales taxes revenue for Ball, Boyce, Lecompte, and Woodworth were down single-digits while Cheneyville and Glenmora were up double-digits. January data reflects sales activity in December.
• All nine jurisdictions in central Louisiana reported higher tax revenues in January, reflecting increased consumer spending in December. Increases ranged from 11% to 32%.
KEYFINDINGS… continued
February 22, 2021 CENLA Economic Dashboard
• All reporting central Louisiana jurisdictions had increased tax revenues over the same period last year, withAvoyelles and Evangeline having the largest gains over January 2020 at 32% and 31%, respectively.
• Alexandria’s sales tax revenue exceeded revenues for January 2020 by 9.9%. In other words, spending for Christmas 2020 was 10% higher than Christmas 2019. Ball recorded a 36% increase in spending, while Woodworth gained 41%. Sales tax revenue serves as a proxy for consumer spending.
BUILDING PERMITS
• Rapides Parish permit valuations in January were $195 million, up 442% over December 2020 which stood at $36 million. TheAcadian Gas Pipeline System being built in the parish accounts for $193 of the $195 million.
• Residential construction permits in CENLAin January were down 60% over the same month a year ago.
• InAlexandria, commercial permit valuations were down 29% year-to-date in January while residential permits were down 35%.
HOUSING
• Indicators point to a seasonal slowing but still strong housing market in theAlexandria metro area. Compared to January of last year, active listings are down 54%, pending listings are up 155%, and median days on the market are down only 2%.
• The median listing price is up 18% over the past year, while the average price is up 23%. Median listing prices peak in October at $231,950 and are currently 9.0% off the peak.
• In December, Louisiana’s non-current mortgage delinquency rate dropped to 1.5% from its pandemic high of 11.8% in May. Mortgage delinquencies nationwide improved for the sixth consecutive month in December 2020, falling to 6.1% from 6.3% in November.
TRAVEL
• Hotel occupancy in Rapides decreased 24% in December compared to a month earlier, withAvoyelles experiencing a 7% decline. Compared to a year ago, hotel occupancy tax revenue was down 7.3% in Rapides and 14.0% inAvoyelles. Occupancy tax revenue is used as a proxy for occupancy rates.
KEYFINDINGS… continued
February 22, 2021 CENLA Economic Dashboard
• Total passenger traffic at Alexandria International airport (AEX) averaged 56% of last January’s level compared to only 38% nationwide. AEX had the second highest percentage passenger throughput rate in the state when compared with 2019 traffic.
• Nationwide air passenger traffic in January 2021 was 38% of last year’s level.
LOCAL& LOUISIANA
• The number of new businesses established in Rapides in January 2021 was 14% below a year ago, but 54% higher than in January 2019. However, new businesses established in Rapides decreased 5.9% in 2020 compared to 2019.
• Total consumer spending in Louisiana is up 9.5% compared to January 2020, with retail spending up 37% while entertainment and recreation spending is down 49%. Grocery spending was up 10.1%, health care up 12.7%, and restaurants down -3.4%.
• Using data from financial transactions, Opportunity Insights reports consumer spending in Rapides for the week ending January 31, 2021 was up 19.2% compared to January 2020 while statewide spending was up 9.5%.
• Small business revenue in Louisiana was down 36% in late January compared to January 2020 with leisure and hospitality small business revenue down 71%.
• Small business revenue in Rapides was down 27% compared to a year ago.All central Louisiana parishes and jurisdictions reported lower small business revenue ranging from Evangeline’s 75% decline and to St. Landry’s 14% decline.
• 31% of small businesses in Louisiana closed in the past year compared to 30% in Rapides.
• The Coincident Economic Activity Index which tracks gross state product edge up 0.4% in December indicating continued growth in the Louisiana economy.
• In November 2020, Louisiana gasoline sales decreased5.1% from October and was 7.0% below November 2019. Gasoline sales in LAexceeded 2019 in only two month –January and August. Year-to-date gasoline sales were down 5.9% in 2020 compared to 2019.
• The Baker Hughes exploration rig count in Louisiana increased 9.7% in January. Likewise, the rig count nationwide increased 7% from a month ago.
• Gaming revenue in Louisiana increased 6% in December but was still down 18% compared to last year.
COVID-19
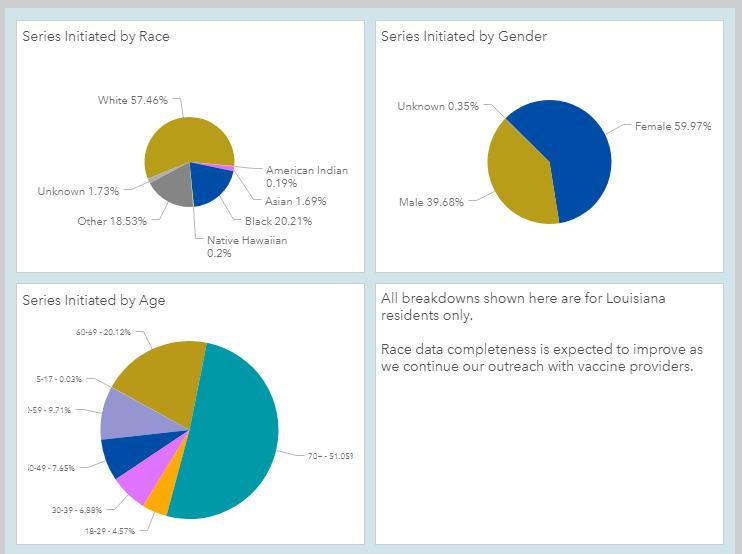
COVID-19VACCINATIONTOTALS
COVID-19 vaccinations statewide as of February 22, 2021.
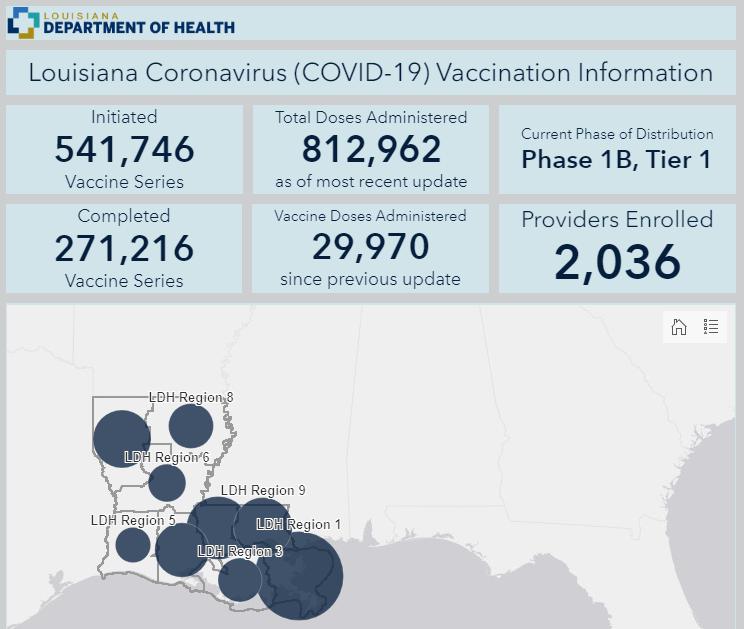
Source: Louisiana Office of Public Health, Region 6 (Central Louisiana), Regional Administrator/Medical Director, David J. Holcombe, MD, MSA, Feb. 22, 2021.
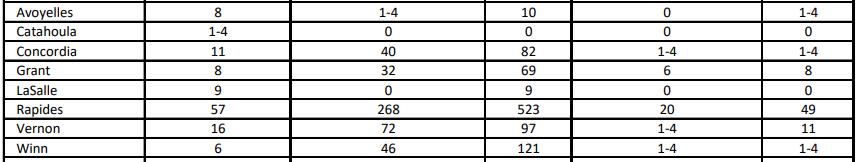
COVID-19PARISHTESTINGSTATISTICS
COVID-19 parish testing statistics for Region 6 as of February 4, 2021. Source: Louisiana Office of Public Health, Region 6 (Central Louisiana), Regional Administrator/Medical Director, David J. Holcombe, MD, MSA, February 4, 2021.
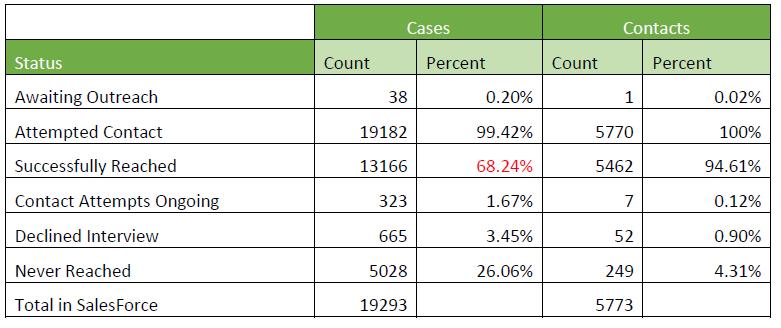
COVID-19REGION6CONTACTTRACINGDATA
68% of cases and 95% of close contacts were successfully interviewed.
44% denied any close contact in the two weeks prior to their positive results.
Covid-19 contact tracing effectiveness as of January 21, 2021. Source: Louisiana Office of Public Health, Region 6 (Central Louisiana), Regional Administrator/Medical Director, David J. Holcombe, MD, MSA, Feb.. 4, 2021.
:
COVID-19CASESBYK-12SCHOOLS
Covid-19 cases reported by K-12 schools in Region 6 from January 25-31, 2021.
Source: Louisiana Office of Public Health, Region 6 (Central Louisiana), Regional Administrator/Medical Director, David J. Holcombe, MD, MSA, Feb. 4, 2021.
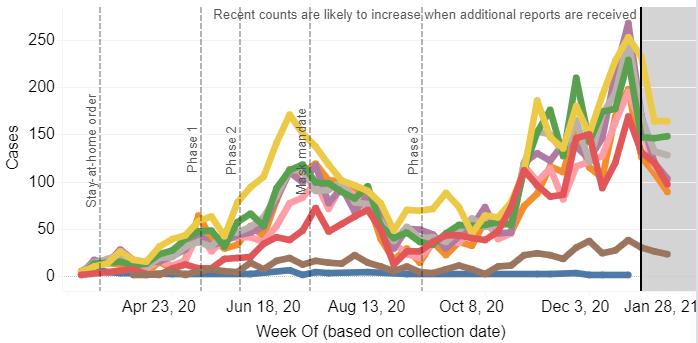
COVID-19CASESBYCOLLECTIONDATE
COVID-19 cases by collection date as of February 3, 2021 in Region 6 with a 7day moving average.
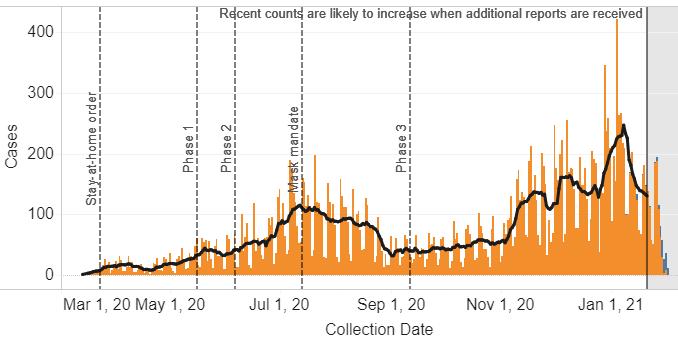
Source: Louisiana Office of Public Health, Region 6 (Central Louisiana), Regional Administrator/Medical Director, David J. Holcombe, MD, MSA, Feb. 4, 2021.
:
COVID-19REGION6CASESBYAGEGROUP
Cases over time by age group in Region 6 through February 3, 2021. Source: Louisiana Office of Public Health, Region 6 (Central Louisiana), Regional Administrator/Medical Director, David J. Holcombe, MD, MSA, Feb. 4, 2021.
:
COVID-19PERCENTPOSITIVEANDTESTVOLUME
COVID-19 percent positive and test volume in Region 6 as of February 3, 2021.
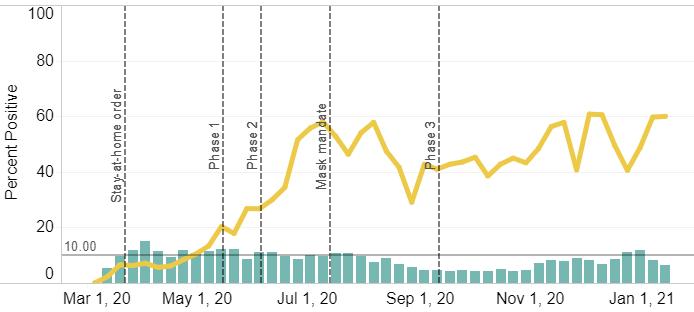
Louisiana Office of Public Health, Region 6 (Central Louisiana), Regional Administrator/Medical Director, David J. Holcombe, MD, MSA, Feb. 4, 2021.. :
Source:
COVID-19CASESBYAGEGROUP
COVID-19 cases statewide by age group as of February 3, 2021.
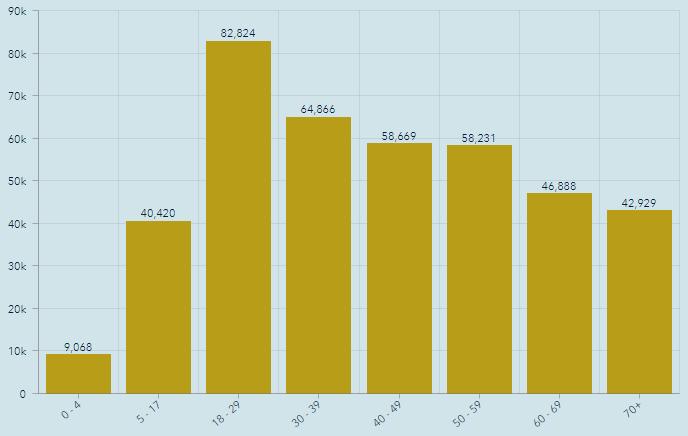
Source: Louisiana Office of Public Health, Region 6 (Central Louisiana), Regional Administrator/Medical Director, David J. Holcombe, MD, MSA, Feb. 4, 2021.
:
COVID-19HOSPITALIZED&VENTILATED
Number of cases hospitalized (green line) and ventilated (yellow line) in Region 6 as of February 3, 2021.
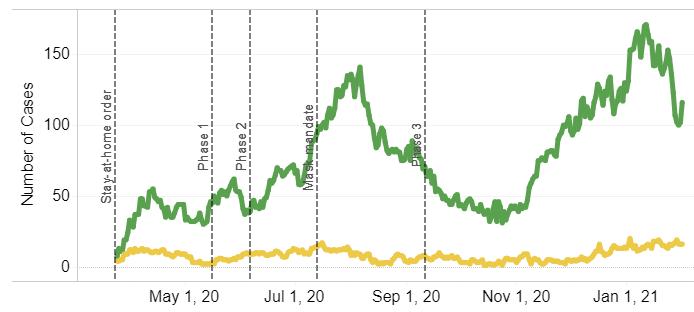
Source: Louisiana Office of Public Health, Region 6 (Central Louisiana), Regional Administrator/Medical Director, David J. Holcombe, MD, MSA, Feb. 4, 2021.
:
COVID-19AVAILABLEBEDSBYLDHREGION

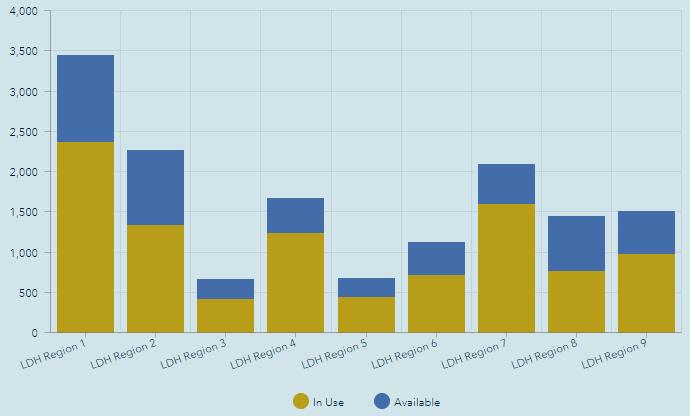
Available beds by Louisiana Department of Health region as of February 3, 2021. Source: Louisiana Office of Public Health, Region 6 (Central Louisiana), Regional Administrator/Medical Director, David J. Holcombe, MD, MSA, February 4, 2021. :
COVID-19DEATHSSTATEWIDEBYDATE
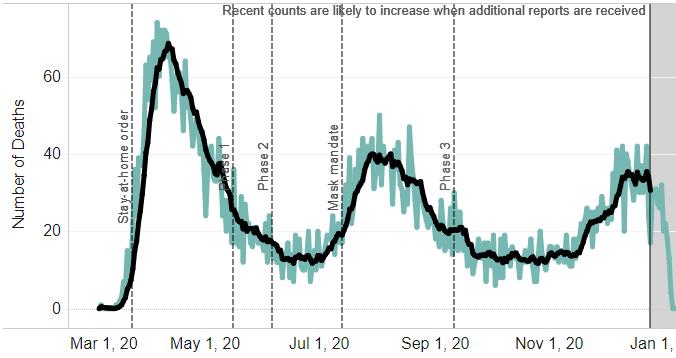
COVID-19 deaths by date of death statewide as of February 3, 2021.
Source:
of Public Health, Region 6
Louisiana), Regional Administrator/Medical
J.
Feb. 3,
:
Louisiana Office
(Central
Director, David
Holcombe, MD, MSA,
2021.
COVID-19DEATHSBYAGEGROUP
COVID-19 deaths statewide by age group as of February 3, 2021.
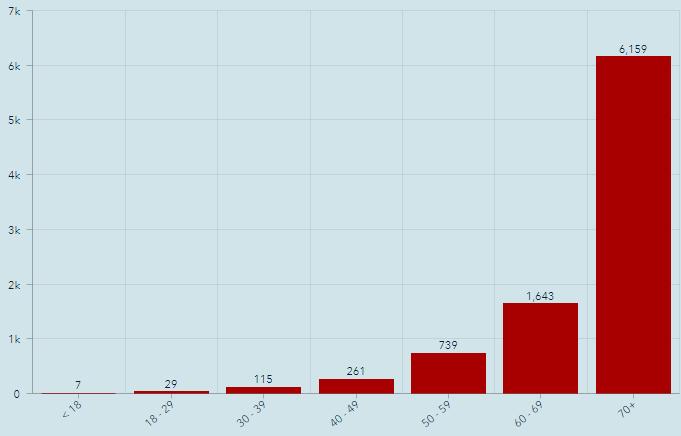
Source: Louisiana Office of Public Health, Region 6 (Central Louisiana), Regional Administrator/Medical Director, David J. Holcombe, MD, MSA, Feb. 4, 2021.
:
EMPLOYMENT
UNEMPLOYMENTCLAIMSINLOUISIANA
Initial and continued unemployment claims in Louisiana from March 14, 2020 through January 30, 2021.


Average weekly initial unemployment claims filed in January rose to 16,957 from 8,671 in December, a 96% increase.
Average weekly continued unemployment claims in January rose to 69,077 from 66,909 in December, a 3% increase.
Source: Louisiana Workforce Commission, February 5, 2021
0 20,000 40,000 60,000 80,000 100,000 120,000 0 50,000 100,000 150,000 200,000 250,000 300,000 350,000 Initial Claims Continued Claims
Continued Initial
Unemployment Claims in Louisiana
UNEMPLOYMENTCLAIMSINCENLA

Average weekly initial unemployment claims in central Louisiana rose to 976 from 486 in December, a 101% increase.
Average weekly continued unemployment claims in central Louisiana fell to 4,701 in January from 4,773 in December, a 1.5% decrease.
Unemployment Claims in CENLA
0 1,000 2,000 3,000 4,000 5,000 6,000 7,000 0 5,000 10,000 15,000 20,000 25,000 Initial Claims Continued Claims
Continued Initial
Initial and continued unemployment claims in central Louisiana from March 14, 2020 through January 30, 2021. Source: Louisiana Workforce Commission, February 5, 2021
UNEMPLOYMENTRATEBYCENLAPARISH
The table below shows December 2020 preliminary unemployment rate, labor force, and employment data for central Louisiana parishes.
In December, parishes in central Louisiana had an average unemployment rate of 5.9% compared to 6.9% statewide.
Data Source: Louisiana Workforce Commission, Feb. 10, 2021.
Area Labor Force Employed Unemployed Unemployment Rate Dec 2020 Unemployment Rate Nov 2020 Allen 8,660 8,074 586 6.8% 8.2% Avoyelles 15,063 14,132 931 6.2% 7.3% Catahoula 3,436 3,218 218 6.3% 7.3% Concordia 6,999 6,562 437 6.2% 7.3% Evangeline 11,624 10,892 732 6.3% 7.6% Grant 8,018 7,614 404 5.0% 6.1% La Salle 6,742 6,474 268 4.0% 4.6% Rapides 54,447 51,720 2,727 5.0% 6.0% St. Landry 31,973 29,577 2,396 7.5% 8.9%
UNEMPLOYMENTRATEAMONGLAMETROS
The table below shows December 2020 preliminary unemployment rate, labor force, and employment data for Metropolitan Statistical Areas in Louisiana.
At 5.0%, the Alexandria MSA had the lowest unemployment rate among the state’s major metro areas for the eighth straight month, well below the state’s 6.9% rate.
Louisiana’s unemployment rate fell 1.2% in December to 6.9% from 8.1% in November.
Data Source: Louisiana Workforce Commission, February 15, 2021.
Area Unemployment Rate Labor Force Employed Unemployed Louisiana 6.9% 2,079,591 1,937,072 142,519 Alexandria 5.0% 62,465 59,334 3,131 Baton Rouge 6.1% 416,461 391,186 25,275 Hammond 8.1% 54,729 50,309 4,420 Houma-Thibodaux 5.9% 88,777 83,517 5,260 Lafayette 6.2% 212,283 199,150 13,133 Lake Charles 7.7% 99,234 91,548 7,686 Monroe 5.7% 82,769 78,037 4,732 New Orleans-Metairie 8.2% 591,186 542,565 48,621 Shreveport-Bossier City 6.6% 188,156 175,770 12,386
UNEMPLOYEDPERJOBOPENING
The table below shows the number of unemployed, number of advertised jobs online, and the ratio of unemployed to advertised job openings online for Metropolitan Statistical Areas in Louisiana in December 2020.
Alexandria metro area continues to have the tightest labor market in the state with only 0.68 unemployed persons per job opening compared to 1.78 statewide.
Source: Louisiana Workforce Commission, February 15 2021
Rank Metro Area Unemployed Job Openings Unemployed per Job Opening 1 Alexandria 3,131 4,597 0.68 2 Shreveport-Bossier City 11,472 8,383 1.37 3 Lafayette 7,812 5,214 1.50 4 Monroe 4,732 3,022 1.57 5 Lake Charles 7,686 4,825 1.59 6 New Orleans-Metairie-Kenner 47,806 27,131 1.76 7 Baton Rouge 25,275 14,074 1.80 8 Houma-Bayou Cane-Thibodaux 5,260 2,290 2.30
TAXREVENUE
TAXREVENUEOVERVIEW
An overview of sales, vehicle sales, and hotel occupancy taxes collected in the January 2021 reflecting sales activity in December 2020.
Note: January tax revenue reflects sales activity in December. N/a = Not available
Data Source noted in detailed reports.
Sales Tax M/M Y/Y YTD Vehicle Sales Tax M/M Y/Y YTD Alexandria 18.4% 9.9% 9.9% Avoyelles 15.8% 36.4% 36.4% Avoyelles 32.5% 12.3% 12.3% Evangeline 18.0% 26.0% 26.0% Catahoula 11.3% 18.2% 18.2% Rapides 0.3% 31.4% 31.4% Concordia 16.5% 30.0% 30.0% St. Landry 8.4% 5.7% 5.7% Evangeline 31.3% 19.5% 19.5% La Salle 20.2% 19.1% 19.1% Hotel Occupancy Tax Pineville 12.7% 16.4% 16.4% Avoyelles -6.9% -14.0% -14.0% Rapides 12.8% 15.5% 15.5% Rapides -24.2% -7.3% -7.3% St. Landry 29.2% 3.1% 3.1% January
RAPIDESPARISHTOWNS&CITIES


An overview of sales tax revenue in Rapides Parish other towns and cities in January 2021 (excluding Alexandria and Pineville).
Note: Current tax revenue reflects sales activity in prior month.
January 20-Jan 20-Dec 21-Jan % M/M % Y/Y %YTD Ball $57,883 $80,550 $79,050 -1.9% 36.6% 36.6% Boyce $36,352 $52,711 $51,728 -1.9% 42.3% 42.3% Cheneyville $4,496 $2,744 $3,036 10.6% -32.5% -32.5% Glenmora $20,829 $22,107 $26,352 19.2% 26.5% 26.5% Lecompte $22,541 $32,317 $30,578 -5.4% 35.7% 35.7% Woodworth $34,870 $54,288 $49,232 -9.3% 41.2% 41.2%
$0 $20 $40 $60 $80 $100 Jan Feb Mar Apr May Jun Jul Aug Sep Oct Nov Dec Thousands Ball 2019 2020 2021 $10 $20 $30 $40 $50 $60 Jan Feb Mar Apr May Jun Jul Aug Sep Oct Nov Dec Thousands Woodworth 2019 2020 2021
Data Source: Rapides Parish Police Jury Treasurer’s Reports.
ALEXANDRIASALESTAX
(TR) Alexandria sales tax revenue for January with previous month, year, and YTD comparisons.
(BR) Alexandria monthly sales tax revenue from 2019 to present.
Note: Current sales tax revenue reflects sales activity in the prior month.
Data Source: Rapides Parish Police Jury Treasurer’s Reports. January 18.4% Jan. YoY 9.9% Jan. YTD 9.9% 2018 2019 2020 2021 January $ 4,032,605 $ 4,140,983 $ 4,132,795 $ 4,542,155 December (prev year) $ 2,988,828 $ 3,170,790 $ 3,304,565 $ 3,837,325 % Chg over Prev Month 34.9% 30.6% 25.1% 18.4% % Chg over Prev Year 2.7% -0.2% 9.9% YTD (Jan - Dec) $ 4,032,605 $ 4,140,983 $ 4,132,795 $ 4,542,155 % Chg over Prev YTD 2.7% -0.2% 9.9% January
$$1 $2 $3 $4 $5 Millions Alexandria Sales Tax Revenue 2019-2021 2019 2020 2021
AVOYELLESSALESTAX
Avoyelles Parish total sales tax revenue for January with previous month, year, and year-to-date comparisons. Vehicle and hotel tax revenues are excluded.
Note: December sales tax revenue reflects sales activity in November.
January 32.5% Jan. YoY 12.3% Jan. YTD 12.3% January
Data Source: Avoyelles Parish School Board. February 22, 2021.
2017 2018 2019 2020 2021 January $ 1,684,821 $ 1,761,723 $ 1,896,263 $ 1,847,251 $ 2,074,759 December (prev year) $ 1,256,191 $ 1,277,728 $ 1,315,332 $ 1,483,307 $ 1,565,736 % Chg over Prev Month 34.12% 37.88% 44.17% 24.54% 32.51% % Chg over Prev Year 4.56% 7.64% -2.58% 12.32% YTD (Jan - Dec) $ 1,684,821 $ 1,761,723 $ 1,896,263 $ 1,847,251 $ 2,074,759 % Chg over Prev YTD 4.56% 7.64% -2.58% 12.32%
AVOYELLESVEHICLESALESTAX
Avoyelles Parish vehicle sales tax revenue for January with previous month, year, and year-to-date comparisons.
Note: December sales tax revenue reflects sales activity in November.
Data Source: Avoyelles Parish School Board. February 22, 2021
January 15.8% Jan. YoY 36.4% Jan. YTD 36.4% January
2017 2018 2019 2020 2021 January $ 283,788 $ 229,782 $ 191,942 $ 255,336 $ 348,146 December (prev year) $ 283,451 $ 224,365 $ 213,280 $ 217,793 $ 300,598 % Chg over Prev Month 0.12% 2.41% -10.00% 17.24% 15.82% % Chg over Prev Year -19.03% -16.47% 33.03% 36.35% YTD (Jan - Dec) $ 283,788 $ 229,782 $ 191,942 $ 255,336 $ 348,146 % Chg over Prev YTD -19.03% -16.47% 33.03% 36.35%
CATAHOULASALESTAX
Catahoula Parish total sales tax revenue for January with previous month, year, and year-todate comparisons.
Note: January sales tax revenue reflects sales activity in December.
Data Source: Catahoula Parish Tax Administrator February 2021
January 11.3% Jan. YoY 18.2% Jan. YTD 18.2% January
2018 2019 2020 2021 January $ 523,082 $ 514,971 $ 511,212 $ 604,484 December (prev year) $ 428,928 $ 443,759 $ 530,966 $ 543,087 % Chg over Prev Month 22.0% 16.0% -3.7% 11.3% % Chg over Prev Year -1.6% -0.7% 18.2% YTD (Jan - Dec) $ 523,082 $ 514,971 $ 511,212 $ 604,484 % Chg over Prev YTD -1.6% -0.7% 18.2%
CONCORDIASALESTAX
Concordia Parish total sales tax revenue for January with previous month, year, and year-to-date comparisons.
Note: January sales tax revenue reflects sales activity in December.
Data Source: Concordia Parish Tax Administrator. February 2021
January 16.5% Jan. YoY 30.0% Jan. YTD 30.0% January
2018 2019 2020 2021 January $ 1,084,657 $ 1,305,652 $ 1,125,374 $ 1,462,464 December (prev year) $ 977,344 $ 990,723 $ 1,172,459 $ 1,255,832 % Chg over Prev Month 11.0% 31.8% -4.0% 16.5% % Chg over Prev Year 20.4% -13.8% 30.0% YTD (Jan - Dec) $ 1,084,657 $ 1,305,652 $ 1,125,374 $ 1,462,464 % Chg over Prev YTD 20.4% -13.8% 30.0%
EVANGELINESALESTAX
Evangeline Parish total sales tax revenue for January with previous month, year and YTD comparisons.
Note: January sales tax revenue reflects sales activity in December.
Data Source: Evangeline Parish Sales Tax Commissioner. February 2021
January 31.3% Jan. YoY 19.5% Jan. YTD 19.5% January
2017 2018 2019 2020 2021 January $ 1,790,457 $ 1,733,668 $ 1,684,820 $ 1,674,965 $ 2,001,054 December (prev year) $ 1,410,773 $ 1,373,448 $ 1,436,980 $ 1,390,677 $ 1,523,452 % Chg over Prev Month 26.9% 26.2% 17.2% 20.4% 31.3% % Chg over Prev Year -3.2% -2.8% -0.6% 19.5% YTD (Jan - Dec) $ 1,790,457 $ 1,733,668 $ 1,684,820 $ 1,674,965 $ 2,001,054 % Chg over Prev YTD -3.2% -2.8% -0.6% 19.5%
EVANGELINEVEHICLESALESTAX
Evangeline Parish vehicle sales tax revenue for January with previous month, year and YTD comparisons.
Note: January sales tax revenue reflects sales activity in December.
Data Source: Evangeline Parish Sales Tax Commissioner. February 2021
January 18.0% Jan. YoY 26.0% Jan. YTD 26.0% January
2017 2018 2019 2020 2021 January $ 289,407 $ 259,767 $ 292,397 $ 286,825 $ 361,503 December (prev year) $ 294,847 $ 254,715 $ 249,226 $ 219,748 $ 306,309 % Chg over Prev Month -1.8% 2.0% 17.3% 30.5% 18.0% % Chg over Prev Year -10.2% 12.6% -1.9% 26.0% YTD (Jan - Dec) $ 289,407 $ 259,767 $ 292,397 $ 286,825 $ 361,503 % Chg over Prev YTD -10.2% 12.6% -1.9% 26.0%
LASALLESALESTAX
La Salle Parish total sales tax revenue for January with previous month, year, and year-to-date comparisons.
Note: Janauary sales tax revenue reflects sales activity in December.
Data Source: La Salle Parish Tax Administrator February 2021
January 20.2% Jan. YoY 19.1% Jan. YTD 19.1% January
2018 2019 2020 2021 January $ 823,918 $ 1,239,753 $ 936,466 $ 1,115,428 December (prev year) $ 650,850 $ 806,187 $ 923,277 $ 927,632 % Chg over Prev Month 26.6% 53.8% 1.4% 20.2% % Chg over Prev Year 50.5% -24.5% 19.1% YTD (Jan - Dec) $ 823,918 $ 1,239,753 $ 936,466 $ 1,115,428 % Chg over Prev YTD 50.5% -24.5% 19.1%
PINEVILLESALESTAX

(TR) Pineville sales tax revenue for January with previous month, year, and YTD comparisons.
(BR) Pineville monthly sales tax revenue from 2019 to present.
Note: Current sales tax revenue reflects sales activity in the prior month.
Data Source: Rapides Parish
Reports. January 12.7% Jan. YoY 16.4% Jan. YTD 16.4% 2018 2019 2020 2021 January $ 1,012,295 $ 1,026,165 $ 1,098,450 $ 1,278,518 December (prev year) $ 832,140 $ 799,180 $ 966,455 $ 1,134,648 % Chg over Prev Month 21.6% 28.4% 13.7% 12.7% % Chg over Prev Year 1.4% 7.0% 16.4% YTD (Jan - Dec) $ 1,012,295 $ 1,026,165 $ 1,098,450 $ 1,278,518 % Chg over Prev YTD 1.4% 7.0% 16.4% January
Police Jury Treasurer’s
0.6 0.7 0.8 0.9 1.0 1.1 1.2 1.3 1.4 Millions Pineville Sales Tax Revenue 2019-2021 2019 2020 2021
RAPIDESOCCUPATIONALLICENSES
Rapides Parish occupational license revenue YTD with previous YTD comparisons.
Note: January YTD occupational license revenue reflects licenses issued YTD in December.
Data Source: Rapides Parish Police Jury Treasurer’s Reports.
Rapides 7.5% Alexandria -6.9% Pineville -28.0% January Year-to-Date Other -46.0% Total -9.4% 2018 2019 2020 2021 Parish $ 104,476 $ 47,276 $ 95,696 $ 102,899 % Chg over Prev YTD -54.7% 102.4% 7.5% Alexandria $ 338,887 $ 235,600 $ 317,070 $ 295,244 % Chg over Prev YTD -30.5% 34.6% -6.9% Pineville $ 73,584 $ 40,451 $ 60,784 $ 43,755 % Chg over Prev YTD -45.0% 50.3% -28.0% Other $ 31,189 $ 12,987 $ 35,355 $ 19,084 % Chg over Prev YTD -58.4% 172.2% -46.0% Total $ 548,136 $ 336,314 $ 508,905 $ 460,982 % Chg over Prev YTD -38.6% 51.3% -9.4%
RAPIDESSALESTAX
(TR) Rapides Parish total sales tax revenue for January with previous month, year, and YTD comparisons.
(BR) Rapides Parish total monthly sales tax revenue from 2019 to present.


Note: January sales tax revenue reflects sales activity in December.
Data Source: Rapides Parish Police Jury Treasurer’s Reports.
$9 $11 $13 $15 $17 Millions Rapides Parish Total Sales Tax Revenue 2019 - 2021 2019 2020 2021
January 12.8% Jan. YoY 15.5% Jan. YTD 15.5% January
2018 2019 2020 2021 January $ 13,343,467 $ 13,858,944 $ 13,981,762 $ 16,147,576 December (prev year) $ 10,261,521 $ 10,707,459 $ 11,949,427 $ 14,310,091 % Chg over Prev Month 30.0% 29.4% 17.0% 12.8% % Chg over Prev Year 3.9% 0.9% 15.5% YTD (Jan - Dec) $ 13,343,467 $ 13,858,944 $ 13,981,762 $ 16,147,576 % Chg over Prev YTD 3.9% 0.9% 15.5%
RAPIDESVEHICLESALESTAX
Rapides Parish vehicle sales tax revenue for January with previous month, year, and YTD comparisons.
*Note: January vehicle sales tax revenue reflects sales activity in December. November sales activity in 2019 and 2020 are included in December tax revenues. Since November data is unavailable for 2019-2020, calculation of percent change over the previous month assumes sales were evenly divided between November and
Data Source: Tax revenue data from Rapides Parish Police Jury Treasurer’s Reports.
January 0.3% Jan. YoY 31.4% Jan. YTD 31.4% January
December. 2018 2019 2020* 2021* January $ 991,523 $ 874,305 $ 1,042,217 $ 1,369,214 December (prev year) $ 970,286 $ 859,567 $ 2,052,676 $ 2,723,907 % Chg over Prev Month 2.2% 1.7% 0.8% 0.3% % Chg over Prev Year -11.8% 19.2% 31.4% YTD (Jan - Dec) $ 991,523 $ 874,305 $ 1,042,217 $ 1,369,214 % Chg over Prev YTD -11.8% 19.2% 31.4%
ST.LANDRYSALESTAX
St. Landry Parish sales tax revenue for January with previous month, year, and YTD comparisons.
Note: January sales tax revenue reflects sales activity in December.
Data Source: Tax revenue data from St. Landry Parish School Board. February 2021
January 29.2% Jan. YoY -3.1% Jan. YTD -3.1% January
2018 2019 2020 2021 January $ 6,556,004 $ 7,019,121 $ 8,146,901 $ 7,895,905 December $ 4,743,292 $ 5,373,575 $ 5,662,822 $ 6,109,745 % Chg over Prev Month 38.2% 30.6% 43.9% 29.2% % Chg over Prev Year 7.1% 16.1% -3.1% YTD (Jan - Dec) $ 6,556,004 $ 7,019,121 $ 8,146,901 $ 7,895,905 % Chg over Prev YTD 7.1% 16.1% -3.1%
ST.LANDRYVEHICLESALESTAX
St. Landry Parish vehicle sales tax revenue for January with previous month, year, and YTD comparisons.
Note: January sales tax revenue reflects sales activity in December.
Data Source: Tax revenue data from St. Landry Parish School Board. February 2021
January 8.4% Jan. YoY 5.7% Jan. YTD 5.7% January
2018 2019 2020 2021 January $ 730,772 $ 679,891 $ 814,912 $ 861,140 December (prev year) $ 794,099 $ 735,058 $ 893,669 $ 794,472 % Chg over Prev Month -8.0% -7.5% -8.8% 8.4% % Chg over Prev Year -7.0% 19.9% 5.7% YTD (Jan - Dec) $ 730,772 $ 679,891 $ 814,912 $ 861,140 % Chg over Prev YTD -7.0% 19.9% 5.7%
BUILDINGPERMITS
ALLENPARISHPERMITVALUATIONS
This chart shows the valuation of permits issued by Rapides Area Planning Commission in Allen Parish in January between 2018-2021 with month-tomonth, year-to-year, and year-to-date comparisons.
Data Source: RapidesArea Planning Commission, February, 2021
January 173% Jan. YoY 97% Jan. YTD 97% January 2018 2019 2020 2021 January $ 566,170 $ 728,000 $ 355,919 $ 699,250 December (prev yr) $ - $ 480,000 $ 180,000 $ 256,390 % Chg Prev Month 51.7% 97.7% 172.7% % Chg from Prev Year 28.6% -51.1% 96.5% YTD (Jan - Dec) $ 566,170 $ 728,000 $ 355,919 $ 699,250 % Chg over Prev YTD 28.6% -51.1% 96.5%
AVOYELLESPARISHPERMITVALUATIONS
This chart shows the valuation of permits issued by Rapides Area Planning Commission in Avoyelles Parish in January between 2019-2021 with month-to-month, year-to-year, and year-to-date comparisons.
Data Source: RapidesArea Planning Commission, February 2021.
January -79% Jan. YoY 3009% Jan. YTD 3009% January 2019 2020 2021 January $ 2,645,648 $ 355,919 $ 11,066,424 December (prev yr) $ 1,131,187 $ 2,377,498 $ 53,436,561 % Chg Prev Month 133.9% -85.0% -79.3% % Chg from Prev Year -86.5% 3009.3% YTD (Jan - Dec) $ 2,645,648 $ 355,919 $ 11,066,424 % Chg over Prev YTD -86.5% 3009.3%
EVANGELINEPARISHPERMITVALUATIONS
This chart shows the valuation of permits issued by Rapides Area Planning Commission in Evangeline Parish in January between 2018-2021 with month-tomonth, year-to-year, and year-to-date comparisons.
Data Source: RapidesArea Planning Commission, February 2021.
January -24.0% Jan. YoY -18.9% Jan. YTD -18.9% January 2018 2019 2020 2021 January $ 640,500 $ 255,000 $ 346,673 $ 281,005 December (Prev yr) $ 412,451 $ 715,184 $ 1,599,000 $ 369,600 % Chg Prev Month 55.3% -64.3% -78.3% -24.0% % Chg from Prev Year -60.2% 36.0% -18.9% YTD (Jan - Dec) $ 640,500 $ 255,000 $ 346,673 $ 281,005 % Chg over Prev YTD -60.2% 36.0% -18.9%
PINEVILLEPERMITVALUATIONS
This chart shows the valuation of permits issued by Rapides Area Planning Commission in the City of Pineville in January between 20182021 with month-to-month, year-to-year, and year-to-date comparisons.
Data Source: RapidesArea Planning Commission, February 2021.
January 13.3% Jan. YoY -85.5% Jan. YTD -85.5% January 2018 2019 2020 2021 January $ 273,330 $1,253,600 $ 1,297,500 $ 187,560 December (prev yr) $ 415,000 $ 265,142 $ 155,280 $ 165,600 % Chg Prev Month -34.1% 372.8% 735.6% 13.3% % Chg from Prev Year 358.6% 3.5% -85.5% YTD (Jan - Dec) $ 273,330 $1,253,600 $ 1,297,500 $ 187,560 % Chg over Prev YTD 358.6% 3.5% -85.5%
RAPIDESPARISHPERMITVALUATIONS
This charts shows the valuation of permits issued by Rapides Area Planning Commission in Rapides Parish (excluding Alexandria) in January between 2018-2021 with month-to-month, year-to-year, and year-to-date comparisons.
Data Source: RapidesArea Planning Commission, February 2021.
January 442% Jan. YoY 7822% Jan. YTD 7822% January 2018 2019 2020 2021 January $ 2,675,661 $ 3,246,119 $ 2,468,233 $195,523,179 December (prev yr) $ 2,375,200 $ 2,652,400 $ 837,385 $ 36,064,905 % Chg Prev Month 12.6% 22.4% 194.8% 442.1% % Chg from Prev Year 21.3% -24.0% 7821.6% YTD (Jan - Dec) $ 2,675,661 $ 3,246,119 $ 2,468,233 $195,523,179 % Chg over Prev YTD 21.3% -24.0% 7821.6%
RESIDENTIALCONSTRUCTIONPERMITSBYAREA
New residential construction permit valuation (estimated development cost) issued by Rapides Area Planning Commission by jurisdiction in January 2021 compared to January 2020.
Valuation of New Residential Construction
January 2020 vs January 2021
Note: City ofAlexandria permits are accounted for separately.
Data Source: RapidesArea Planning Commission, February 2021.
Year-over-year value of residential construction in the
jurisdiction. 60% Jan-20 Jan-21 Change % Change Allen $ 699,250 $ 320,000 $ (379,250) -54% Avoyelles $ 902,079 $ (902,079) Pineville $ 125,000 $ (125,000) -100% Evangeline $ 205,694 $ 100,000 $ (105,694) -51% LaSalle $ 770,000 $ 500,000 $ (270,000) Rapides $ 1,518,300 $ 752,088 $ (766,212) -50%
RAPC
ALEXANDRIACOMMERCIALPERMITS
The valuation (estimated development cost) of new commercial construction permits issued by the City of Alexandria in January 2021 with previous month, year, and YTD comparisons.
Data Source: City ofAlexandria Planning Division. February 2021 January -28.9% Jan. YoY 54.6% Jan. YTD 54.6% January 2018 2019 2020 2021 January $ 1,585,773 $ 1,402,884 $ 1,340,555 $ 2,072,746 December (prev year) $ 4,620,147 $ 911,056 $ 2,915,030 % Chg over Prev Month -69.6% 47.1% -28.9% % Chg over Prev Year -11.5% -4.4% 54.6% YTD (Jan - Dec) $ 1,585,773 $ 1,402,884 $ 1,340,555 $ 2,072,746 % Chg over Prev YTD -11.5% -4.4% 54.6%
ALEXANDRIARESIDENTIALPERMITS
The valuation (estimated development cost) of new residential construction permits issued by the City of Alexandria in January 2021 with previous month, year, and YTD comparisons.
Data Source: City ofAlexandria Planning Division. February, 2021 January -35.0% Jan. YoY 21.9% Jan. YTD 21.9% January 2018 2019 2020 2021 January $ 2,185,004 $ 1,402,884 $ 1,207,410 $ 1,472,183 December (prev year) $ 876,542 $ 2,264,942 $ 2,264,942 % Chg over Prev Month #DIV/0! 60.0% -46.7% -35.0% % Chg over Prev Year -35.8% -13.9% 21.9% YTD (Jan - Dec) $ 2,185,004 $ 1,402,884 $ 1,207,410 $ 1,472,183 % Chg over Prev YTD -35.8% -13.9% 21.9%
HOUSING
ALEXANDRIAACTIVELISTINGS

The count of active single-family and condo/townhome listings for Alexandria MSA (excludes pending listings) for January 2018-2021 with month-to-month and year-over-year comparisons.
Active listings decreased 54% since January 2020.
Data Source: Realtor.com. Retrieved from FRED, Federal Reserve Bank of St. Louis. February 8, 2021 January -12.3% Jan YoY -53.6% 2018 2019 2020 2021 January 458 467 459 213 December (prev year) 482 488 466 243 % Chg Prev Month -5.0% -4.3% -1.5% -12.3% % Chg from Prev Year 2.0% -1.7% -53.6% January
200 250 300 350 400 450 500 550 600 2016-07-01 2017-02-01 2017-09-01 2018-04-01 2018-11-01 2019-06-01 2020-01-01 2020-08-01 Active Listings Count in Alexandria July 2016 - January 2021
ALEXANDRIAPENDINGLISTINGS
The count of pending single-family and condo/townhome listings for Alexandria MSA for January 2018-2021 with month-to-month and year-over-year comparisons. Data
Pending Listing Count in Alexandria
Pending listings increased 155% since January 2020, from 71 to 181.

Source: Realtor.com. Retrieved from FRED, Federal Reserve Bank of St. Louis. February 7, 2021 January 4.6% Jan YoY 155% 2018 2019 2020 2021 January 105 127 71 181 December (prev year) 116 126 100 173 % Chg Prev Month -9.5% 0.8% -29.0% 4.6% % Chg from Prev Year 21.0% -44.1% 154.9% January
0 50 100 150 200 250 300 2016-07-01 2017-07-01 2018-07-01 2019-07-01 2020-07-01
July 2016 - January 2021
ALEXANDRIAMEDIANDAYSONMARKET

The median number of days property listings spend on the market in Alexandria MSA for January 2018-2021 with month-to-month and year-over-year comparisons.
Median days on the market decreased 1.6% since January 2020 and up 4% for the month.
Data Source: Realtor.com. Retrieved from FRED, Federal Reserve Bank of St. Louis. February 7, 2021 January 3.9% Jan YoY -1.6% 2018 2019 2020 2021 January 95 108 96 94 December (prev year) 88 105 95 91 % Chg Prev Month 7.4% 2.4% 1.1% 3.9% % Chg from Prev Year 13.8% -11.2% -1.6% January
50 60 70 80 90 100 110 120 2016-07-01 2017-07-01 2018-07-01 2019-07-01 2020-07-01 Median Days on Market in Alexandria July 2016 - December 2020
ALEXANDRIAMEDIANLISTINGPRICE

The median listing price of houses in Alexandria MSA for January 2018-2021 with month-to-month and year-over-year comparisons.
The median listing price increased 16.7% since January 2020 from $179,950 to $210,050, but fell 2.4% since last month.
Data Source: Realtor.com. Retrieved from FRED, Federal Reserve Bank of St. Louis. February 7, 2021. January -2.4% Jan YoY 16.7% 2018 2019 2020 2021 January $ 187,050 $ 179,550 $ 179,950 $ 210,050 December (prev year) $ 179,950 $ 175,050 $ 179,950 $ 215,250 % Chg Prev Month 3.9% 2.6% 0.0% -2.4% % Chg from Prev Year -4.0% 0.2% 16.7% January
$170,000 $180,000 $190,000 $200,000 $210,000 $220,000 $230,000 $240,000 2016-07-01 2017-07-01 2018-07-01 2019-07-01 2020-07-01 Median Listing Price in Alexandria July 2016 - January 2021
ALEXANDRIAAVERAGELISTINGPRICE

The average listing price of houses in Alexandria MSA for January 2018-2021 with month-to-month and year-over-year comparisons.
The average listing price increased 23% since January 2020 from $217,927 to $267,908, but fell 0.1% since last month.
Data Source: Realtor.com. Retrieved from FRED, Federal Reserve Bank of St. Louis. February 7, 2021. January 0.1% Jan YoY 22.9% 2018 2019 2020 2021 January $ 234,620 $ 225,096 $ 217,927 $ 267,908 December (prev year) $ 233,825 $ 217,712 $ 221,831 $ 267,747 % Chg Prev Month 0.3% 3.4% -1.8% 0.1% % Chg from Prev Year -4.1% -3.2% 22.9% January
$200,000 $210,000 $220,000 $230,000 $240,000 $250,000 $260,000 $270,000 $280,000 $290,000 2016-07-01 2017-07-01 2018-07-01 2019-07-01 2020-07-01 Average Listing Price in Alexandria July 2016 - January 2021
MORTGAGEDELINQUENCIESINLOUISIANA


This chart represents non-current mortgages (delinquencies) in Louisiana and the U.S. during 2020 and 2021.
Delinquency Rate in December
U.S. 6.08% LA 10.30% Louisiana’s non-current mortgage delinquency rate dropped 1.5% from its pandemic high of 11.8% in May.
Nationally, mortgage delinquencies improved for the seventh consecutive month in December 2020, falling to 6.08% in December 2020 from a pandemic high of 7.80% in May 2020.
Data Source: Mortgage Monitor Reports October 2019 – October 2020, Black Knight Financial Technology Solutions, February 7, 2021.
7.2% 7.2% 7.5% 10.9% 11.8% 11.7% 10.8% 11.3% 11.2% 11.0% 10.7% 10.3% 3.2% 3.3% 3.4% 6.5% 7.8% 7.6% 6.9% 6.9% 6.7% 6.4% 6.3% 6.1% 0% 2% 4% 6% 8% 10% 12% 14% January-20 March-20 May-20 July-20 September-20 November-20 Non-Current Mortgages in Louisiana 2020-2021 Louisiana U.S.
TRAVEL
AVOYELLESHOTELOCCUPANCYTAX
Avoyelles Parish hotel occupancy tax revenue for January with previous month, year, and year-to-date comparisons.
Note: December tax revenue reflects hotel occupancy activity in November. Hotel occupancy tax revenue is used as a proxy for hotel occupancy rate.
Data Source: Avoyelles Parish School Board. February 22, 2021.
January -6.9% Jan. YoY -14.0% Jan. YTD -14.0% January 2017 2018 2019 2020 2021 January $ 9,660 $ 7,894 $ 8,274 $ 7,801 $ 6,711 December (prev year) $ 9,155 $ 10,418 $ 8,243 $ 11,221 $ 7,208 % Chg over Prev Month 5.52% -24.22% 0.38% -30.48% -6.89% % Chg over Prev Year -18.28% 4.81% -5.72% -13.97% YTD (Jan - Dec) $ 9,660 $ 7,894 $ 8,274 $ 7,801 $ 6,711 % Chg over Prev YTD -18.28% 4.81% -5.72% -13.97%
RAPIDESHOTELOCCUPANCYTAX
Rapides Parish hotel occupancy tax revenue for January 2020 with previous month, year, and YTD comparisons.
Note: January tax revenue reflects hotel occupancy activity in December. Hotel occupancy tax revenue is used as a proxy for hotel occupancy rate.
Data Source: Rapides Parish Police Jury Treasurer’s Reports, February 2021.
January -24.2% Jan. YoY -7.3% Jan. YTD -7.3% 2018 2019 2020 2021 January $ 92,719 $ 114,162 $ 135,281 $ 125,361 December (prev year) $ 135,994 $ 146,634 $ 156,863 $ 165,394 % Chg over Prev Month -31.8% -22.1% -13.8% -24.2% % Chg over Prev Year 23.1% 18.5% -7.3% YTD (Jan - Dec) $ 92,719 $ 114,162 $ 135,281 $ 125,361 % Chg over Prev YTD 23.1% 18.5% -7.3% January 0 50 100 150 200 250 300 Thousands Hotel Occupancy Tax Revenue 2019-2021 2019 2020 2021
PASSENGERTRAFFICATLOUISIANAAIRPORTS
This chart shows total passenger throughput at Louisiana airports and nationwide in January 2021 as a percent of traffic a year ago. AEX is the solid black line.
Passenger Throughput as a Percent a Year Ago AEX vs Nationwide (January 2021)

Airport % of 2020 Traffic US 38% AEX 56% MSY 32% BTR 43% LCH 57% LFT 55% MLU 50% SHV 45% 0% 20% 40% 60% 80% 100% 120% 140% 1/1/2021 1/2/2021 1/3/2021 1/4/2021 1/5/2021 1/6/2021 1/7/2021 1/8/2021 1/9/2021 1/10/2021 1/11/2021 1/12/2021 1/13/2021 1/14/2021 1/15/2021 1/16/2021 1/17/2021 1/18/2021 1/19/2021 1/20/2021 1/21/2021 1/22/2021 1/23/2021 1/24/2021 1/25/2021 1/26/2021 1/27/2021 1/28/2021 1/29/2021 1/30/2021 1/31/2021
Data Source: Alexandria International Airport, February 2021
US AEX MSY BTR LCH LFT MLU SHV
AIRTRAVELERSTATS

Nationwide air passenger traffic in January 2021 was 38% of last year’s level.
Passenger traffic hit a new pandemic high at 61% of 2019 levels on Dec. 23rd, before falling to 44% on January 31, 2021.
Nationwide daily percentage of passengers passing through current TSA checkpoints expressed as a percentage of previous year’s traffic. Data
TSA Airport Total Traveler Throughput as a Percent of Previous Year
Source: DHS, Transportation Security Administration, https://www.tsa.gov/coronavirus/passenger-throughput, February 7, 2021
0% 20% 40% 60% 80% 100% 120% 3/1/2020 4/1/2020 5/1/2020 6/1/2020 7/1/2020 8/1/2020 9/1/2020 10/1/2020 11/1/2020 12/1/2020 1/1/2021 Passengers
LOCAL& LOUISIANA
NEWBUSINESSESINCENLA


The chart on the left represents the number of new businesses established each month in Rapides from January 2018 through January 2021, while the chart of the right represents the number of new businesses established annually from 2016-2020.
The number of new businesses established in Rapides in January 2021 was 14% below a year ago, but 54% higher than in January 2018.
New businesses established in Rapides decreased 5.9% in 2020 compared to 2019.
Data Source: Rapides Parish Sales and Use Tax Department, February 2, 2021. 0 5 10 15 20 25 30 35 40 45 50 Jan Feb Mar Apr May Jun Jul Aug Sep Oct Nov Dec New Businesses in Rapides 2019 2020 2021 548 640 494 427 402 0 100 200 300 400 500 600 700 2016 2017 2018 2019 2020 Total New Businesses in Rapides
CONSUMERSPENDINGINLOUISIANA
These graphs represents the percent change in average consumer credit and debit card spending in Louisiana as of January 31, 2021 with January 2020 as the baseline.
• Total consumer spending in Louisiana is up 9.5% compared to January 2020, with retail spending up 37% while entertainment and recreation spending is down 49%. Grocery spending was up 10.1%, health care up 12.7%, and restaurants down-3.4%.
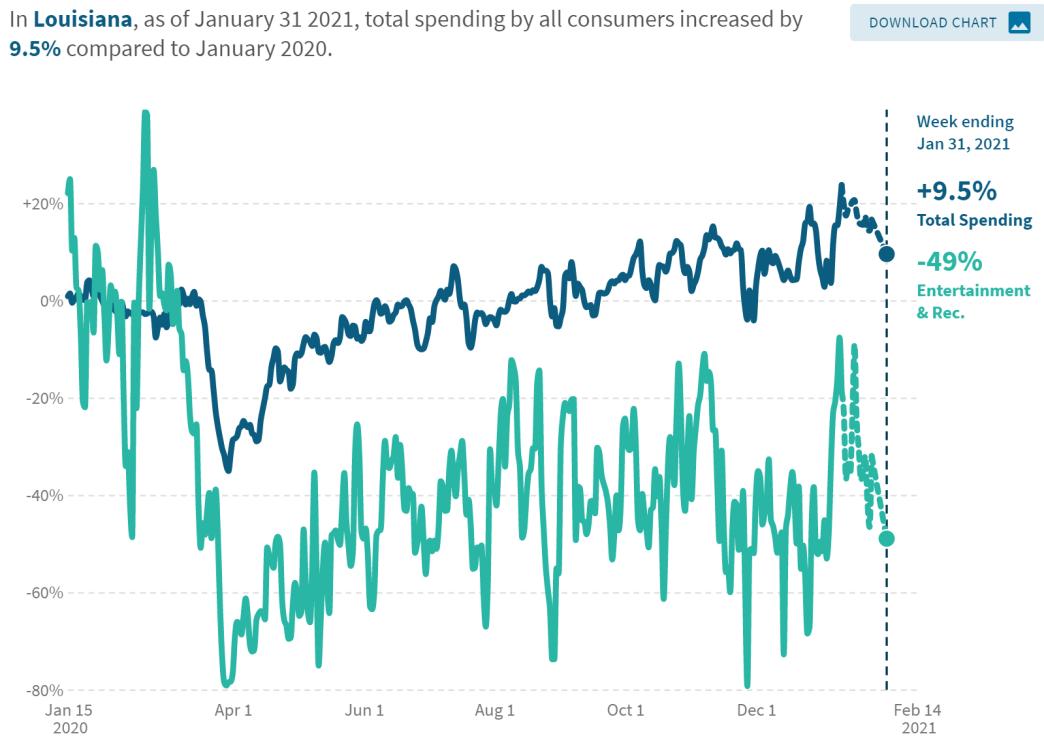
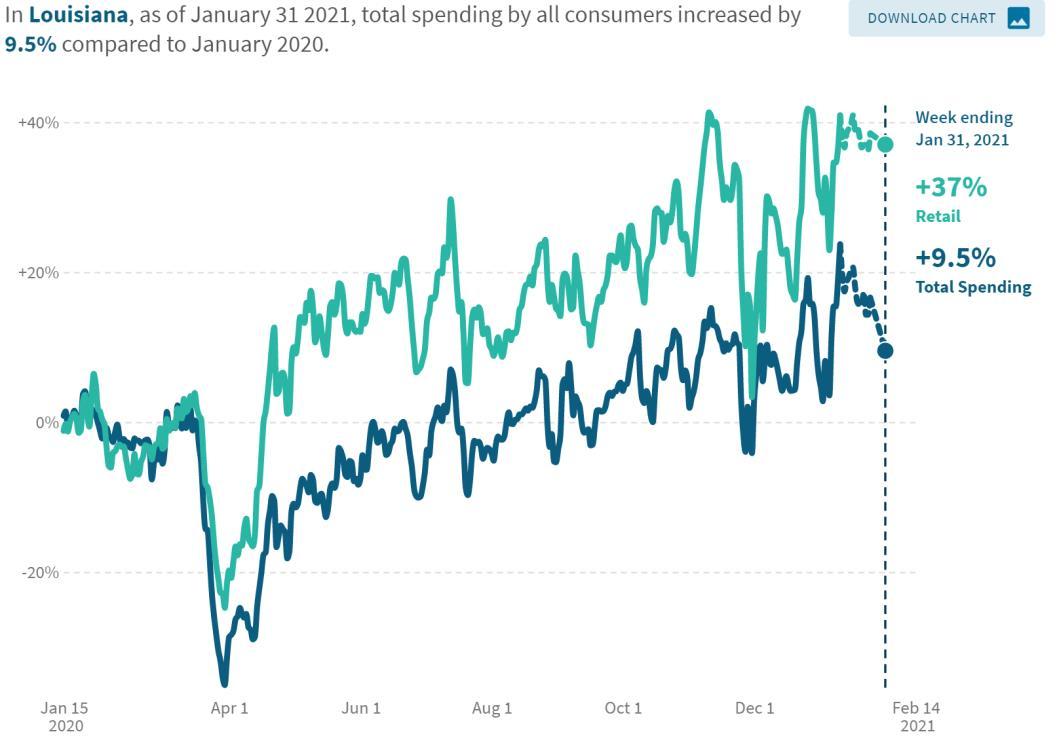
Data Source: Opportunity Insights Economic Tracker, https://www.tracktherecovery.org/. Data Source: Affinity Solutions. Retrieved February 13, 2021
ALLCONSUMERSPENDINGINCENLA
The table and chart represents the percent change in average consumer credit and debit card spending in Cenla as of January 31, 2021 with January 2020 as the baseline, while the chart represents Rapides.
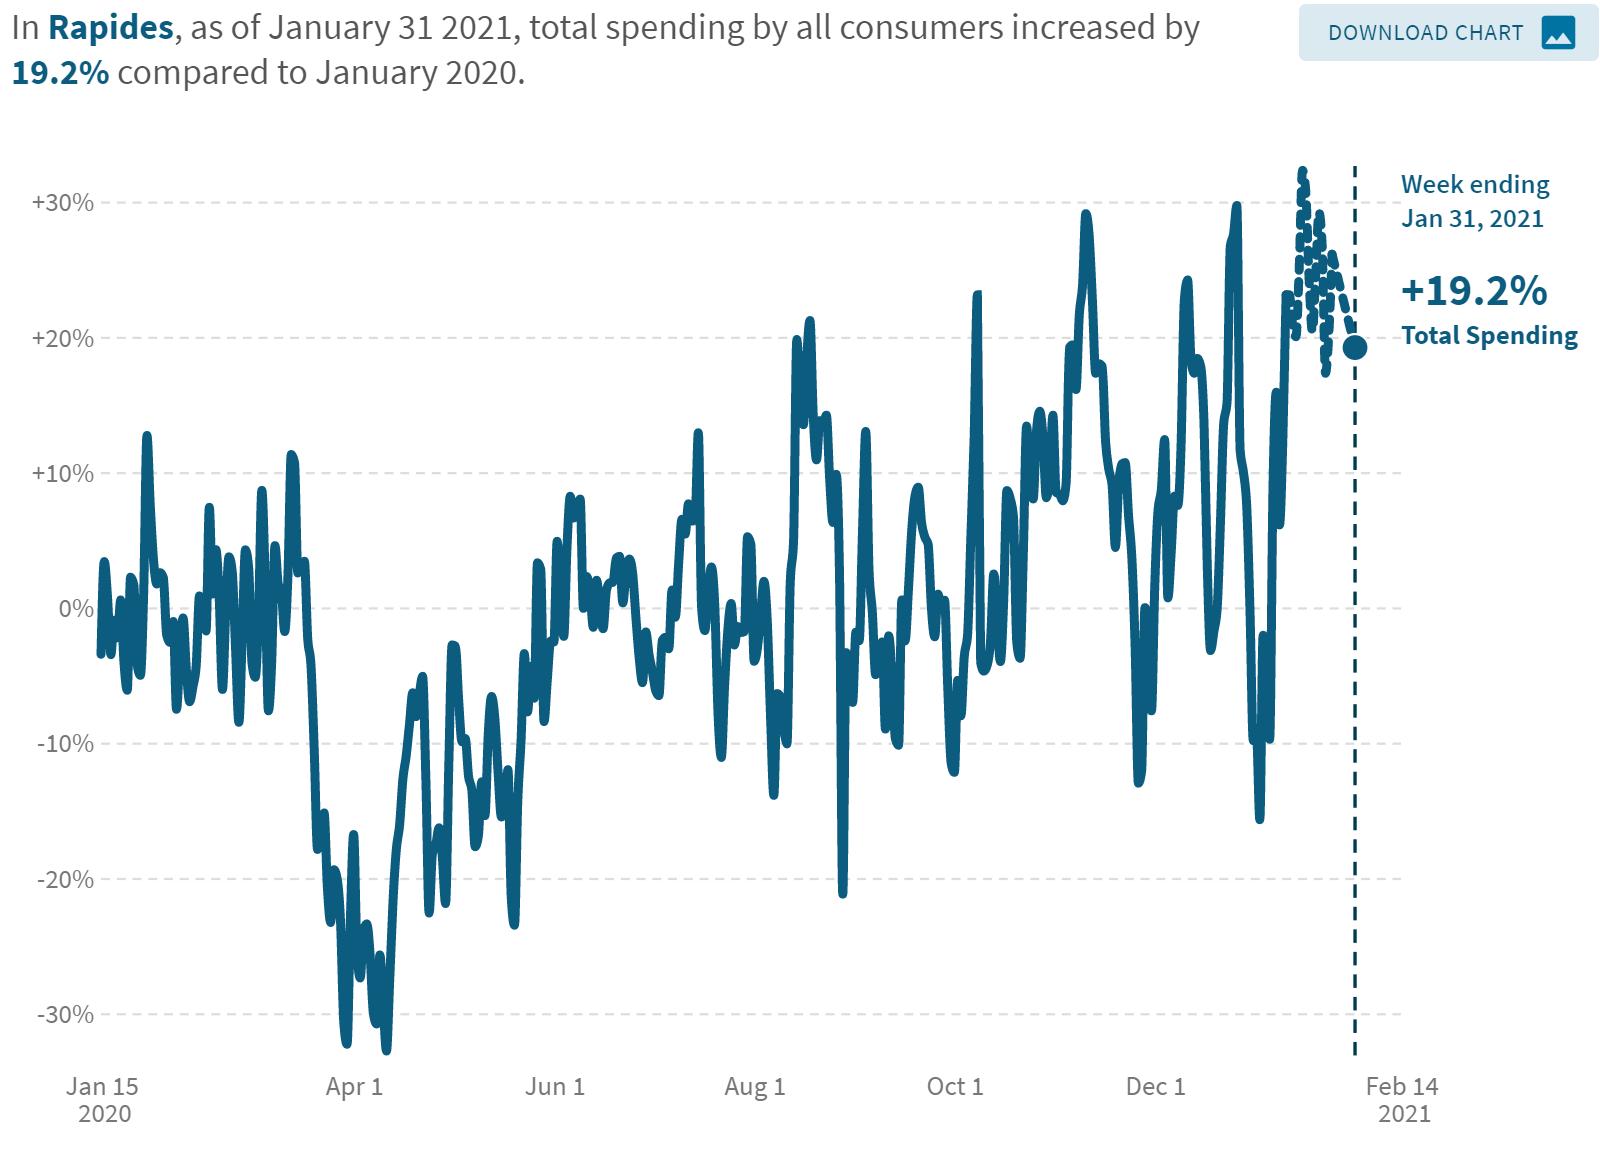
Data Source: Opportunity Insights Economic Tracker, https://www.tracktherecovery.org/. Data Source: Affinity Solutions. Retrieved February 13, 2021 Catahoula -12.7% Evangeline -3.2% Grant 27.0% LaSalle 13.0% Rapides 19.2% St. Landry -4.8% Louisiana 9.5%
SMALLBUSINESSREVENUEINLOUISIANA
The chart below represents the percent change in small business revenue in Louisiana as of February 4, 2021 with January 2020 as the baseline. The table shows the percentage change for small business revenue by industry.
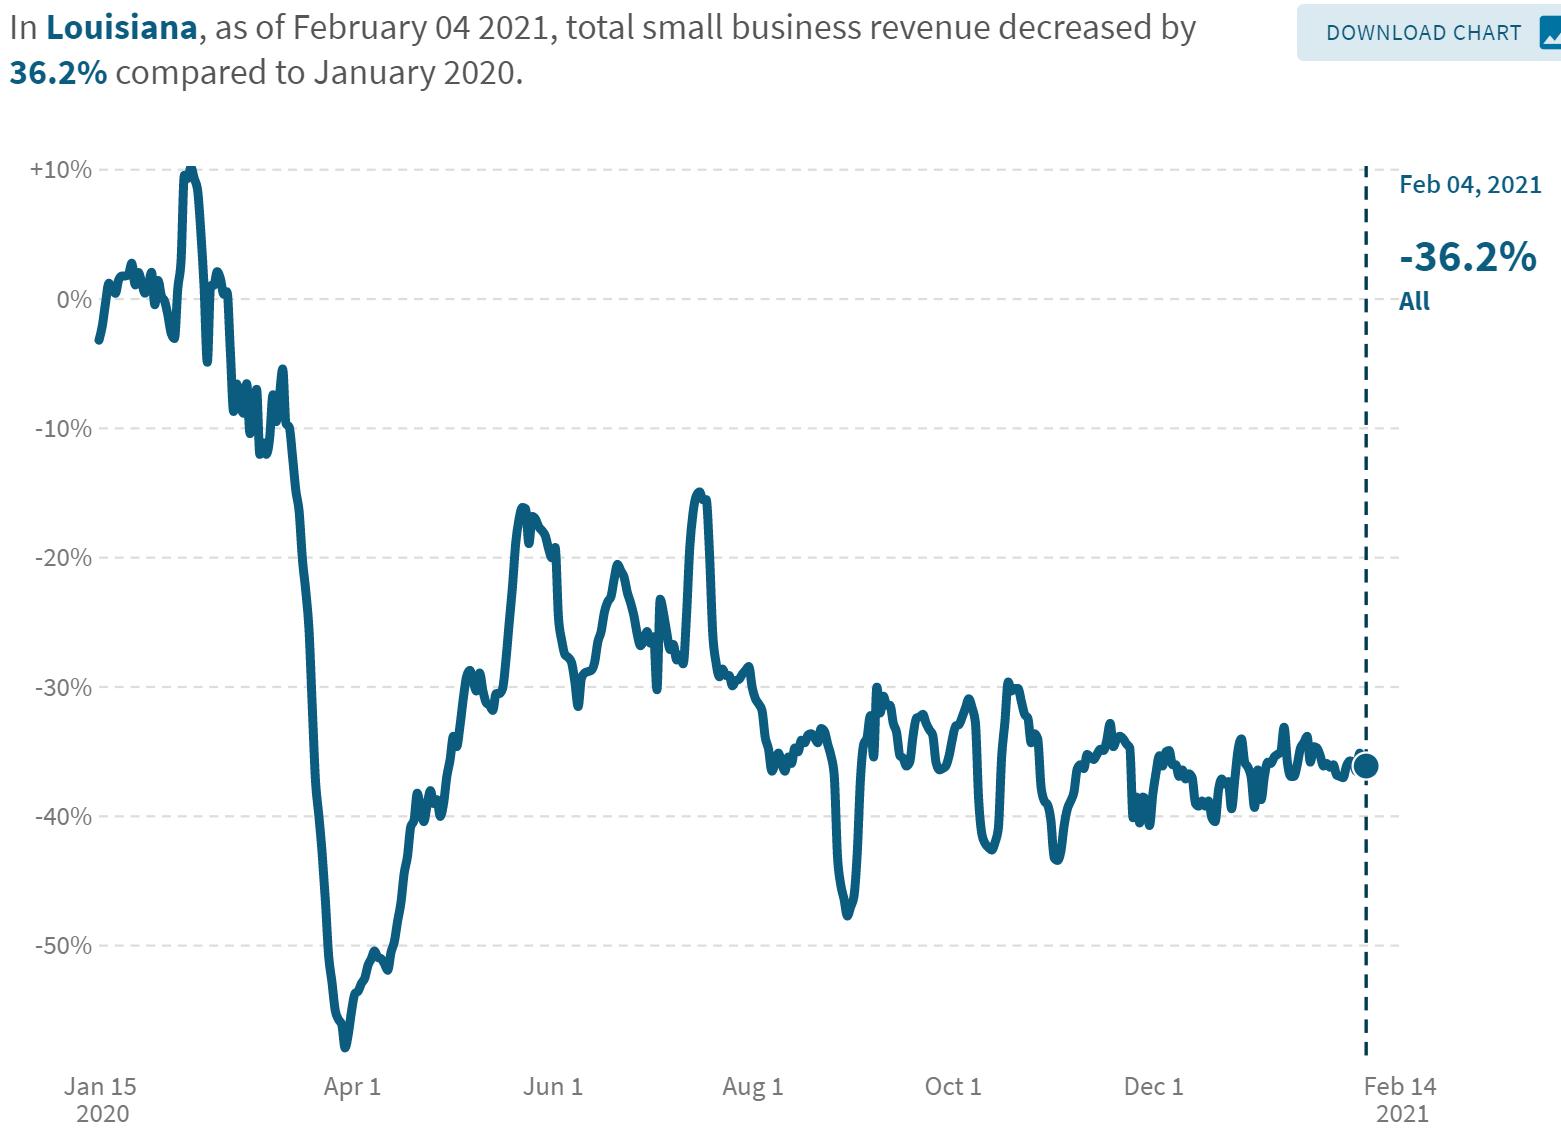
Source: Opportunity Insights Economic Tracker, https://www.tracktherecovery.org/ Date Source: Womply. Retrieved February 13, 2021. Industry % Change Education & Health Services -19.5% Retail -22.3% Leisure & Hospitality Professional -71% -14.3%
SMALLBUSINESSREVENUEINCENLA
The chart below represents the percent change in small business revenue in Louisiana and Cenla as of February 4, 2021 with January 2020 as the baseline. The table shows the percentage change for small business revenue by industry.
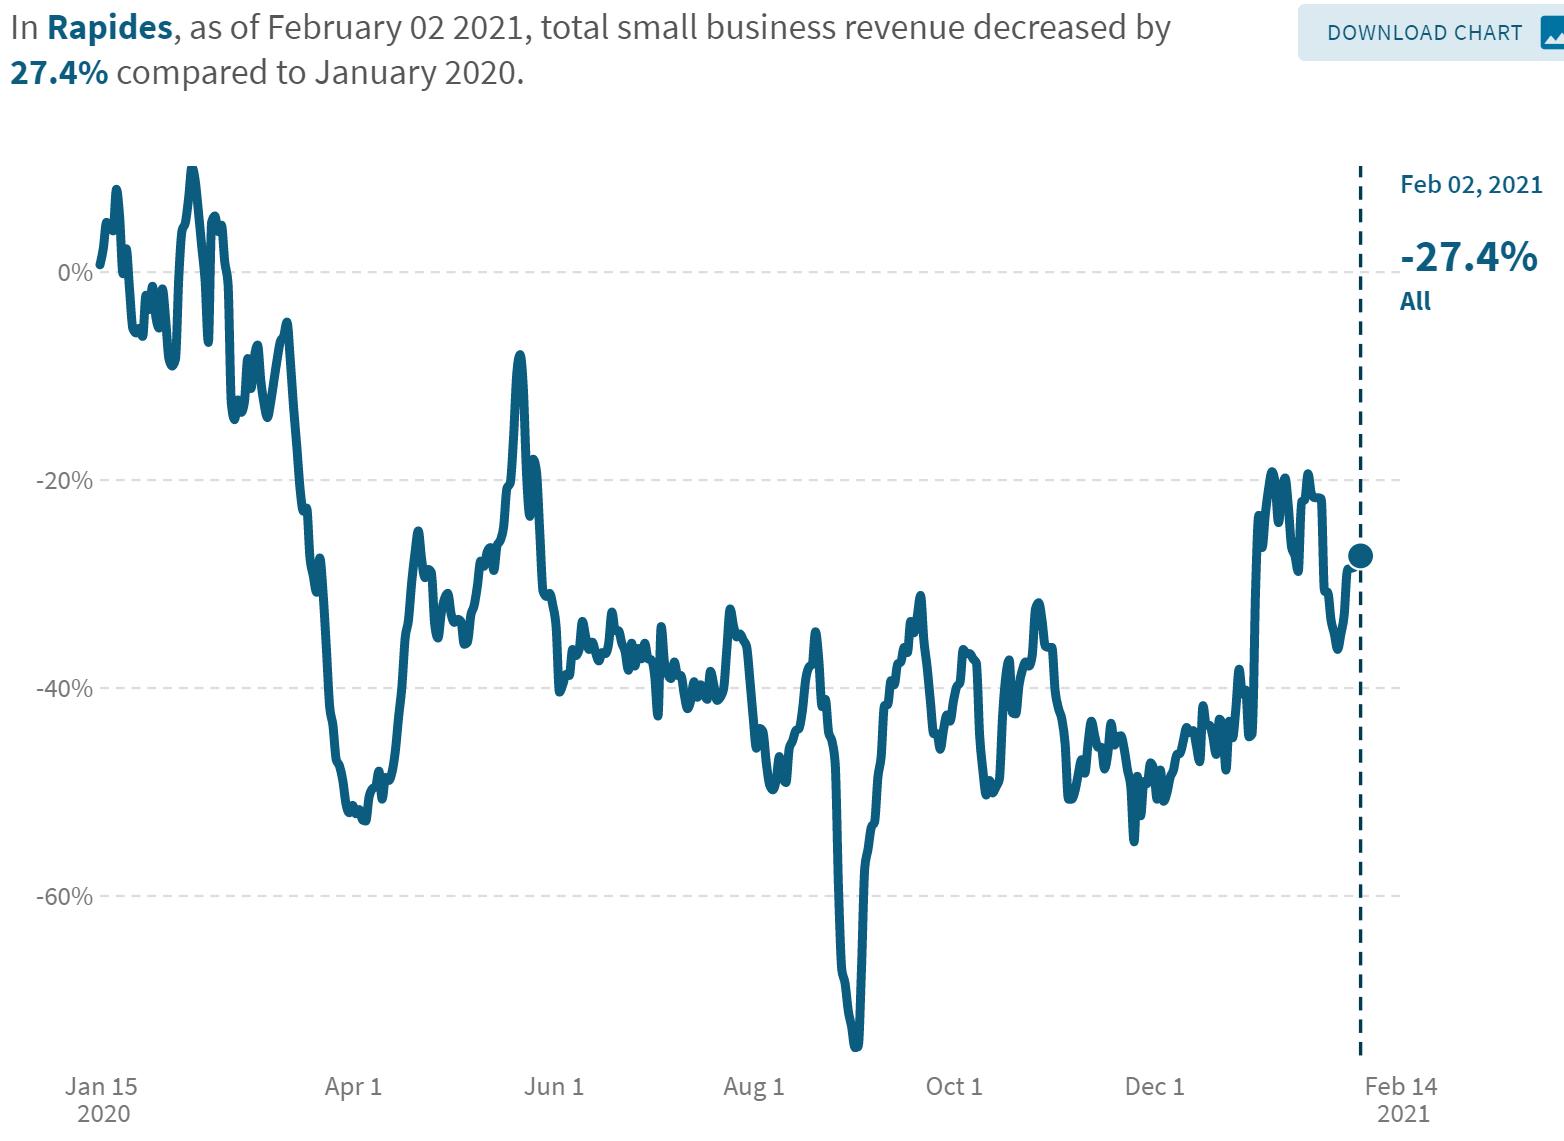
Source: Opportunity Insights Economic Tracker, https://www.tracktherecovery.org/ Date Source: Womply. Retrieved February 13, 2021. % Change Avoyelles -40.1% Concordia -18.5% Evangeline -74.8% La Salle -33.3% Natchitoches -51.7% Rapides -27.4% St. Landry -14.1%
SMALLBUSINESSREVENUEBYZIPCODE
The chart on the left represents the percent change in small business revenue by zip code as of February 2, 2021 with January 2020 as the baseline. The graphic on the right is a visual representation of the percentage change for small business revenue by zip code.
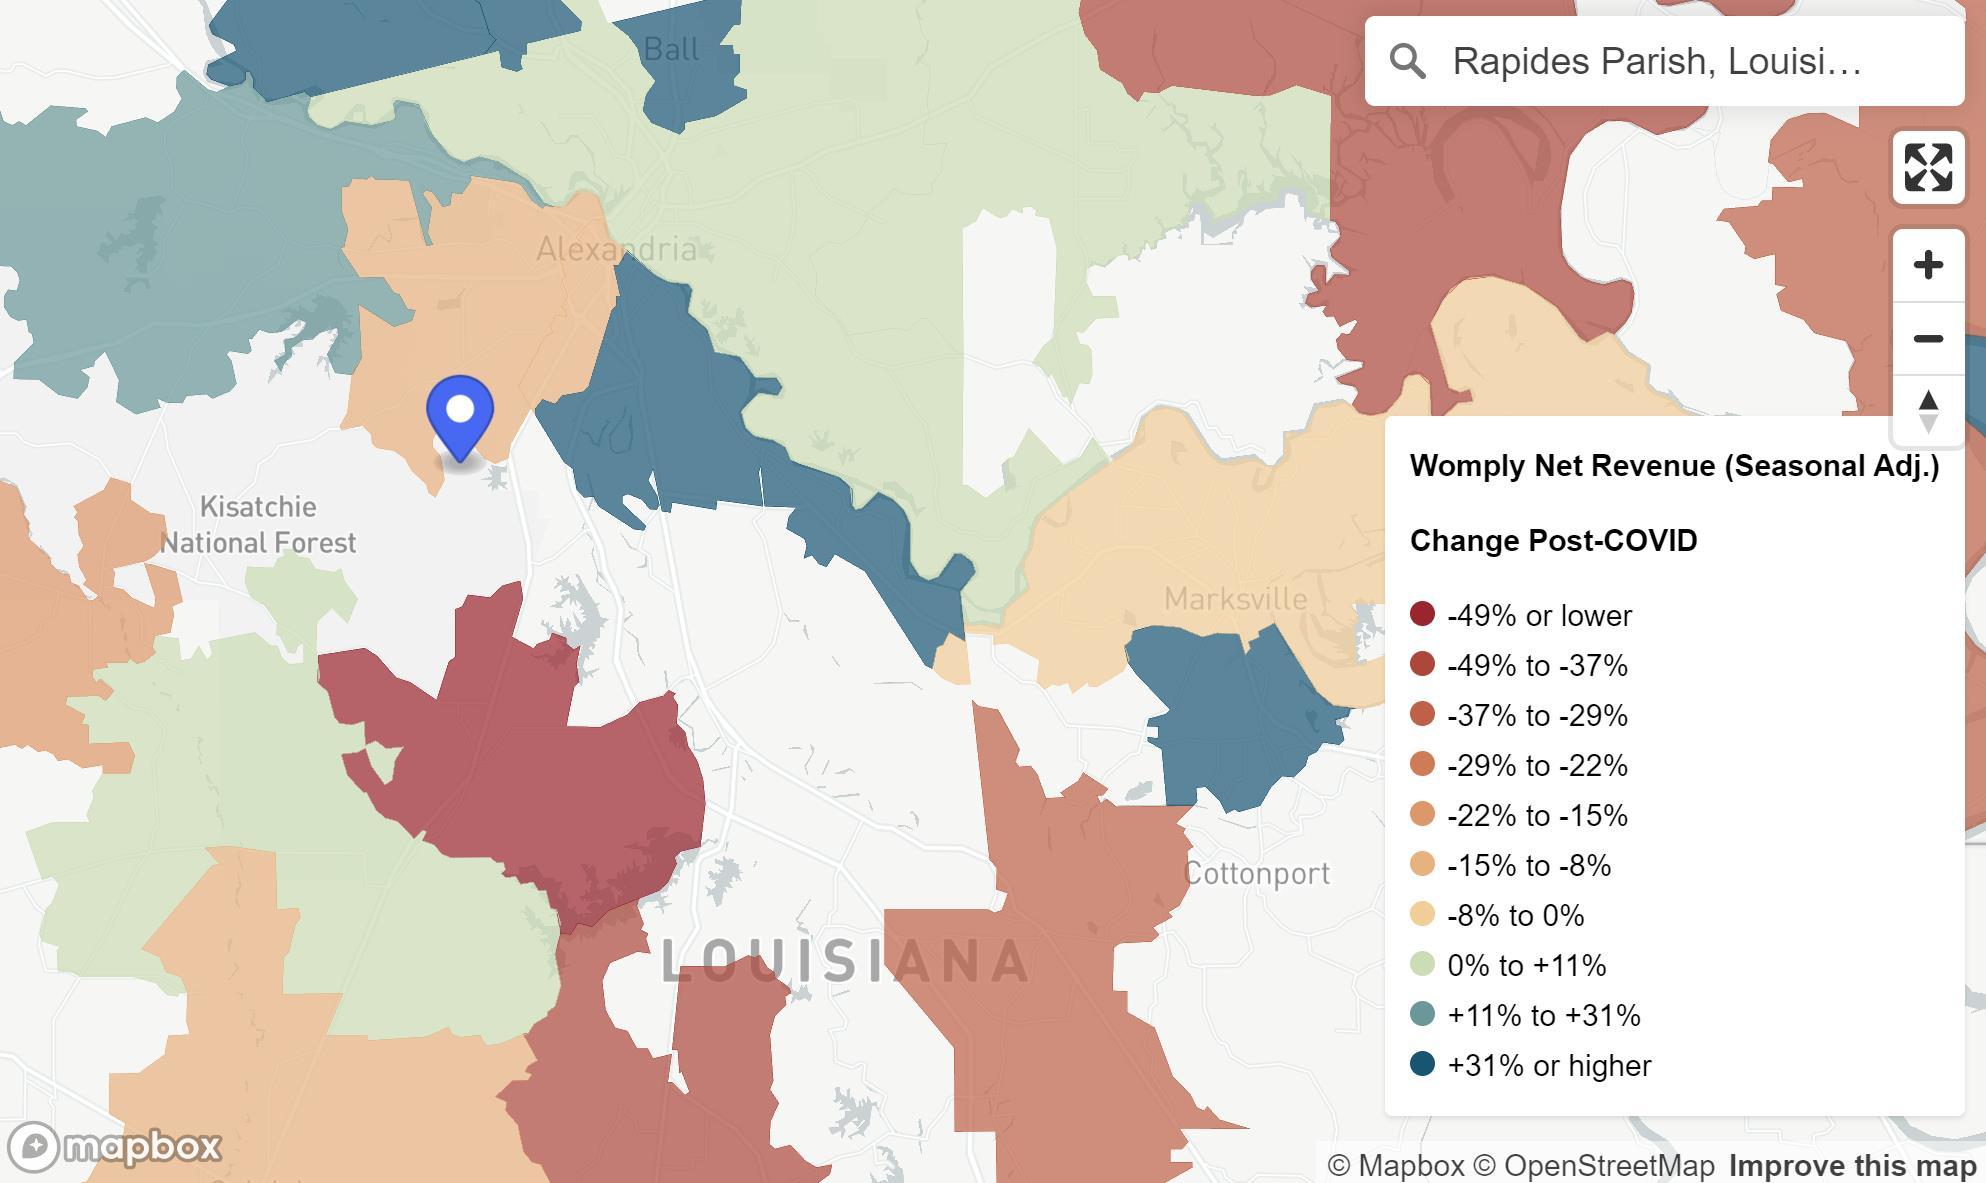
Source: Opportunity Insights Economic Tracker, https://www.tracktherecovery.org/ Date Source: Womply. Retrieved February 13, 2021. Zip Code % Change 71302 56% 71303 -11% 71409 14% 71360 10% 71433 4% 71430 -50% 71328 3% 71350 61% 71322 -35% 71405 38%
SMALLBUSINESSESOPENINLA&RAPIDES
The chart below represents the percent change in the number of small businesses open in Louisiana and Rapides as of February 2, 2021 with January 2020 as the baseline.
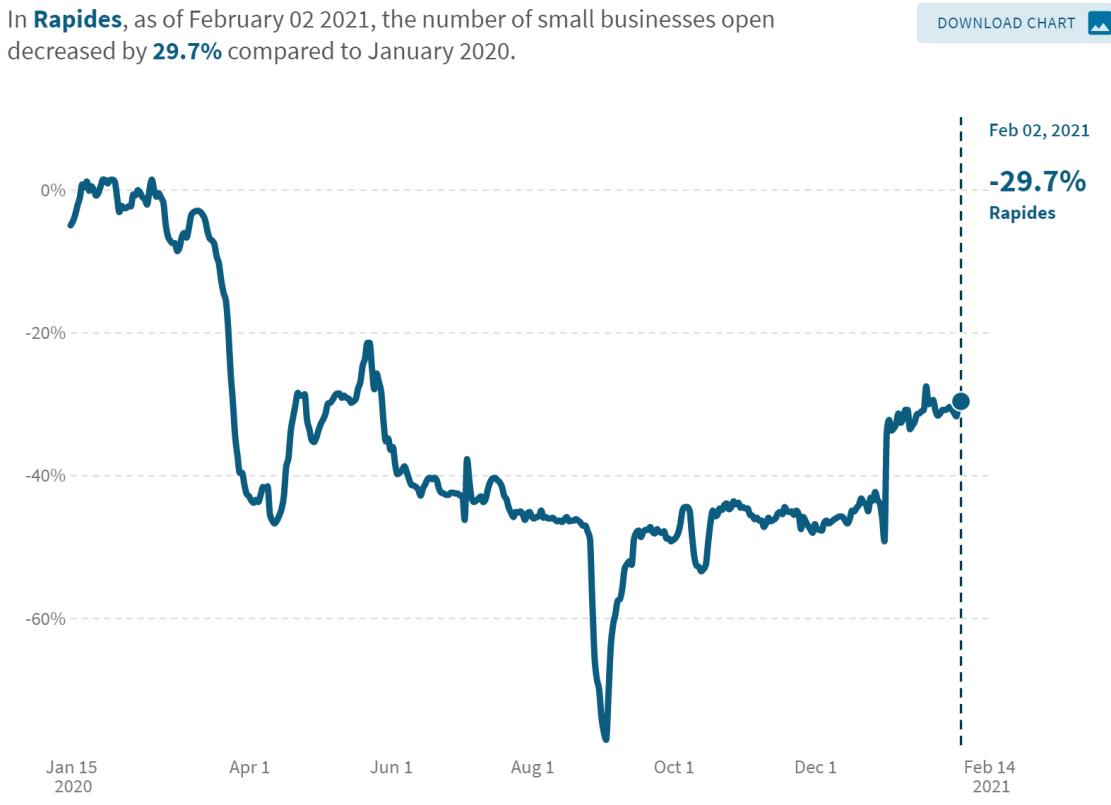
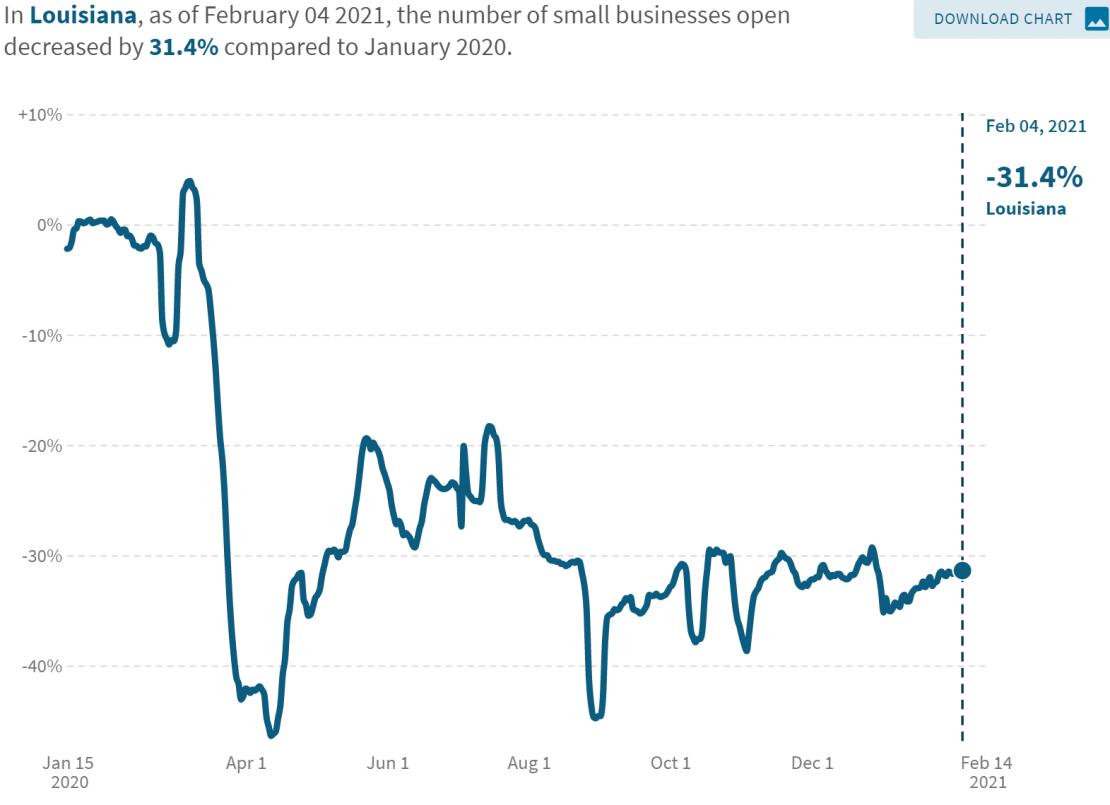
Source: Opportunity Insights Economic Tracker, https://www.tracktherecovery.org/ Date Source: Womply. Retrieved February 13, 2021.
COINCIDENTECONOMICACTIVITYINDEX
The Coincident Economic Activity Index for Louisiana includes four indicators: nonfarm payroll employment, the unemployment rate, average hours worked in manufacturing and wages and salaries. The index is set to match the trend for gross state product.
• The chart shows the impact of COVID-19 on the Louisiana’s gross state product since December 2019.
Index for December increased 0.4% over November, indicating continued strength in the economy.
Coincident Economic Activity Index for Louisiana December 2019 - December 2020
Data Source: FRED Economic Data, Federal Reserve Bank of St. Louis, February 13, 2021. https://fred.stlouisfed.org/series/LAPHCI

109.9 110.1 110.4 108.5 95.6 95.3 99.4 100.9 102.8 103.5 103.7 105.0 105.5 85 90 95 100 105 110 115 2019-12-01 2020-02-01 2020-04-01 2020-06-01 2020-08-01 2020-10-01 2020-12-01 Index
LOUISIANAGASOLINESALES
Total gasoline sales in Louisiana since 2019.


In November 2020, Louisiana gasoline sales decreased -5.1% from October and was 7.0% below November 2019.
Gasoline sales in LA exceeded 2019 in only two month – January and August.
Year-to-date gasoline sales were down 5.9% in 2020 compared to 2019.
Data Source: U.S. Energy Information Administration, February 15, 2021
4,000 5,000 6,000 7,000 8,000 Thousands of Gallons / Day
2019 2020
Gasoline Sales in Louisiana
BAKERHUGHESRIGCOUNT


Source: Baker Hughes, https://rigcount.bakerhughes.com/na-rig-count, February 15, 2021
Represents the number of drilling rigs actively exploring for or developing oil or natural gas in Louisiana and the U.S.
Jan 20 Dec 20 Jan 21 N. LA-Land 31 27 29 1 1 2 S. LA-Land 3 0 0 S. LA-Offshore 20 13 15 TOTAL LOUISIANA 55 41 45 TOTAL US 791 339 363
Louisiana
rig
a
0 10 20 30 40 50 60 70 0 100 200 300 400 500 600 700 800 900 3-Jan 3-Feb 3-Mar 3-Apr 3-May 3-Jun 3-Jul 3-Aug 3-Sep 3-Oct 3-Nov 3-Dec 3-Jan Louisiana Rig Count US Rig Count Rig Count in Louisiana & US 2020-2021
Exploration rig count in
increased 9.7% in January. Likewise, the
count nationwide increased 7% from
month ago.
LOUISIANAGAMINGREVENUE
Gaming revenue in Louisiana for December 2020 with previous month and year comparisons.
Data Source: Louisiana Gaming Control Board, February 10, 2021. http://lgcb.dps.louisiana.gov/revenue_reports.html
December 5.7%
2020 Dec. YoY -17.9% 19-Dec 20-Nov 20-Dec % Change MoM % Change YoY Video Poker $53,219,772 $52,915,009 $54,498,613 3.0% 2.4% Riverboat $154,877,083 $114,650,875 $121,903,398 6.3% -21.3% Landbased $26,418,312 $14,746,624 $16,513,895 12.0% -37.5% Slots $29,083,083 $22,411,632 $23,457,363 4.7% -19.3% Total $263,598,250 $204,724,140 $216,373,269 5.7% -17.9%
December
NATIONAL
NATIONALECONOMICINDICATORS
Monthly U.S. economic indicators for December 2020.
Data Source: U.S. Census, https://www.census.gov/economic-indicators/, February 15 2021.
Indicator Nov-20 Dec-20 Monthly Wholesale Trade 0.0% 0.3% Manufacturers Shipments, Inventories, and Orders 1.3% 1.1% Construction Spending 1.1% 1.0% Advance Monthly Wholesale Inventories 0.0% 0.1% Advance Monthly Retail Inventories 0.8% 1.0% Advance Durable Goods Manf. Shipments, Inventories, and Orders 1.2% 0.2% New Residential Sales 3.1% 5.8% New Residential Construction -12.6% 1.6% Advance Monthly Sales for Retail and Food Services -1.4% -0.7% Durable Goods 0.2% Residential Sales 5.8% Residential Construction 1.6%
CONTRIBUTORS
The data presented throughout the CENLA Economic Dashboard reflects contributions from the following local organizations.
• Rapides Parish Policy Jury Treasurer
• Avoyelles Parish School Board
• Alexandria InternationalAirport
• Rapides Area Planning Commission
• City ofAlexandria Planning Division
• Evangeline Parish Sales Tax Commissioner
• Concordia, Catahoula, & La Salle TaxAdministrator
• Louisiana Office of Public Health, Region 6
• St. Landry Parish School Board
THANKYOU
Also, special thanks to the following partners for distributing the dashboard.
Next Issue: Week of March 14th
• LSUAFoundation
• Central Louisiana Regional Chamber of Commerce
• Marksville Chamber of Commerce
• Bunkie Chamber of Commerce
• Evangeline Chamber of Commerce
• St. Landry Chamber of Commerce
Current and past issues of the CENLA Economic Dashboard can be found at http://www.lsua.edu/coronavirus/cenla-economic-dashboard/