CENLA ECONOMIC DASHBOARD
December 11, 2020.
Dr. Randall Dupont Dean,College of BusinessLouisiana State University of Alexandria
rdupont@lsua.edu


December 11, 2020.
Dr. Randall Dupont Dean,College of BusinessLouisiana State University of Alexandria
rdupont@lsua.edu
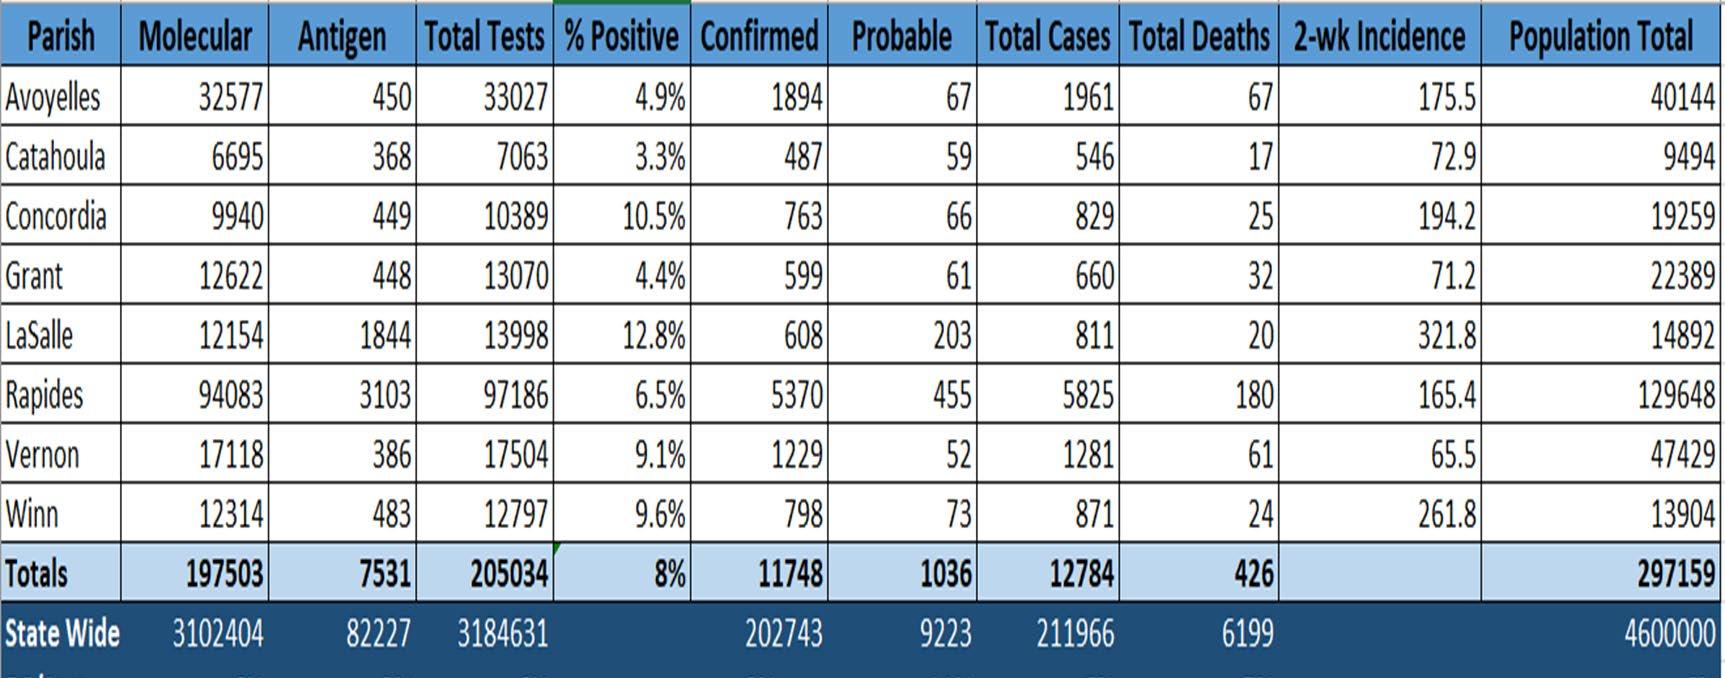
• The positivity rate for COVID-19 in Region 6 stood at 8%.
• Contact tracing in Region 6 reached 58%% individuals testing positive for COVID. 61% denied having any close contact in the two weeks prior to their positive results.
• In Region 6, the 7-day average percent positivity was 7.80% on November 25 and hospitalizations per capita in Region 6 are increasing over the last 14 days.
• Statewide, average weekly initial unemployment claims filed in November fell from 11,717 in October to 10,500, a 10% decrease. Average weekly continued unemployment claims in November fell from 150,363 in October to 87,209, a 42% decrease.
• In CENLA, the average weekly initial unemployment claims in central Louisiana rose slightly from 570 in October to 587 November. Average weekly continued unemployment claims in central Louisiana fell from 9,439 in October to 6,031 in November, a 36% decline.
• At 6.8%, the Alexandria MSA had the lowest unemployment rate among the state’s major metro areas in November for the sixth straight month, well below the state’s 9.3% rate.
• Louisiana’s unemployment rate rose 1.1% in October to 9.3% from 8.2% in September.
• In October, parishes in central Louisiana had an average unemployment rate of 7.9% compared to 9.3% statewide.
• Alexandria metro area continued to have the tightest labor market in the state in October with only 0.89 unemployed person per job opening compared to 2.33 statewide.
• Job openings in the Alexandria MSA in October decreased 7.9% from October.

• Sales taxes for Ball, Boyce, Cheneyville, Glenmore, Lecompte, and Woodworth decreased in October. However, all towns reported a year-to-date increase except Cheneyville.
• All nine jurisdictions in central Louisiana reported lower tax revenues in November, reflecting decreased consumer spending in October. Alexandria and Pineville had decreases of 10%, while Avoyelles had the smallest decline at 4.9%.
• All reporting jurisdictions have increased tax revenues yearto-date except Concordia and LaSalle.
• October vehicle sales was mixed. Vehicle sales remain positive from the year in Cenla compared to last year.
• Rapides vehicle sales tax data for October was not available this month.
• Rapides Parish permit valuations were down 24% in November compared to October and are down 37% so far this year.
• Residential construction permits in the Rapides Planning Area in November are down 34% over the same month last year.
• In Alexandria, commercial permit valuations are up 44% in November while residential permits are down 44%. Both running 30% lower for the year.
• Indicators point to a slowing but still robust housing market in the Alexandria metro area. Compared to November of last year, active listings are down 45%, pending listings are up 25%, and median days on the market are down 10%.
• The median listing price is up 23% while the average price is up 25% of the past year.
• Louisiana’s non-current mortgage delinquency rates in October stood at 11% compared to 6.4% nationally. Louisiana has the 2nd highest delinquency rate in the nation.
• Hotel occupancy in Rapides decreased 8% in October compared to a month earlier and was 58% above the October 2019 level. Year-to-date Rapides and Avoyelles hotel occupancy remains 6% below last year.
• Total passenger traffic at Alexandria International airport (AEX) averaged 76% of last November’s level compared to only 35% nationwide. AEX had the highest percentage passenger throughput rate in the state when compared with 2019 traffic, nearly doubling the throughput rate of New Orleans.
• Using data from financial transactions, Opportunity Insights reports consumer spending in Rapides was up 9.6% on Nov. 22nd compared to January 2020 with Grant showing the strongest gain at 12%.
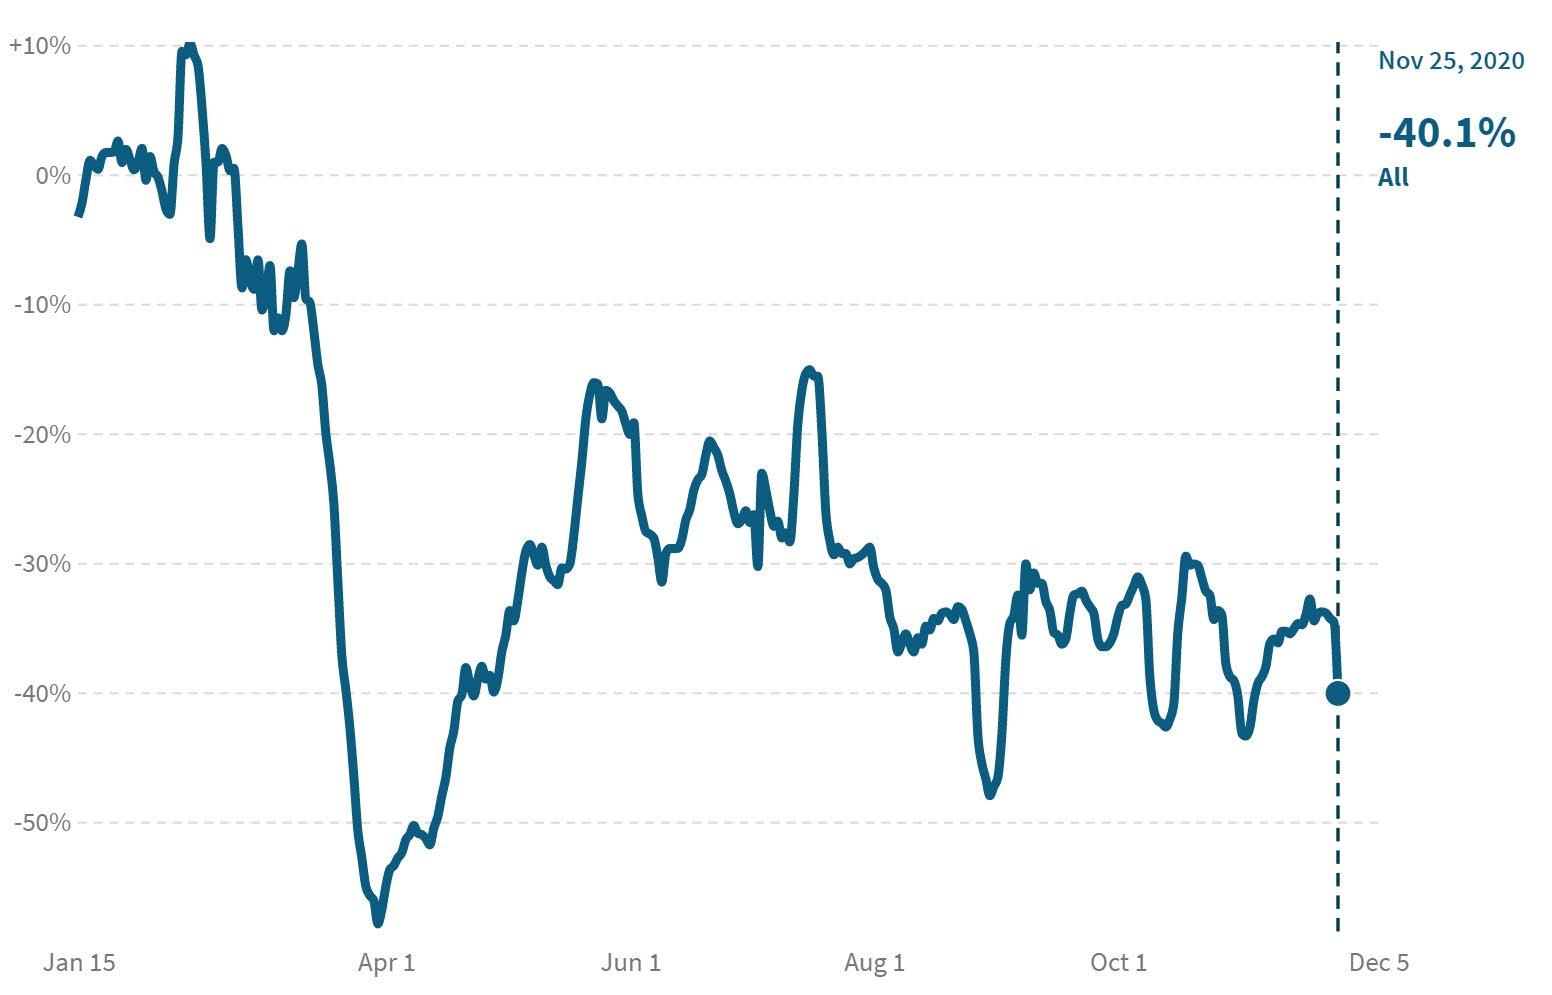
• Small business revenue in Louisiana was down 40% in late November compared to January.
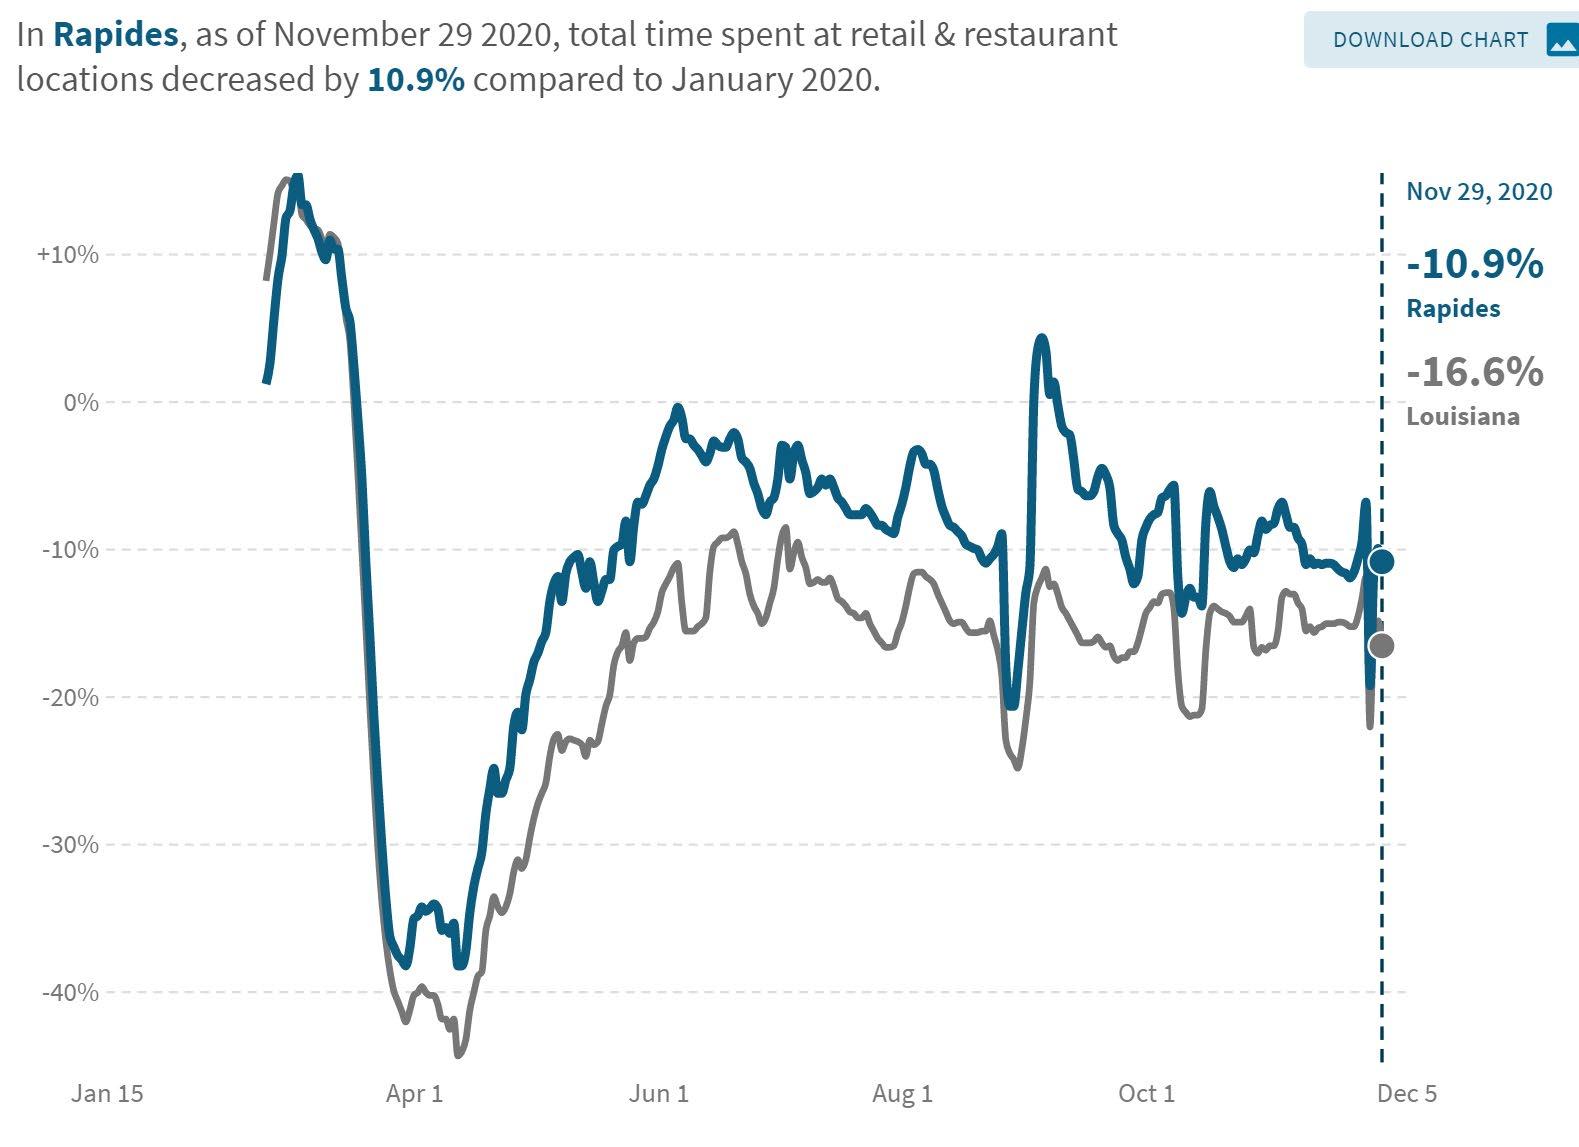
• Consumers in Rapides are spending more time shopping and dining out than the state average. As of last week, grocery shopping was up 1.7% compared to -4.4% for the state. Consumers also outpaced the state in retailing and dining out, although it remains 11% below January’s level.
• Employees in Rapides spent more time at work than the state average, down -18% from January’s level compared to -24% statewide.
• Year-to-date through November 30, 2020, 78,480 business applications have been filed in Louisiana, compared to 50,830 for the same period in 2019, representing a 54% increase.
• The Baker Hughes exploration rig count in Louisiana remained unchanged again in November at 38. However, the rig count nationwide is up 11% in November over October.
• The Coincident Economic Activity Index which tracks gross state product edge up slightly in October.
• Gaming revenue in Louisiana increased 15% in October but was down 14% compared to last year.
COVID-19 statewide testing statistics as of December 6, 2020.
Source: Louisiana Office of Public Health, Region 6 (Central Louisiana), Regional Administrator/Medical Director, David J. Holcombe, MD, MSA, December 10, 2020.
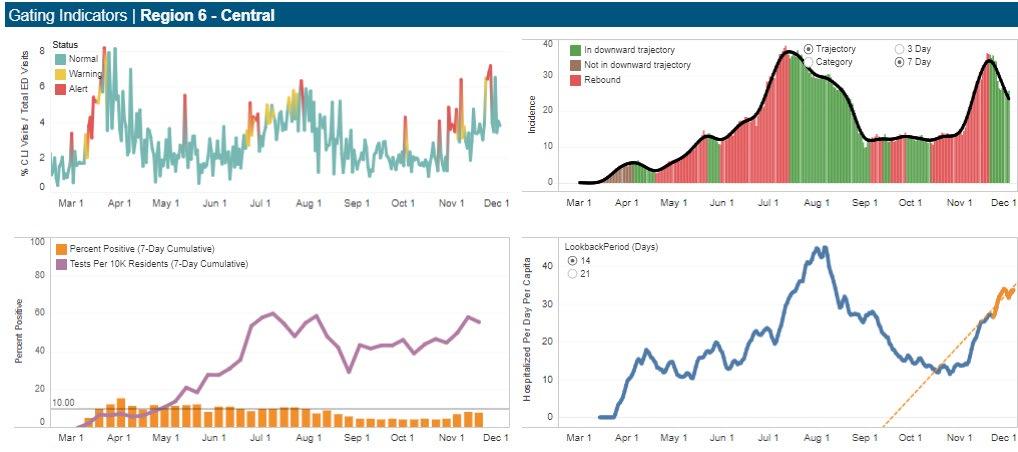
COVID-19 testing statistics for Region 6 as of December 3, 2020.
Region 6
• As of November 25, the 7-day average percent positivity was 7.80%.
• The hospitalizations per capita in Region 6 are increasing over the last 14 days.
• As of December 3, the epidemic curve for Region 6 showed 13 days in a downward trajectory in average daily incidence of COVID cases.
Source: Louisiana Office of Public Health, Region 6 (Central Louisiana), Regional Administrator/Medical Director, David J. Holcombe, MD, MSA, December 7, 2020.
COVID-19 parish testing statistics for Region 6 as of November 19, 2020. Source: Louisiana Office of Public Health, Region 6 (Central Louisiana), Regional Administrator/Medical Director, David J. Holcombe, MD, MSA, November 20, 2020.
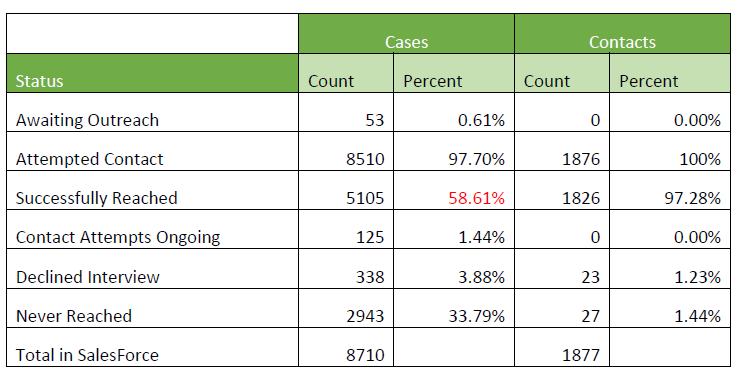
Covid-19 contact tracing effectiveness as of November 18, 2020.
58% of attempted contacts were reached.
61% denied any close contact in the two weeks prior to their positive results.
Covid-19 cases reported by K-12 schools in Region 6 as of November 29, 2020.
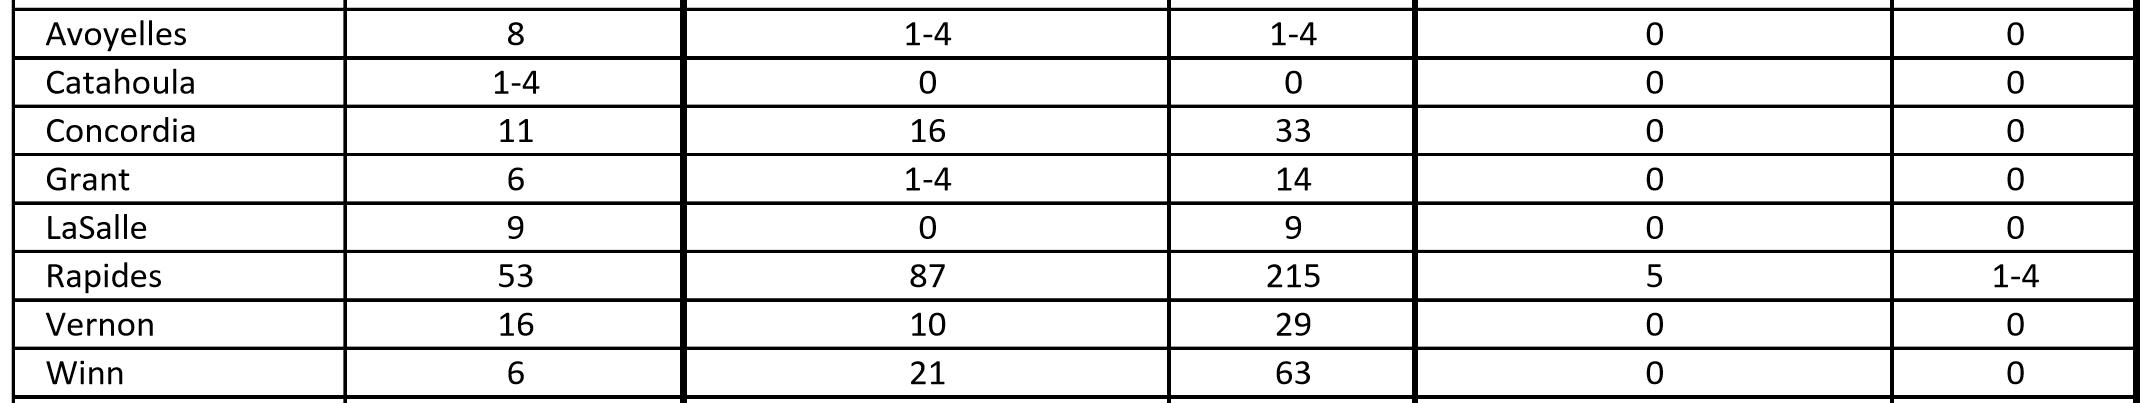
Source: Louisiana Office of Public Health, Region 6 (Central Louisiana), Regional Administrator/Medical Director, David J. Holcombe, MD, MSA, December 2, 2020.
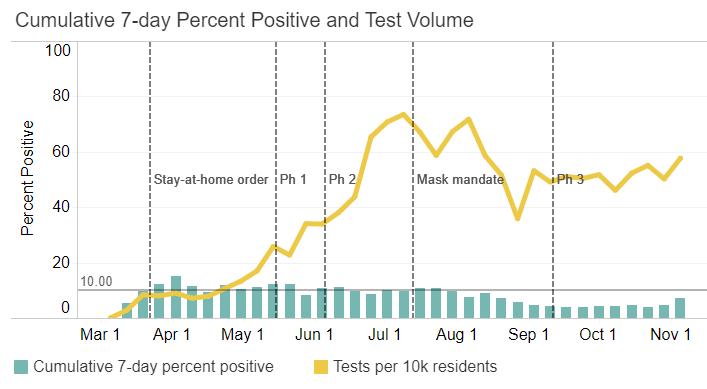
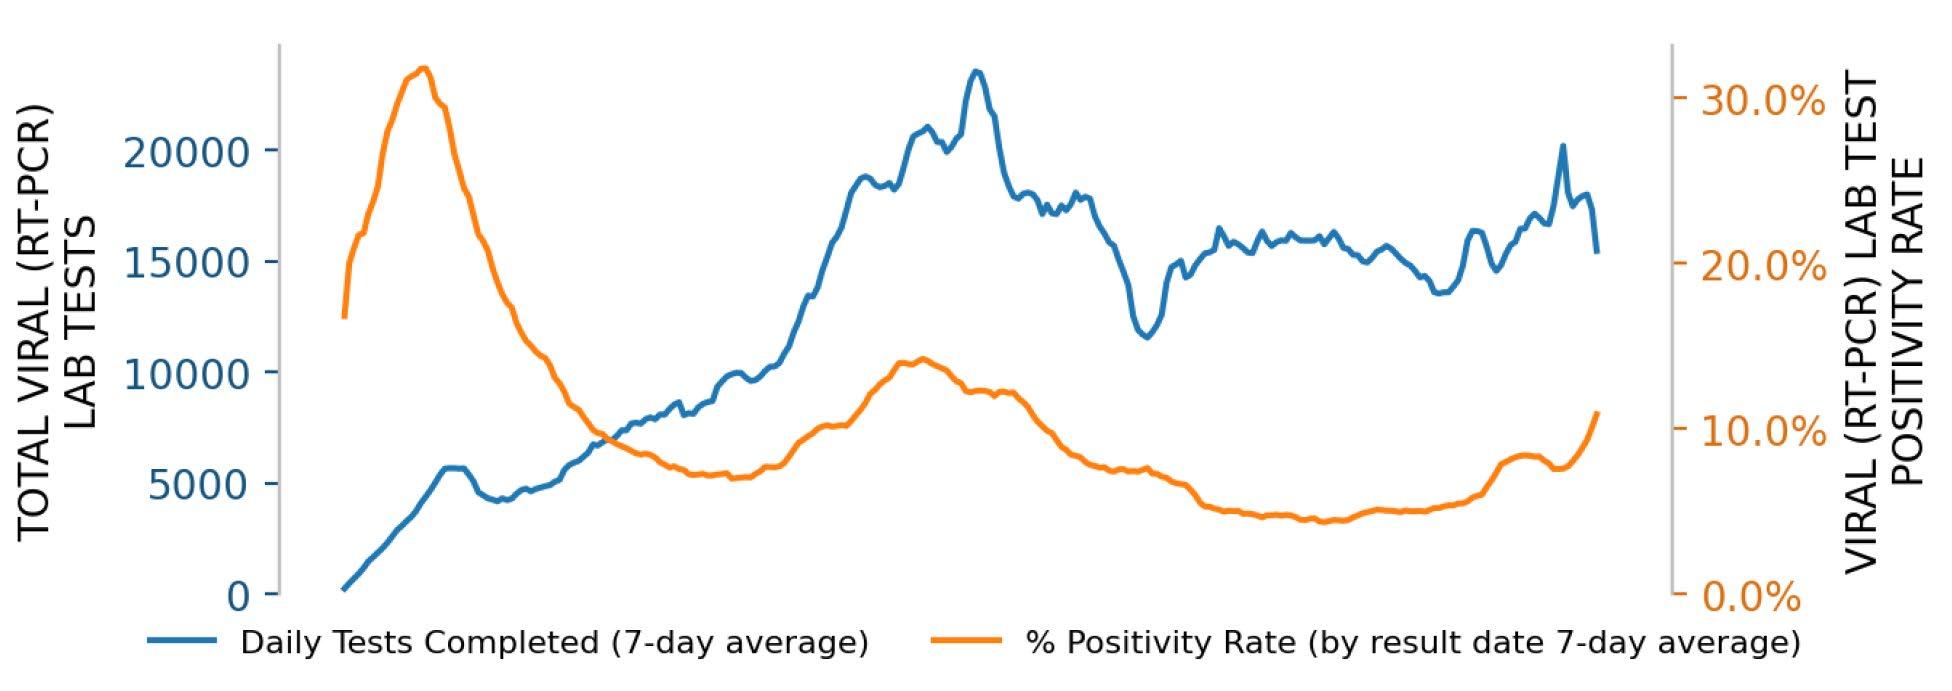
COVID-19 percent positive and test volume in Region 6 as of November 19, 2020. Source:
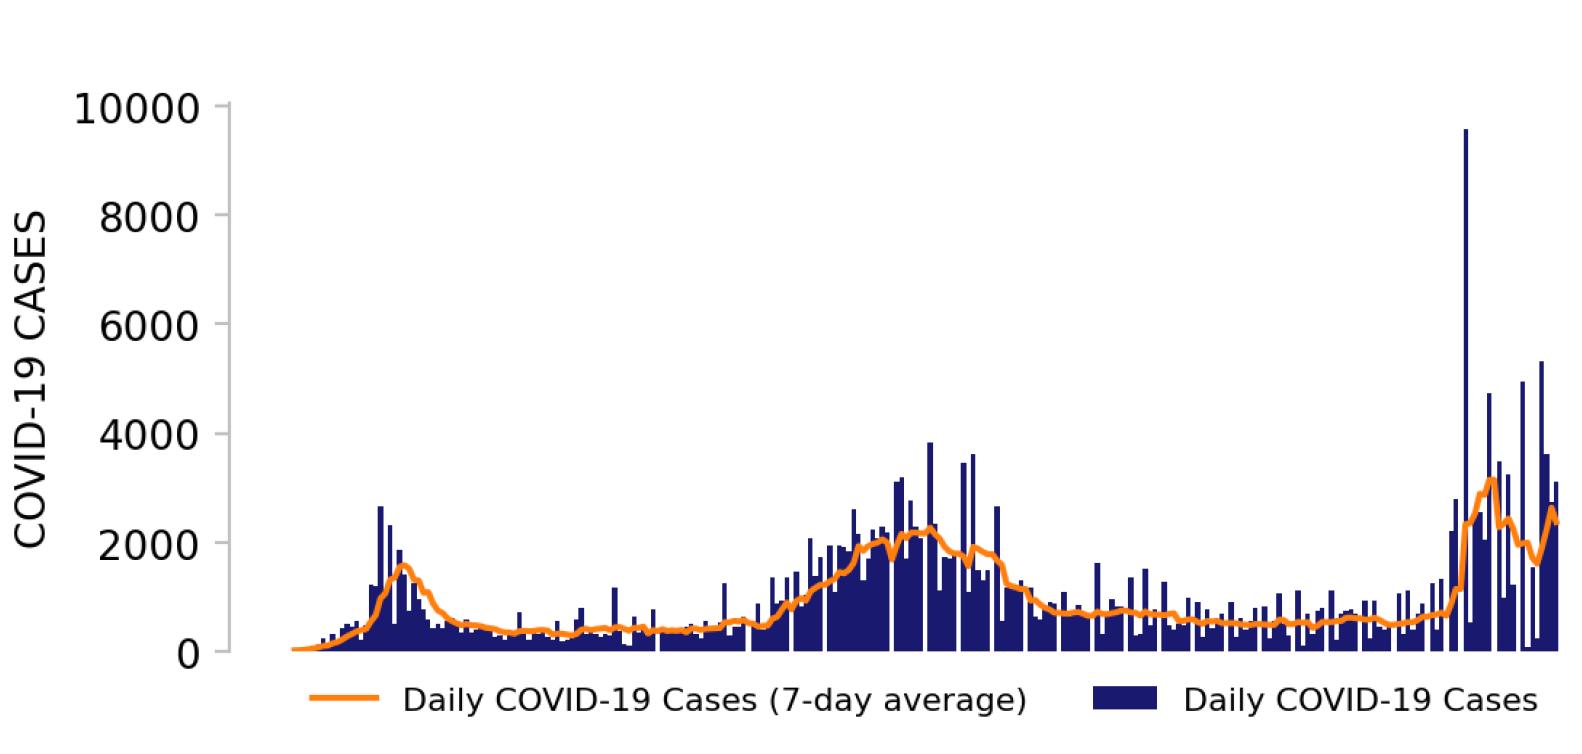
COVID-19 cases by collection date as of November 19, 2020 in Region 6 with a 7day moving average.
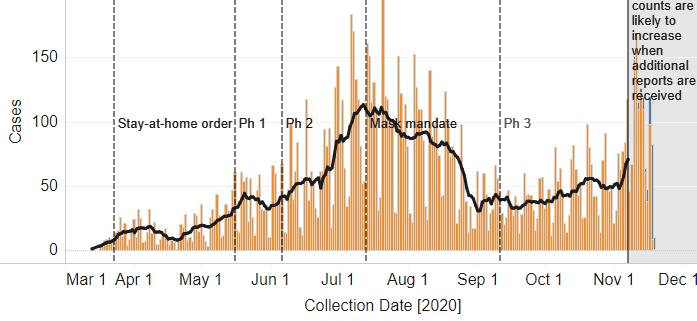
Source: Louisiana Office of Public Health, Region 6 (Central Louisiana), Regional Administrator/Medical Director, David J. Holcombe, MD, MSA, November 19, 2020.
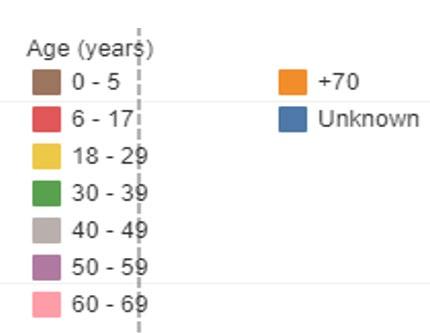
Cases over time by age group in Region 6 through November 19, 2020.
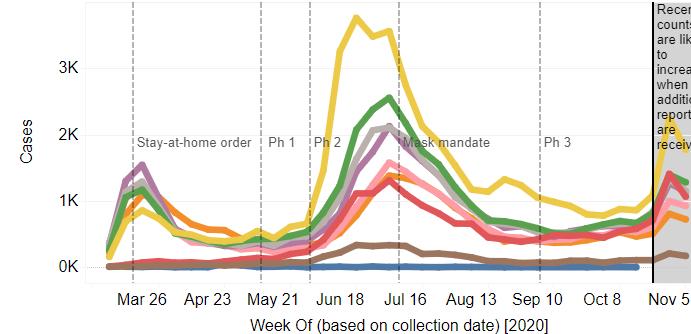
Source: Louisiana Office of Public Health, Region 6 (Central Louisiana), Regional Administrator/Medical Director, David J. Holcombe, MD, MSA, November 19, 2020.
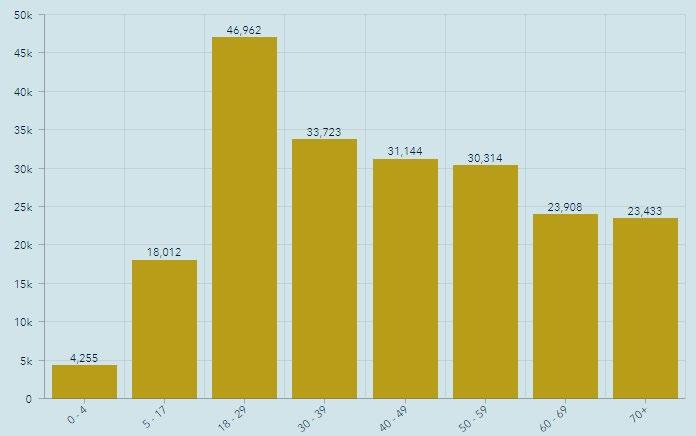
COVID-19 cases statewide by age group as of November 19, 2020.
Source: Louisiana Office of Public Health, Region 6 (Central Louisiana), Regional Administrator/Medical Director, David J. Holcombe, MD, MSA, November 19, 2020.
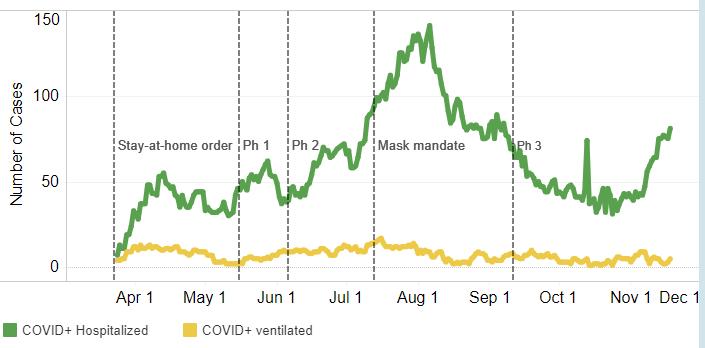
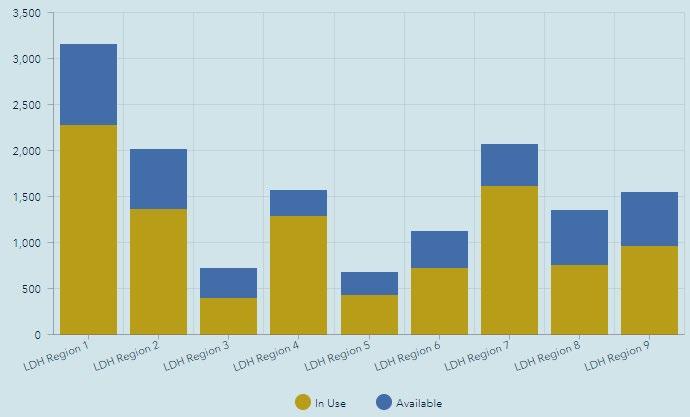
Number of cases hospitalized and ventilated in Region 6 as of November 15, 2020. Source: Louisiana Office of Public Health, Region 6 (Central Louisiana), Regional Administrator/Medical Director, David J. Holcombe, MD, MSA, November 15, 2020.

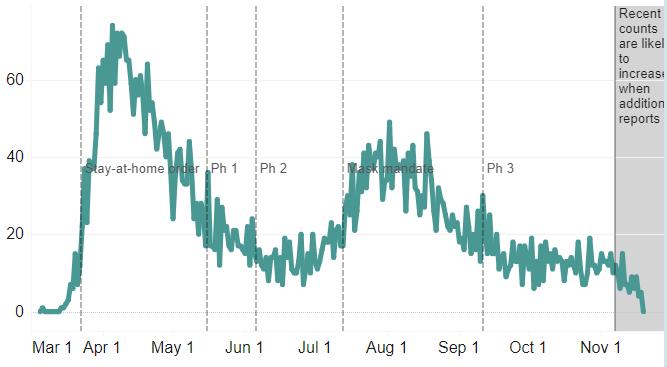
COVID-19 deaths by date of death statewide as of November 19, 2020.
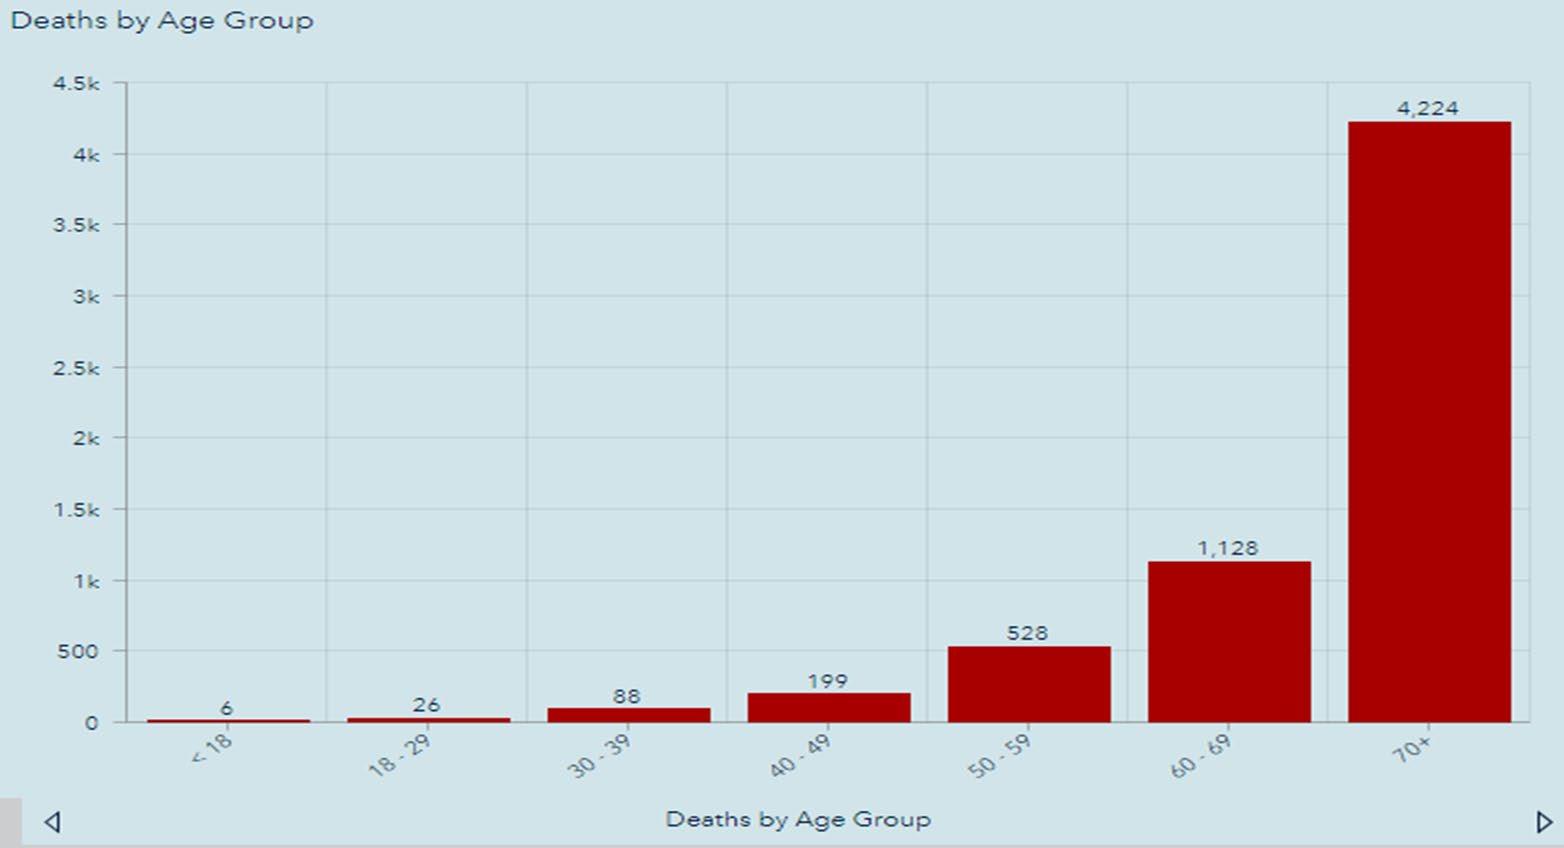
COVID-19 deaths statewide by age group as of November 19, 2020.
Source: Louisiana Office of Public Health, Region 6 (Central Louisiana), Regional Administrator/Medical Director, David J. Holcombe, MD, MSA, November 19, 2020.
Initial and continued unemployment claims in Louisiana since March 14, 2020.


Average weekly initial unemployment claims filed in November fell from 11,717 in October to 10,500, a 10% decrease.
Average weekly continued unemployment claims in November fell from 150,363 in October to 87,209, a 42% decrease.
Source: Louisiana Workforce Commission, December 10, 2020

Initial and continued unemployment claims in Louisiana since March 14, 2020.
Average weekly initial unemployment claims in central Louisiana rose slightly from 570 in October to 587 November.
Average weekly continued unemployment claims in central Louisiana fell from 9,439 in October to 6,031 in November, a 36% decline.
Source: Louisiana Workforce Commission, December 10, 2020
The table below shows October 2020 preliminary unemployment rate, labor force, and employment data for central Louisiana parishes.
In October, parishes in central Louisiana had an average unemployment rate of 7.9% compared to 9.3% statewide.
Data Source: Louisiana Workforce Commission, December 10, 2020
The table below shows October 2020 preliminary unemployment rate, labor force, and employment data for Metropolitan Statistical Areas in Louisiana.
At 6.8%, the Alexandria MSA had the lowest unemployment rate among the state’s major metro areas for the sixth straight month, well below the state’s 9.3% rate.
Louisiana’s unemployment rate rose 1.1% in October to 9.3% from 8.2% in September.
Data Source: Louisiana Workforce Commission, December 10, 2020
The table below shows the number of unemployed, number of advertised jobs online, and the ratio of unemployed to advertised job openings online in Alexandria MSA in October 2020.
Alexandria metro area continues to have the tightest labor market in the state with only 0.89 unemployed person per job opening compared to 2.33 statewide.
Source: Louisiana Workforce Commission, December 10, 2020

(L) The number of job openings advertised online in CENLA in November 2020 and (R) job openings in Alexandria MSA since November 2019. Data Source: Louisiana Workforce Commission, December 10, 2020
Job openings in the Alexandria MSA in October decreased 7.9% from October.
An overview of sales, vehicle sales, and hotel occupancy taxes collected in the November 2020.
Note: November tax revenue reflects sales activity in October. N/a = Not available
Data Source noted detailed reports.


An overview of sales tax revenue in Rapides Parish other towns and cities in November 2020 (excluding Alexandria and Pineville).
Note: November tax revenue reflects sales activity in October.
(TR) Alexandria sales tax revenue for November with previous month, year, and YTD comparisons.
(BR) Alexandria monthly sales tax revenue from 2019 to present.
Note: November sales tax revenue reflects sales activity in October.
Data Source: Rapides Parish Police Jury Treasurer’s Reports.
Avoyelles Parish total sales tax revenue for November with previous month, year, and year-to-date comparisons. Vehicle and hotel tax revenues are excluded.
Note: November sales tax revenue reflects sales activity in October.
Data Source: Avoyelles Parish School Board.
Avoyelles Parish vehicle sales tax revenue for November with previous month, year, and year-to-date comparisons.
Note: November sales tax revenue reflects sales activity in October.
Data Source: Avoyelles Parish School Board.
Catahoula Parish total sales tax revenue for November with previous month, year, and year-todate comparisons.
Note: November sales tax revenue reflects sales activity in October.
Data Source: Catahoula Parish Tax Administrator
Concordia Parish total sales tax revenue for November with previous month, year, and year-todate comparisons.
Note: November sales tax revenue reflects sales activity in October.
Data Source: Concordia Parish Tax Administrator
Evangeline Parish total sales tax revenue for November with previous month, year and YTD comparisons.
Note: November sales tax revenue reflects sales activity in October.
Data Source: Evangeline Parish Sales Tax Commissioner.
Evangeline Parish vehicle sales tax revenue for November with previous month, year and YTD comparisons.
Note: November sales tax revenue reflects sales activity in October.
Data Source: Evangeline Parish Sales Tax Commissioner.
La Salle Parish total sales tax revenue for November with previous month, year, and year-todate comparisons.
Note: November sales tax revenue reflects sales activity in October.
Data Source: La Salle Parish Tax Administrator

(TR) Pineville sales tax revenue for November with previous month, year, and YTD comparisons.
(BR) Pineville monthly sales tax revenue from 2019 to present.
Note: November sales tax revenue reflects sales activity in October.
Rapides Parish occupational license revenue YTD (January – November) with previous YTD comparisons.
Note: November occupational license revenue reflects licenses issued in October.
Data Source: Rapides Parish Police Jury Treasurer’s Reports.
(TR) Rapides Parish total sales tax revenue for November with previous month, year, and YTD comparisons.
(BR) Rapides Parish total monthly sales tax revenue from 2019 to present.
Note: November sales tax revenue reflects sales activity in October.
Data Source: Rapides Parish Police Jury Treasurer’s Reports.
St. Landry Parish sales tax revenue for November with previous month, year, and YTD comparisons.
Note: November sales tax revenue reflects sales activity in October.
Data Source: Tax revenue data from St. Landry Parish School Board.
St. Landry Parish vehicle sales tax revenue for November with previous month, year, and YTD comparisons.
Note: November sales tax revenue reflects sales activity in October.
Data Source: Tax revenue data from St. Landry Parish School Board.
This chart shows the valuation of permits issued by Rapides Area Planning Commission in Allen Parish in November between 2017-2020 with monthto-month, year-to-year, and year-to-date comparisons.
Data Source: Rapides Area Planning Commission, November 2020.
This chart shows the valuation of permits issued by Rapides Area Planning Commission in Avoyelles Parish in November between 2019-2020 with month-tomonth, year-to-year, and year-to-date comparisons.
Data Source: Rapides Area Planning Commission, November 2020.
This chart shows the valuation of permits issued by Rapides Area Planning Commission in Evangeline Parish in November between 2017-2020 with month-tomonth, year-to-year, and year-to-date comparisons.
Data Source: Rapides Area Planning Commission, November 2020.
This chart shows the valuation of permits issued by Rapides Area Planning Commission in the City of Pineville in November between 2017-2020 with month-to-month, year-to-year, and year-to-date comparisons.
Data Source: Rapides Area Planning Commission, November 2020.
This charts shows the valuation of permits issued by Rapides Area Planning Commission in Rapides Parish (excluding Alexandria) in November between 2017-2020 with month-to-month, year-to-year, and year-to-date comparisons.
Data Source: Rapides Area Planning Commission, November 2020.
New residential construction permit valuation (estimated development cost) issued by Rapides Area Planning Commission by jurisdiction in November 2020 compared to November 2019.
Valuation of New Residential Construction
November 2019 vs November 2020
Note: City of Alexandria permits are accounted for separately.
Data Source: Rapides Area Planning Commission, November 2020.
The valuation (estimated development cost) of new commercial construction permits issued by the City of Alexandria in November 2020 with previous month, year, and YTD comparisons.
The valuation (estimated development cost) of new residential construction permits issued by the City of Alexandria in November 2020 with previous month, year, and YTD comparisons.

The count of active single-family and condo/townhome listings for Alexandria MSA (excludes pending listings) for November 2017-2020 with month-to-month and year-over-year comparisons.
Active listings decreased 45% November 2019.

The count of pending single-family and condo/townhome listings for Alexandria MSA for November 2017-2020 with month-tomonth and year-over-year comparisons.
Pending Listing Count in Alexandria July 2016 - November 2020
Pending listings increased 26% since November 2019, from 153 to 192.
The median number of days property listings spend on the market in Alexandria MSA for November 2017-2020 with month-to-month and year-over-year comparisons.

Median days on the market decreased 10% since November 2019, but are up 12% for the month.

The median listing price of houses in Alexandria MSA for November 2017-2020 with month-to-month and year-over-year comparisons.
The median listing price increased 23% since November 2019 from $180,050 to $221,800, but fell 4.4% since last month.

The average listing price of houses in Alexandria MSA for November 2017-2020 with month-to-month and year-over-year comparisons.
The average listing price increased 25% since November 2019 from $216,945 to $270,621, but fell 3% since last month.
This chart represents non-current mortgages (delinquencies) in Louisiana and the U.S. during 2020.
Non-Current
Mortgages in Louisiana
12%
10%
8%
U.S. 6.4% LA 11.0% 10.9% 11.8% 11.7% 10.8% 11.3% 11.2% 11.0% 3.2% 3.3% 3.4%
Louisiana’s 11.04% Noncurrent mortgage delinquency rates in October is 43% higher than a year ago. The delinquency rate peaked at 30% in October 2005 following Hurricane Katrina. 6.5%
6%
4%
2%


2020 Louisiana U.S.
7.8% 7.6% 6.9% 6.9% 6.7% 6.4% 0%
14% January-20 March-20 May-20 July-20 September-20
Avoyelles Parish hotel occupancy tax revenue for November with previous month, year, and year-to-date comparisons.
Note: November tax revenue reflects hotel occupancy activity in October.
Data Source: Avoyelles Parish School Board. November 2020.
Rapides Parish hotel occupancy tax revenue for November 2020 with previous month, year, and YTD comparisons.
Note: November tax revenue reflects hotel occupancy activity in October.
Data Source: Rapides Parish Police Jury Treasurer’s Reports, November 2020.

This chart shows total passenger throughput at Louisiana airports and nationwide in November 2020 as a percent of traffic a year ago.
Passenger Throughput as a Percent a Year Ago
AEX vs Nationwide (November 2020)
In November, AEX (black line) ranked first in the state in percentage of 2019 passenger traffic at 76% of last year’s level.
Data Source: Alexandria International Airport, December 10, 2020
This chart shows total passenger traffic at Alexandria International hubs in October 2020 relative to traffic a year ago.
Hubs
October 2020 vs October 2019
In October, Houston (IAH) was 60% below its 2019 traffic count, compared to 40% for Dallas-FW (DFW) and 63% for Atlanta (ATL).
AEX ranked 221 among 780 U.S. airports in passenger traffic for the 12 months ending in August 2020.
Data Source: IAH, DFW, and ATL websites & Bureau of Transportation Statistics, December 5, 2020
Nationwide daily percentage of passengers passing through TSA checkpoints in 2020 expressed as a percentage of 2019 traffic.

TSA Airport Total Traveler Throughput in 2020 as a Percent 2019 Traffic
Nationwide air passenger traffic in November was 37% of last year’s level, compared to 35% in October.
Passenger traffic hit a new pandemic high at 45% of 2019 levels during Thanksgiving.
Data Source: DHS, Transportation Security Administration, https://www.tsa.gov/coronavirus/passenger-throughput,
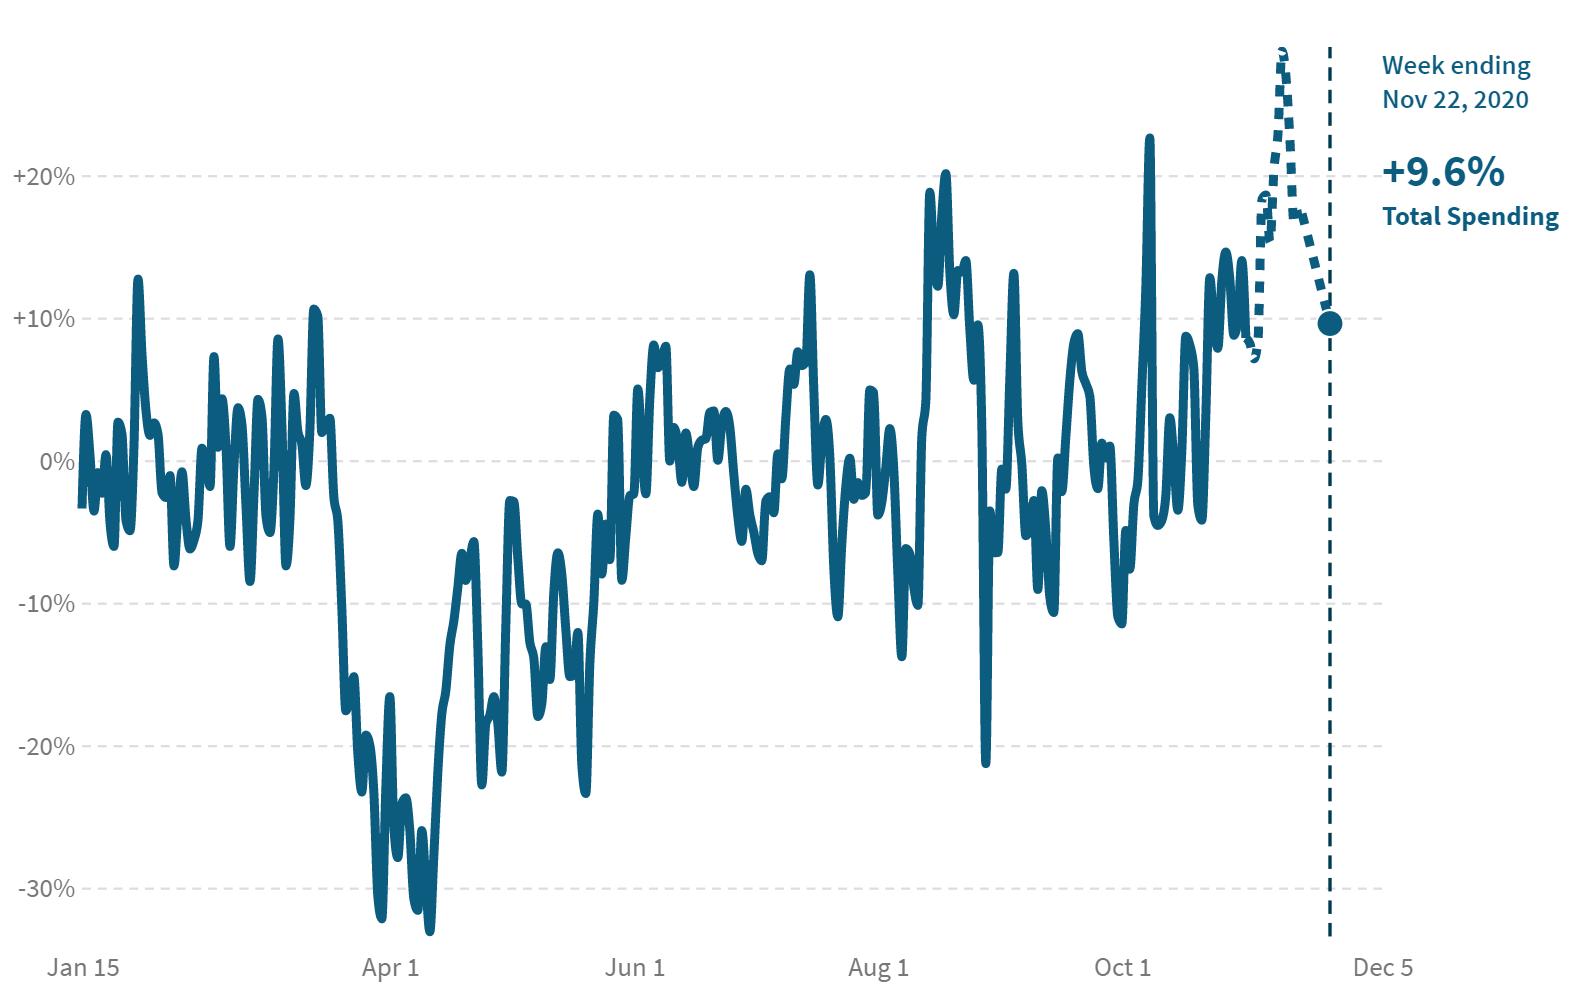
The table and chart represents the percent change in average consumer credit and debit card spending in Cenla as of November 22, 2020 with January 2020 as the baseline, while the chart represents Rapides.
The chart below represents the percent change in small business revenue in Louisiana and the U.S. as of November 25, 2020 with January 2020 as the baseline. The table shows the percentage change for small business revenue by industry.
The charts represent the percent of time spent at grocery and retail / restaurant locations in Rapides Parish compared with the state as of November 29, 2020 with January 2020 as the baseline.
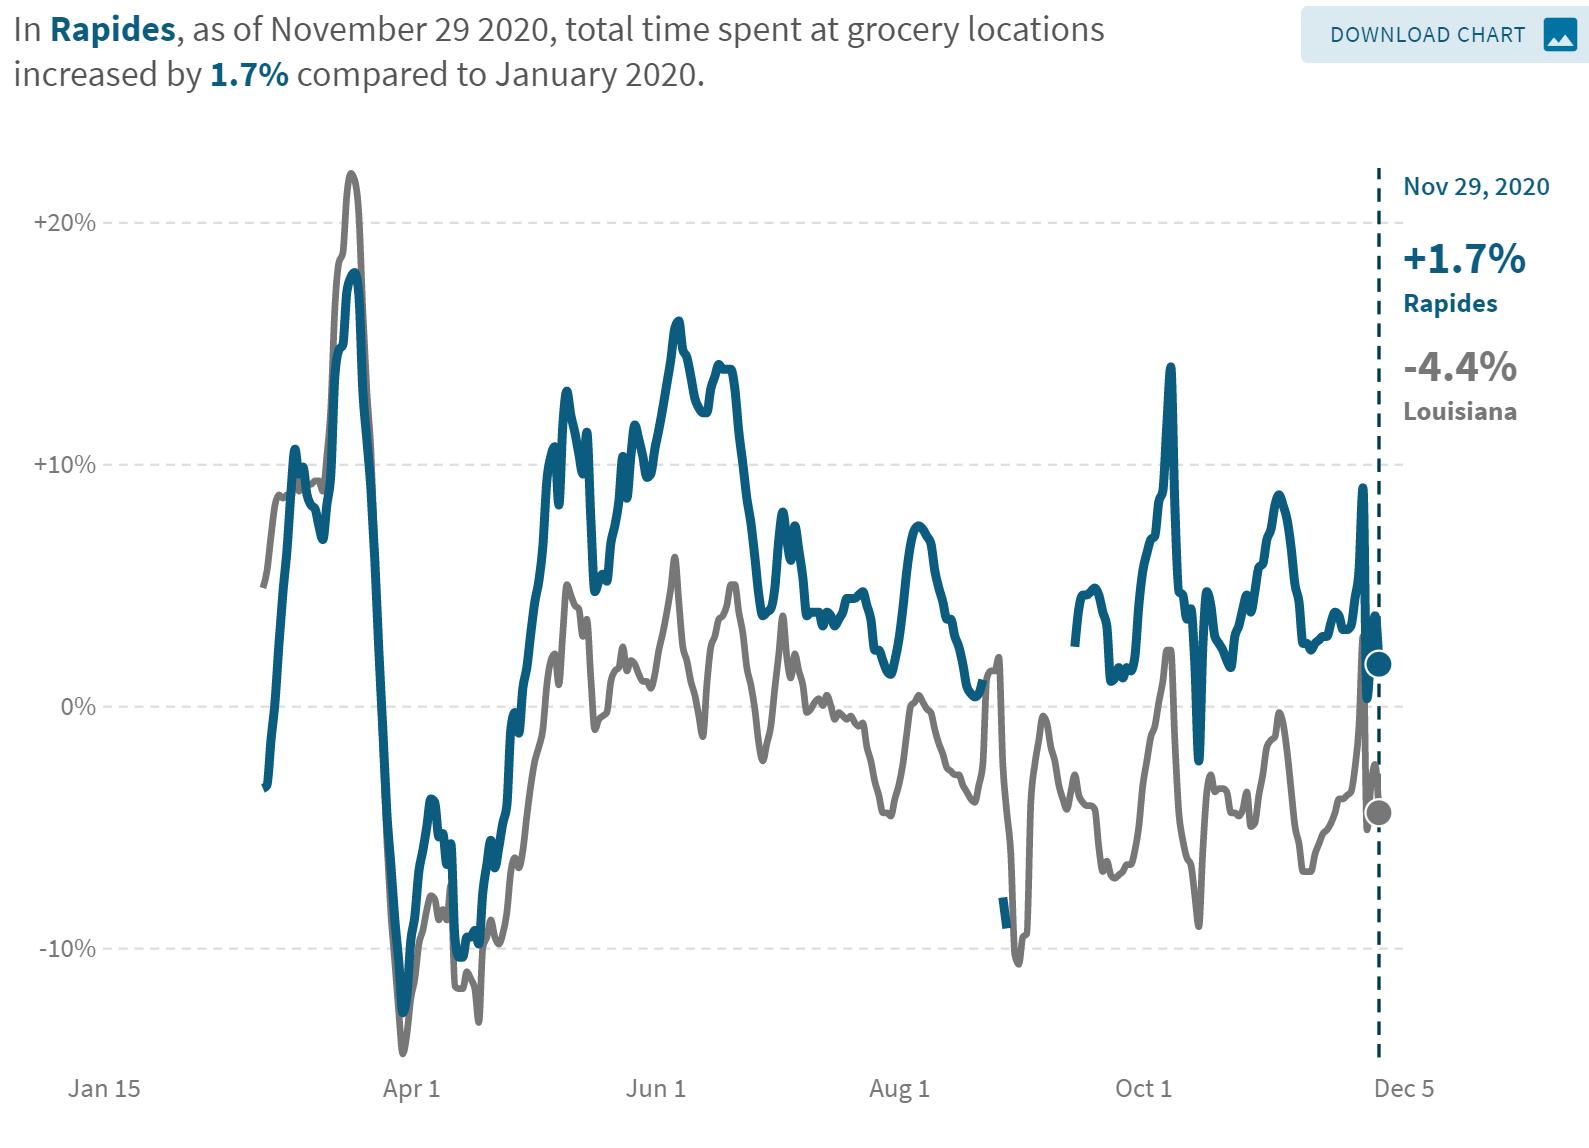
Rapides consumers spent more time retail shopping and dining than the statewide average, -10.9% compared to -16.6% statewide. Likewise, consumers in Rapides outpaced the state in total time in grocery stores, +1.7% compared to -4.4%.
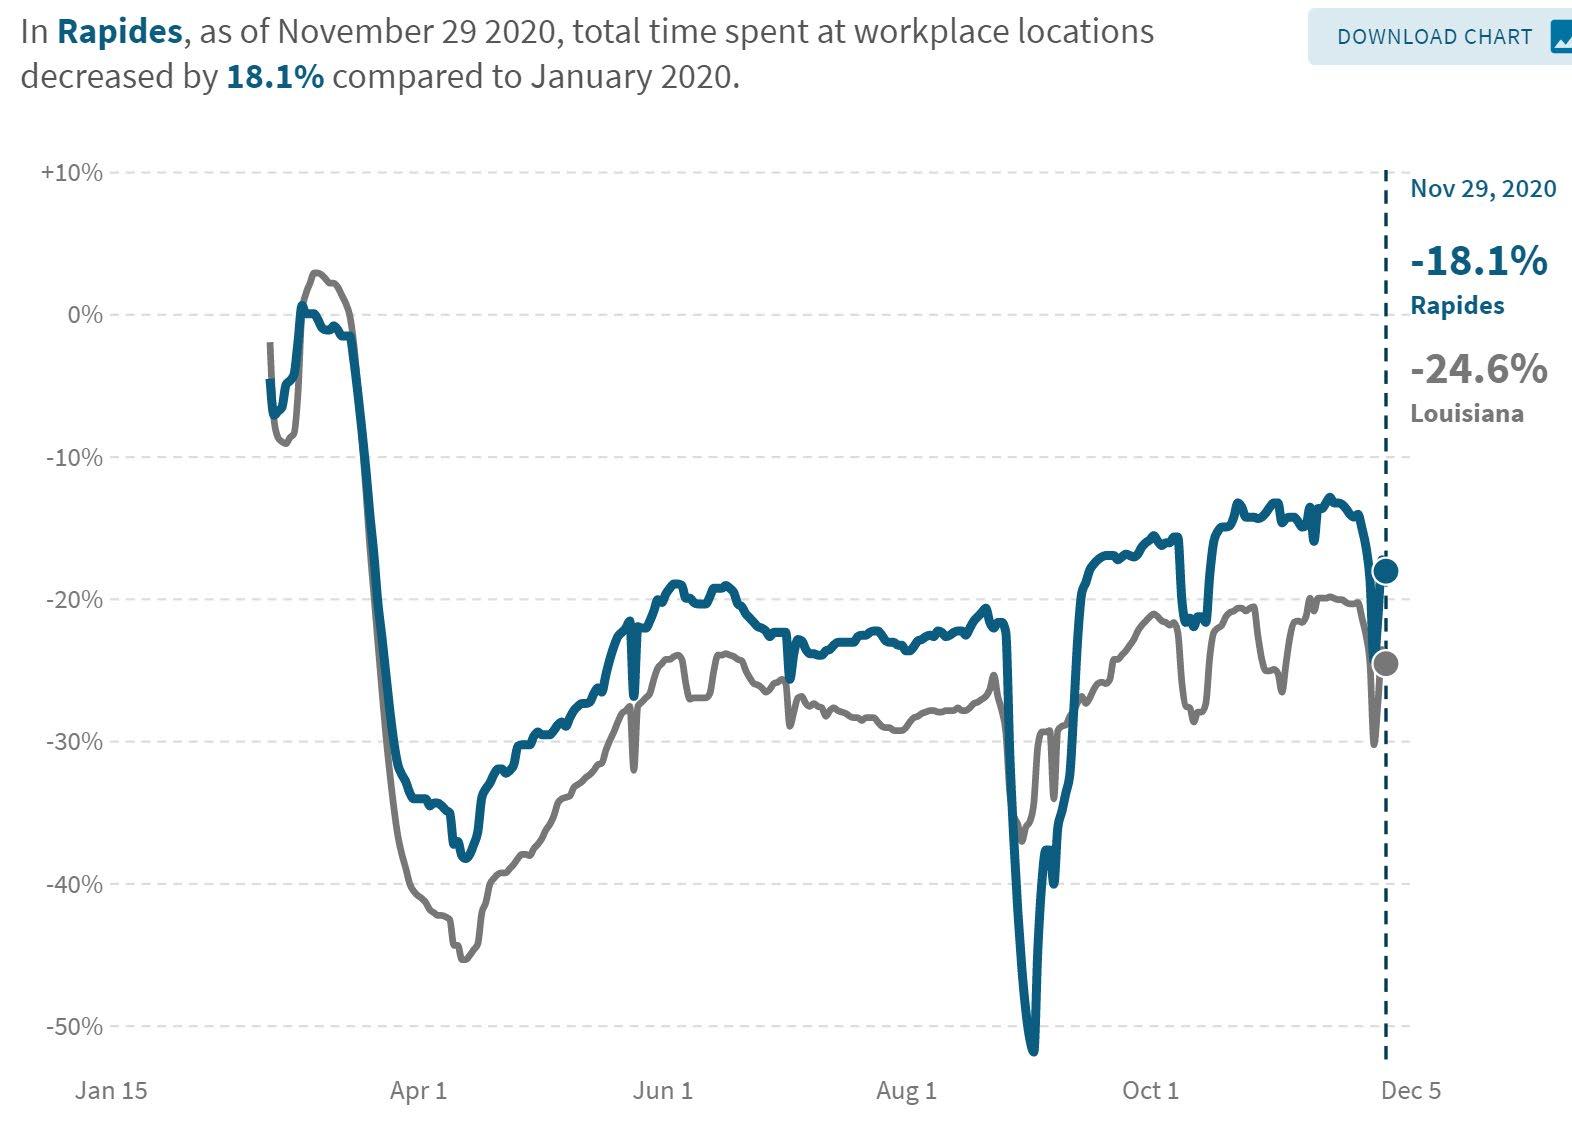
The charts represent the percent of time spent at work and away from home in Rapides Parish as compared with the state as of November 29, 2020 with January 2020 as the baseline.
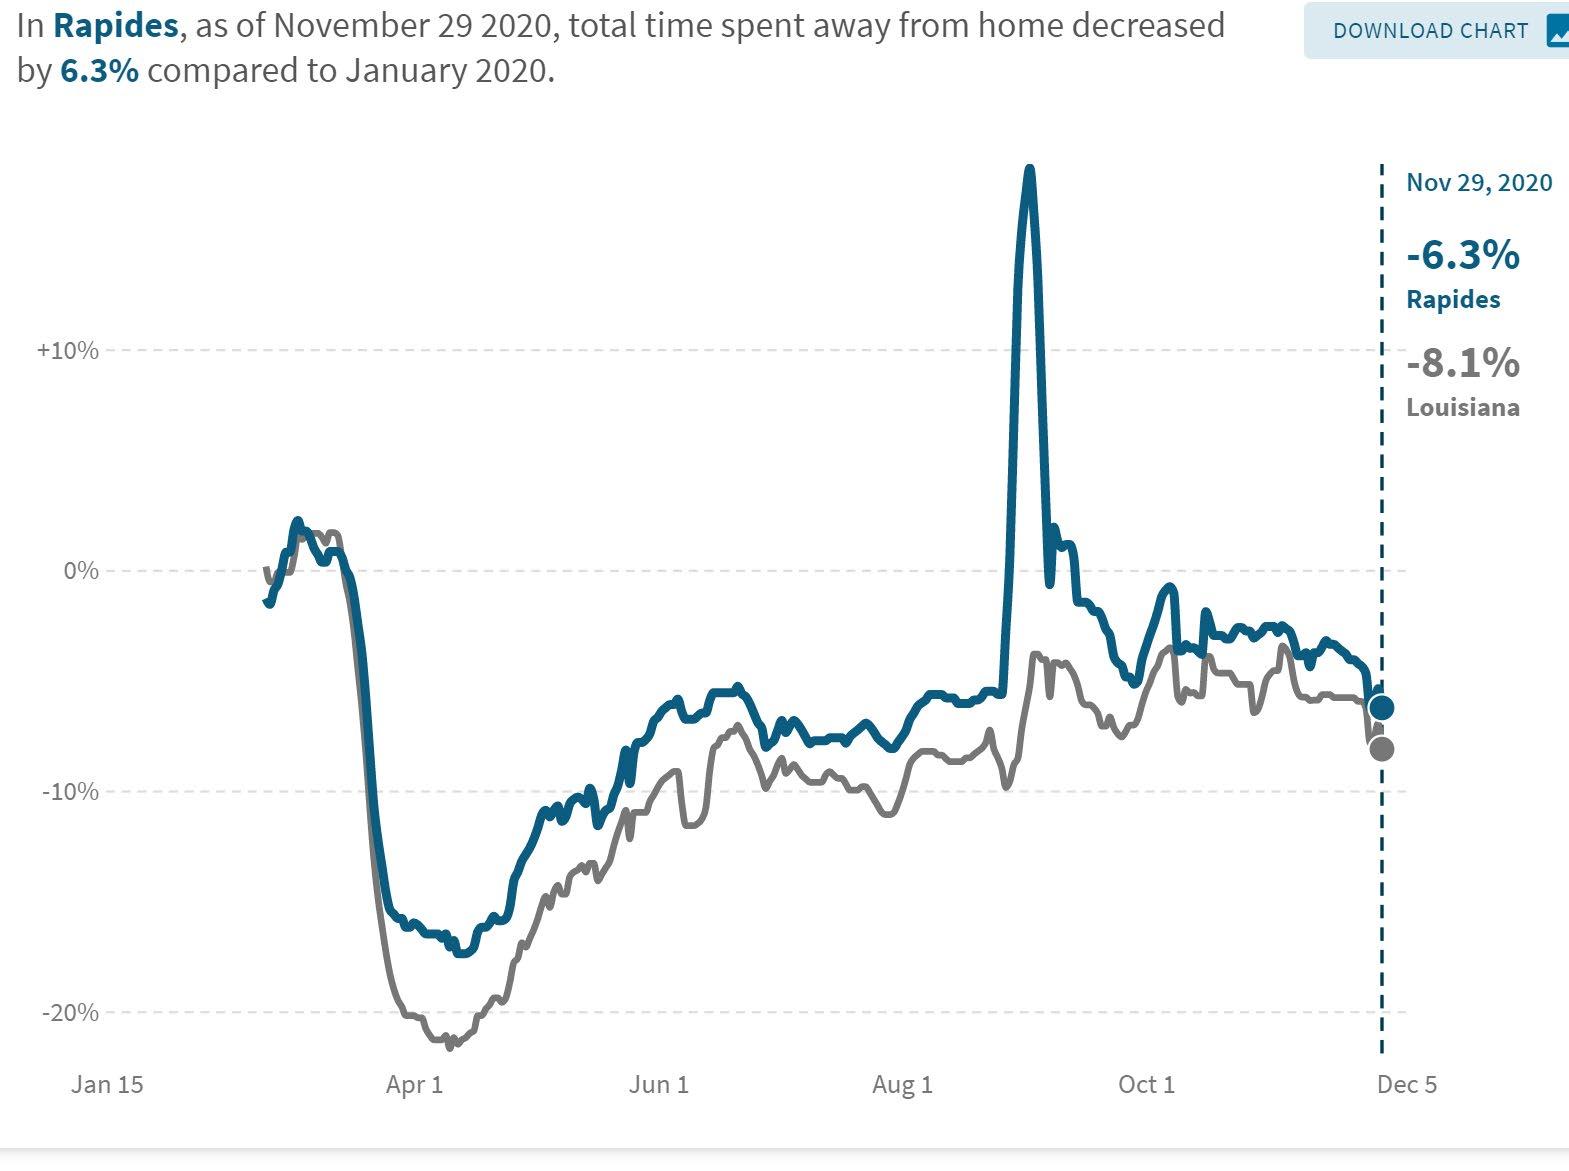
Employees in Rapides spent more time at work than the state average, although down -18.1% from January compared to -24.6% statewide. On the other hand, individuals in Rapides spent less time away from home than the statewide average.

Weekly business applications in Louisiana in 2019 and 2020 through November 30.
Business Applications in Louisiana 2019 vs 2020
Year-to-date through November 30, 2020, 78,480 business applications have been filed in Louisiana, compared to 50,830 for the same period in 2019, representing a 54% increase.
The Coincident Economic Activity Index for Louisiana includes four indicators: nonfarm payroll employment, the unemployment rate, average hours worked in manufacturing and wages and salaries. The index is set to match the trend for gross state product.

• The chart shows the impact of COVID-19 on the Louisiana’s gross state product since October 2019.
• Index for September was revised up for a 0.67% increase over August and October shows a 0.26% increase over September. However, the index remains 5.5% below the October 2019 level.
Data Source: FRED Economic Data, Federal Reserve Bank of St. Louis, December 2, 2020. https://fred.stlouisfed.org/series/LAPHCI
Total gasoline sales in Louisiana since 2019.

In September 2020, Louisiana gasoline sales fell 4.9% from August 2020 and are 1.9% below September 2019.
Year-to-date gasoline sales are down 6.4% in 2020 compared to 2019.
Data Source: U.S. Energy Information Administration, December 2, 2020
Exploration
count in Louisiana remains unchanged in October. However, the


count nationwide is up 11% over
Source: Baker Hughes, https://rigcount.bakerhughes.com/na-rig-count, December 5, 2020
Gaming revenue in Louisiana for October 2020 with previous month and year comparisons.
Data Source: Louisiana Gaming Control Board, December 2 2020. http://lgcb.dps.louisiana.gov/revenue_reports.html
Data Source: U.S. Census, https://www.census.gov/economic-indicators/, December 10, 2020.
The data presented throughout the CENLA Economic Dashboard reflects contributions from the following local organizations.
• Rapides Parish Policy Jury Treasurer
• Avoyelles Parish School Board
• St. Landry Parish School Board
• Evangeline Parish Sales Tax Commissioner
• Concordia, Catahoula, & La Salle Tax Administrator
• Alexandria International Airport
• Rapides Area Planning Commission
• City of Alexandria Planning Division
• Louisiana Office of Public Health, Region 6
Also, special thanks to the following partners for distributing the dashboard.
Next Issue: Week of Jan. 11th
• LSUA Foundation
• Central Louisiana Regional Chamber of Commerce
• Marksville Chamber of Commerce
• Bunkie Chamber of Commerce
• Evangeline Chamber of Commerce
• St. Landry Chamber of Commerce
Current and past issues of the CENLA Economic Dashboard can be found at http://www.lsua.edu/coronavirus/cenla-economic-dashboard/