CENLA ECONOMIC DASHBOARD
November 11, 2020.
Dr.RandallDupont Dean,CollegeofBusinessLouisianaStateUniversityofAlexandria
rdupont@lsua.edu


November 11, 2020.
Dr.RandallDupont Dean,CollegeofBusinessLouisianaStateUniversityofAlexandria
rdupont@lsua.edu
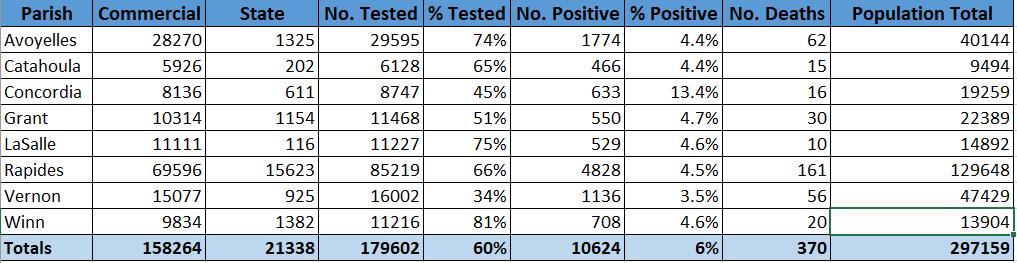
• The positivity rate for COVID-19 in Region 6 is below 5% in all Cenla parishes, except for Concordia which stands at 13.4%.
• Contact tracing in Region 6 reached 59%% of the 7,410 individuals testing positive for COVID. 62% denied having any close contact in the two weeks prior to their positive results.
• As shown in the Cases by Collection Date chart, the mask mandate continues to be effective in reducing transmission.
• Statewide, average weekly initial unemployment claims filed in October fell from 18,006 in September to 11,717, a 35% decrease, while average weekly continued unemployment claims in October fell from 240,240 in September to 150,363, a 37% decrease. Both initial and continued unemployment claims in October reached the lowest level since April.
• In central Louisiana, average weekly initial unemployment claims fell from 906 in September to 570 in October, a 37% decline, while average weekly continued unemployment claims in central Louisiana fell from 13,702 in September to 9,439 in October, a 31% decline.
• For the sixth straight month, the Alexandria MSAhad the lowest unemployment rate among the state’s major metro areas at 6.0%, well below the state’s 8.2% rate.
• Louisiana’s unemployment rate rose slightly in September to 8.2%. from 8.0% in August.
• In September, the nine parishes in central Louisiana had an average unemployment rate of 7.2% compared to 8.2% statewide.
• At 4.7%, La Salle had the lowest unemployment rate in the state for the sixth straight month.
• Alexandria’s metro area continued to have the tightest labor market in the state with 5,296 jobs for 3,897 unemployed, meaning there 0.73 unemployed persons per job opening compared to 2 statewide and 3.5 nationally.

• Job openings in theAlexandria metro area decreased 6.2% in October from 5,207 inAugust to 4,881 in September.
• 53% of all job openings statewide in October are in three sectors hardest hit during the pandemic – health care, retail trade, and accommodations and food services.
• Employment by high wage earners in Louisiana was impacted the least during the pandemic and stood at 3.9% in September, compared to 10% for middle wage earners and 20% of low wage earners.
• Tax data for Ball, Boyce, Cheneyville, Glenmore, Lecompte, and Woodworth are now included. All towns reported a monthly, year-over-year, and year-to-date increase except Cheneyville.
• All nine jurisdictions in central Louisiana reported higher tax revenues in October, reflecting increased consumer spending in September. Alexandria and Pineville had increases of 30% in September overAugust, most likely resulting from the cleanup of Hurricane Laura.
• Year-to-date, sales tax revenue for most jurisdictions remains ahead of last year’s level, with the exception Concordia and La Salle.
• September vehicle sales in Rapides andAvoyelles were up 26 – 29% overAugust. Vehicle sales remained strong in Cenla compared to last year and are up so far this year.
• Hotel occupancy jumped 88% in Rapides in September compared to August and was up 102% over the same period last year. So far this year, hotel occupancy remains only 12% below last year’s level.
• Residential construction permits in October are up 41% in central Louisiana over the same month last year.
• Rapides Parish permit valuations were down 5% in October compared to September and are down 34% so far this year.
• Commercial permit valuations in Alexandria are up 283% in October but still down 51% so far this year.
• Housing indicators continue to point to a strong but slowing marketing in theAlexandria metro area. Compared to October of last year, active listings are down 50%, pending listings are up 39%, median days on the market are down 17%, and the median listing price is up 26%.
• InAugust, Louisiana again had the second highest mortgage delinquency rate in the US at 11.2% compared to 6.7% nationwide. Since September 2019, mortgage delinquencies in Louisiana are up 40%.
• Hotel occupancy in Rapides increased 88% in September compared to a month earlier and was 102% above the September 2019 level. While Hurricane Laura helped boost hotel occupancy, year-to-date the category remains 12% below last year.
• Total passenger traffic at Alexandria International airport (AEX) averaged 64% of last October’s level compared to only 35% nationwide. AEX had the highest percentage passenger throughput rate in the state when compared with 2019 traffic.
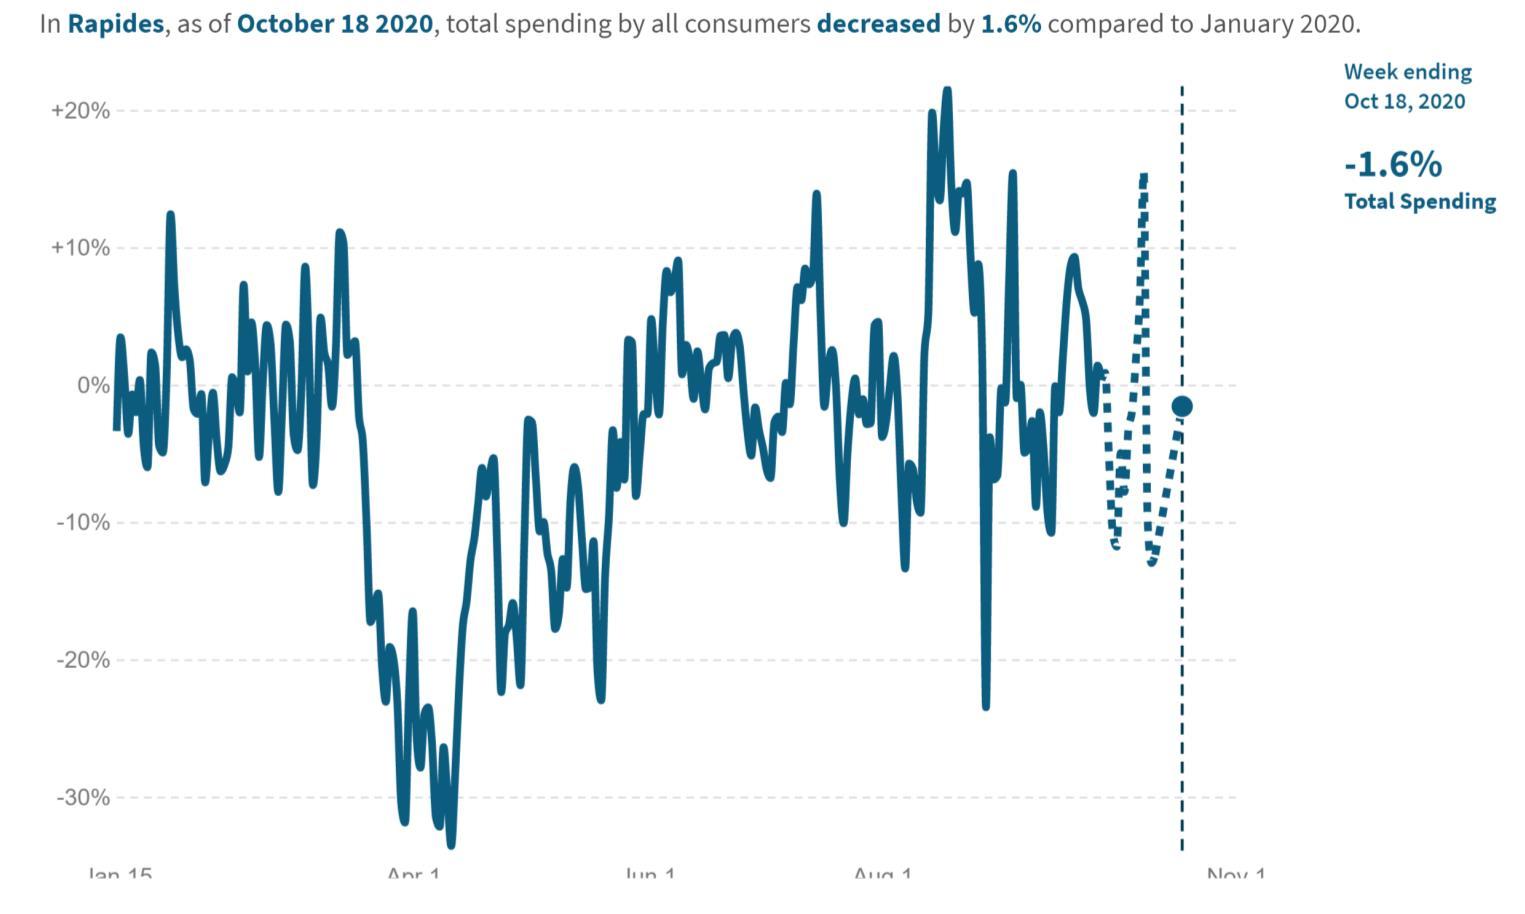
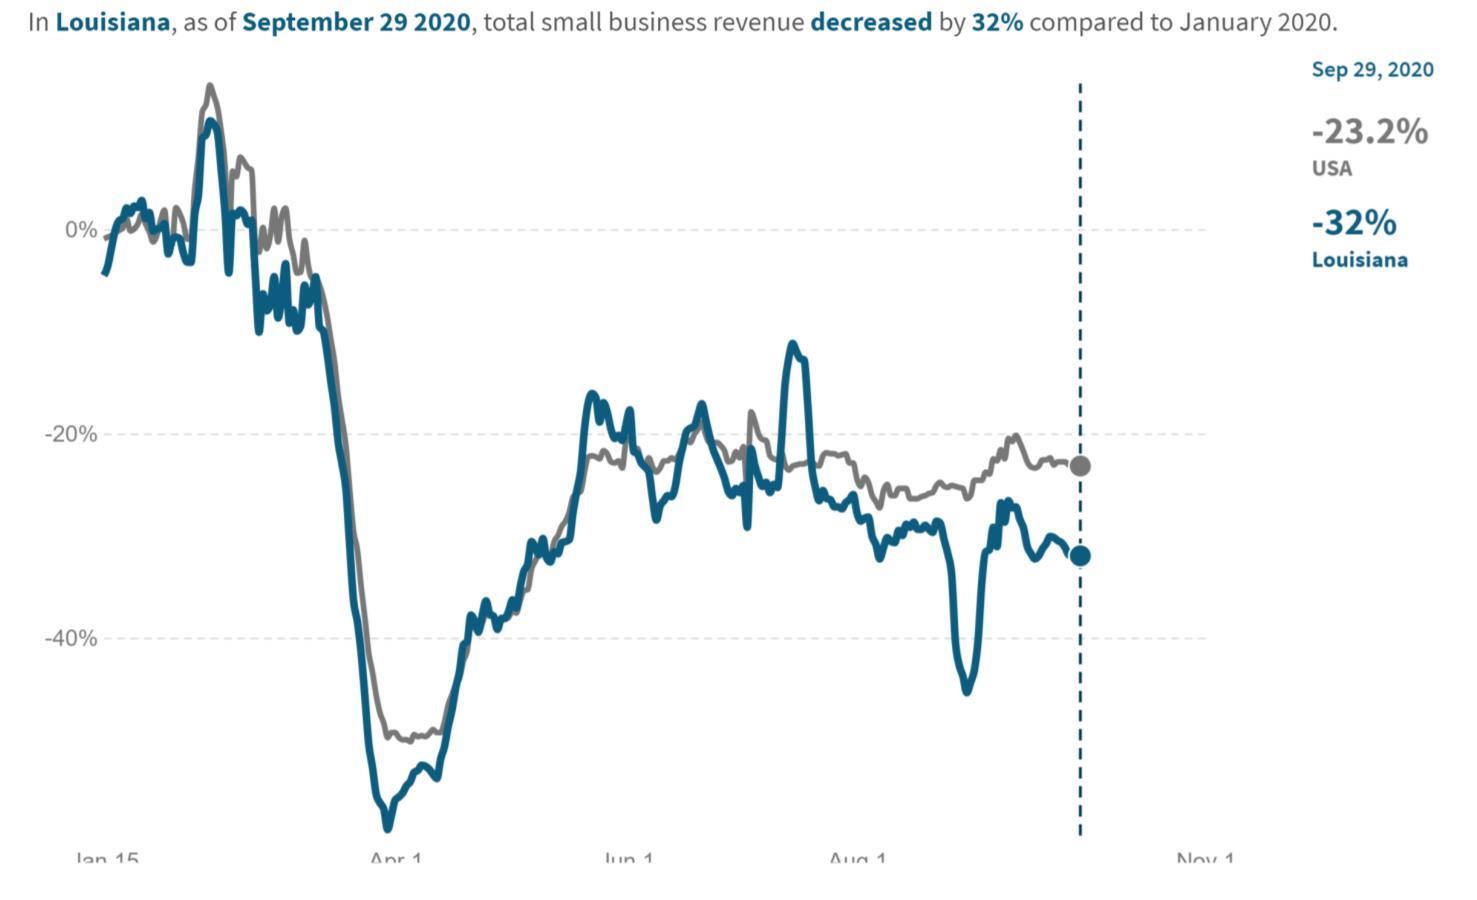
• Using data from financial transactions, Opportunity Insights reports consumer spending in Rapides was down -1.6% in mid-October compared to January 2020 with Grant showing the strongest gain at 12%. However, small business revenue in Louisiana remains down 32%.
• Consumers in Rapides are spending more time shopping and dining out than the state average. As of last week, grocery shopping was up 1.6% compared to -4.4% for the state. Consumers also outpaced the state in retailing and dining out, although it remains 11% below January’s level.
• Employees in Rapides spent more time at work than the state average, down -13% from January’s level compared to -21% statewide.
• Year-to-date through October 31, 2020, 73,060 business applications have been filed in Louisiana, compared to 47,630 for the same period in 2019, representing a 53% increase.
• The Baker Hughes exploration rig count in Louisiana remained unchanged in October at 38. However, the rig count nationwide is up 8.9% in October over September.
• The Coincident Economic Activity Index which tracks gross state product remained unchanged in September.
• Gaming revenue in Louisiana fell 11% in September and is down 22% over last year.
COVID-19 parish testing statistics for Region 6 as of November 4, 2020. Source: Louisiana Office of Public Health, Region 6 (Central Louisiana), Regional Administrator/Medical Director, David J. Holcombe, MD, MSA, November 4, 2020.
Covid-19 contact tracing effectiveness as of November 4, 2020.
59% of attempted contacts were reached.
62% denied any close contact in the two weeks prior to their positive results.
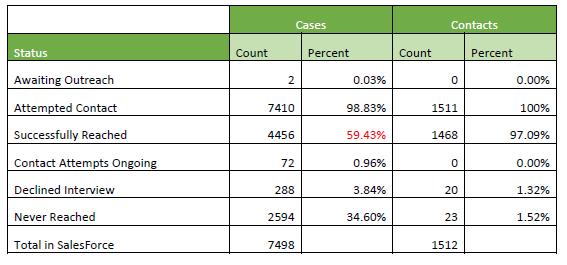
Source: Louisiana Office of Public Health, Region 6 (Central Louisiana), Regional Administrator/Medical Director, David J. Holcombe, MD, MSA, November 4, 2020.
Covid-19 cases reported by K-12 schools in Region 6 as of October 28, 2020.
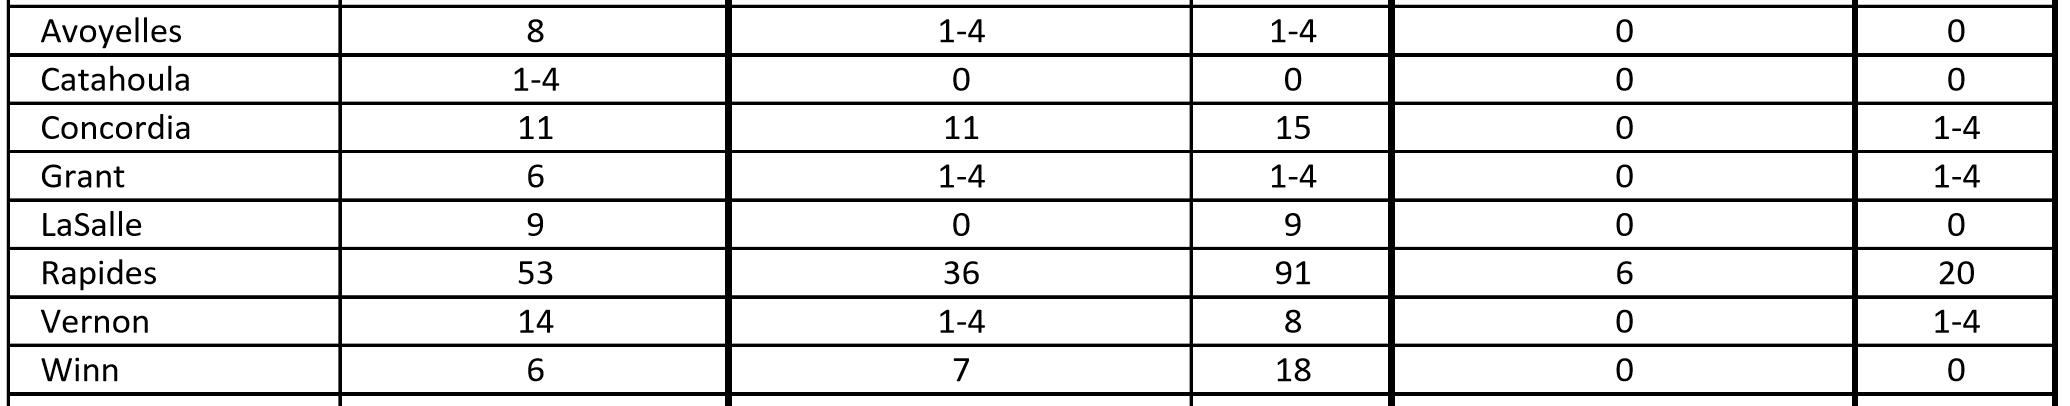
Source: Louisiana Office of Public Health, Region 6 (Central Louisiana), Regional Administrator/Medical Director, David J. Holcombe, MD, MSA, October 28, 2020.
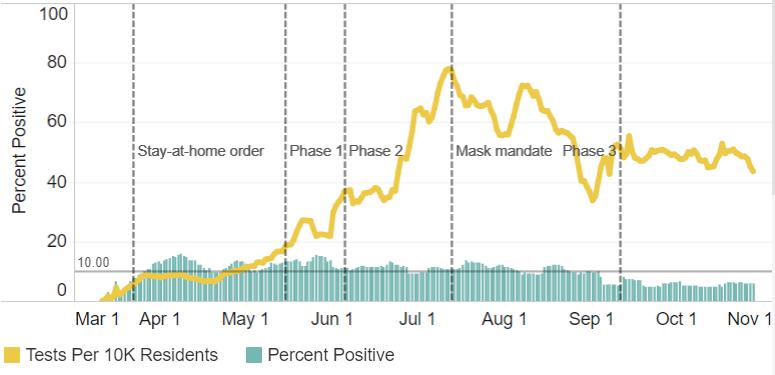
COVID-19 percent positive and test volume in Region 6 as of November 4, 2020.
COVID-19 cases by collection date as of November 4, 2020 in Region 6 with a 7day moving average.
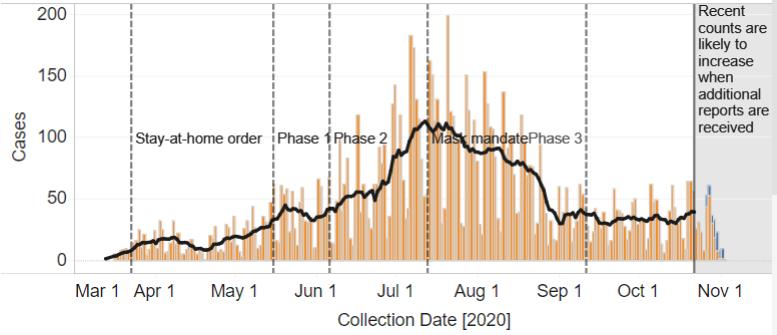
Source: Louisiana Office of Public Health, Region 6 (Central Louisiana), Regional Administrator/Medical Director, David J. Holcombe, MD, MSA, November 4, 2020.
Cases over time by age group in Region 6 through November 4, 2020.
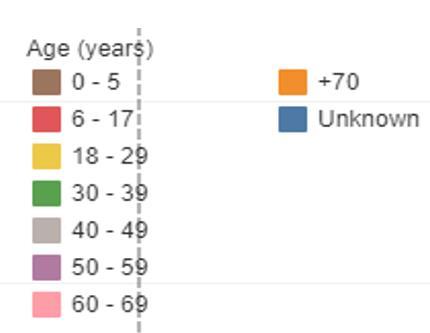
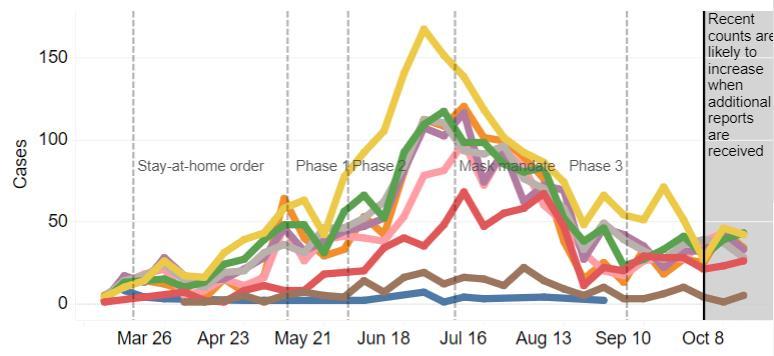
Source: Louisiana Office of Public Health, Region 6 (Central Louisiana), Regional Administrator/Medical Director, David J. Holcombe, MD, MSA, November 4, 2020.
COVID-19 cases statewide by age group as of November 4, 2020.
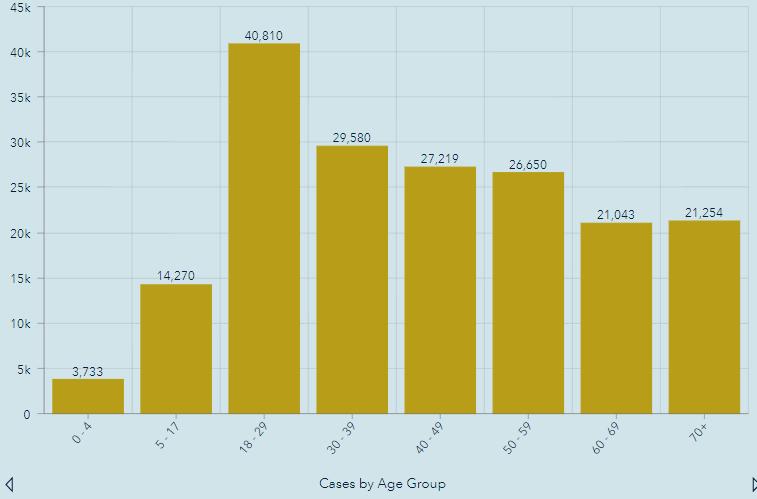
Source: Louisiana Office of Public Health, Region 6 (Central Louisiana), Regional Administrator/Medical Director, David J. Holcombe, MD, MSA, November 4, 2020.
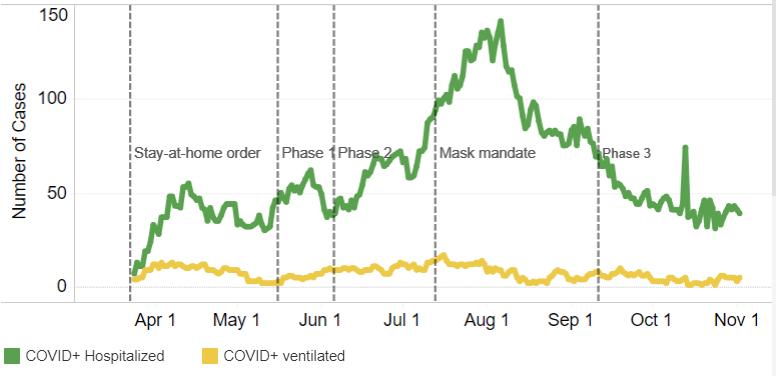
Number of cases hospitalized and ventilated in Region 6 as of November 4, 2020. Source: Louisiana Office of Public Health, Region 6 (Central Louisiana), Regional Administrator/Medical Director, David J. Holcombe, MD, MSA, November 4, 2020.

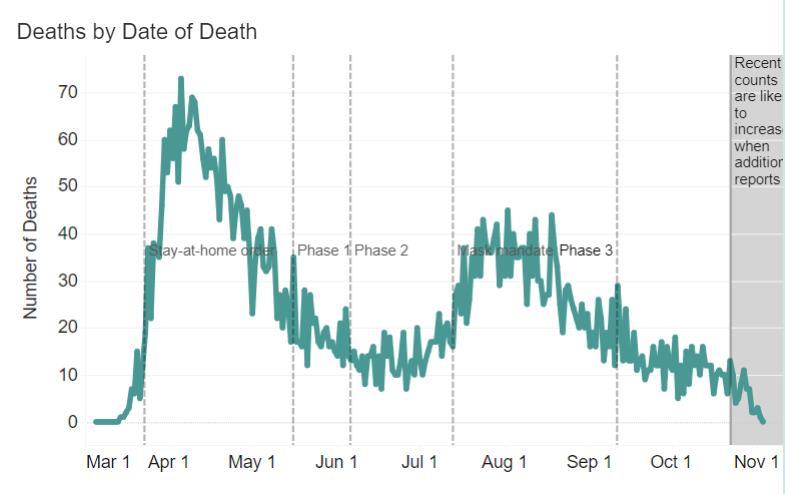
COVID-19 deaths by date of death statewide as of November 4, 2020.
COVID-19 deaths statewide by age group as of November 4, 2020.
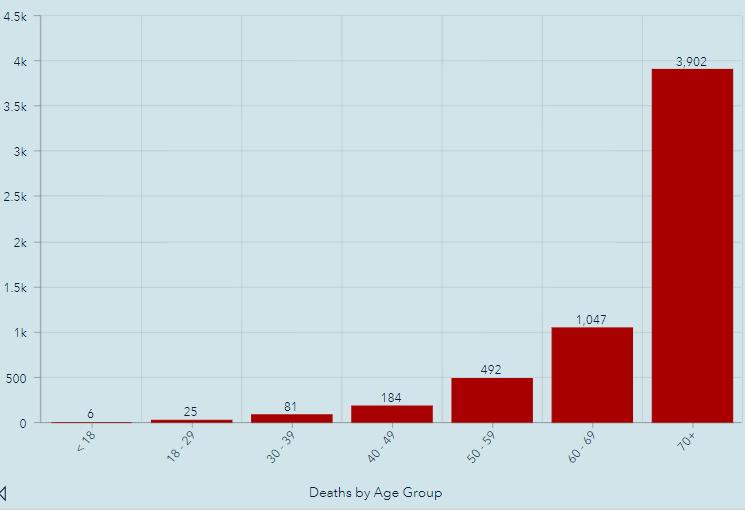
Source: Louisiana Office of Public Health, Region 6 (Central Louisiana), Regional Administrator/Medical Director, David J. Holcombe, MD, MSA, November 4, 2020.


Initial and continued unemployment claims in Louisiana since March 14, 2020.
Average weekly initial unemployment claims filed in October fell from 18,006 in September to 11,717, a 35% decrease. Average weekly continued unemployment claims in October fell from 240,240 in September to 150,363, a 37% decrease. Initial and continued unemployment claims in October reached the lowest level sinceApril.
Source: Louisiana Workforce Commission, November 10, 2020

Initial and continued unemployment claims in Louisiana since March 14, 2020.
Average weekly initial unemployment claims in central Louisiana fell from 906 in September to 570 in October, a 37% decline.
Average weekly continued unemployment claims in central Louisiana fell from 13,702 in September to 9,439 in October, a 31% decline.
Source: Louisiana Workforce Commission, November 10, 2020
The table below shows September 2020 preliminary unemployment rate, labor force, and employment data for Metropolitan Statistical Areas in Louisiana.
At 6.0%, the Alexandria MSA had the lowest unemployment rate among the state’s major metro areas for the sixth straight month, well below the state’s 8.2% rate.
Louisiana’s unemployment rate rose 0.2% in September to 8.2% from 8.0% in August.
Data Source: Louisiana Workforce Commission, November 10, 2020
The chart below shows April through September 2020 unemployment rate among Metropolitan Statistical Areas in Louisiana.

SinceApril, Alexandria (purple column) has had the lowest unemployment rate among Louisiana’s metro areas.
Data Source: Louisiana Workforce Commission, November 10, 2020
Unemployment Rate Among Louisiana Metro Areas since April 2020
The table below shows September 2020 preliminary unemployment rate, labor force, and employment data for central Louisiana parishes.
In September, parishes in central Louisiana had an average unemployment rate of 7.2% compared to 8.2% statewide.
At 4.7%, La Salle had the lowest unemployment rate in the state for the sixth straight month.
Data Source: Louisiana Workforce Commission, November 11, 2020
The table below shows the number of job openings advertised online and advertised salary data for all Sectors in Louisiana in October, 2020.
53% of all job openings in October are in three industries hardest hit during the pandemic – health care, retail trade, and accommodations and food services.
The table below shows the number of unemployed, number of advertised jobs online, and the ratio of unemployed to advertised job openings online in Alexandria MSA in September 2020. Source: Louisiana Workforce Commission, November 10, 2020
Alexandria metro area continues to have the tightest labor market in the state with only 0.73 unemployed person per job opening compared to 2.0 statewide and 3.5 nationally.

(L) The number of job openings advertised online in CENLA in October 2020 and (R) job openings in Alexandria MSA since October 2019. Data Source: Louisiana Workforce Commission, November 10, 2020
Job openings in theAlexandria MSA in October decreased 6.2% from September, but are up 57% since reaching a low in May.
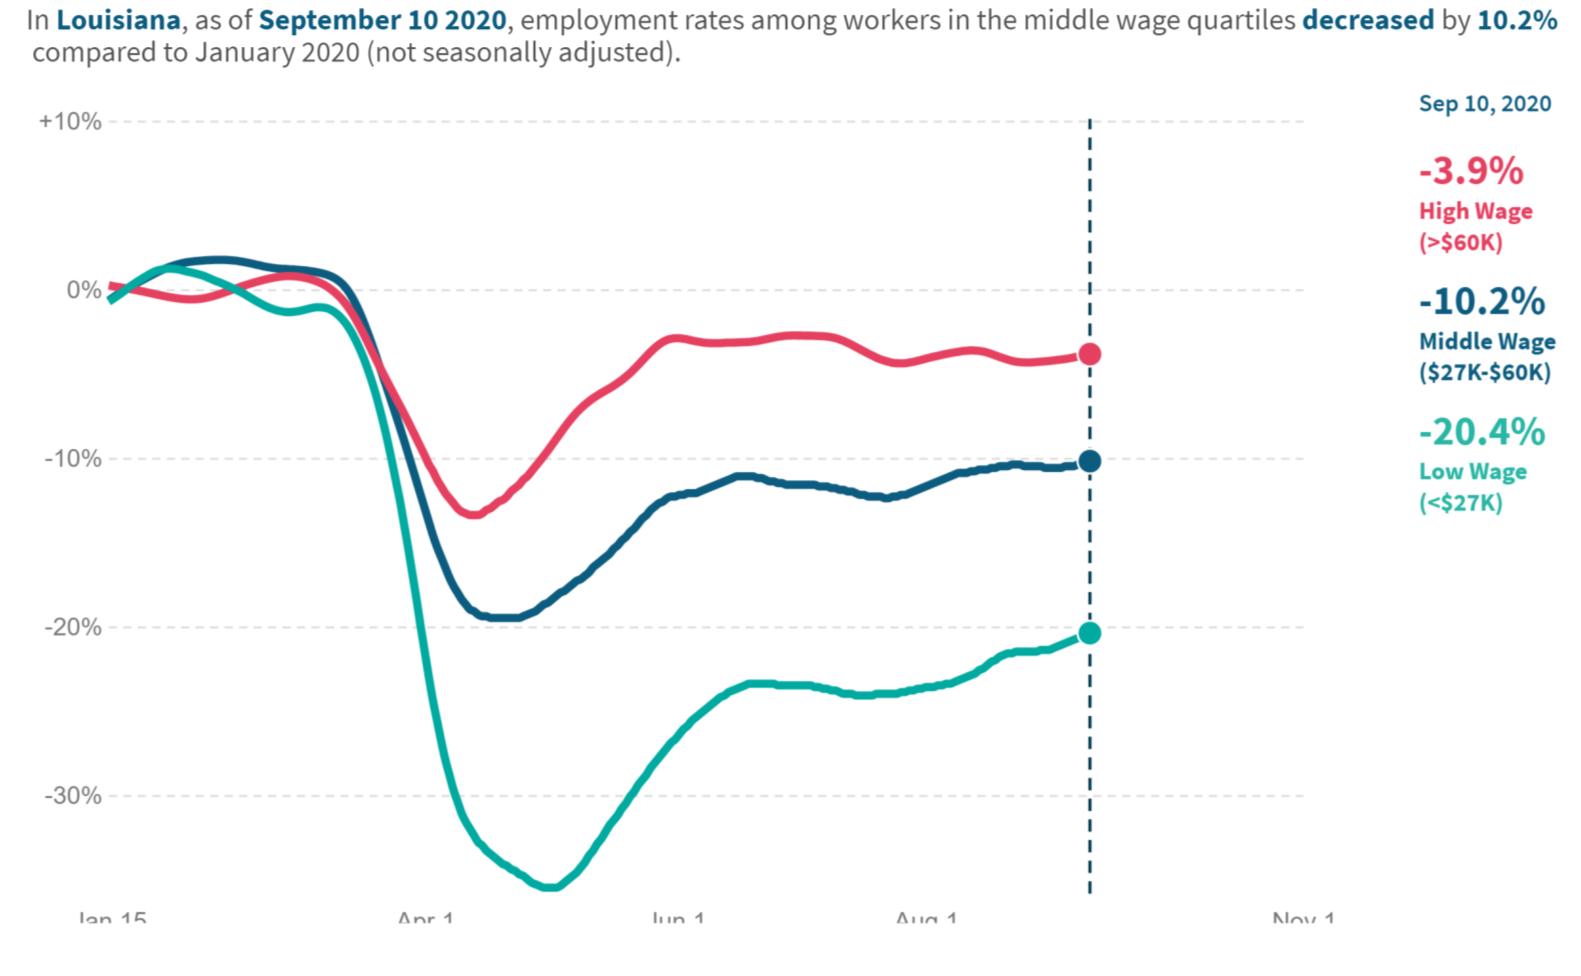
The table and chart represents the percent change in Louisiana by income level as of September 10, 2020 with January 2020 as the baseline.
Low-wage jobs continue to be hardest hit by the pandemic. These jobs are largely in the leisure and hospitality sector.
The tables below shows employers with the highest number of job openings advertised online on November 10, 2020.
An overview of sales, vehicle sales, and hotel occupancy taxes collected in the October 2020.
Note: October tax revenue reflects sales activity in September.
Data Source noted detailed reports.


An overview of sales tax revenue in Rapides Parish other towns and cities in October 2020 (excluding Alexandria and Pineville).
Note: October tax revenue reflects sales activity in September.
Data Source noted detailed reports.
(TR) Alexandria sales tax revenue for October with previous month, year, and YTD comparisons.
(BR) Alexandria monthly sales tax revenue from 2019 to present.
Note: October sales tax revenue reflects sales activity in September.
Data Source: Rapides Parish Police Jury Treasurer’s Reports.
Avoyelles Parish total sales tax revenue for October with previous month, year, and year-to-date comparisons. Vehicle and hotel tax revenues are excluded.
Note: October sales tax revenue reflects sales activity in September.
Data Source: Avoyelles Parish School Board.
Avoyelles Parish vehicle sales tax revenue for October with previous month, year, and year-to-date comparisons.
Note: October sales tax revenue reflects sales activity in September.
Data Source: Avoyelles Parish School Board.
Catahoula Parish total sales tax revenue for October with previous month, year, and year-todate comparisons.
Note: October sales tax revenue reflects sales activity in September.
Data Source: Catahoula Parish Tax Administrator
Concordia Parish total sales tax revenue for October with previous month, year, and year-to-date comparisons.
Note: October sales tax revenue reflects sales activity in September.
Data Source: Concordia Parish Tax Administrator
Evangeline Parish total sales tax revenue for October with previous month, year and YTD comparisons.
Note: October sales tax revenue reflects sales activity in September.
Data Source: Evangeline Parish Sales Tax Commissioner.
Evangeline Parish vehicle sales tax revenue for October with previous month, year and YTD comparisons.
Note: October sales tax revenue reflects sales activity in September.
Data Source: Evangeline Parish Sales Tax Commissioner.
La Salle Parish total sales tax revenue for October with previous month, year, and year-to-date comparisons.
Note: October sales tax revenue reflects sales activity in September.
Data Source: La Salle Parish Tax Administrator

(TR) Pineville sales tax revenue for October with previous month, year, and YTD comparisons.
(BR) Pineville monthly sales tax revenue from 2019 to present.
Note: October sales tax revenue reflects sales activity in September.
Rapides Parish occupational license revenue YTD (January – October) with previous YTD comparisons.
Note: October occupational license revenue reflects licenses issued in September.
Data Source: Rapides Parish Police Jury Treasurer’s Reports.
(TR) Rapides Parish total sales tax revenue for October with previous month, year, and YTD comparisons.
(BR) Rapides Parish total monthly sales tax revenue from 2019 to present.
Note: October sales tax revenue reflects sales activity in September.
Data Source: Rapides Parish Police Jury Treasurer’s Reports.
Rapides Parish vehicle sales tax revenue for October with previous month, year, and YTD comparisons.
Note: October sales tax revenue reflects sales activity in September.
Data Source: Tax revenue data from Rapides Parish Police Jury Treasurer’s Reports.
St. Landry Parish sales tax revenue for October with previous month, year, and YTD comparisons.
Note: October sales tax revenue reflects sales activity in September.
Data Source: Tax revenue data from St. Landry Parish School Board.
St. Landry Parish vehicle sales tax revenue for October with previous month, year, and YTD comparisons.
Note: October sales tax revenue reflects sales activity in September.
Data Source: Tax revenue data from St. Landry Parish School Board.
This chart shows the valuation of permits issued by Rapides Area Planning Commission in Allen Parish in October between 2017-2020 with month-tomonth, year-to-year, and year-to-date comparisons.
Data Source: RapidesArea Planning Commission, October 2020.
This chart shows the valuation of permits issued by Rapides Area Planning Commission in Avoyelles Parish in October between 2019-2020 with month-to-month, year-to-year, and year-to-date comparisons.
Data Source: RapidesArea Planning Commission, October 2020.
This chart shows the valuation of permits issued by Rapides Area Planning Commission in Evangeline Parish in October between 2017-2020 with month-tomonth, year-to-year, and year-to-date comparisons.
Data Source: RapidesArea Planning Commission, October 2020.
This chart shows the valuation of permits issued by Rapides Area Planning Commission in the City of Pineville in October between 20172020 with month-to-month, year-to-year, and year-to-date comparisons.
Data Source: RapidesArea Planning Commission, October 2020.
This charts shows the valuation of permits issued by Rapides Area Planning Commission in Rapides Parish (excluding Alexandria) in October between 2017-2020 with month-to-month, year-to-year, and year-to-date comparisons.
Note: Three projects in Rapides in Feb. 2019 accounted for $29.8 million. Excluding these projects, YTD permit valuations are up 25%.
Data Source: RapidesArea Planning Commission, October 2020.
New residential construction permit valuation (estimated development cost) issued by Rapides Area Planning Commission by jurisdiction in October 2020 compared to October 2019.
Valuation of New Residential Construction
October 2019 vs October 2020
Note: City ofAlexandria permits are accounted for separately.
Data Source: RapidesArea Planning Commission, October 2020.
The valuation (estimated development cost) of new commercial construction permits issued by the City of Alexandria in October 2020 with previous month, year, and YTD comparisons.
The valuation (estimated development cost) of new residential construction permits issued by the City of Alexandria in October 2020 with previous month, year, and YTD comparisons.

The count of active single-family and condo/townhome listings for Alexandria MSA (excludes pending listings) for October 2017-2020 with month-to-month and year-over-year comparisons.
Active listings decreased 50% October 2019.

The count of pending single-family and condo/townhome listings for Alexandria MSA for October 2017-2020 with month-to-month and year-over-year comparisons. Data
Pending Listing Count in Alexandria July 2016 - October 2020
Pending listings increased 39% since October 2019, from 153 to 213.

The median number of days property listings spend on the market in Alexandria MSA for September 2017-2020 with month-to-month and year-over-year comparisons.
Median days on the market decreased 17% since October 2019, but are up 11% for the month.

The median listing price of houses in Alexandria MSA for October 2017-2020 with month-to-month and year-over-year comparisons.
The median listing price increased 27% since October 2019 from $183,300 to $231,950.

The average listing price of houses in Alexandria MSA for October 2017-2020 with month-to-month and year-over-year comparisons.
The average listing price increased 22% since October 2019 from $228,074 to $278,763.


This chart represents non-current mortgages (delinquencies) in Louisiana for the past year.
September 2019 - September 2020
Delinquency
In September, Louisiana had the second highest mortgage delinquency rate in the nation.
Since September 2019, mortgage delinquencies are up 40% in Louisiana.
Avoyelles Parish hotel occupancy tax revenue for October with previous month, year, and year-to-date comparisons.
Note: October tax revenue reflects hotel occupancy activity in September.
Data Source: Avoyelles Parish School Board. October 2020.
Rapides Parish hotel occupancy tax revenue for October 2020 with previous month, year, and YTD comparisons.
Note: October tax revenue reflects hotel occupancy activity in September.
Data Source: Rapides Parish Police Jury Treasurer’s Reports, October 2020.
This chart shows total passenger throughput at Louisiana airports and nationwide in October 2020 as a percent of traffic a year ago.
Passenger Throughput as a Percent a Year Ago
AEX vs Nationwide (October 2020)

As a percent of passenger traffic a year ago,AEX ranked first in the state with traffic running 64% of last year’s level.
Data Source: Alexandria International Airport, November 5, 2020
This chart shows total passenger traffic at Alexandria International hubs in September 2020 relative to traffic a year ago.
September 2020 vs September 2019
In September, Houston (IAH) was 67% below its 2019 traffic count, compared to 45% for Dallas-FW (DFW) and 64% forAtlanta (ATL).
Data Source: IAH, DFW, andATL websites, November 5, 2020

Nationwide daily percentage of passengers passing through TSA checkpoints in 2020 expressed as a percentage of 2019 traffic.
TSA Airport Total Traveler Throughput in 2020 as a Percent 2019 Traffic
Nationwide air passenger traffic in October was 35% of last year’s level, compared to 32% in September and 29% inAugust.
Data Source: DHS, Transportation Security Administration, https://www.tsa.gov/coronavirus/passenger-throughput, November 1, 2020
The table and chart represents the percent change in average consumer credit and debit card spending in Cenla as of October 18, 2020 with January 2020 as the baseline.
The chart below represents the percent change in small business revenue in Louisiana and the U.S. as of September 29, 2020 with January 2020 as the baseline. The table shows the percentage change for small business revenue by industry.
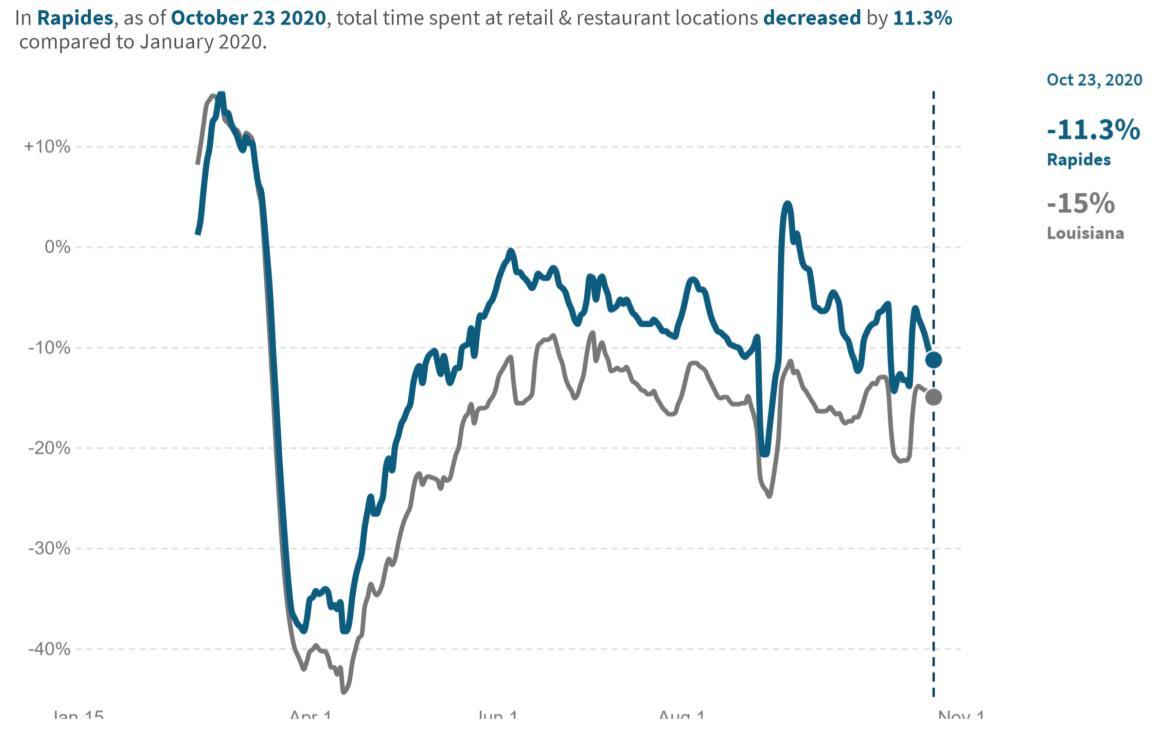
The charts represent the percent of time spent at grocery and retail / restaurant locations in Rapides Parish compared with the state as of October 23, 2020 with January 2020 as the baseline.
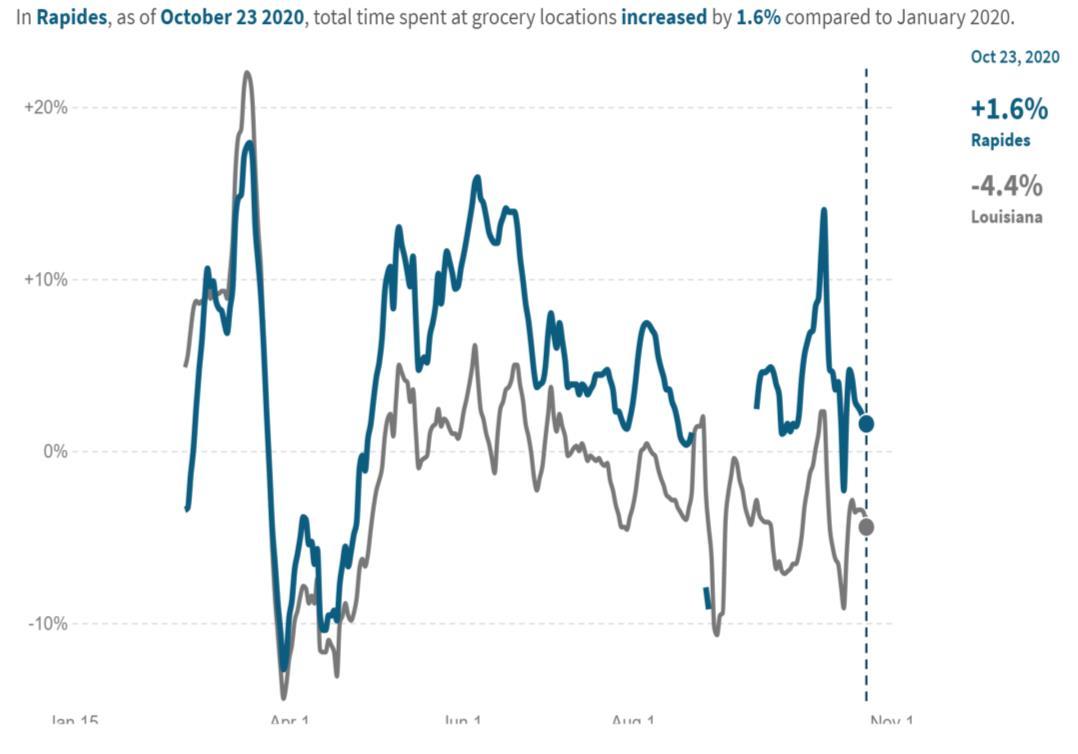
Consumers in Rapides outpaced the state in total time in grocery stores, +1.6% compared to -4.4%. Likewise, Rapides consumers spend more time retail shopping and dining than the statewide average, although the level is still below the January’s level by -11.4%.
The charts represent the percent of time spent at work and away from home in Rapides Parish as compared with the state as of October 23, 2020 with January 2020 as the baseline. Source: Opportunity Insights Economic Tracker, https://www.tracktherecovery.org/ Date Source: Womply. Retrieved November 1, 2020.
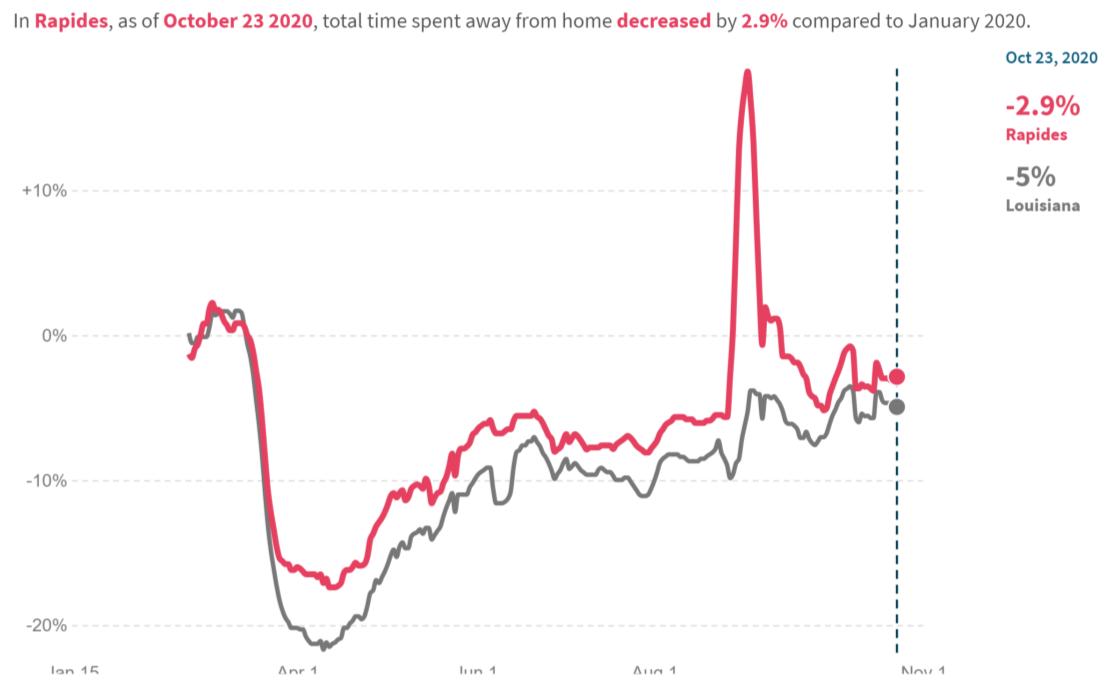
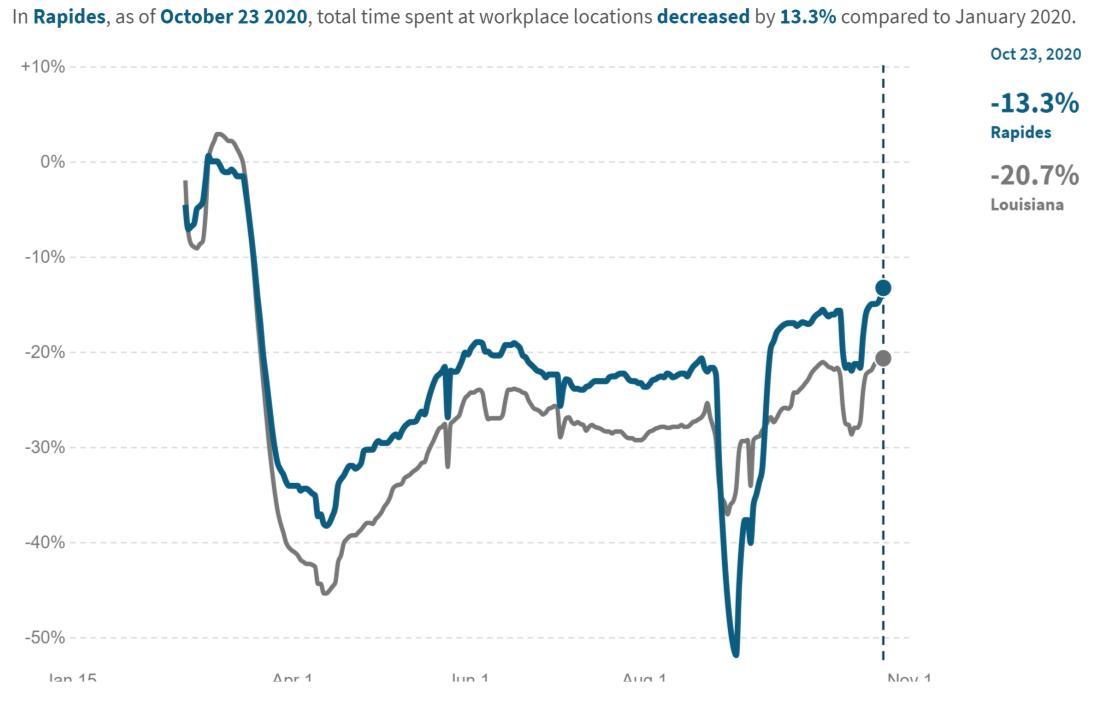
Employees in Rapides spend more time at work than the state average, down -13.3% compared to -20.7% statewide. The only exception was during Hurricane Laura. Likewise, individuals in Rapides spend more time away from home than the statewide average. This was especially true during Hurricane Laura.
(L) Weekly business applications in Louisiana in 2019 and 2020 through October 31.

(R) Breakdown of applications by type of business as of October 31, 2020.
Business Applications in Louisiana 2019 vs 2020
Year-to-date through October 31, 2020, 73,060 business applications have been filed in Louisiana, compared to 47,630 for the same period in 2019, representing a 53% increase.
The Coincident Economic Activity Index for Louisiana includes four indicators: nonfarm payroll employment, the unemployment rate, average hours worked in manufacturing and wages and salaries. The index is set to match the trend for gross state product.
• The chart shows the impact of COVID-19 on the Louisiana’s gross state product since September 2019.
• Index is unchanged in September over August and up 7.5% since April. However, it remains 6.5% below the September 2019 level.
Economic Activity Index for Louisiana September 2019 - September 2020

Data Source: FRED Economic Data, Federal Reserve Bank of St. Louis, November 1, 2020. https://fred.stlouisfed.org/series/LAPHCI
Total gasoline sales in Louisiana since 2019.

In August 2020, Louisiana gasoline sales were up 3.9% over July and 48.3% above April, the low point during the pandemic.
August 2020 gasoline sales of 7.27 million gallons a day exceeded the 7.1 million a year earlier.
Data Source: U.S. Energy Information Administration, November 1, 2020
Represents the number of drilling rigs actively exploring for or developing oil or natural gas in Louisiana and the U.S.


Exploration rig count in Louisiana remains unchanged in October. However, the rig count nationwide is up 8.9% over September.
Source: Baker Hughes, https://rigcount.bakerhughes.com/na-rig-count, November 1, 2020
Gaming revenue in Louisiana for September 2020 with previous month and year comparisons.
September
Data Source: Louisiana Gaming Control Board, November 1 2020. http://lgcb.dps.louisiana.gov/revenue_reports.html
U.S. economic indicators for September 2020.
Data Source: U.S. Census, https://www.census.gov/economic-indicators/, November 10, 2020.
The data presented throughout the CENLA Economic Dashboard reflects contributions from the following local organizations.
• Rapides Parish Policy Jury Treasurer
• Avoyelles Parish School Board
• St. Landry Parish School Board
• Evangeline Parish Sales Tax Commissioner
• Concordia, Catahoula, & La Salle TaxAdministrator
• Alexandria InternationalAirport
• RapidesArea Planning Commission
• City ofAlexandria Planning Division
• Louisiana Office of Public Health, Region 6
Also, special thanks to the following partners for distributing the dashboard.
Next Issue: Week of Dec. 7th
• LSUAFoundation
• Central Louisiana Regional Chamber of Commerce
• Marksville Chamber of Commerce
• Bunkie Chamber of Commerce
• Evangeline Chamber of Commerce
• St. Landry Chamber of Commerce
Current and past issues of the CENLAEconomic Dashboard can be found at http://www.lsua.edu/coronavirus/cenla-economic-dashboard/