CENLA ECONOMIC DASHBOARD
September 10, 2020.
Dr.RandallDupont Dean,CollegeofBusinessLouisianaStateUniversityofAlexandria
rdupont@lsua.edu


September 10, 2020.
Dr.RandallDupont Dean,CollegeofBusinessLouisianaStateUniversityofAlexandria
rdupont@lsua.edu
September 10, 2020 CENLA Economic Dashboard
• COVID-19 cases in Region 6 have been declining and positivity rates are below 10% in all but one Cenla parish.
• Statewide initial weekly unemployment claims filed in August were at the lowest level since the start of the pandemic and continued claims fell 24% inAugust.
• InAugust initial weekly unemployment claims in central Louisiana fell 57% from July while continued claims fell 11%.
• For the fourth straight month, Alexandria had the lowest unemployment rate among the state’s major metro areas at 7.4%, well below the state’s 9.9% rate.
• At 5.9%, La Salle Parish had the lowest unemployment rate in the state for the fourth straight month, while the unemployment rate for central Louisiana stood at 8.6%.
• Alexandria’s metro area had the tightest labor market in the state in July with only 1.03 unemployed persons per job opening compared to 2.5 statewide and 3.5 nationally.
• Job openings in theAlexandria metro area increased 50% since reaching a low of 3,187 openings in May. ByAugust, job openings were at the highest level in the past year with 4,783 listings.
• All nine jurisdictions in central Louisiana reported lower tax revenues inAugust, reflecting lower consumer spending in July compared to June. Decreases ranged from -21% in St. Landry to -3% in Evangeline. However, July 2020 sales activity outperformed July 2019 activity in all reporting jurisdictions with Evangeline’s 16.5% year-over-year increase registering the highest to date.

• Year-to-date all nine central Louisiana jurisdictions reported increases over the previous period except forAlexandria and Concordia, which were 1.0% or less behind.
• Vehicle sales continue to outperform on a monthly, yearover-year, and year-to-date basis in all four jurisdictions reporting except forAlexandria which had a 10% decline in July sales following a 52% monthly increase in June.
• Hotel occupancy continues weak across all three timeframes, except for the 12% gain in Avoyelles in July over June.
• The valuation of all permits in central Louisiana fell 27% in August 2020 compared toAugust 2019. However, permit valuations in Pineville increased 53% in the same period.
• Total Rapides Parish permit valuations decreased 41% in August over July and are 41% year-to-date below to the same period last year. Although residential construction permits are up 6% in Rapides in August, residential construction remains 21% below last year’s level.
• Anumber indicators point to a strong housing marketing in theAlexandria metro area. Since January, active listing are down 37%, pending listing up 71%, median days on the market down 42%, and the median listing price up 22%.
• In July, Louisiana had the second highest mortgage delinquency rate in the US at 11.8%. Past hurricanes have added 5.5% points to the pre-storm rate in affected areas.
• Total passenger traffic at Alexandria International airport (AEX) averaged 59% of traffic last August compared to only 29% nationwide.
• AEX passenger traffic inAugust was 5,815, up 335% from its low of 1,334 inApril. AEX passenger traffic has increased every month since April.
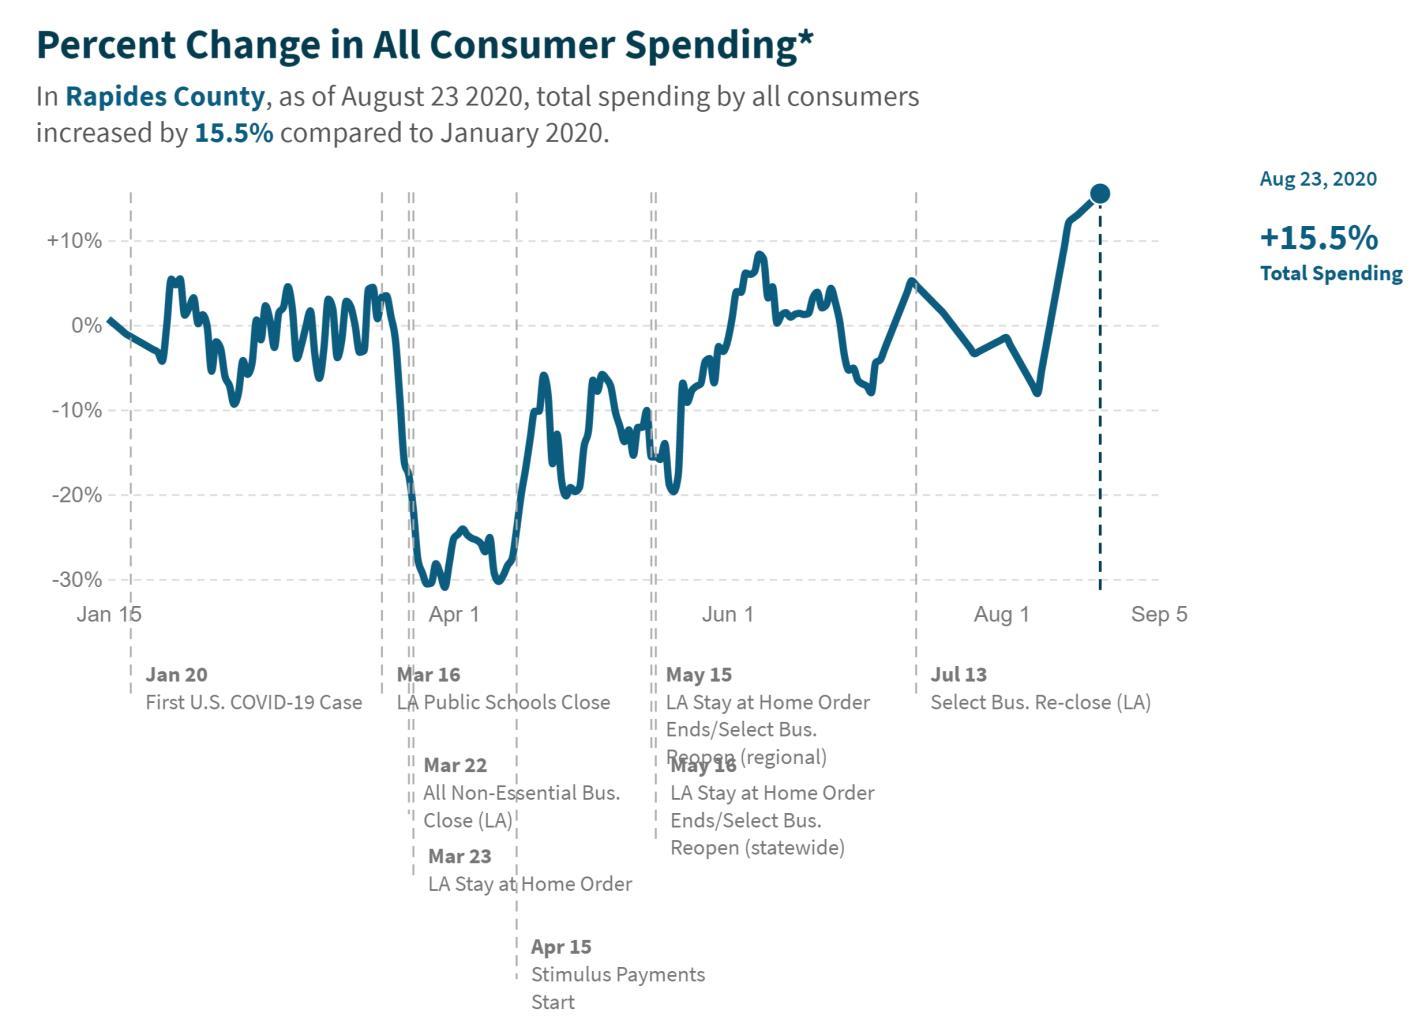
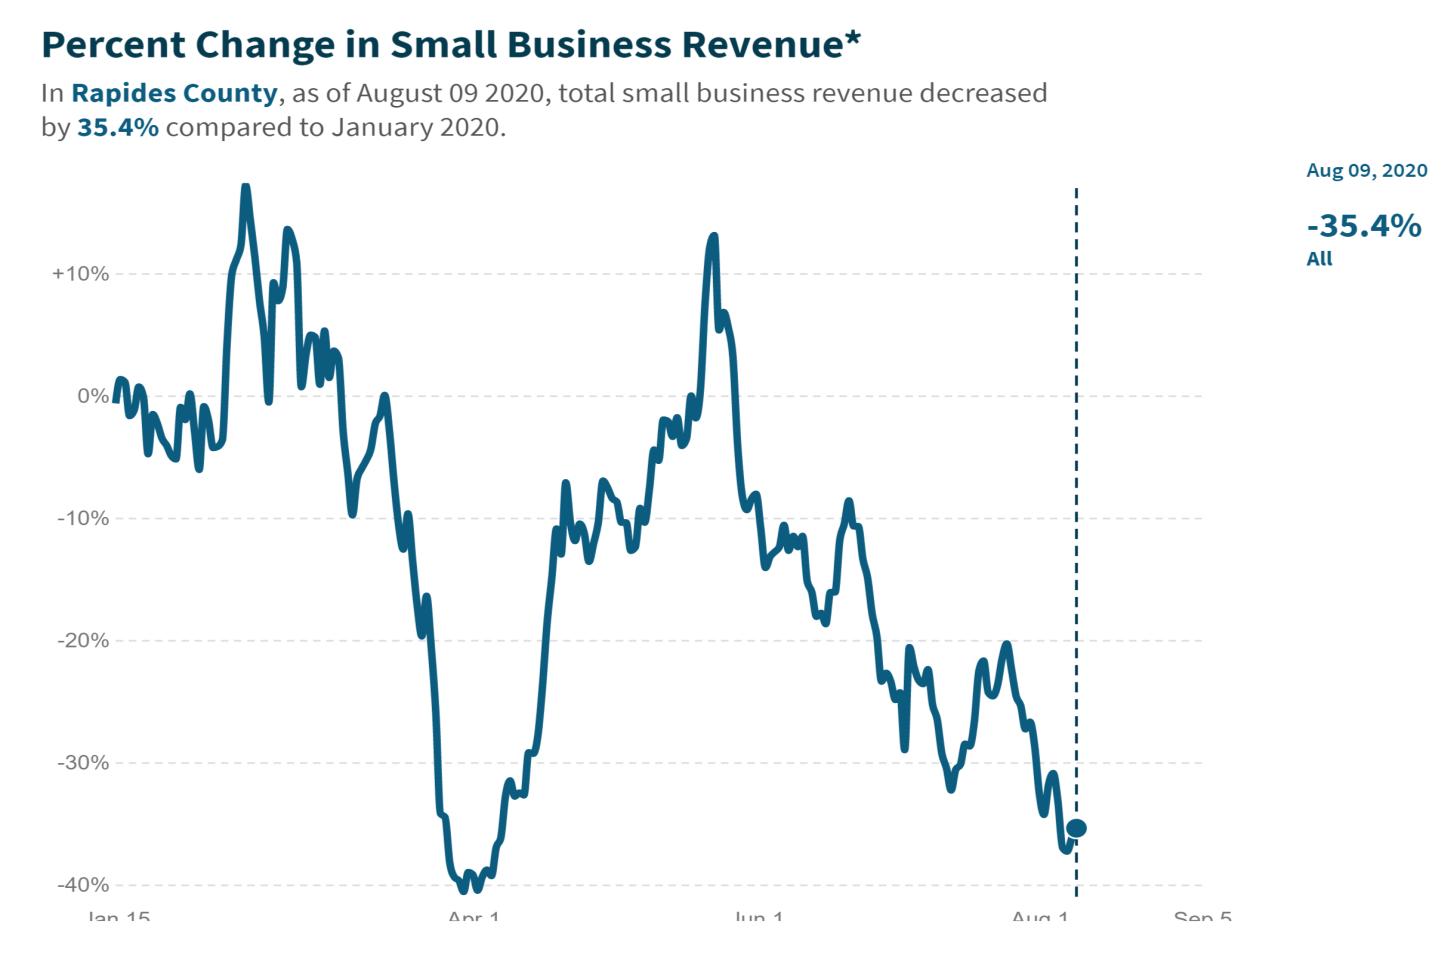
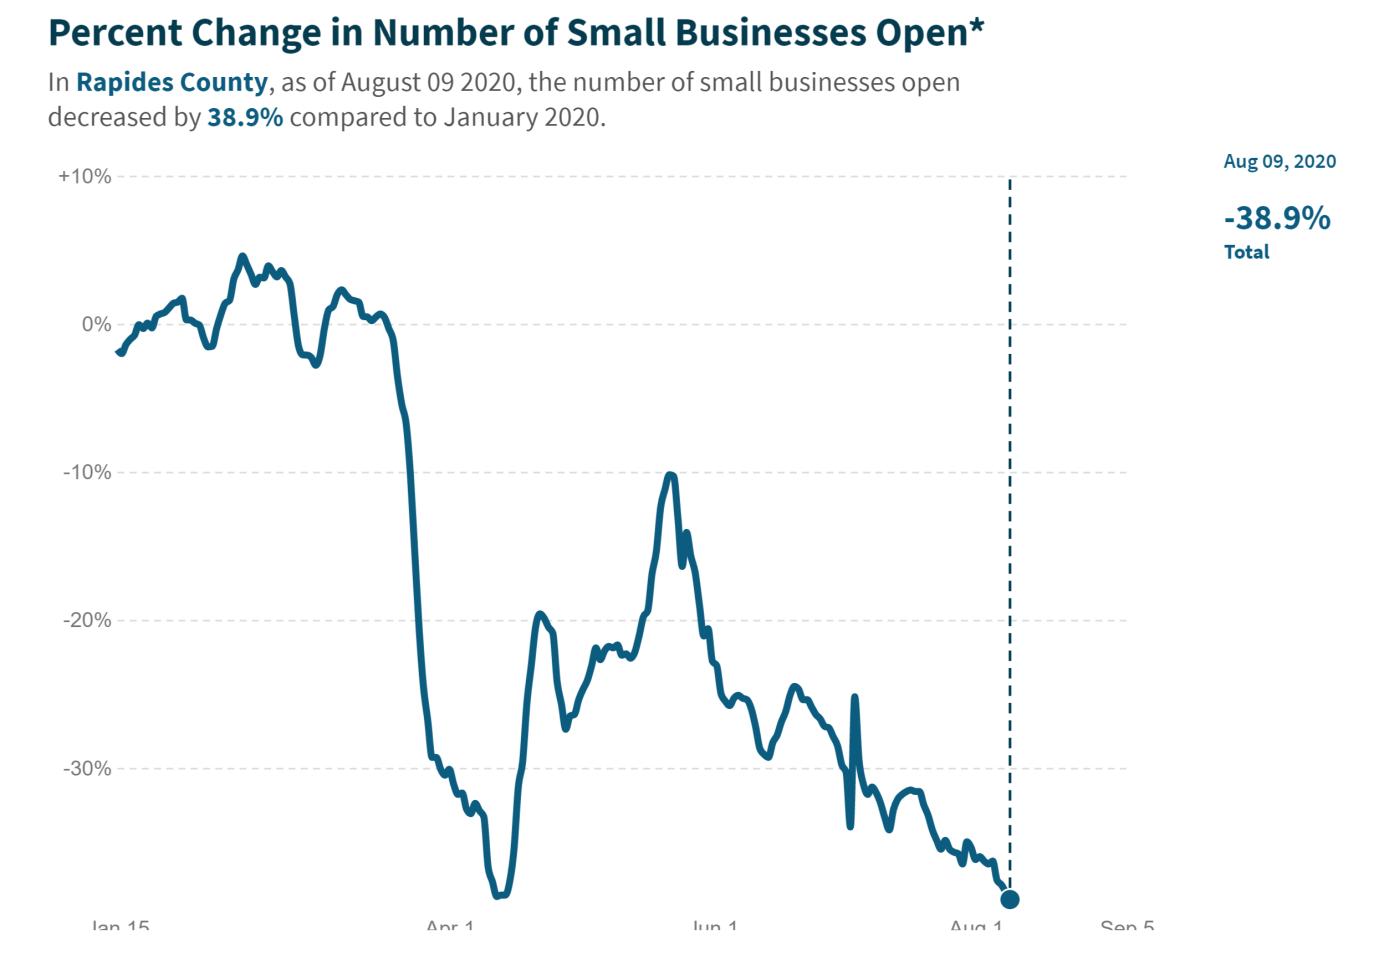
• Using data from financial transactions, Opportunity Insights reports consumer spending in Rapides was up 15% in August compared to January 2020. However, small business revenue was down 35% and 39% of small businesses reported transactions, indicating the business may have closed.
• Through the end ofAugust, 58,160 business applications have been filed in Louisiana, compared to 39,300 for the same period in 2019, representing a 48% increased. 16,540 of the applications filed in 2020 have a high-propensity for turning into a business with a payroll, including 7,890 which are already planning to pay wages.
• The Baker Hughes Rig Count shows a 27% increase in exploration rigs in Louisiana since August 4, the first monthly increase this year.
• Nationally, residential construction was up 23% in July over June, while residential sales and durable good were up 14% and 11% respectively over the same period.
COVID-19 parish testing statistics as of September 3, 2020.
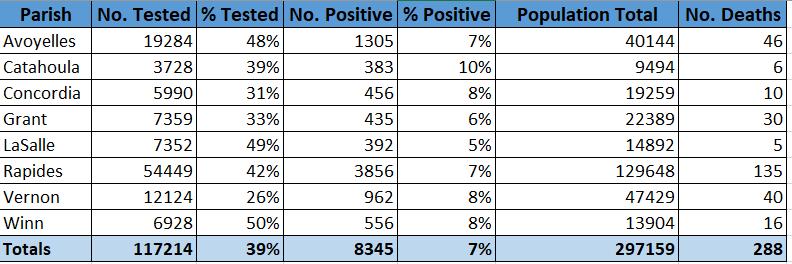
Source: Louisiana Office of Public Health, Region 6 (Central Louisiana), Regional Administrator/Medical Director, David J. Holcombe, MD, MSA, September 8, 2020.
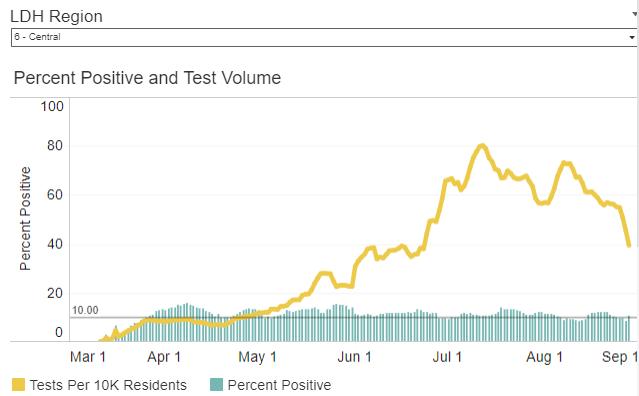
COVID-19 percent positive and test volume in Region 6 as of September 4, 2020. Source:
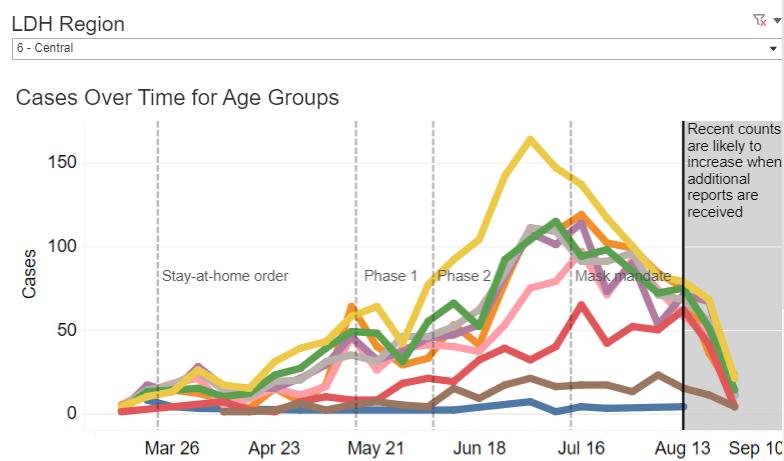
COVID-19 cases by collection date as of September 4, 2020 in Region 6 with a 7day moving average.
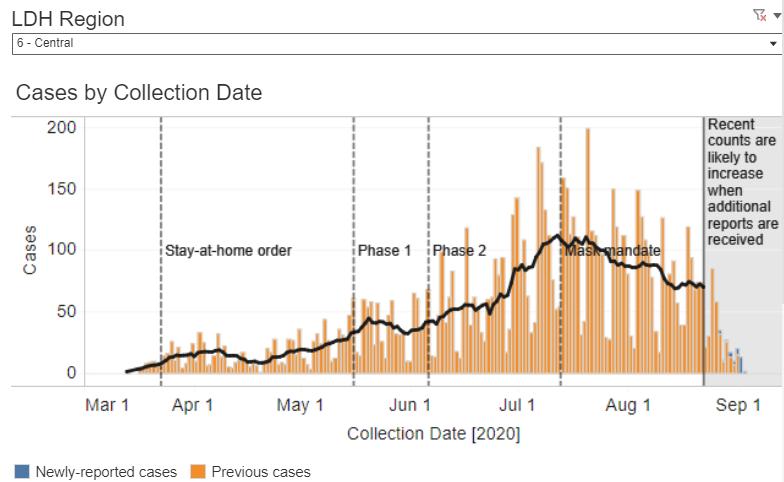
Source: Louisiana Office of Public Health, Region 6 (Central Louisiana), Regional Administrator/Medical Director, David J. Holcombe, MD, MSA, September 8, 2020.
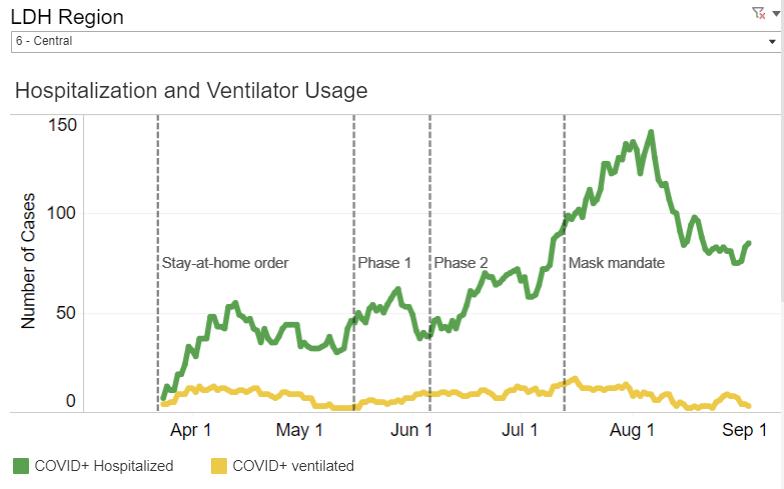
Number of cases hospitalized and ventilated in Region 6 as of August 22, 2020. Source: Louisiana Office of Public Health, Region 6 (Central Louisiana), Regional Administrator/Medical Director, David J. Holcombe, MD, MSA, September 8, 2020.

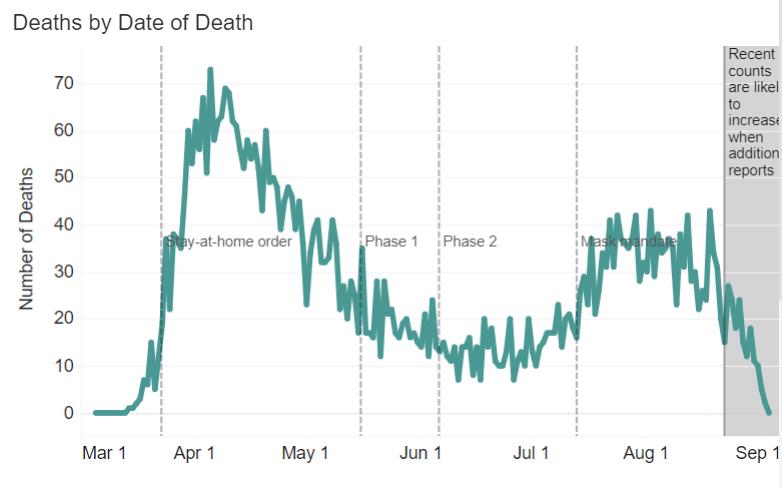
COVID-19 deaths by date of death statewide as of September 4, 2020.
Covid-19 deaths by age group as of September 2, 2020.
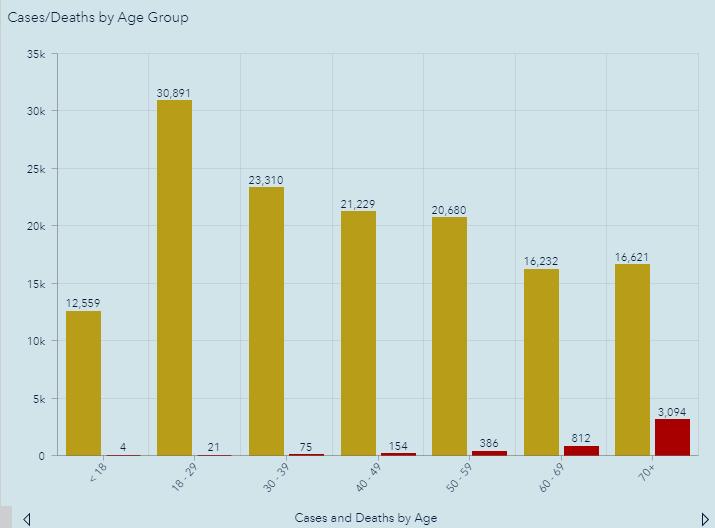
Source: Louisiana Office of Public Health, Region 6 (Central Louisiana), Regional Administrator/Medical Director, David J. Holcombe, MD, MSA, September 8, 2020.


Initial and continued unemployment claims in Louisiana since March 14, 2020.
Initial weekly unemployment claims filed in August were at the lowest level since the start of the pandemic, averaging 13,560 a week.
Continued weekly unemployment claims statewide fell 24% duringAugust.
Source: Louisiana Workforce Commission, September 7, 2020

Initial and continued unemployment claims in Louisiana since March 14, 2020.
August initial weekly unemployment claims in central Louisiana fell 57% from July levels.
August continued weekly unemployment claims in central Louisiana fell 11% from July.
Source: Louisiana Workforce Commission, September 7, 2020
The table below shows July 2020 preliminary unemployment rate, labor force, and employment data for Metropolitan Statistical Areas in Louisiana.
At 7.4%, the Alexandria MSA had the lowest unemployment rate among the state’s major metro areas for the fourth straight month, well below the state’s 9.9% rate.
Data Source: Louisiana Workforce Commission, September 7, 2020
The chart below shows January through July 2020 unemployment rate among Metropolitan Statistical Areas in Louisiana.

In January and February, Alexandria (black line) had the 2nd and 3rd highest employment rates in the state. Since April,Alexandria has had the lowest unemployment rate among Louisiana’s metro areas.
Data Source: Louisiana Workforce Commission, September 7, 2020
The table below shows July 2020 preliminary unemployment rate, labor force, and employment data for central Louisiana parishes.
In July, parishes in central Louisiana had an average unemployment rate of 8.6% compared to 9.9% statewide.
La Salle had the lowest unemployment rate in the state for the fourth straight month.
Data Source: Louisiana Workforce Commission, September 7, 2020
The table below shows the number of unemployed, number of advertised jobs online, and the ratio of unemployed to advertised job openings online in Alexandria MSA in July 2020. Source: Louisiana Workforce Commission, September 7, 2020
Alexandria metro area has the tightest labor market in the state with only 1.03 unemployed persons per job opening compared to 2.5 statewide and 3.5 nationally.

(L) The number of job openings advertised online in Cenla in August 2020 and (R) job openings in Alexandria MSA since August 2019.
Job openings in theAlexandria MSAincreased 50% since reaching a low in May and is at the highest level in the past year at 4,783.
An overview of sales, vehicle sales, and hotel occupancy taxes collected in the August 2020.
Note: August tax revenue reflects sales activity in July.
Data Source noted detailed reports.
(TR) Alexandria sales tax revenue for August with previous month, year, and YTD comparisons.
(BR) Alexandria monthly sales tax revenue from 2017 to present.
Note: August sales tax revenue reflects sales activity in July.

Avoyelles Parish total sales tax revenue for August with previous month, year, and year-to-date comparisons. Vehicle and hotel tax revenues are excluded.
Note: August sales tax revenue reflects sales activity in July.
Data Source: Avoyelles Parish School Board.
Avoyelles Parish vehicle sales tax revenue for August with previous month, year, and year-to-date comparisons.
Note: August sales tax revenue reflects sales activity in July.
Data Source: Avoyelles Parish School Board.
Catahoula Parish total sales tax revenue for August with previous month, year, and year-to-date comparisons.
Note: August sales tax revenue reflects sales activity in July.
Data Source: Catahoula Parish Tax Administrator
Concordia Parish total sales tax revenue for August with previous month, year, and year-to-date comparisons.
Note: August sales tax revenue reflects sales activity in July.
Data Source: Concordia Parish Tax Administrator
Evangeline Parish total sales tax revenue for August with previous month, year and YTD comparisons.
Note: August sales tax revenue reflects sales activity in July.
Data Source: Evangeline Parish Sales Tax Commissioner.
Evangeline Parish vehicle sales tax revenue for August with previous month, year and YTD comparisons.
Note: August sales tax revenue reflects sales activity in July.
Data Source: Evangeline Parish Sales Tax Commissioner.
La Salle Parish total sales tax revenue for August with previous month, year, and year-to-date comparisons.
Note: August sales tax revenue reflects sales activity in July.
Data Source: La Salle Parish Tax Administrator
(TR) Pineville sales tax revenue for August with previous month, year, and YTD comparisons.
(BR) Pineville monthly sales tax revenue from 2017 to present. Data

Note: August sales tax revenue reflects sales activity in July.
Rapides Parish occupational license revenue for August YTD with previous YTD comparisons.
Note: August occupational license revenue reflects licenses issued in July.
Data Source: Rapides Parish Police Jury Treasurer’s Reports.
(TR) Rapides Parish total sales tax revenue for August with previous month, year, and YTD comparisons.
(BR) Rapides Parish total monthly sales tax revenue from 2017 to present.

Note: August sales tax revenue reflects sales activity in July.
Data Source: Rapides Parish Police Jury Treasurer’s Reports.
Rapides Parish vehicle sales tax revenue for August with previous month, year, and YTD comparisons.
Note: August sales tax revenue reflects sales activity in July.
Data Source: Tax revenue data from Rapides Parish Police Jury Treasurer’s Reports.
St. Landry Parish sales tax revenue for August with previous month, year, and YTD comparisons.
Note: August sales tax revenue reflects sales activity in July.
Data Source: Tax revenue data from St. Landry Parish School Board.
St. Landry Parish vehicle sales tax revenue for August with previous month, year, and YTD comparisons.
Note: August sales tax revenue reflects sales activity in July.
Data Source: Tax revenue data from St. Landry Parish School Board.
This chart shows the number of permits issued by Rapides Area Planning Commission in August between 2017-2020 for major RAPC jurisdictions.
Note: Avoyelles Parish data not included until 2019. City ofAlexandria permits are accounted for separately.
Data Source: RapidesArea Planning Commission,August 2020.
This chart shows the valuation of permits issued by Rapides Area Planning Commission in August between 2017-2020 for major jurisdictions.
Note: Avoyelles Parish data not included until 2019. City ofAlexandria permits are accounted for separately.
Data Source: RapidesArea Planning Commission,August 2020.
This chart shows the valuation of permits issued by Rapides Area Planning Commission in Allen Parish in August between 2017-2020 with month-tomonth, year-to-year, and year-to-date comparisons.
Data Source: RapidesArea Planning Commission,August 2020.
This chart shows the valuation of permits issued by Rapides Area Planning Commission in Avoyelles Parish in August between 2019-2020 with month-to-month, year-to-year, and year-to-date comparisons.
Data Source: RapidesArea Planning Commission,August 2020.
This chart shows the valuation of permits issued by Rapides Area Planning Commission in Evangeline Parish in August between 2017-2020 with month-to-month, year-to-year, and year-to-date comparisons.
Data Source: RapidesArea Planning Commission,August 2020.
This chart shows the valuation of permits issued by Rapides Area Planning Commission in the City of Pineville in August between 20172020 with month-to-month, year-to-year, and year-to-date comparisons.
Data Source: RapidesArea Planning Commission,August 2020.
This charts shows the valuation of permits issued by Rapides Area Planning Commission in Rapides Parish (excluding Alexandria) in August between 2017-2020 with month-to-month, year-to-year, and year-to-date comparisons.
Note: Three projects in Rapides in Feb. 2019 accounted for $29.8 million. Excluding these projects, YTD permit valuations are up 18.4%.
Data Source: RapidesArea Planning Commission,August 2020.
New residential construction permit valuation (estimated development cost) issued by Rapides Area Planning Commission by jurisdiction in August 2020 compared to August 2019.
Valuation of New Residential Construction August 2019 vs August 2020
Note: City ofAlexandria permits are accounted for separately.
Data Source: RapidesArea Planning Commission,August 2020.
The valuation (estimated development cost) of new commercial construction permits issued by the City of Alexandria in August 2020 with previous month, year, and YTD comparisons.
The valuation (estimated development cost) of new residential construction permits issued by the City of Alexandria in August 2020 with previous month, year, and YTD comparisons.

The count of active single-family and condo/townhome listings for Alexandria MSA (excludes pending listings) for August 20172020 with month-to-month and year-over-year comparisons.
Active listings decreased 37% since January, from 459 in January to 289 inAugust.

The count of pending single-family and condo/townhome listings for Alexandria MSA for August 2017-2020 with month-to-month and year-over-year comparisons.
Pending listings increased 245% since January, from 71 in January to 245 inAugust.

The median number of days property listings spend on the market in Alexandria MSA for August 2017-2020 with month-to-month and year-over-year comparisons.
Median days on the market decreased 42% since January, from 95 days in January to 55 inAugust.

The median listing price of houses in Alexandria MSA for August 2017-2020 with month-to-month and year-over-year comparisons.
The median listing price increased 22% since January, from $179,950 in January to $219,050 inAugust.

The average listing price of houses in Alexandria MSA for August 2017-2020 with month-to-month and year-over-year comparisons.
The average listing price increased 21% since January, from $217,927 in January to $263,608 inAugust.

The median listing price per square foot of houses in Alexandria MSA for June 2017-2020 with month-to-month and year-over-year comparisons.
The median price per square foot increased 7.5% since January, from $98.44/sf in January to $105.85 /sf in August.
This chart represents non-current mortgages (delinquencies) in Louisiana for the past year.
2020
Delinquency
Rate in July
U.S. 6.91% LA 11.77%


In July Louisiana had the second highest mortgage delinquency rate in the nation. Since April, Covid-19 added an average of 3.7 percentage points to the delinquency rate.
Hurricanes Harvey and Irma in 2017 drove mortgage delinquencies in affected areas up an additional 5.5 percentage points above pre-storm levels by the second month following the storms.
Avoyelles Parish hotel occupancy tax revenue for August with previous month, year, and year-to-date comparisons.
Note: August tax revenue reflects hotel occupancy activity in July.
Data Source: Avoyelles Parish School Board. August 2020.
Rapides Parish hotel occupancy tax revenue for August 2020 with previous month, year, and YTD comparisons.
Note: August tax revenue reflects hotel occupancy activity in July.
Data Source: Rapides Parish Police Jury Treasurer’s Reports, August 2020.
This chart shows total passenger throughput at Alexandria International and nationwide in August 2020 as a percent of traffic a year ago.
Passenger Throughput as a Percent a Year Ago
AEX vs Nationwide (August 1 - 31)
100.00%
80.00%
Average percent of travelers at AEX inAugust compared to a year ago. 0.00%
59% Average percent of travelers nationwide in August compared to a year ago. 20.00%
60.00%
29% 40.00%
120.00% 8/1/2020 8/2/2020 8/3/2020 8/4/2020 8/5/2020 8/6/2020 8/7/2020 8/8/2020 8/9/2020 8/10/2020 8/11/2020 8/12/2020 8/13/2020 8/14/2020 8/15/2020 8/16/2020 8/17/2020 8/18/2020 8/19/2020 8/20/2020 8/21/2020 8/22/2020 8/23/2020 8/24/2020 8/25/2020 8/26/2020 8/27/2020 8/28/2020 8/29/2020 8/30/2020 8/31/2020

Hurricane Laura
US AEX
This chart shows total passenger traffic at Alexandria International hubs in July 2020 relative to traffic a year ago. Data Source: Alexandria International Airport, September 5, 2020
Houston (IAH) regained 67% of its traffic in July from a year ago, compared to 45% for DallasFW (DFW) and 23% forAtlanta (ATL).

Nationwide daily percentage of passengers passing through TSA checkpoints in 2020 expressed as a percentage of 2019 traffic.
Nationwide air passenger traffic reached a pandemic high during the Labor Day weekend registering 44% of 2019’s level.
Data Source: DHS, Transportation Security Administration, https://www.tsa.gov/coronavirus/passenger-throughput, September 5, 2020
The table and chart represents the percent change in average consumer credit and debit card spending in Cenla as of September 2, 2020 with January 2020 as the baseline.
The table and chart represents the percent change in net business revenue for small businesses in Cenla as of August 21, 2020 with January 2020 as the baseline.
The table and chart represents the percent change in small businesses open (defined as having financial transaction activity) in Cenla as of August 9, 2020 with January 2020 as the baseline.
(L) Weekly business applications in Louisiana in 2019 and 2020.

(R) Breakdown of applications by type of business as of August 29, 2020.
Sole Proprietor High-Propensity to Pay Wages Planned Wages Corporations
Year-to-date throughAugust 29, 2020, 58,160 business applications have been filed in Louisiana, compared to 39,300 for the same period in 2019, representing a 48% increased.
Of the applications filed in 2020, 16,540 have a high-propensity for turning into a business with a payroll, including 7,890 which are already planning to pay wages.
The Coincident Economic Activity Index for Louisiana includes four indicators: nonfarm payroll employment, the unemployment rate, average hours worked in manufacturing and wages and salaries. The index is set to match the trend for gross state product.
• The chart shows the impact of COVID-19 on the Louisiana’s gross state product over the past 12 months.
Coincident Economic Activity Index for Louisiana August 2019 - July 2020

• Index is up 1.7% in July over June.
Data Source: FRED Economic Data, Federal Reserve Bank of St. Louis, Sept. 5, 2020. https://fred.stlouisfed.org/series/LAPHCI
Total gasoline sales in Louisiana for the past 12 months.
• In June 2020, Louisiana gasoline sales were up 8.1% over May and 37.7% above April, the low point during the pandemic.
June 2020 sales were only 6.6% below June 2019 and 7.4% below January 2020.
Data Source: U.S. Energy Information Administration, September 5, 2020
Represents the number of drilling rigs actively exploring for or developing oil or natural gas in Louisiana and the U.S.
Rig Count in Louisiana & US
January 2020 - Present
24
TOTAL


60 30 32
Exploration rig count in Louisiana is up 27% since bottoming on August 4, while the U.S. rig count is up 5% in the past month.
Source: Baker Hughes, https://rigcount.bakerhughes.com/na-rig-count, September 5, 2020
Gaming revenue in Louisiana for July 2020 with previous month and year comparisons.
Data Source: Louisiana Gaming Control Board, July 2020. http://lgcb.dps.louisiana.gov/revenue_reports.html
This data shows year-overyear seated diners at restaurants on the OpenTable network in Louisiana. Year-over-year comparisons by day compare the same day of the week from the same week in the previous year.
Reservations for seated diners have risen from 100% down on May 14 (end of stay-at-home order) to only 29% down on September 4, using Feb. 18th as a baseline.
Source: OpenTable, https://www.opentable.com/state-of-industry, September 5, 2020
May 14, 2020 - Present

U.S. economic indicators for June 2020.
Data Source: U.S. Census, https://www.census.gov/economic-indicators/, September 5, 2020.
The data presented throughout the CENLA Economic Dashboard reflects contributions from the following local organizations.
• Rapides Parish Policy Jury Treasurer
• Avoyelles Parish School Board
• St. Landry Parish School Board
• Evangeline Parish Sales Tax Commissioner
• Concordia, Catahoula, & La Salle TaxAdministrator
• Alexandria InternationalAirport
• RapidesArea Planning Commission
• City ofAlexandria Planning Division
• St. Landry Parish Permit Office
• Louisiana Office of Public Health, Region 6
Also, special thanks to the following partners for distributing the dashboard.
Next Issue: Week of Oct. 12th
• LSUAFoundation
• Central Louisiana Regional Chamber of Commerce
• Marksville Chamber of Commerce
• Bunkie Chamber of Commerce
• Evangeline Chamber of Commerce
Current and past issues of the CENLA Economic Dashboard can be found at http://www.lsua.edu/coronavirus/cenla-economic-dashboard/