CENLA ECONOMIC DASHBOARD
August 11, 2020.
Dr.RandallDupont Dean,CollegeofBusinessLouisianaStateUniversityofAlexandria
rdupont@lsua.edu


August 11, 2020.
Dr.RandallDupont Dean,CollegeofBusinessLouisianaStateUniversityofAlexandria
rdupont@lsua.edu
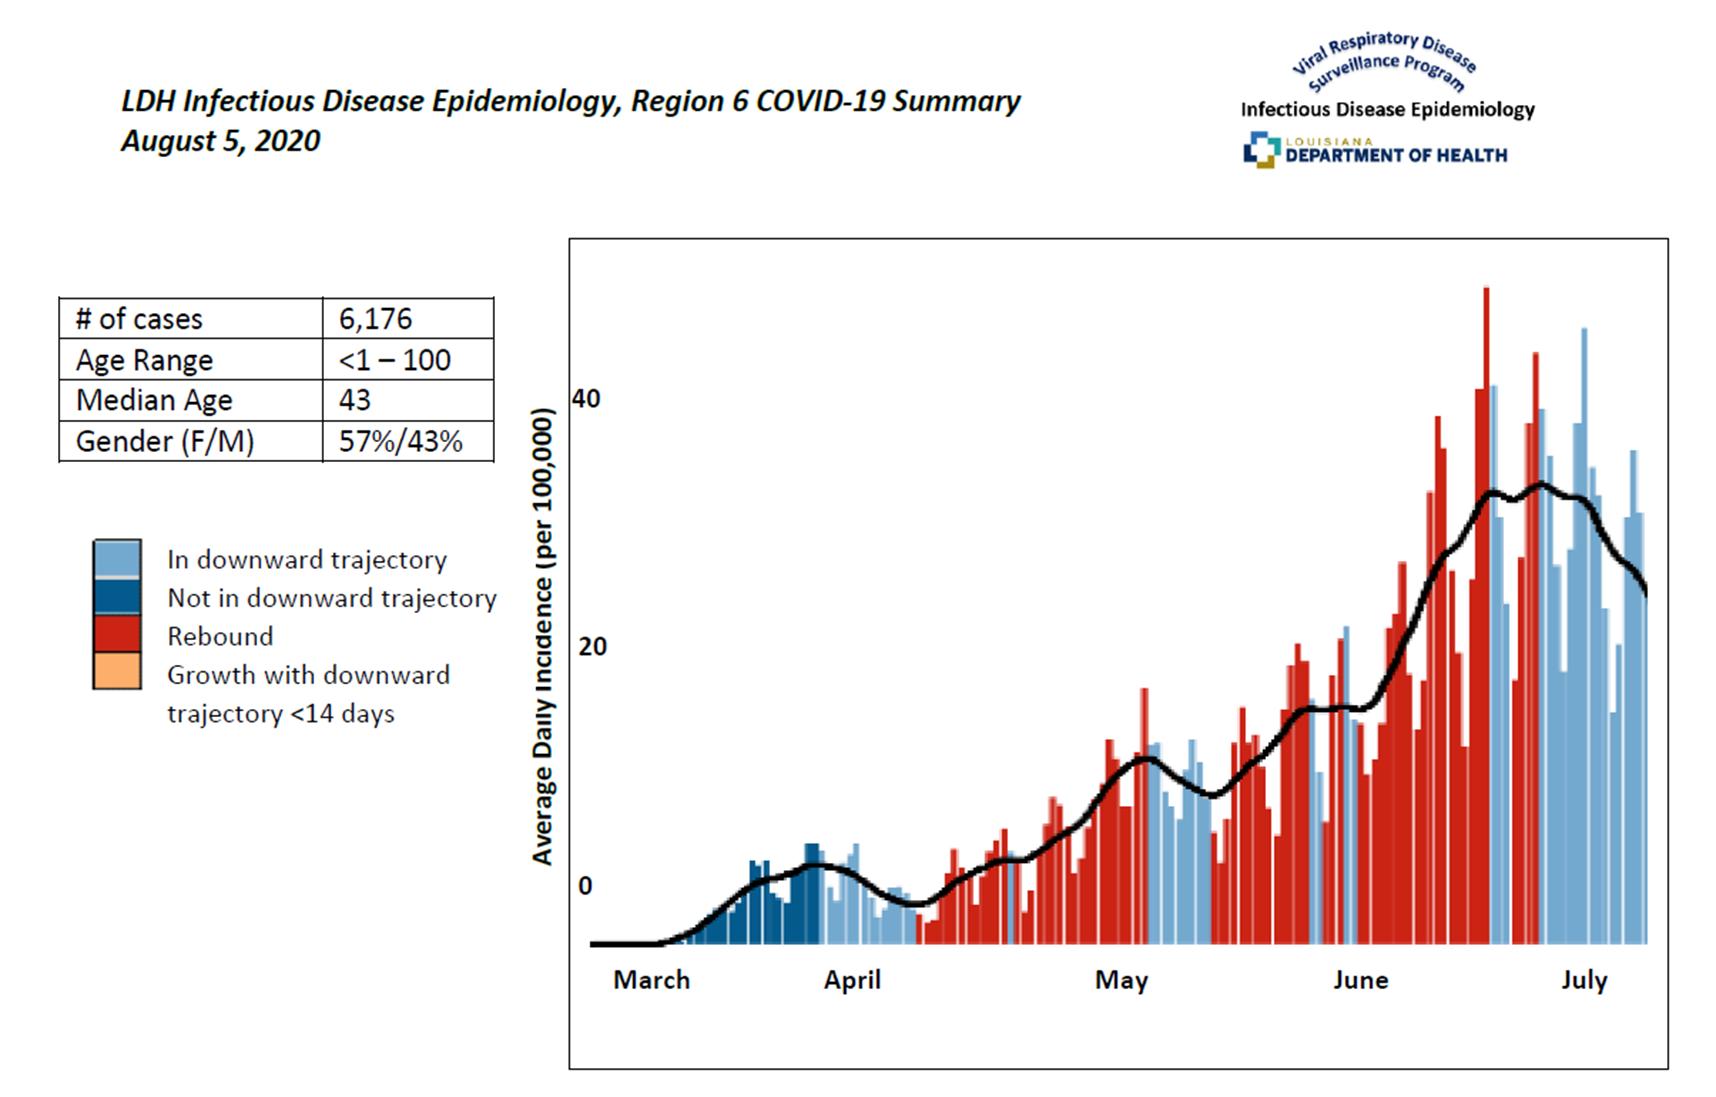
• COVID-19 cases in Region 6 have plateaued and may be declining, while hospitalizations continue to rise.
• Initial UI claims in the state fell to 13,430, the lowest level since the start of the pandemic, while continued unemployment claims reached near peak levels in July.
• Initial UI claims in Cenla fell to 892August 1st, the lowest level since March 14th, while continued UI claims reached a new high of 19,168.
• Alexandria’s unemployment rate of 7.6% in June was the lowest among the state’s major metro areas for the third straight month, and well below the state’s 10.5% rate.
• In June, parishes in central Louisiana had an average unemployment rate of 8.7% compared to 10.5% statewide.
• TheAlexandria MSA has the tightest labor market in the state with only 1.2 unemployed per job opening compared to 3.0 statewide and 4.5 nationally.
• Consumer spending continued to post strong gains in June with auto sales leading the way.
• The value of construction permits in Rapides Parish from March – July 2020 was $22.9 million compared to $15.9 million for the same period in 2019, representing a 44% increase.
• Permits for residential construction in Rapides increased 13% in July with Pineville recording a 62% increased over July 2019.
• Commercial and residential permits issued inAlexandria were up 271% and 522% respectively, although both categories year-to-date are below last year’s level.
• Hotel occupancy in June was up 41% in Rapides and 207% inAvoyelles over May, while still down for the year.
• Passenger traffic at AEX in July was 52% of last year’s level, compared to 26% nationally.
• 40% of Louisiana’s one million renters have little to no confidence in their ability to pay rent inAugust.
• 3,430 new businesses were form in Louisiana the week of July 18th setting a new record. 17,834 new businesses were formed in Q2 2020 compared to 13,321 during the same quarter in 2019. Thirty-four percent have a high-propensity for turning into a business with a payroll and another 13% are already planning to pay wages.

August 11, 2020
COVID-19
• Cases Per Capita
• Region 6 Summary
• Cases By Collection Date
• Percent Positive and Test Volume
• Drive-Thru Testing in Rapides
• Region 6 Cases byAge Group
• Cases By Parish
• Statewide Cases by Parish
• Patients Hospitalized
• Hospitalized & Ventilated in Region 6
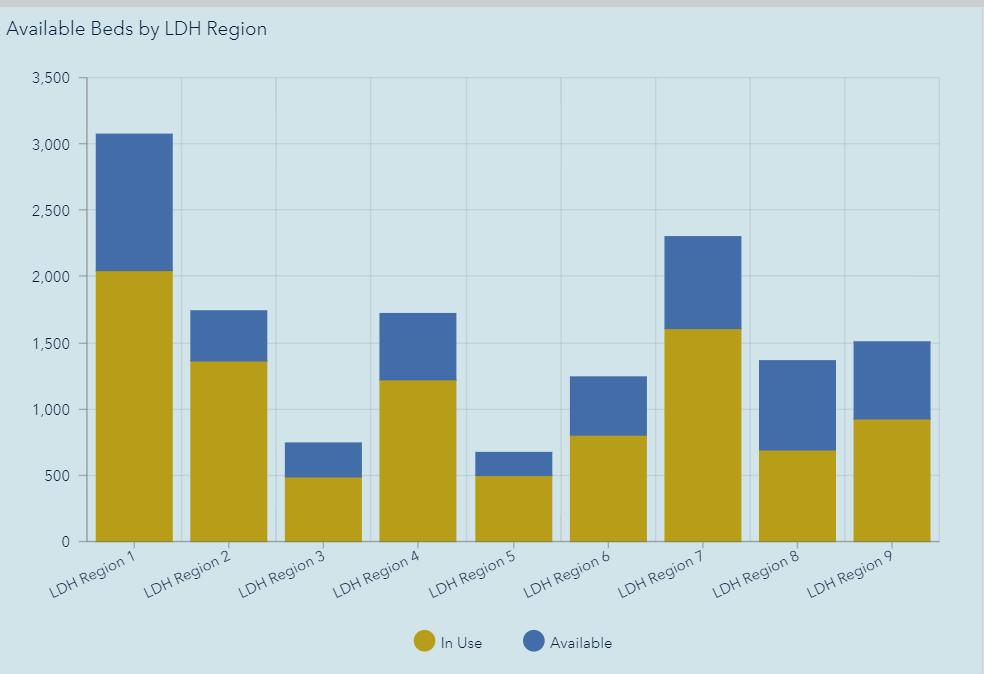
• Available Beds by LDH Region
• Parish Testing Statistics
EMPLOYMENT
• Unemployment Claims in Louisiana
• Unemployment Claims in Cenla
• Unemployment Rate Among LA MetroAreas
• Unemployment Rate by Cenla Parish
• Top Employers
• Unemployed Per Job Opening
TAX REVENUE
• Tax Revenue Overview
• Alexandria Sales Tax
• Avoyelles Sales Tax
• Avoyelles Vehicle Sales Tax
• Catahoula Sales Tax
• Concordia Sales Tax
• Evangeline Sales Tax
• Evangeline Vehicle Sales Tax
• La Salle Sales Tax
• Pineville Sales Tax
• Rapides Occupational Licenses
• Rapides Sales Tax
• Rapides Vehicle Sales Tax
• St. Landry Sales Tax
• St. Landry Vehicle Sales Tax
BUILDING PERMITS
• RapidesArea Permits Issued
• RapidesArea Permit Valuations
• Allen Parish Permit Valuations
• Avoyelles Parish Permit Valuations
• Evangeline Parish Permit Valuations
• Pineville Permit Valuations
• Rapides Parish Permit Valuations
• Residential Const. Permits byArea
• Alexandria Commercial Permits
• Alexandria Residential Permits
HOUSING
• AlexandriaActive Listings
• Alexandria Median Days on Market
• Alexandria Median Listing Price
TRAVEL
• Avoyelles Hotel Occupancy Tax
• Rapides Hotel Occupancy Tax
• Passenger TrafficAEX vs USA
• Air Traveler Stats
LOUISIANA
• Coincident EconomicActivity Index
• Eviction Crisis?
• Louisiana Business Formation
• Louisiana Gasoline Sales
• Baker Hughes Rig Count
• Louisiana Gaming Revenue
• Open Table Reservations in LA
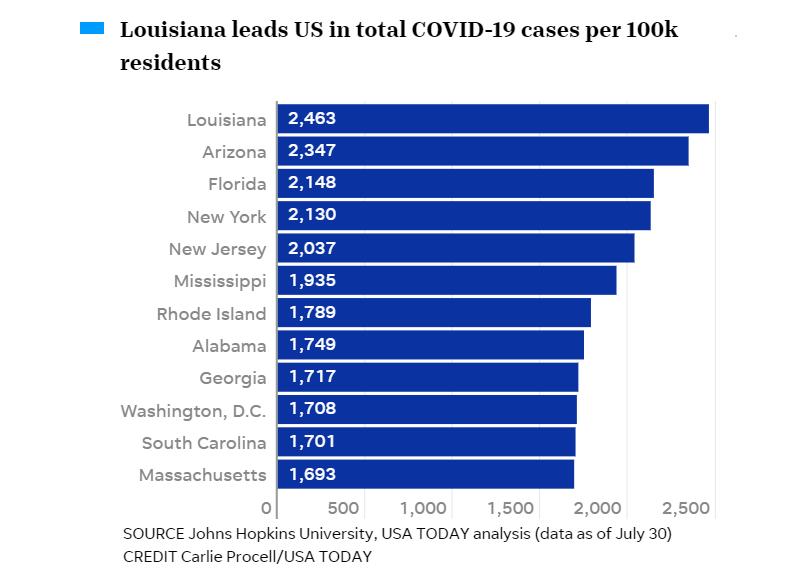
States with the most per capita cases as of July 30, 2020.
Louisiana leads the nation in per capita cases.
Source: Louisiana Office of Public Health, Region 6 (Central Louisiana), Regional Administrator/Medical Director, David J. Holcombe, MD, MSA,August 7, 2020.
States with the most per capita cases as of July 30, 2020.
Source: Louisiana Office of Public Health, Region 6 (Central Louisiana), Regional Administrator/Medical Director, David J. Holcombe, MD, MSA,August 7, 2020.
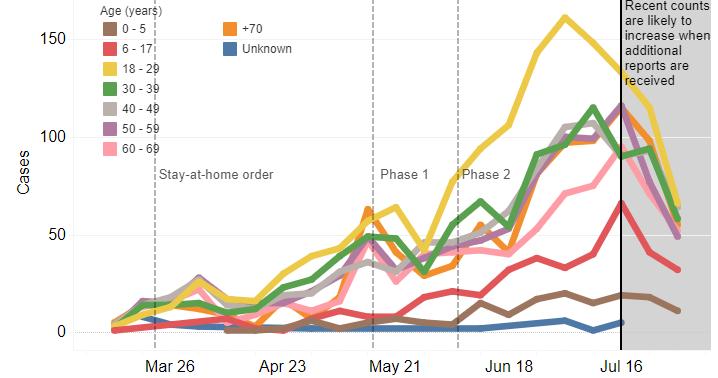
COVID-19 cases by collection date in Region 6 with a 7 day moving average.
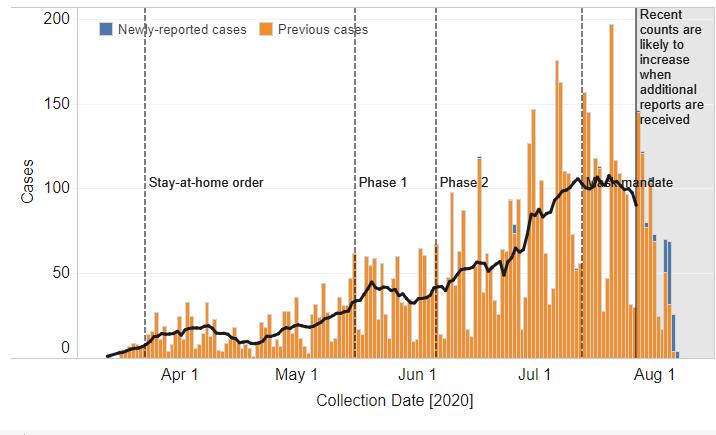
Source: Louisiana Office of Public Health, Region 6 (Central Louisiana), Regional Administrator/Medical Director, David J. Holcombe, MD, MSA,August 7, 2020.
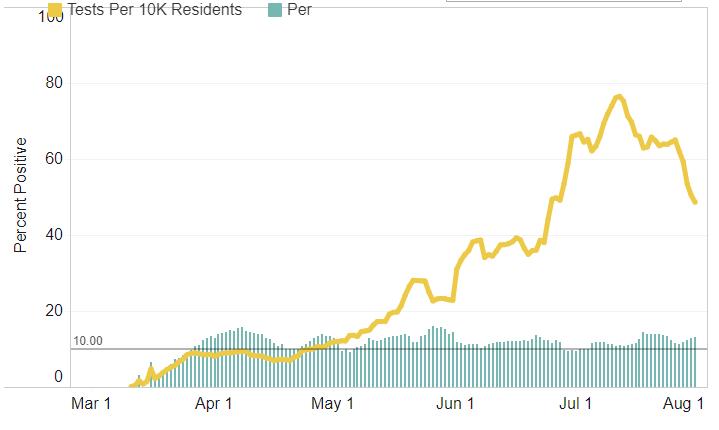
COVID-19 percent positive and test volume in Region 6 as of August 1, 2020. Source: Louisiana Office of Public Health, Region 6 (Central Louisiana), Regional Administrator/Medical Director, David J. Holcombe, MD, MSA,August 7, 2020.
Region 6 COVID-19 Cases by Parish
Cases over time by age group statewide.
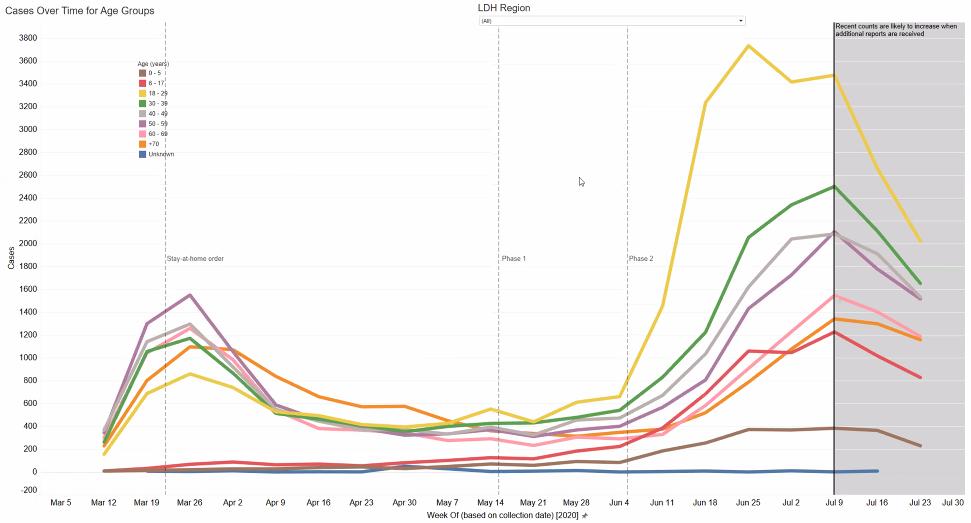
Source: Louisiana Office of Public Health, Region 6 (Central Louisiana), Regional Administrator/Medical Director, David J. Holcombe, MD, MSA,August 7, 2020.
Number of cases hospitalized statewide.
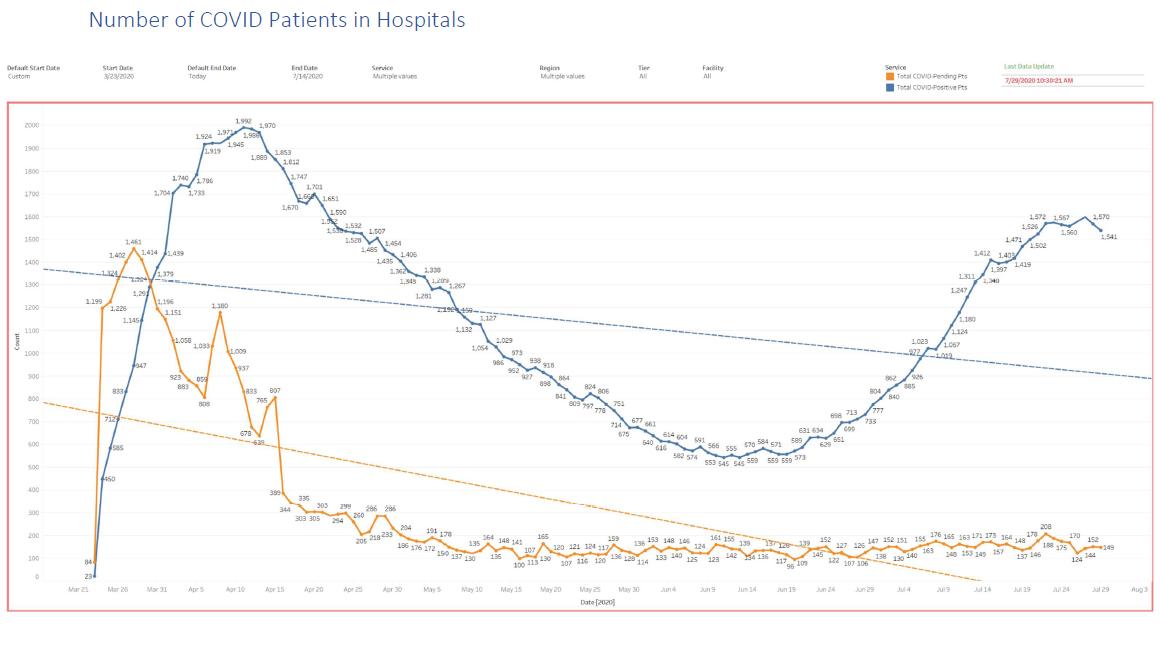
Source: Louisiana Office of Public Health, Region 6 (Central Louisiana), Regional Administrator/Medical Director, David J. Holcombe, MD, MSA,August 7, 2020.
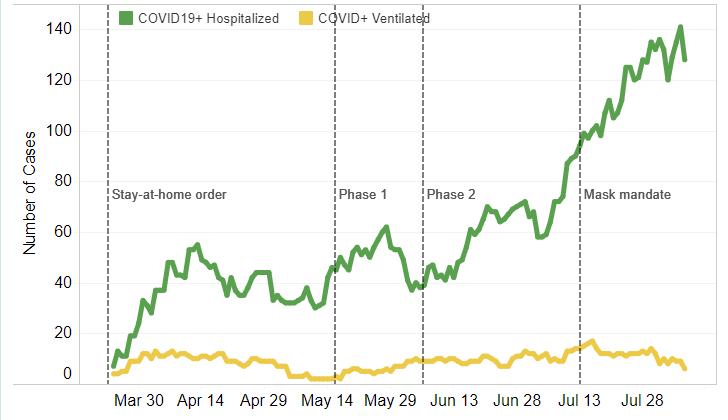
Number of cases hospitalized and ventilated in Region 6.
COVID-19 parish testing statistics as of August 5, 2020.
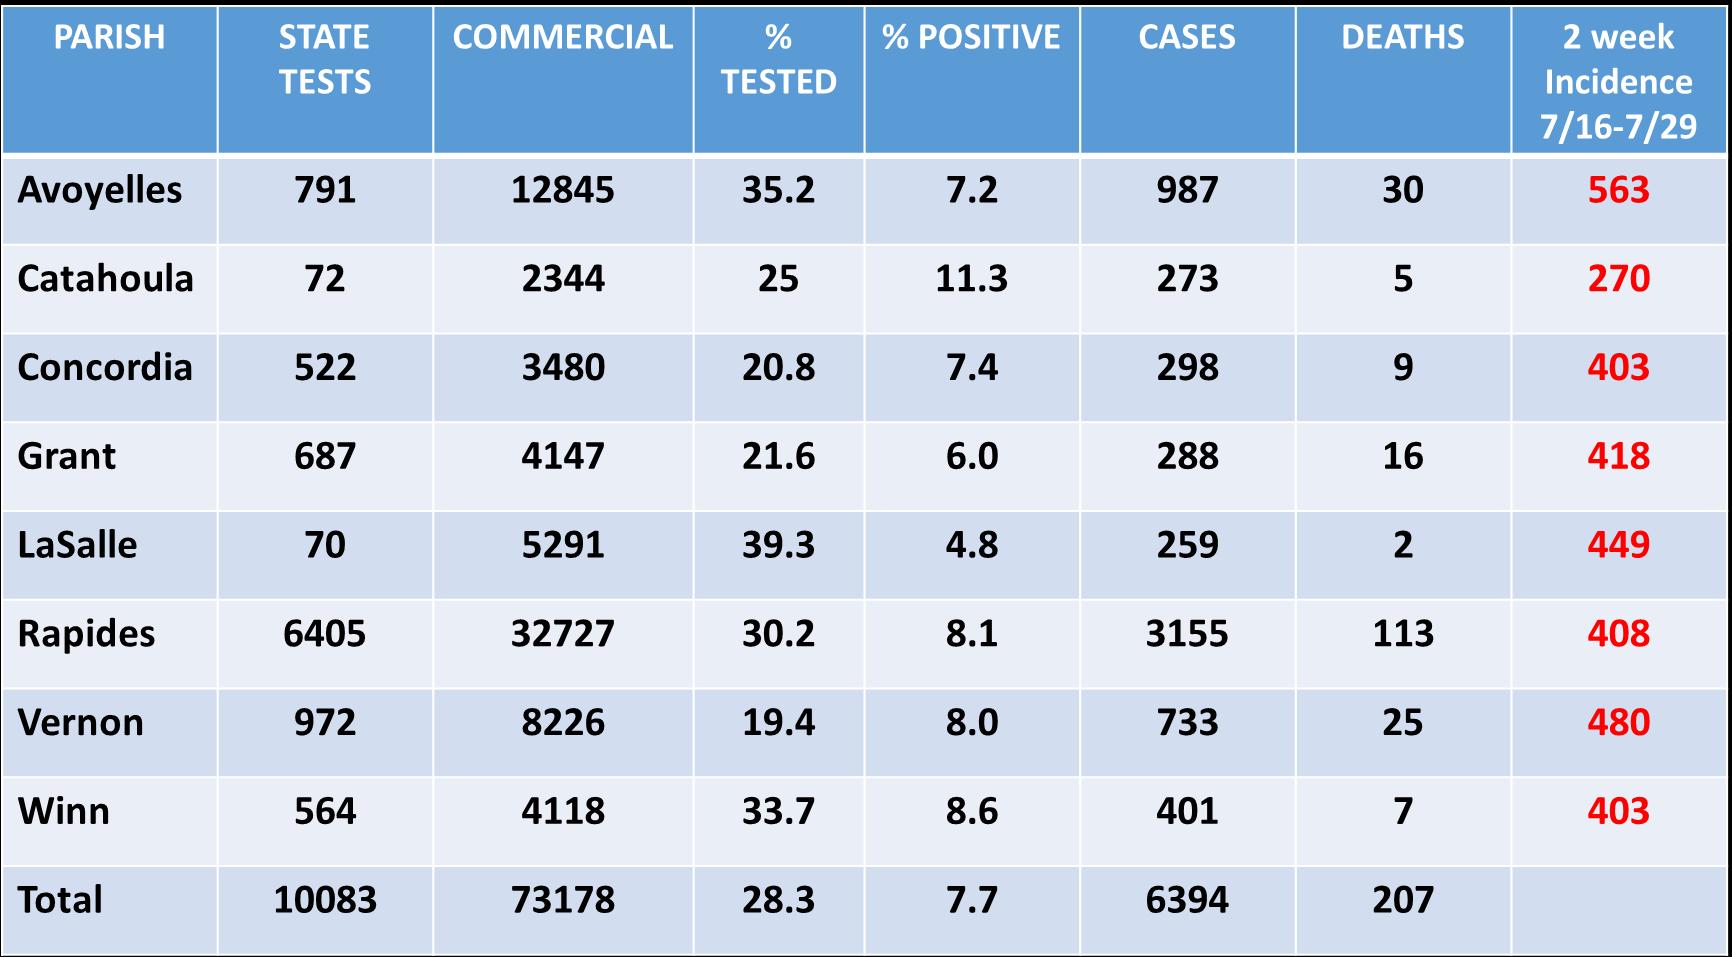
Source: Louisiana Office of Public Health, Region 6 (Central Louisiana), Regional Administrator/Medical Director, David J. Holcombe, MD, MSA,August 7, 2020.


Initial and continued unemployment claims in Louisiana since March 14, 2020.
Initial unemployment claims are at the lowest level since March 14th .
Continued unemployment claims nearly equal the May 23rd peak.
Source: Louisiana Workforce Commission,August 9, 2020
Initial and continued unemployment claims in Louisiana since March 14, 2020.
Initial unemployment claims in CENLAare at the lowest level since March 14th and have decreased 85% fromApril 18th high.
Continued unemployment claims have increased 7% in July over June.
Initial

Source: Louisiana Workforce Commission,August 9, 2020
The table below shows June 2020 preliminary unemployment rate, labor force, and employment data for Metropolitan Statistical Areas in Louisiana.
At 7.6%, the Alexandria MSA had the lowest unemployment rate among the state’s major metro areas for the third straight month, well below the state’s 10.5% rate.
Data Source: Louisiana Workforce Commission,August 8, 2020
The table below shows June 2020 preliminary unemployment rate, labor force, and employment data for central Louisiana parishes.
In June, parishes in central Louisiana had an average unemployment rate of 8.7% compared to 10.5% statewide.
Data Source: Louisiana Workforce Commission, August 9, 2020
The tables below shows employers with the highest number of job openings advertised online on August 8, 2020.
The table below shows the number of unemployed, number of advertised online, and the ratio of the number of unemployed to the number of advertised online in job openings in Alexandria MSA in June, 2020.
Alexandria metro area has the tightest labor market in the state with only 1.24 unemployed per job opening compared to 3.5 – 4.5 nationally.
An overview of sales, vehicle sales, and hotel occupancy taxes in the July 2020 CENLA Economic Dashboard.
Note: July sales tax revenue reflects sales activity in June.
Data Source noted detailed reports.
(TR) Alexandria sales tax revenue for July with previous month, year, and YTD comparisons.
(BR) Alexandria monthly sales tax revenue from 2017 to present.

Note: July sales tax revenue reflects sales activity in June.
Data Source: Rapides Parish Police Jury Treasurer’s Reports.
Avoyelles Parish total sales tax revenue for July with previous month, year, and year-to-date comparisons. Vehicle and hotel tax revenues are excluded.
Note: July sales tax revenue reflects sales activity in June.
Data Source: Avoyelles Parish School Board.
Avoyelles Parish vehicle sales tax revenue for July with previous month, year, and year-to-date comparisons.
Note: July sales tax revenue reflects sales activity in June.
Data Source: Avoyelles Parish School Board.
Catahoula Parish total sales tax revenue for July with previous month, year, and year-to-date comparisons.
Note: July sales tax revenue reflects sales activity in June.
Data Source: Catahoula Parish Tax Administrator
Concordia Parish total sales tax revenue for July with previous month, year, and year-to-date comparisons.
Note: July sales tax revenue reflects sales activity in June.
Data Source: Concordia Parish Tax Administrator
Evangeline Parish total sales tax revenue for July with previous month, year and YTD comparisons.
Note: July sales tax revenue reflects sales activity in June.
Data Source: Evangeline Parish Sales Tax Commissioner.
Evangeline Parish vehicle sales tax revenue for July with previous month, year and YTD comparisons.
Note: July sales tax revenue reflects sales activity in June.
Data Source: Evangeline Parish Sales Tax Commissioner.
La Salle Parish total sales tax revenue for July with previous month, year, and year-to-date comparisons.
Note: July sales tax revenue reflects sales activity in June.
Data Source: La Salle Parish Tax Administrator
(TR) Pineville sales tax revenue for July with previous month, year, and YTD comparisons.
(BR) Pineville monthly sales tax revenue from 2017 to present.

Note: July sales tax revenue reflects sales activity in June.
Data Source: Rapides Parish Police Jury Treasurer’s Reports.
Rapides Parish occupational license revenue for July YTD with previous YTD comparisons.
Note: July occupational license revenue reflects licenses issued in June.
Data Source: Rapides Parish Police Jury Treasurer’s Reports.
(TR) Rapides Parish total sales tax revenue for July with previous month, year, and YTD comparisons.
(BR) Rapides Parish total monthly sales tax revenue from 2017 to present.
Note: July sales tax revenue reflects sales activity in June.
Data Source: Rapides Parish Police Jury Treasurer’s Reports.
Rapides Parish vehicle sales tax revenue for July with previous month, year, and YTD comparisons.
Note: July tax revenue reflects sales activity in June.
Data Source: Tax revenue data from Rapides Parish Police Jury Treasurer’s Reports.
St. Landry Parish sales tax revenue for July with previous month, year, and YTD comparisons.
Note: July tax revenue reflects sales activity in June.
Data Source: Tax revenue data from St. Landry Parish School Board.
St. Landry Parish vehicle sales tax revenue for July with previous month, year, and YTD comparisons.
Note: July tax revenue reflects sales activity in June.
Data Source: Tax revenue data from St. Landry Parish School Board.
Number of permits issued by Rapides Area Planning Commission between 2017-2020 year-to-date for major jurisdictions.
Number of Permits Issued January - July 2017 - 2020
Total number of RPAC permits issued between January - July, 2020 compared to same period in 2019
-12.3%
Note: Avoyelles Parish data not included until 2019. City ofAlexandria permits are accounted for separately.
Data Source: RapidesArea Planning Commission, July 2020.
Valuation of permits issued by Rapides Area Planning Commission between 2017-2020 year-to-date for major jurisdictions.
Valuation of permits in Rapides from March – July, 2020 compared to same period in 2019, increased to $22.9 million from $15.9 million.
Note: Avoyelles Parish data not included until 2019. City ofAlexandria permits are accounted for separately. Three projects in Rapides in Feb. 2019 accounted for $29.8 million. Without these projects, which may be considered an anomaly, Rapides Parish YTD building valuations for July 2020 compared to YTD for July 2019 increased 31.9%.
Data Source: RapidesArea Planning Commission, July 2020.
Valuation of permits issued by Rapides Area Planning Commission in Allen Parish between 2017-2020 with month-to-month, year-to-year, and year-to-date comparisons.
Data Source: RapidesArea Planning Commission, July 2020.
Valuation of permits issued by Rapides Area Planning Commission in Avoyelles Parish between 2019-2020 with month-to-month, year-to-year, and year-to-date comparisons.
Data Source: RapidesArea Planning Commission, July 2020.
Valuation of permits issued by Rapides Area Planning Commission in Evangeline Parish between 2019-2020 with month-to-month, year-to-year, and year-to-date comparisons.
Data Source: RapidesArea Planning Commission, July 2020.
Valuation of permits issued by Rapides Area Planning Commission in the City of Pineville between 2017-2020 with month-to-month, year-to-year, and year-to-date comparisons.
Data Source: RapidesArea Planning Commission, July 2020.
Valuation of permits issued by Rapides Area Planning Commission in Rapides (excluding Alexandria) between 2017-2020 with month-to-month, year-to-year, and year-to-date comparisons.
Note: Three projects in Rapides in Feb. 2019 accounted for $29.8 million. Excluding these projects, YTD permit valuations are up 31.9%.
Data Source: RapidesArea Planning Commission, July 2020.
New residential construction permit valuation (estimated development cost) issued by Rapides Area Planning Commission by jurisdiction in July 2019 compared to July 2020.
Valuation of New Residential Construction July 2019 vs July 2020
Note: City ofAlexandria permits are accounted for separately.
Data Source: RapidesArea Planning Commission, July 2020.
The valuation (estimated development cost) of new commercial construction permits issued by the City of Alexandria in July 2020 with previous month, year, and YTD comparisons.
The valuation (estimated development cost) of new residential construction permits issued by the City of Alexandria in July 2020 with previous month, year, and YTD comparisons.

The count of active single-family and condo/townhome listings for Alexandria MSA (excludes pending listings) for 2017-2020 with month-to-month and year-over-year comparisons.

The median number of days property listings spend on the market in Alexandria MSA for 2017-2020 with month-to-month and year-over-year comparisons.

The median listing price of houses in Alexandria MSA for 2017-2020 with month-to-month and year-over-year comparisons.
Avoyelles Parish hotel occupancy tax revenue for July with previous month, year, and year-to-date comparisons.
Note: July sales tax revenue reflects sales activity in June.
Data Source: Avoyelles Parish School Board.
Rapides Parish hotel occupancy tax revenue for July 2020 with previous month, year, and YTD comparisons.
Note: July tax revenue reflects hotel occupancy activity in June.
Data Source: Rapides Parish Police Jury Treasurer’s Reports.
Shows total passenger throughput at Alexandria International and nationwide in July 2020 as a percent of traffic a year ago.
Average percent of travelers at AEX in July compared to a year ago.
52%
Passenger Throughput as a Percent a Year Ago
AEX vs Nationwide (July 1 - 31)
90%
80%
70%
60%

50%
40%
30%
20%
26% 10%
100% 7/1/2020 7/2/2020 7/3/2020 7/4/2020 7/5/2020 7/6/2020 7/7/2020 7/8/2020 7/9/2020 7/10/2020 7/11/2020 7/12/2020 7/13/2020 7/14/2020 7/15/2020 7/16/2020 7/17/2020 7/18/2020 7/19/2020 7/20/2020 7/21/2020 7/22/2020 7/23/2020 7/24/2020 7/25/2020 7/26/2020 7/27/2020 7/28/2020 7/29/2020 7/30/2020 7/31/2020
Data Source: Alexandria International Airport, August 9, 2020


AEX passenger throughput in July nearly equaled combined throughput forApril-June, 5,753 vs. 5988.
American now has three daily flights to AEX, Delta two daily, and United one flight six days a week.
Nationwide daily number of passengers passing through TSA checkpoints in 2020 vs 2019. Data Source: DHS, Transportation Security Administration, https://www.tsa.gov/coronavirus/passenger-throughput, August

The Household Pulse Survey is an online survey administered by the US Census Bureau to study how the COVID-19 pandemic is impacting households from a social and economic perspective. The survey ran from April 23 to July 21, 2020. The results of the last survey shed light on the looming eviction crisis in Louisiana.
1,056,256 Population Renting in Louisiana
40% Of Renters Have No Confidence or Slight Confidence in Paying August Rent
68% Of Renters Experienced a Loss of Employment Income
48% Of Renters Were Employed as of July 21,2020
Louisiana’s Emergency Rental Assistance Program was suspended on July 19 after receiving 40,000 applications in four days. The $24 million program can fund only 10,000 applications.
69% Of Renters Earn Less than $35,000 Annually
40% Of Renters Used Stimulus Funds or Federal Unemployment Insurance Benefits to Meet Weekly Expenses
Data Source: US Census Bureau, Household Pulse Survey, July 21, 2020. https://www.census.gov/programs-surveys/household-pulse-survey/data.html
(L) Weekly business applications in Louisiana in 2019 and 2020.


(R) Weekly business applications in Louisiana from 2015 - 2020. Data Source: Business Formation Statistics, U.S. Census Bureau, https://www.census.gov/econ/bfs/index.html, August 8, 2020
May 2015 - July 2020
For Q2 2020, business applications in Louisiana increased 34% over Q2 2019, 17,834 compared to 13,321.
34% have a high-propensity for turning into a business with a payroll and another 13% are already planning to pay wages.
Total gasoline sales in Louisiana since 1983.
• In May 2020, Louisiana gasoline sales were up 27.4% over April which had the lowest gasoline sales since 1983.
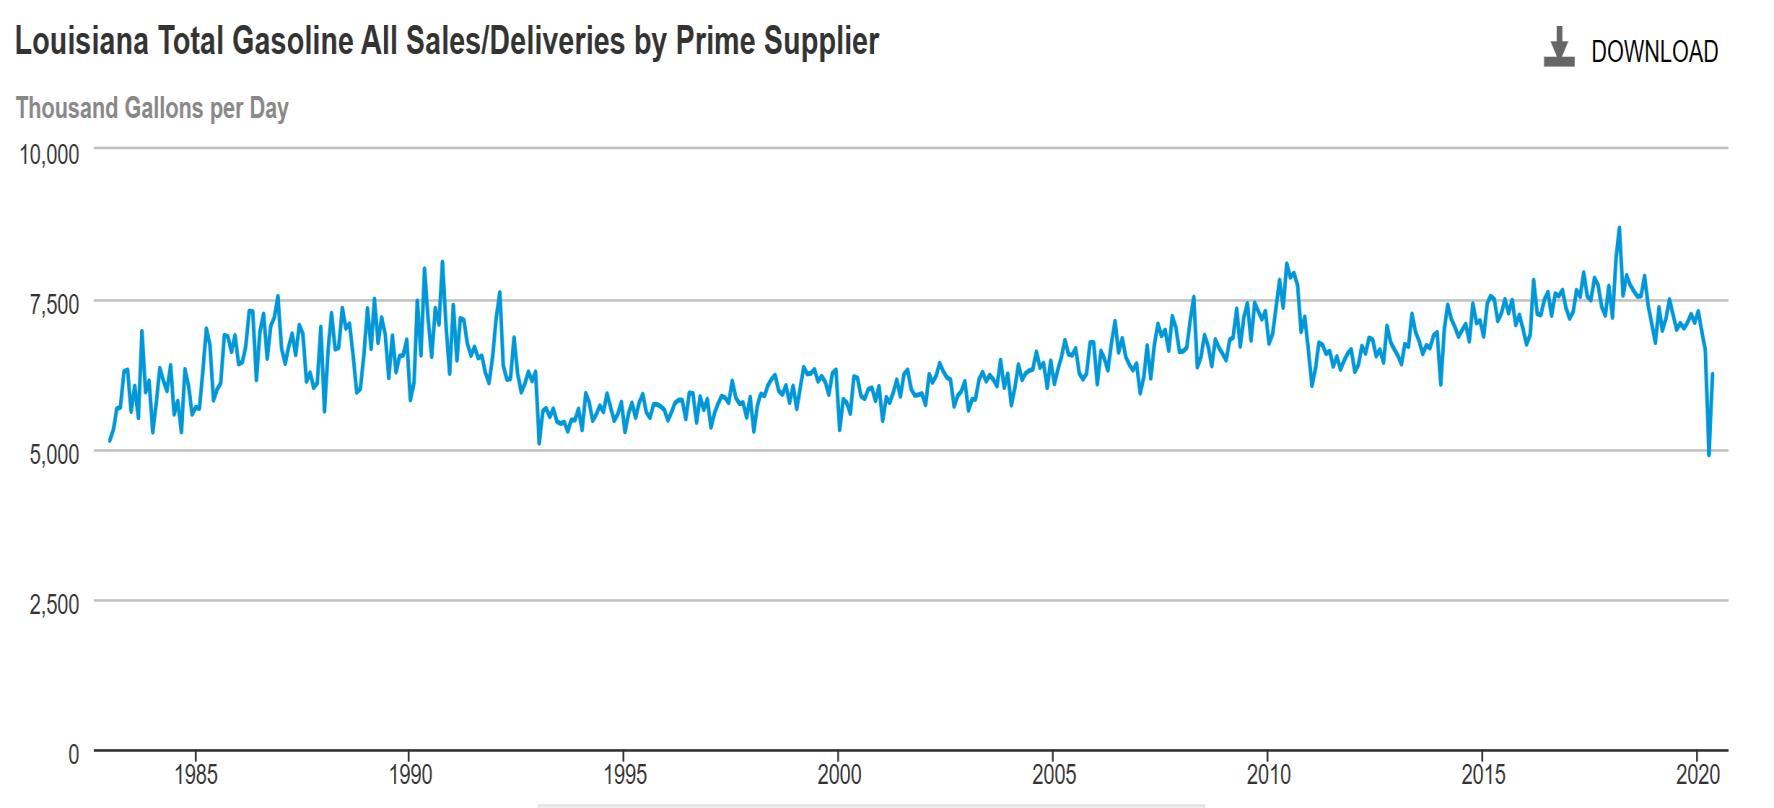
• May 2020 sales remain -16.6% from May 2019.
Data Source: U.S. Energy Information Administration, August 9, 2020
Represents the number of drilling rigs actively exploring for or developing oil or natural gas in Louisiana and the U.S.


Rig Count in Louisiana & US
January 2020 - Present
TOTAL LOUISIANA
US
Exploration rig count in the U.S. is down 73% since July 2019.
Source: Baker Hughes, https://rigcount.bakerhughes.com/na-rig-count, August 8, 2020
Gaming revenue in Louisiana for June 2020 with previous month and year comparisons. Louisiana casinos closed March 16th and reopened on May 18th . Data Source: Louisiana Gaming Control Board, June 2020.

This data shows year-overyear seated diners at restaurants on the OpenTable network in Louisiana and New Orleans. Year-over-year comparisons by day compare the same day of the week from the same week in the previous year.
OpenTable Reservations in Lousiana and New Orleans
Percent Change Over Year Ago
Feb. 18 - Present
• On July 11, New Orleans eliminated bar seating and limited restaurant seating to 25 indoors. Announcement on July 8 caused spike in reservations on July 9-11.
Source: OpenTable, https://www.opentable.com/state-of-industry, August 8, 2020
Monthly U.S. economic indicators for June 2020.
Data Source: U.S. Census, https://www.census.gov/economic-indicators/, August 9, 2020.
The data presented throughout the CENLA Economic Dashboard reflects contributions from the following local organizations.
• Rapides Parish Policy Jury Treasurer
• Avoyelles Parish School Board
• St. Landry Parish School Board
• Evangeline Parish Sales Tax Commissioner
• Concordia, Catahoula, & La Salle TaxAdministrator
• Alexandria InternationalAirport
• RapidesArea Planning Commission
• City ofAlexandria Planning Division
• St. Landry Parish Permit Office
• Louisiana Office of Public Health, Region 6
Also, special thanks to the following partners for distributing the dashboard.
Next Issue: Week of Sept. 7th
• LSUAFoundation
• Central Louisiana Regional Chamber of Commerce
• Marksville Chamber of Commerce
• Bunkie Chamber of Commerce
• Evangeline Chamber of Commerce
Current and past issues of the CENLAEconomic Dashboard can be found at http://www.lsua.edu/coronavirus/cenla-economic-dashboard/