CENLA ECONOMIC DASHBOARD
July 8, 2020.
Dr.RandallDupont Dean,CollegeofBusiness
LouisianaStateUniversityofAlexandria
rdupont@lsua.edu

KEYFINDINGS
July 8, 2020 CENLA Economic Dashboard
• Initial unemployment claims are down 68% in Rapides since itsApril 18th peak and 78% in central Louisiana. However, continued unemployment claims are down only 9% and 8%, respectively, since peaking on May 23rd .
• TheAlexandria MSAhad the lowest unemployment rate among the state’s metro areas again in May at 9.2%, while Rapides had a rate of 9.3%. The average for Cenla stood at 10.8% compared to 13.1% statewide.
• Job openings in theAlexandria MSAhave fallen 32% since January, from 4,553 openings to 3,086.
• Consumer spending in May, as measured by June sales tax revenue, was up in seven of the nine parishes and cities reporting over spending inApril, with Pineville having the largest percentage increase at 25%.Alexandria reported an increase of 11% and Rapides 14%. Vehicles sales were up 43% in Rapides andAvoyelles, and 26% in Evangeline.
• Overall building permit valuations increased 32% in Evangeline, 50% in Rapides, and 65% inAvoyelles in June over May, with new residential construction permits issued by the RAPC increasing 78% over last year.
• Passenger traffic atAEX continues to exceed the national average withAEX ranking second statewide, while area hotel occupancy continues to be weak, down 23% for the year in Rapides and 15% inAvoyelles.

• 22% of Louisiana small businesses said it would take three months or less for their business to return to normal compared to 14% nationally.
• For the week ending June 20, new business formations in Louisiana reached an all-time weekly high for the third straight week with 1,770 business applications filed. YTD 31,010 businesses were formed through June 20 compared to 29,360 in 2019.
CONTENTS
July 8, 2020
• COVID-19 Google Mobility Report
• COVID-19Apple Mobility Trends
• COVID-19 Cases in CENLA
• COVID-19 Cases in Louisiana
• COVID-19 Cases in Rapides Parish
• COVID-19 in Phase 1 & 2
• COVID-19 Stats in Cenla
• Initial Unemployment Claims in CENLA
• Continued Unemployment Claims in CENLA
• Unemployment Claims in CENLA
• Total Unemployment Claims in Louisiana
• Unemployment RateAmong LAMetros
• Unemployment Rate in CENLA
• Job Openings in CENLA
• Top Employers
• Advertised Job Certifications inAlexandria
• Alexandria Sales Tax
• Avoyelles Sales Tax
• Avoyelles Vehicle Sales Tax
• Catahoula Sales Tax
• Concordia Sales Tax
• Evangeline Sales Tax
• Evangeline Vehicle Sales Tax
• La Salle Sales Tax
• Pineville Sales Tax
• Rapides Sales Tax
• Rapides Vehicle Sales Tax
• St. Landry Sales Tax
• St. Landry Vehicle Sales Tax
• RapidesArea Permits Issued
• RapidesArea Permit Valuations
• Allen Parish Permit Valuations
• Avoyelles Parish Permit Valuations
• Pineville Permit Valuations
• Rapides Parish Permit Valuations
• Residential Const. Permits byArea
• Alexandria Commercial Permits
• Alexandria Residential Permits
• Alexandria Active Listings
• Alexandria Median Days on Market
• Alexandria Median Listing Price
• Avoyelles Hotel Occupancy Tax
• Rapides Hotel Occupancy Tax
• Alexandria Housing Market
• Air Traffic in Louisiana
• AEXAir Traffic va USA
• Air Traveler Stats
• Coincident Economic Activity Index
• Louisiana Small Business Pulse Survey
• Louisiana Household Pulse Survey
• Louisiana Business Formation
• Louisiana Gasoline Sales
• Baker Hughes Rig Count
• Louisiana Gaming Revenue
• Open Table Reservations in LA
• National Economic Indicators
COVID-19
COVID-19GOOGLEMOBILITYREPORT
Represents how visits and length of stay at different places changed on April 11, May 13, & June 23 relative to a February 16, 2020 baseline.
Note: * Not enough data for this date: Currently, there is not enough data to provide a complete analysis.
Source: Google Mobility Change Report as ofApril 11, May 13, and June 23, 2020
Retail Grocery & Pharmacies Workplaces 11-Apr 13-May 23-Jun 11-Apr 13-May 23-Jun 11-Apr 13-May 23-Jun Louisiana -45% -18% -11% -2% 2% 0% -36% -35% -30% Allen -35% -35% - -10% -10% - -38% -32% -27% Avoyelles -16% -16% -4% 5% 1% -3% -27% -23% -24% Catahoula -64% - - -24% -24% - -44% -23% -27% Concordia -24% -24% - -16% -16% - -30% -24% -23% Evangeline -36% -36% - 1% 1% - -28% -20% -23% Grant - - - 17% 17% - -20% -27% -24% LaSalle -36% -36% - 2% 2% - -41% -13% -14% Rapides -39% -9% -3% 0% 7% 8% -27% -31% -25% St. Landry -38% 2% -4% 20% 21% 10% -26% -25% -23%
COVID-19APPLEMOBILITYTRENDS
Apple’s Mobility Trends Report tracks aggregate changes in driving from the January 13 baseline to July 3, 2020.
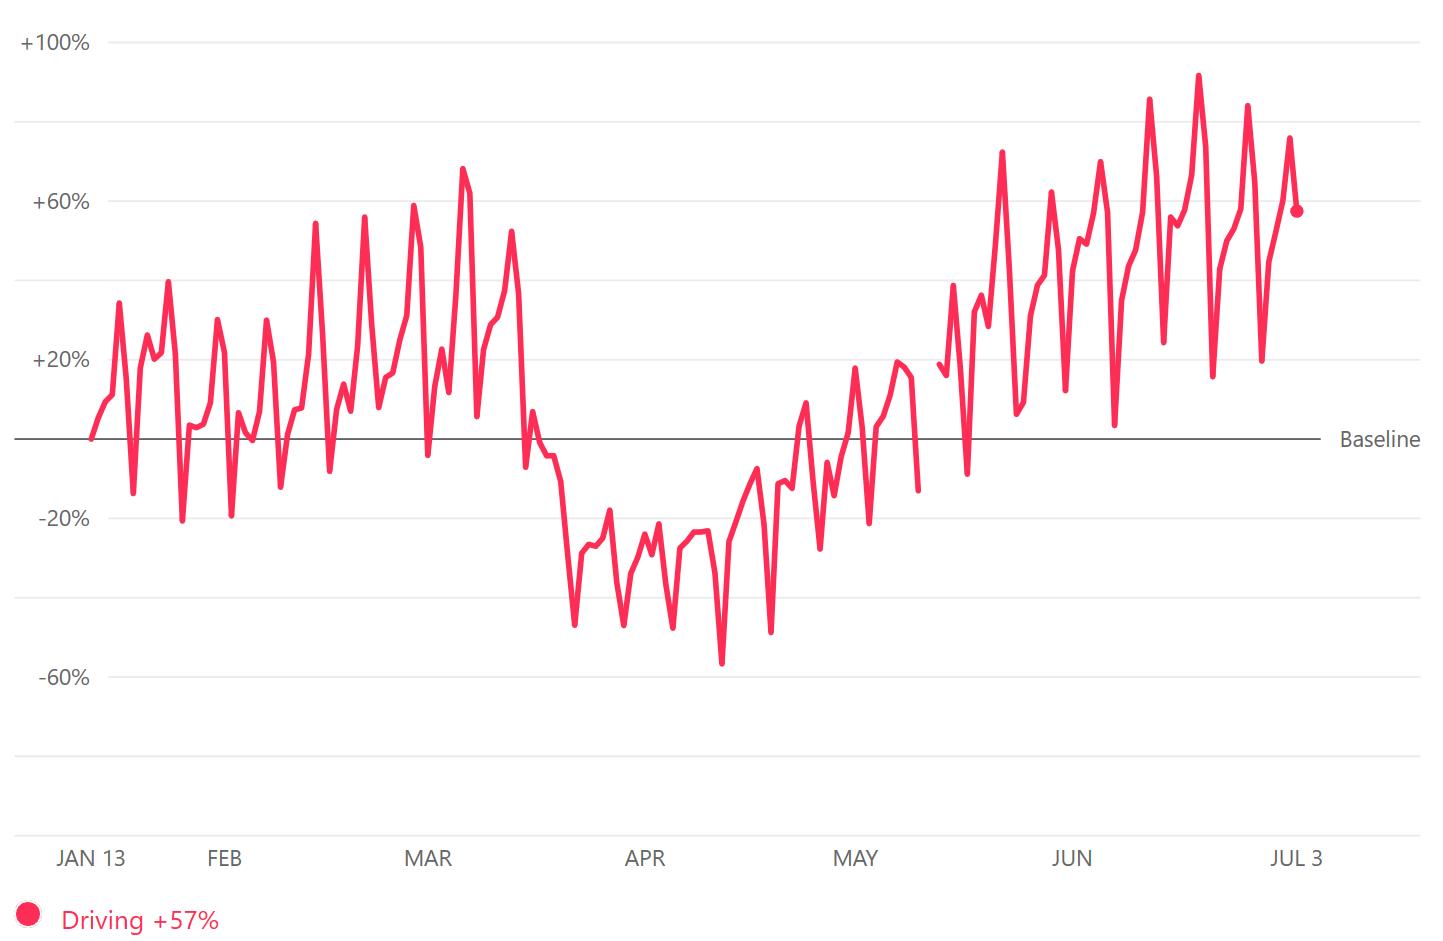
Rapides mobility up 57%
Avoyelles mobility up 71%
Evangeline mobility up 82%
Louisiana mobility up 24%
Source: Apple Mobility Trends Report, https://www.apple.com/covid19/mobility, July 5, 2020
Rapides Parish
COVID-19CASESINCENLA
(L) Cases per 1,000 population as of July 5, 2020
(R) Cumulative cases by parish
Source: Data from New York Times Github and US Census 2019 Population Estimate, July 7, 2020 Parish Cases / 1000 Allen 13.42 Avoyelles 9.62 Catahoula 20.54 Concordia 6.13 Evangeline 6.83 Grant 4.20 LaSalle 6.98 Rapides 12.94 St Landry 9.22 0 200 400 600 800 1000 1200 1400 1600 1800
Cases by Parish March 19 - July 5, 2020 Rapides Avoyelles Evangeline St Landry Allen Grant Catahoula Concordia LaSalle Avoyelles St Landry Rapides
COVID-19
COVID-19CASESINLOUISIANA
Daily new cases and deaths in Louisiana from March 9 – July 5, 2020.


Data from New York Times and US Census 2019 Population Estimate, July 5, 2020. 0 20 40 60 80 100 120 140 0 500 1,000 1,500 2,000 2,500 3,000 Daily New Deaths Daily New Cases
Daily New Cases & Deaths in Louisiana March 9 - July 5, 2020 New Cases New Deaths
Source:
COVID-19
COVID-19CASESINRAPIDESPARISH

(L) Daily new cases in Rapides Parish. (R) New cases per week in Rapides Parish. Source: Data from New York Times Github database, July 5, 2020 Mar 16 Mar 23 Mar 30 Apr 6 Apr 13 Apr 20 Apr 27 May 4 May 11 May 18 May 25 June 1 June 8 June 15 June 22 June 29 Cases 3 38 59 65 45 37 34 81 112 132 184 167 188 175 178 180 0 40 80 120 160 200 New Cases per Week in Rapides Week of March 16 - June 29, 2020 0 10 20 30 40 50 60 70 80 90 Daily New Cases in Rapides Parish March 20 - July 5, 2020
COVID-19CASESINPHASE1&2
Daily new cases in Rapides Parish. Red columns represent an increasing number of cases, green decreasing, and gray stable. Blue line is a 7 day moving average.
Daily New Cases in Rapides Parish
March 20 - July 5, 2020
In Phase 1, Rapides
Parish averaged 21 cases per day, while Phase 2 (June 5 –July 5) averaged 27 cases per day
Source: Data from New York Times Github database, July 5, 2020
Phase 1 Phase
0 10 20 30 40 50 60 70 80 90 100 3/20/2020 3/23/2020 3/26/2020 3/29/2020 4/1/2020 4/4/2020 4/7/2020 4/10/2020 4/13/2020 4/16/2020 4/19/2020 4/22/2020 4/25/2020 4/28/2020 5/1/2020 5/4/2020 5/7/2020 5/10/2020 5/13/2020 5/16/2020 5/19/2020 5/22/2020 5/25/2020 5/28/2020 5/31/2020 6/3/2020 6/6/2020 6/9/2020 6/12/2020 6/15/2020 6/18/2020 6/21/2020 6/24/2020 6/27/2020 6/30/2020 7/3/2020
2
EMPLOYMENT
INITIALUNEMPLOYMENT CLAIMSINCENLA
Initial unemployment claims by parish and week
Since theApril 18th peak, initial claims in Rapides are down 68% and down 78% among all Cenla parishes.
Source: Louisiana Workforce Commission, July 5, 2020
11-Apr 18-Apr 25-Apr 2-May 9-May 16-May 23-May 30-May 6-Jun 13-Jun 20-Jun 27-Jun Allen 431 683 233 181 119 113 88 98 90 96 73 83 Avoyelles 412 491 359 290 234 159 157 119 175 153 122 160 Catahoula 83 135 88 69 52 41 48 48 53 44 35 35 Concordia 133 190 177 125 127 92 99 80 48 122 93 97 Evangeline 298 386 268 288 178 140 110 113 149 147 121 105 Grant 172 177 141 115 98 78 73 67 77 60 55 56 La Salle 293 339 243 178 142 124 97 71 108 99 74 65 Rapides 1,371 1,541 1,125 955 841 617 525 489 518 509 410 495 St. Landry 1,071 1,437 1,093 845 702 511 397 329 393 438 283 387 Vernon 393 368 390 266 204 160 127 114 139 142 116 158 Total 4,657 5,747 4,117 3,312 2,697 2,035 1,721 1,528 1,750 1,810 1,382 1,641
CONTINUEDUNEMPLOYMENT CLAIMSINCENLA
Continued unemployment claims by parish and week
Continued claims peaked May 23. Those claims have fallen only 9.2% in Rapides and 7.8% among all Cenla parishes.
Source: Louisiana Workforce Commission, July 5, 2020
11-Apr 18-Apr 25-Apr 2-May 9-May 16-May 23-May 30-May 6-Jun 13-Jun 20-Jun 27-Jun Allen 521 809 1,410 1,398 1,402 1,407 1,402 1,226 1137 1,122 1,109 1,101 Avoyelles 1,512 1,657 1,988 2,006 2,072 2,084 2,054 1,686 1639 1,710 1,702 1,701 Catahoula 170 204 271 255 277 277 279 301 330 345 347 354 Concordia 310 345 453 508 505 533 568 550 575 582 631 628 Evangeline 634 756 1,049 1,077 1,199 1,227 1,265 1,154 1148 1,185 1,204 1,263 Grant 392 483 557 601 615 635 645 617 603 613 601 623 La Salle 694 784 996 1,061 1,067 1,068 1,071 1,039 1044 1,041 1,074 1,103 Rapides 3,596 3,977 4,839 5,054 5,236 5,409 5,495 5,009 4967 4,976 4,918 4,992 St. Landry 2,602 3,101 3,952 4,357 4,497 4,638 4,682 4,384 4350 4,313 4,398 4,392 Vernon 1,066 1,178 1,371 1,494 1,530 1,553 1,526 1,408 1396 1,325 1,325 1,354 Total 11,497 13,294 16,886 17,811 18,400 18,831 18,987 17,374 17,189 17,212 17,309 17,511
UNEMPLOYMENTCLAIMSINCENLA
(L) Initial unemployment claims in Cenla March 21 – June 27.
(R) Continued unemployment claims in Cenla March 21 –June 27.
• Continued unemployment claims in Cenla have plateaued at an average of 17,316 a week over the past five weeks.
Source: Louisiana Workforce Commission, July 4, 2020
3240 5571 5843 4657 5747 4117 3312 2697 2,035 1,721 1528 1750 1810 1382 1641 Cenla Initial Unemployment Claims Mar 21 - June 27 1030 2874 6435 11497 13294 16886 17811 18400 18831 18987 17374 17189 17212 17309 17511 Cenla Continued Unemployment Claims Mar 21 - June 27
TOTALUNEMPLOYMENTCLAIMSINLOUISIANA


Initial and continued unemployment claims in Louisiana since March 14, 2020.
Initial unemployment claims have fallen 78% since itsApril 4th peak.
Continued unemployment claims have fallen 7% since its May 23rd peak.
Source: Louisiana Workforce Commission, July 4, 2020
2,262 72,474 97,472 102,267 79,760 92,026 66,227 51,037 40,194 28,620 24,027 19,386 21,926 23,169 19,575 22,030 14,041 14,208 58,088 120,810 217,640 264,430 300,791 310,152 325,283 326,646 328,607 301,750 305,239 306,547 300,568306,280 3/14 3/21 3/28 4/4 4/11 4/18 4/25 5/2 5/9 5/16 5/23 5/30 6/6 6/13 6/20 6/27 Initial Continued
UNEMPLOYMENTRATEAMONGLAMETROAREAS
The table below shows May 2020 preliminary unemployment rate, labor force, and employment data for Metropolitan Statistical Areas in Louisiana.
At 9.2%, the Alexandria MSA had the lowest unemployment rate among the state’s major metro areas for the second straight month, well below the state’s 13.1% rate.
Data Source: Louisiana Workforce Commission, July 5, 2020
Area Unemployment Rate Labor Force Employed Unemployed Louisiana 13.1% 2,041,451 1,774,794 266,657 Alexandria 9.2% 61,505 55,824 5,681 Baton Rouge 11.8% 410,422 362,060 48,362 Hammond 16.1% 54,556 45,782 8,774 Houma-Thibodaux 10.9% 86,235 76,874 9,361 Lafayette 11.6% 209,129 184,824 24,305 Lake Charles 13.1% 107,113 93,129 13,984 Monroe 10.8% 77,683 69,281 8,402 New Orleans-Metairie 16.4% 578,274 483,658 94,616 Shreveport-Bossier City 12.5% 181,967 159,279 22,688
UNEMPLOYMENTRATEINCENLA
The table below shows May 2020 preliminary unemployment rate, labor force, and employment data for central Louisiana parishes.
In May, parishes in central Louisiana had an average unemployment rate of 10.8% compared to 13.1% statewide.
Data Source: Louisiana Workforce Commission, July 5, 2020
Area Labor Force Employed Unemployed Unemployment Rate May 2020 Unemployment Rate April 2020 Allen Parish 8,843 7,558 1,285 14.5% 15.6% Avoyelles Parish 14,903 13,011 1,892 12.7% 14.4% Catahoula Parish 3,245 2,950 295 9.1% 9.9% Concordia Parish 6,822 6,092 730 10.7% 11.2% Evangeline Parish 11,302 9,991 1,311 11.6% 11.5% Grant Parish 7,869 7,160 709 9.0% 9.7% La Salle Parish 6,341 5,925 416 6.6% 7.2% Rapides Parish 53,636 48,664 4,972 9.3% 9.9% St. Landry Parish 31,188 27,193 3,995 12.8% 13.2% Vernon Parish 14,974 13,425 1,549 10.3% 11.0%
JOBOPENINGSINCENLA

(L) The number of job openings advertised online in Cenla in May 2020 and (R) job openings in Alexandria MSA since May 2019.
Job Openings in Alexandria MSA
Job openings in theAlexandria MSAhave fallen 32.2% since January, from 4,553 openings to 3,086.
Data Source: Louisiana Workforce Commission, July 5, 2020 Job Openings Allen 127 Avoyelles 290 Catahoula 28 Concordia 128 Evangeline 240 Grant 73 La Salle 83 Rapides 3,013 St. Landry 618 4,944 5,334 5,022 4,877 4,552 4,515 4,298 3,714 4,553 4,649 4,275 3,438 3,0861,000 2,000 3,000 4,000 5,000 6,000
TOPEMPLOYERS
The tables below shows employers with the highest number of job openings advertised online on July 4, 2020.
AlexandriaMSA Louisiana Employer Name Job Openings Christus Health 963 Dart Transit Company 952 Pizza Hut, Inc. 935 Ochsner Clinic Foundation 925 Lowe's Companies, Inc 834 Dollar Tree, Inc. 774 SONIC Corp. 599 Carrols Corporation 572 Lafayette General Health 562 Burger King Corporation 441 Employer Job Openings CHRISTUS Health 306 Rapides Parish School Dist 115 Nomad Health 62 Dart Transit Company 40 Lowe's Companies, Inc 39 HCA Healthcare, Inc. 33 Encompass Health Corp 30 Hospital Corp of America 28 Dollar Tree, Inc. 24 Pizza Hut, Inc. 23 Source: Louisiana Workforce Commission, July 4, 2020
ADVERTISEDJOBCERTIFICATIONSINALEXANDRIA
The table below shows the top advertised certification groups found in job openings advertised online in Alexandria MSA in May, 2020.
Source: Louisiana Workforce Commission, July 4, 2020 Rank Advertised Certification Group Advertised Certification Sub-Category Job Opening Match Count 1 Nursing Credentials and Certifications Nursing 1,126 2 American Heart Association (AHA) CPR & First Aid Certifications Nursing 841 3 Commercial Drivers License (CDL) Ground Transportation 191 4 National Registry of Emergency Medical Technicians (NREMT) Fire Rescue 94 5 National Board for Respiratory Care (NBRC) Medical Treatment and Therapy 74 6 American Registry for Diagnostic Medical Sonography (ARDMS) Medical Testing 31 7 Social Worker Credentials & Certifications Social and Human Services 28 8 American Association of Nurse Anesthetists (AANA) Certifications Nursing 14 9 Association of Rehabilitation Nurses (ARN) Certifications Nursing 12 10 American Registry of Radiologic Technologists (ARRT) Certifications Medical Treatment and Therapy 10
TAXREVENUE
ALEXANDRIASALESTAX
(TR) Alexandria sales tax revenue for June with previous month, year, and YTD comparisons.
(BR) Alexandria monthly sales tax revenue from 2017 to present.

Note: June sales tax revenue reflects sales activity in May.
Data Source: Rapides Parish Police Jury Treasurer’s Reports.
June 11.4% June YoY -1.3% June YTD -4.0% 2017 2018 2019 2020 June $ 3,150,005 $ 3,147,898 $ 3,221,795 $ 3,179,215 May $ 3,009,347 $ 3,080,692 $ 3,160,255 $ 2,853,830 % Chg over Prev Month 4.7% 2.2% 1.9% 11.4% % Chg over Prev Year -0.1% 2.3% -1.3% YTD (Jan - Jun) $19,307,485 $19,901,875 $19,968,903 $19,173,568 % Chg over Prev YTD 3.1% 0.3% -4.0% June $2.0 $2.5 $3.0 $3.5 $4.0 $4.5 Millions Alexandria Sales Tax Revenue 2017 - 2020
AVOYELLESSALESTAX
Avoyelles Parish total sales tax revenue for June with previous month, year, and year-to-date comparisons. Vehicle and hotel tax revenues are excluded.
Note: June sales tax revenue reflects sales activity in May.
Data Source: Avoyelles Parish School Board.
June 3.51% June YoY -0.10% June YTD -3.05% June 2016 2017 2018 2019 2020 June 1,286,371 1,379,994 1,422,368 1,417,122 1,415,776 May 1,303,592 1,373,385 1,287,588 1,330,457 1,367,712 % Chg over Prev Month 0.48% 10.47% 6.51% 3.51% % Chg over Prev Year 7.28% 3.07% -0.37% -0.10% YTD (Jan - Jun) 6,603,531 7,140,792 6,974,991 7,393,763 7,126,095 % Chg over Prev YTD 8.00% -1.45% 4.92% -3.05%
AVOYELLESVEHICLESALESTAX
Avoyelles Parish vehicle sales tax revenue for June with previous month, year, and year-to-date comparisons.
Note: June sales tax revenue reflects sales activity in May.
Data Source: Avoyelles Parish School Board.
June 43.8% June YoY -13.8% June YTD -5.5% June 2016 2017 2018 2019 2020 June 250,784 299,970 308,781 337,189 290,412 May 303,170 293,337 299,070 305,928 201,863 % Chg over Prev Month 5.26% 12.75% 10.22% 43.87% % Chg over Prev Year 19.61% 2.94% 9.20% -13.87% YTD (Jan - Jun) 1,606,456 1,727,897 1,620,219 1,667,571 1,575,248 % Chg over Prev YTD 7.56% -6.23% 2.92% -5.54%
CATAHOULASALESTAX
Catahoula Parish total sales tax revenue for June with previous month, year, and year-to-date comparisons.
Note: June sales tax revenue reflects sales activity in May.
Data Source: Catahoula Parish Tax Administrator
June -6.7% June YoY -12.5% June YTD -2.2% June 2019 2020 June $ 497,454 $ 435,382 May $ 429,099 $ 466,424 % Chg over Prev Month 15.9% -6.7% % Chg over Prev Year -12.5% YTD (Jan - Jun) $ 2,858,165 $ 2,795,289 % Chg over Prev YTD -2.2%
CONCORDIASALESTAX
Concordia Parish total sales tax revenue for June with previous month, year, and year-to-date comparisons.
Note: June sales tax revenue reflects sales activity in May.
Data Source: Concordia Parish Tax Administrator
June 5.1% June YoY -4.7% June YTD -23.1% June 2019 2020 June $ 1,151,868 $ 1,098,299 May $ 1,013,315 $ 1,045,294 % Chg over Prev Month 13.7% 5.1% % Chg over Prev Year -4.7% YTD (Jan - Jun) $ 6,620,669 $ 5,090,083 % Chg over Prev YTD -23.1%
EVANGELINESALESTAX
Evangeline Parish total sales tax revenue for June with previous month, year and YTD comparisons.
Note: June sales tax revenue reflects sales activity in May.
Data Source: Evangeline Parish Sales Tax Commissioner.
2016 2017 2018 2019 2020 June $ 1,399,022 $ 1,628,382 $ 1,786,760 $ 1,552,490 $ 1,603,239 May $ 1,313,760 $ 1,464,100 $ 1,362,082 $ 1,595,997 $ 1,489,051 % Chg over Prev Month 11.2% 31.2% -2.7% 7.7% % Chg over Prev Year 16.4% 9.7% -13.1% 3.3% YTD (Jan - Jun) $ 7,587,861 $ 8,029,476 $ 7,837,666 $ 7,821,626 $ 7,820,272 % Chg over Prev YTD 5.8% -2.4% -0.2% 0.0% June 7.7% June YoY 3.3% June YTD 0.0% June
EVANGELINEVEHICLESALESTAX
Evangeline Parish vehicle sales tax revenue for June with previous month, year and YTD comparisons.
Note: June sales tax revenue reflects sales activity in May.
Data Source: Evangeline Parish Sales Tax Commissioner.
2016 2017 2018 2019 2020 June $ 266,901 $ 301,569 $ 286,111 $ 351,269 $ 247,941 May $ 318,894 $ 390,369 $ 303,078 $ 310,254 $ 303,815 % Chg over Prev Month 3.8% 28.8% -5.2% 26.1% % Chg over Prev Year 0.8% 17.7% -9.6% -6.1% YTD (Jan - Jun) $ 1,429,217 $ 1,541,756 $ 1,458,428 $ 1,542,982 $ 1,485,679 % Chg over Prev YTD 7.9% -5.4% 5.8% -3.7% June 26.1% June YoY -6.1% June YTD -3.7% June
LASALLESALESTAX
La Salle Parish total sales tax revenue for June with previous month, year, and year-to-date comparisons.
Note: June sales tax revenue reflects sales activity in May.
Data Source: La Salle Parish Tax Administrator
June -10.5% June YoY -25.1% June YTD -5.9% June 2019 2020 June $ 989,241 $ 741,245 May $ 708,650 $ 828,127 % Chg over Prev Month 39.6% -10.5% % Chg over Prev Year -25.1% YTD (Jan - Jun) $ 5,561,450 $ 5,234,520 % Chg over Prev YTD -5.9%
PINEVILLESALESTAX
(TR) Pineville sales tax revenue for June with previous month, year, and YTD comparisons.
(BR) Pineville monthly sales tax revenue from 2017 to present.

Note: June sales tax revenue reflects sales activity in May.
Data Source: Rapides Parish Police Jury Treasurer’s Reports.
June 24.8% June YoY 31.3% June YTD 14.3% 2017 2018 2019 2020 June $ 1,082,763 $ 834,135 $ 893,673 $ 1,173,245 May $ 827,267 $ 826,492 $ 808,227 $ 940,342 % Chg over Prev Month 30.9% 0.9% 10.6% 24.8% % Chg over Prev Year -23.0% 7.1% 31.3% YTD (Jan - Jun) $ 5,437,580 $ 5,447,805 $ 5,307,810 $ 6,066,399 % Chg over Prev YTD 0.2% -2.6% 14.3% June $0.6 $0.7 $0.8 $0.9 $1.0 $1.1 $1.2 $1.3 Millions Pineville Sales Tax
2017 - 2020
Revenue
RAPIDESSALESTAX
(TR) Rapides Parish total sales tax revenue for June with previous month, year, and YTD comparisons.
(BR) Rapides Parish total monthly sales tax revenue from 2017 to present.

Note: June sales tax revenue reflects sales activity in May.
Data Source: Rapides Parish Police Jury Treasurer’s Reports.
2016 2017 2018 2019 2020 June $ 9,606,949 $10,862,112 $10,938,143 $11,350,035 $11,881,114 May $ 9,367,359 $10,299,735 $10,692,749 $11,165,361 $10,398,820 % Chg over Prev Month 5.5% 2.3% 1.7% 14.3% % Chg over Prev Year 13.1% 0.7% 3.8% 4.7% YTD (Jan - May) $ 60,697,895 $65,886,213 $67,431,919 $68,674,378 $69,150,657 % Chg over Prev YTD 8.5% 2.3% 1.8% 0.7% June 14.3% June YoY 4.7% June YTD 0.7% June $9 $10 $11 $12 $13 $14 $15 Jan-17 Apr-17 Jul-17 Oct-17 Jan-18 Apr-18 Jul-18 Oct-18 Jan-19 Apr-19 Jul-19 Oct-19 Jan-20 Apr-20 Millions Rapides Parish Total Sales Tax Collections 2017 - 2020
RAPIDESVEHICLESALESTAX
Rapides Parish vehicle sales tax revenue for June with previous month, year, and YTD comparisons.
Note: June tax revenue reflects sales activity in May.
Data Source: Tax revenue data from Rapides Parish Police Jury Treasurer’s Reports.
2016 2017 2018 2019 2020 June $ 914,704 $1,214,438 $1,101,335 $1,290,475 $1,130,397 May $ 985,718 $1,062,090 $1,208,480 $1,181,110 $ 789,052 % Chg over Prev Month 14.3% -8.9% 9.3% 43.3% % Chg over Prev Year 32.8% -9.3% 17.2% -12.4% YTD (Jan - May) $ 5,525,458 $6,400,993 $6,382,990 $6,465,532 $6,692,167 % Chg over Prev YTD 15.8% -0.3% 1.3% 3.5%
June 43.3% June YoY -12.4% June YTD 3.5% June
ST.LANDRYSALESTAX
St. Landry Parish sales tax revenue for June with previous month, year, and YTD comparisons.
Note: June tax revenue reflects sales activity in May.
Data Source: Tax revenue data from St. Landry Parish School Board.
June 17.0% June YoY 7.5% June YTD 5.3% June 2016 2017 2018 2019 2020 June $ 5,388,929 $ 5,401,414 $ 6,251,498 $ 6,130,613 $ 6,588,567 May $ 4,917,288 $ 5,082,233 $ 5,340,944 $ 5,663,303 $ 5,630,178 % Chg over Prev Month 6.3% 17.0% 8.3% 17.0% % Chg over Prev Year 0.2% 15.7% -1.9% 7.5% YTD (Jan - Jun $ 32,582,369 $ 33,730,425 $ 34,557,939 $ 35,404,118 $ 37,292,729 % Chg over Prev YTD 3.5% 2.5% 2.4% 5.3%
ST.LANDRYVEHICLESALESTAX
St. Landry Parish vehicle sales tax revenue for June with previous month, year, and YTD comparisons.
Note: June tax revenue reflects sales activity in May.
Data Source: Tax revenue data from St. Landry Parish School Board.
June -22.8% June YoY -32.2% June YTD 1.5% June 2016 2017 2018 2019 2020 June $ 857,123 $ 922,529 $ 945,332 $ 943,728 $ 759,529 May $ 726,835 $ 780,893 $ 792,738 $ 965,721 $ 653,502 % Chg over Prev Month 18.1% 19.2% -2.3% 16.2% % Chg over Prev Year 7.6% 2.5% -0.2% -19.5% YTD (Jan - Jun) $ 4,540,793 $ 5,024,922 $ 4,743,588 $ 4,896,606 $ 4,771,157 % Chg over Prev YTD 10.7% -5.6% 3.2% -2.6%
BUILDINGPERMITS
RAPIDESAREAPERMITSISSUED
Number of permits issued by Rapides Area Planning Commission between 2017-2020 year-to-date for major jurisdictions.
Total number of RPAC permits issued between January - June, 2020 compared to same period in 2019
-13.4%
Note: Avoyelles Parish data not included until 2019. City ofAlexandria permits are accounted for separately.
Data Source: RapidesArea Planning Commission, June 2020.
Allen Avoyelles Catahoula Pineville Evangeline LaSalle Rapides (excl. Alexandria) 2017 93 4 110 677 140 1,256 2018 85 3 88 717 139 1,242 2019 69 1,174 - 182 684 132 1,181 2020 91 1,009 5 127 500 140 1,090200 400 600 800 1,000 1,200 1,400 Number of Permits Issued January - June 2017 - 2020 2017 2018 2019 2020
RAPIDESAREAPERMITVALUATIONS
Valuation of permits issued by Rapides Area Planning Commission between 2017-2020 year-to-date for major jurisdictions.
Valuation of RPAC permits issued between January - June, 2020 compared to same period in 2019. -31%
Note: Avoyelles Parish data not included until 2019. City ofAlexandria permits are accounted for separately. Three projects in Rapides in Feb. 2019 accounted for $29.8 million. Without these projects, which may be considered an anomaly, Rapides Parish YTD building valuations for June 2020 compared to YTD for June 2019 increased 29.9%.
Data Source: RapidesArea Planning Commission, June 2020.
2017 $1,537,164 $605,000 $5,109,797 $13,631,816 $4,942,000 $29,666,846 2018 $2,130,670 $551,400 $4,154,225 $5,987,634 $4,851,340 $20,135,629 2019 $2,268,145 $24,115,579 $- $10,747,232 $9,778,864 $1,816,000 $48,853,797 2020 $4,077,595 $20,776,289 $450,000 $8,040,795 $6,801,164 $2,086,000 $24,756,252 $$10 $20 $30 $40 $50 Millions Valuation of Permits Issued January - June 2017 - 2020 2017 2018 2019 2020
Allen Avoyelles Catahoula Pineville Evangeline LaSalle Rapides (excl. Alexandria)
ALLENPARISHPERMITVALUATIONS
Valuation of permits issued by Rapides Area Planning Commission in Allen Parish between 2017-2020 with month-to-month, year-to-year, and year-to-date comparisons.
Data Source: RapidesArea Planning Commission, June 2020.
2017 2018 2019 2020 June $ 192,650 $ 359,000 $ 691,000 $1,247,926 May $ 145,000 $ 526,000 $ 565,000 $ 547,750 % Chg Prev Month 32.9% -31.7% 22.3% 127.8% % Chg from Prev Year 86.3% 92.5% 80.6% YTD (Jan - Jun) $1,537,164 $2,130,670 $2,268,145 $4,077,595 % Chg over Prev YTD 38.6% 6.5% 79.8% June 127.8% June YoY 80.6% June YTD 79.8%
AVOYELLESPARISHPERMITVALUATIONS
Valuation of permits issued by Rapides Area Planning Commission in Avoyelles Parish between 2019-2020 with month-to-month, year-to-year, and year-to-date comparisons.
Data Source: RapidesArea Planning Commission, June 2020.
2019 2020 June $ 2,164,138 $ 5,985,111 May $ 4,345,283 $ 3,620,241 % Chg Prev Month -50.2% 65.3% % Chg from Prev Year 176.6% YTD (Jan - Jun) $ 24,115,579 $ 20,776,289 % Chg over Prev YTD -13.8% June 65.3% June YoY 176.6% June YTD -13.8%
EVANGELINEPARISHPERMITVALUATIONS
Valuation of permits issued by Rapides Area Planning Commission in Evangeline Parish between 2019-2020 with month-to-month, year-to-year, and year-to-date comparisons.
Data Source: RapidesArea Planning Commission, June 2020.
June 32.0% June YoY 1.3% June YTD -30.5% 2017 2018 2019 2020 June $ 2,264,443 $ 953,568 $ 1,476,999 $ 1,495,879 May $ 3,844,380 $ 1,520,385 $ 4,459,199 $ 1,133,211 % Chg Prev Month -41.1% -37.3% -66.9% 32.0% % Chg from Prev Year -57.9% 54.9% 1.3% YTD (Jan - Jun) $13,631,816 $ 5,987,634 $ 9,778,864 $ 6,801,164 % Chg over Prev YTD -56.1% 63.3% -30.5%
PINEVILLEPERMITVALUATIONS
Valuation of permits issued by Rapides Area Planning Commission in the City of Pineville between 2017-2020 with month-to-month, year-to-year, and year-to-date comparisons.
Data Source: RapidesArea Planning Commission, June 2020.
2017 2018 2019 2020 June $ 815,708 $ 849,900 $ 5,659,958 $ 2,780,490 May $ 201,196 $ 1,433,171 $ 1,313,700 $ 849,400 % Chg Prev Month 305.4% -40.7% 330.8% 227.3% % Chg from Prev Year 4.2% 566.0% -50.9% YTD (Jan - Jun) $ 5,109,797 $ 4,154,225 $ 10,747,232 $ 8,040,795 % Chg over Prev YTD -18.7% 158.7% -25.2% June 227.3% June YoY -50.9% June YTD -25.2%
RAPIDESPARISHPERMITVALUATIONS
Valuation of permits issued by Rapides Area Planning Commission in Rapides (excluding Alexandria) between 2017-2020 with month-to-month, year-to-year, and year-to-date comparisons.
Note: Three projects in Rapides in Feb. 2019 accounted for $29.8 million. Excluding these projects, YTD permit valuations are up 29.9%.
Data Source: RapidesArea Planning Commission, June 2020.
2017 2018 2019 2020 June $ 6,182,315 $ 5,176,834 $ 3,573,679 $ 5,326,122 May $ 2,719,160 $ 3,492,153 $ 3,509,213 $ 3,551,529 % Chg Prev Month 127.4% 48.2% 1.8% 50.0% % Chg from Prev Year -16.3% -31.0% 49.0% YTD (Jan - Jun) $29,666,846 $20,135,629 $48,853,797 $24,756,252 % Chg over Prev YTD -32.1% 142.6% -49.3%
June 50.0% June YoY 49.9% June YTD -49.3%
RESIDENTIALCONSTRUCTIONPERMITSBYAREA
New residential construction permit valuation (estimated development cost) issued by Rapides Area Planning Commission by jurisdiction in June 2019 compared to June 2020.
Valuation of New Residential Construction
June 2019 vs June 2020
Note: City ofAlexandria permits are accounted for separately.
Data Source: RapidesArea Planning Commission, June 2020.
Jun-19 Jun-20 Change % Change Allen $ 470,000 $ 1,130,000 $ 660,000 140% Avoyelles $ 714,792 $ 905,567 $ 190,775 27% Pineville $ 1,225,384 $ 390,340 $ (835,044) -68% Evangeline $ 1,391,499 $ 1,265,879 $ (125,620) -9% LaSalle $ - $ 300,000 $ 300,000 Rapides $ 2,353,001 $ 4,177,800 $ 1,824,799 78% Value of residential construction in Rapides 78%
ALEXANDRIACOMMERCIALPERMITS
The valuation (estimated development cost) of new commercial construction permits issued by the City of Alexandria in June 2020 with previous month, year, and YTD comparisons.
Data Source: City ofAlexandria Planning Division. July 6, 2020 June -86.3% June YoY -77.6% June YTD 20.0% 2019 2020 June $ 1,689,399 $ 378,120 May $ 2,659,816 $ 2,769,813 % Chg over Prev Month -36.5% -86.3% % Chg over Prev Year -77.6% YTD (Jan - Jun) $ 13,304,860 $ 15,962,809 % Chg over Prev YTD 20.0%
ALEXANDRIARESIDENTIALPERMITS
The valuation (estimated development cost) of new residential construction permits issued by the City of Alexandria in June 2020 with previous month, year, and YTD comparisons.
Data Source: City ofAlexandria Planning Division. July 6, 2020 June -56.6% June YoY -62.9% June YTD -11.8% 2019 2020 June $ 1,206,299 $ 447,985 May $ 718,439 $ 1,031,200 % Chg over Prev Month 67.9% -56.6% % Chg over Prev Year -62.9% YTD (Jan - Jun) $ 8,254,195 $ 7,282,364 % Chg over Prev YTD -11.8%
HOUSING
ALEXANDRIAACTIVELISTINGS

The count of active single-family and condo/townhome listings for Alexandria MSA (excludes pending listings) for 2017-2020 with month-to-month and year-over-year comparisons.
Data Source: Realtor.com. Retrieved from FRED, Federal Reserve Bank of St. Louis. July 4, 2020 200 300 400 500 600 2016-07-01 2017-07-01 2018-07-01 2019-07-01 2020-07-01 Active Listings Count in Alexandria July 2016 - June 2020 2017 2018 2019 2020 June 443 529 531 289 May 452 498 490 317 % Chg Prev Month -2.0% 6.2% 8.4% -8.8% % Chg from Prev Year 19.4% 0.4% -45.6% June -8.8% June YoY -45.6%
ALEXANDRIAMEDIANDAYSONMARKET

The median number of days property listings spend on the market in Alexandria MSA for 2017-2020 with month-to-month and year-over-year comparisons.
Data Source: Realtor.com. Retrieved from FRED, Federal Reserve Bank of St. Louis. July 4, 2020 60 70 80 90 100 110 2016-07-01 2017-07-01 2018-07-01 2019-07-01 2020-07-01 Median Days on Market in Alexandria July 2016 - June 2020 2017 2018 2019 2020 June 84 74 70 97 May 73 73 73 95 % Chg Prev Month 14.4% 2.1% -3.4% 1.6% % Chg from Prev Year -11.4% -5.4% 37.9% June 1.6% June YoY 37.9%
ALEXANDRIAMEDIANLISTINGPRICE

The median listing price of houses in Alexandria MSA for 2017-2020 with month-to-month and year-over-year comparisons.
Data Source: Realtor.com. Retrieved from FRED, Federal Reserve Bank of St. Louis. July 4, 2020 June 7.1% June YoY 5.7% 2017 2018 2019 2020 June $ 179,950 $ 183,550 $ 200,050 $ 211,500 May $ 177,550 $ 180,050 $ 193,550 $ 197,550 % Chg Prev Month 1.4% 1.9% 3.4% 7.1% % Chg from Prev Year 2.0% 9.0% 5.7% $170,000 $180,000 $190,000 $200,000 $210,000 $220,000 2016-07-01 2017-07-01 2018-07-01 2019-07-01 2020-07-01 Median Listing Price in Alexandria July 2016 - June 2020
TRAVEL
AVOYELLESHOTELOCCUPANCYTAX
Avoyelles Parish hotel occupancy tax revenue for June with previous month, year, and year-to-date comparisons.
Note: June sales tax revenue reflects sales activity in May.
Data Source: Avoyelles Parish School Board.
June -50.8% June YoY -9.6% June YTD -15.6% June 2016 2017 2018 2019 2020 June 10,274 11,574 4,783 4,306 3,891 May 10,121 13,161 11,041 13,544 7,901 % Chg over Prev Month -12.1% -56.7% -68.2% -50.8% % Chg over Prev Year 12.7% -58.7% -10.0% -9.6% YTD (Jan - Jun) 66,918 51,416 53,221 44,934 66,918 % Chg over Prev YTD 18.7% -23.2% 3.5% -15.6%
RAPIDESHOTELOCCUPANCYTAX
Rapides Parish hotel occupancy tax revenue for June 2020 with previous month, year, and YTD comparisons.
Note: June tax revenue reflects hotel occupancy activity in May.
Data Source: Rapides Parish Police Jury Treasurer’s Reports.
June -37.0% June YoY -45.1% June YTD -23.6% 2017 2018 2019 2020 June $ 223,414 $ 163,255 $ 161,834 $ 88,906 May $ 146,292 $ 162,166 $ 159,950 $ 141,188 % Chg over Prev Month 52.7% 0.7% 1.2% -37.0% % Chg over Prev Year -26.9% -0.9% -45.1% YTD (Jan - Jun) $ 918,206 $ 905,019 $ 960,757 $ 734,197 % Chg over Prev YTD -1.4% 6.2% -23.6% June
AIRPASSENGERTRAFFICINLOUISIANA
Shows total passenger throughput at Alexandria International and other major Louisiana airports from June 1 - 20, 2020 as a percent of traffic a year ago.
As a percent of year over year passenger traffic,AEX ranked 2nd in the state from June 1-20 compared to the same period last year.
AEX passenger traffic from June 1-20 was 25.3% of same period 2019 traffic, which compared favorably to only 17.2% nationwide.
Data Source: Alexandria International Airport, June 24, 2020
Percent of Passenger Traffic At Louisiana Airports Compared to Same Period Last Year
June 1 - 20, 2020
17.2% 25.3% 20.3% 45.6% 21.3% 20.6% 14.8% 28.0% 0% 10% 20% 30% 40% 50% National Alexandria Baton Rouge Lake Charles Lafayette Monroe New Orleans Shreveport
PASSENGERTRAFFICAEXVSUSA
Shows total passenger throughput at Alexandria International and nationwide in June 2020 as a percent of traffic a year ago.
Passenger Throughput as a Percent a Year Ago
AEX vs Nationwide (June 1 - 30)
45.00%
40.00%
35.00%
30.00%
Average percent of travelers at AEX in June compared to a year ago. 5.00%
25.00%
20.00%
18.9% 15.00%
24.0% Average percent of travelers nationwide in June compared to a year ago. 10.00%
50.00% 6/1/2020 6/2/2020 6/3/2020 6/4/2020 6/5/2020 6/6/2020 6/7/2020 6/8/2020 6/9/2020 6/10/2020 6/11/2020 6/12/2020 6/13/2020 6/14/2020 6/15/2020 6/16/2020 6/17/2020 6/18/2020 6/19/2020 6/20/2020 6/21/2020 6/22/2020 6/23/2020 6/24/2020 6/25/2020 6/26/2020 6/27/2020 6/28/2020 6/29/2020 6/30/2020

AEX Nat.

Data Source: Alexandria International Airport, June 7, 2020 0.00%
AIRTRAVELERSTATS


Nationwide daily number of passengers passing through TSA checkpoints in 2020 vs 2019.
TSA Airport Total Traveler Throughput
2020 vs 2019
American and Delta will increase daily flights toAEX the week of July 6th .
United is expected to expand their schedule toAEX startingAugust 3.
Data Source: DHS, Transportation Security Administration, https://www.tsa.gov/coronavirus/passenger-throughput, June 24, 2020
0 500,000 1,000,000 1,500,000 2,000,000 2,500,000 3,000,000 Passengers
2020 2019
LOUISIANA
COINCIDENTECONOMICACTIVITYINDEX

Coincident Economic Activity Index
Louisiana
nonfarm payroll employment, the unemployment rate, average hours worked in manufacturing and wages and salaries. The index is set to match the trend for gross state product. Data Source: FRED Economic Data, Federal Reserve Bank of St. Louis, July 6, 2020. https://fred.stlouisfed.org/series/LAPHCI • The chart shows the impact of COVID-19 on the Louisiana economy relative to Hurricane Katrina in 2005 and the Great Recession of 2008-09. 85 90 95 100 105 110 115 Index Coincident Economic Activity Index for Louisiana 2000 - May 2020 Katrina Great Recession COVID-19
The
for
includes four indicators:
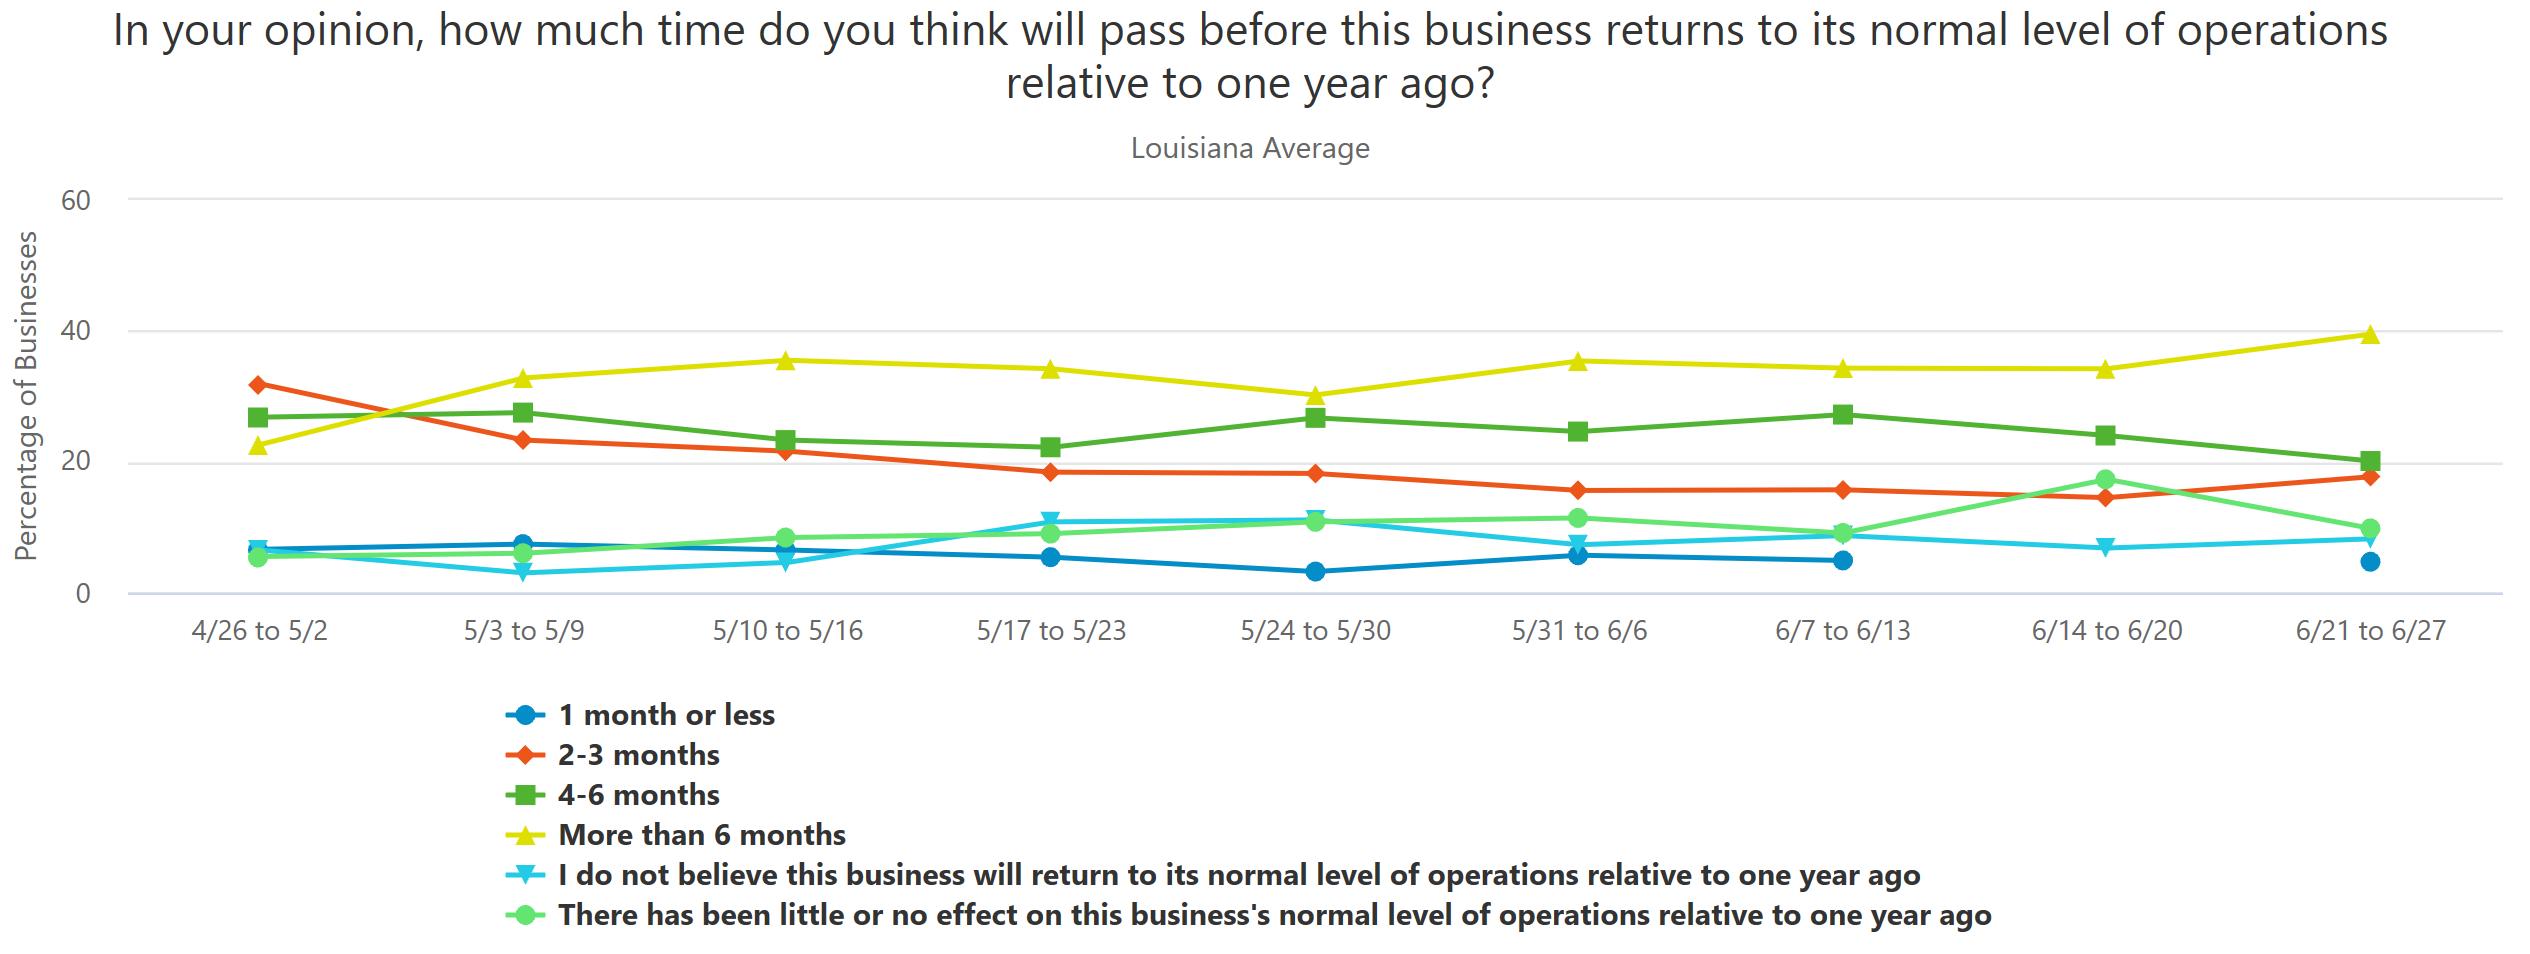
LOUISIANASMALLBUSINESSPULSESURVEY
In April, the US Census initiated a survey to track the pulse of small businesses during the COVID-19 pandemic. Results for the June 21 to June 27 period in Louisiana are shown.
22.4% of Louisiana small businesses said it would take less than three months for their business to return to normal compared to 14.4% nationally.
Source: U.S. Census Bureau, https://www.census.gov/data/experimental-data-products/small-business-pulse-survey.html, July 4,, 2020
LOUISIANAHOUSEHOLDPULSESURVEY


The Household Pulse Survey is an online survey studying how the COVID-19 pandemic is impacting households across the country from a social and economic perspective.
Reasons for Louisianians Are Not Working During Pandemic (Week
Other reason Did not report reason
My employer closed temporarily due My employer went out of business due
In order to support the nation’s recovery, it asks about how jobs, finances, access to food, health, housing, and schooling have been affected by the ongoing crisis.
I was laid off due to coronavirus pandemic
My employer experienced a reduction in business
I am retired
I was caring for an elderly person
I was caring for children not in school or daycare
I was caring for someone with coronavirus
I was sick with coronavirus symptoms
I did not want to be employed at this time
Source: US Census Bureau, Household Pulse Survey, June 27, 2020.
38,132 20,219 24,661 141,680 43,644 542,704 226,892 109,111 113,546 5,583 344,139 5,983 51,999 12,784 9,182 58,661 4,188 417,926 314,670 162,406 379,410 18,618 202,820 37,191 - 100,000 200,000 300,000 400,000 500,000 600,000
Data
https://www.census.gov/programs-surveys/household-pulse-survey/data.html
1)
5/5 vs (Week 7) 6/11
6/16 Week 1 Week 7
4/23 -
-
LOUISIANABUSINESSFORMATION
(L) The number of business applications in Louisiana each week in 2019 and 2020. (R) Business applications in Louisiana from 20152020.

For the week ending June 20, new business formations reached an all-time weekly high in Louisiana for the third straight week with 1,770 business applications filed. YTD 31,010 businesses were formed through June 20 compared to 29,360 in 2019.

Data Source: Business Formation Statistics, U.S. Census Bureau, https://www.census.gov/econ/bfs/index.html, June 27, 2020
0 200 400 600 800 1000 1200 1400 1600 1800 2000 Week 1 Week 2 Week 3 Week 4 Week 5 Week 6 Week 7 Week 8 Week 9 Week 10 Week 11 Week 12 Week 13 Week 14 Week 15 Week 16 Week 17 Week 18 Week 19 Week 20 Week 21 Week 22 Week 23 Week 24 Week 25
Formation Applications in Louisiana 2019 vs 2020 2019 2020 0 200 400 600 800 1000 1200 1400 1600 1800 2000 2015-05-30 2016-05-30 2017-05-30 2018-05-30 2019-05-30 2020-05-30
Formation Applications in Louisiana May
Business
Business
2015 - June 2020
LOUISIANAGASOLINESALES
Total gasoline sales in Louisiana since 1983.
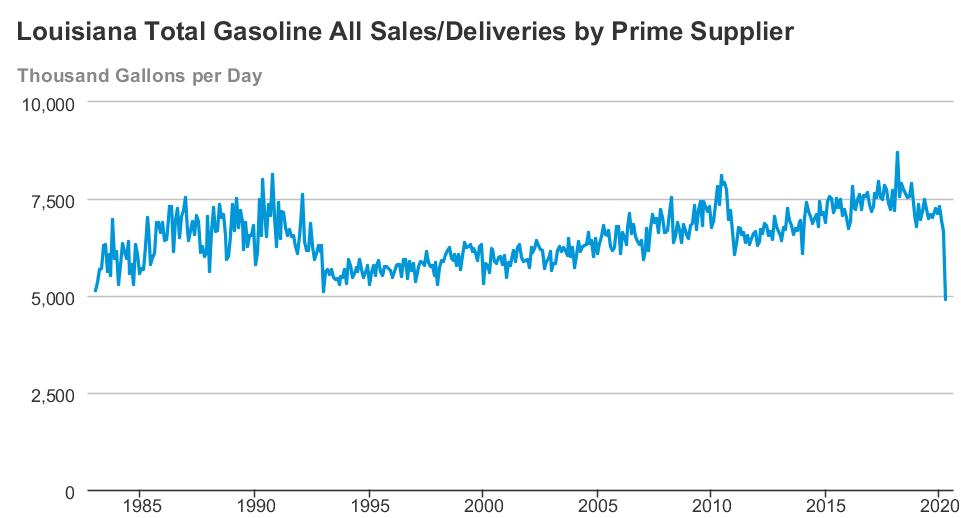
• In April 2020, Louisiana recorded the lowest gasoline sales since 1983 with sales of 4.9 million gallons, down 31.7% from April 2019.
• Total vehicle miles driven fell 39.7% in April from a year earlier
Data Source: U.S. Energy Information Administration, July 6, 2020
BAKERHUGHESRIGCOUNT
Represents the number of drilling rigs actively exploring for or developing oil or natural gas in Louisiana and the U.S.


Rig count in Louisiana is down 71.8% since June 2019.
Source: Baker Hughes, https://rigcount.bakerhughes.com/na-rig-count, June 27, 2020
Jun 19 May 20 June 20 N. LA-Land 37 22 21 S. LA –Int’l Water 4 0 0 S. LA-Land 7 1 0 S. LA-Offshore 22 13 12 TOTAL LOUISIANA 70 36 33 TOTAL US 970 348 274 0 10 20 30 40 50 60 70 0 100 200 300 400 500 600 700 800 900 3-Jan 10-Jan 17-Jan 24-Jan 31-Jan 7-Feb 14-Feb 21-Feb 28-Feb 6-Mar 13-Mar 20-Mar 27-Mar 3-Apr 10-Apr 17-Apr 24-Apr 1-May 8-May 15-May 22-May 29-May 5-Jun 12-Jun 19-Jun 26-Jun 3Jan 10Jan 17Jan 24Jan 31Jan 7Feb 14Feb 21Feb 28Feb 6Mar 13Mar 20Mar 27Mar 3Apr 9Apr 17Apr 24Apr 1May 8May 15May 22May 29May 5Jun 12Jun 19Jun 26Jun US 796 781 796 794 790 790 790 791 790 793 792 772 728 664 602 529 465 408 374 339 318 301 284 279 266 265 Louisiana 58 55 54 54 52 52 52 51 50 52 47 47 44 44 43 41 40 39 38 35 35 35 34 33 33 32 Rig Count in Louisiana & US January 2020 - Present US Louisiana
LOUISIANAGAMINGREVENUE
Gaming revenue in Louisiana for May 2020 with previous month and year comparisons. Louisiana casinos closed March 16th and reopened on May 18th . Data Source: Louisiana Gaming Control Board,
http://lgcb.dps.louisiana.gov/revenue_reports.html May YoY -65.4% May 2020 19-May 20-Apr 20-May % Change YoY Video Poker $54,229,300 $0 $23,874,584 -56.0% Riverboat $160,060,019 $0 $60,077,149 -62.5% Landbased $26,406,783 $0 $0 -100.0% Slots $31,503,037 $0 $10,314,748 -67.3% Total $272,199,139 $0 $94,266,481 -65.4%
June 2020.
OPENTABLERESERVATIONS INLOUISIANA


This data shows year-over-year seated diners at restaurants on the OpenTable network in Louisiana and New Orleans across all channels: online reservations, phone reservations, and walk-ins. Year-overyear comparisons by day compare the same day of the week from the same week in the previous year.
OpenTable Reservations in Lousiana and New Orleans
Percent Change Over Year Ago
Feb. 18 - Present
Source: OpenTable, https://www.opentable.com/state-of-industry, June 27, 2020
-150 -100 -50 0 50 100 150
New Orleans Louisiana
NATIONAL
NATIONALECONOMICINDICATORS
Monthly U.S. economic indicators for May 2020.
Data Source: U.S. Census, https://www.census.gov/economic-indicators/, July 4, 2020.
Indicator May-20 Apr-20 Monthly Wholesale Trade 0.3 -1.1 Manufacturers Shipments, Inventories, and Orders 8.0 -13.5 Construction Spending -2.1 -3.5 Advance Monthly Wholesale Inventories -1.2 0.2 Advance Monthly Retail Inventories -6.1 -3.8 Advance Durable Goods Manf. Shipments, Inventories, and Orders 15.8 -18.1 New Residential Sales 16.6 -5.2 New Residential Construction 4.3 -26.4 Advance Monthly Sales for Retail and Food Services 17.7 -14.7 Durable Goods 15.8% Residential Sales 16.6% Residential Construction 4.3%
THANKYOU
The data presented throughout the CENLA Economic Dashboard reflects contributions from the following local organizations. Also, special thanks to the following partners for distributing the dashboard to its members. Next Issue:August 10th
• Rapides Parish Policy Jury Treasurer
• RapidesArea Planning Commission
• City ofAlexandria Planning Division
• Avoyelles Parish School Board
• St. Landry Parish School Board
• Evangeline Parish Sales Tax Commissioner
• Concordia, Catahoula, & La Salle TaxAdministrator
• Alexandria InternationalAirport
• LSUAFoundation
• Central Louisiana Regional Chamber of Commerce
• Marksville Chamber of Commerce
• Bunkie Chamber of Commerce
• Evangeline Chamber of Commerce