CENLA ECONOMIC DASHBOARD
June 2, 2020.
Dr.RandallDupont Dean,CollegeofBusinessLouisianaStateUniversityofAlexandria
rdupont@lsua.edu


June 2, 2020.
Dr.RandallDupont Dean,CollegeofBusinessLouisianaStateUniversityofAlexandria
rdupont@lsua.edu
June 2, 2020 CENLA Economic Dashboard
• All measures of social distancing point to increasing mobility in central Louisiana.
• COVID-19 cases in Cenla increased from 270 on May 1st to 800 on May 31st and is the only region of the state with both increasing cases and increasing hospitalizations.
• InApril,Alexandria had the lowest unemployment rate among Louisiana’s metro areas at 9.9%. The state unemployment rate stands at 14.5%.

• Initial unemployment clams in central Louisiana have decreased for five weeks straight while continued claims have plateaued.
• YTD tax revenue for Rapides in 2020 is running equal to the same period in 2019, while YTD revenues for the City ofAlexandria are 4.5% below 2019 and up 11% for the City of Pineville.
• The valuation of building permits in Rapides in May was up 40% overApril and up 1.2% for the year. Pineville building permits valuations were up 3.4% YTD .
• AEX passenger traffic inApril and May was 14% of 2019 traffic, but still twice the national average.
• Louisiana small businesses were more optimistic on recovery time than the national average with 24% expecting a recovery in three months or less compared to 16% nationwide.
June 2, 2020
• Social Distancing Scoreboard
• COVID-19 Community Mobility Report
• COVID-19 Apple Mobility Trends
• COVID-19 Cases in CENLA
• COVID-19 Cases in Rapides & Louisiana
• Unemployment RateAmong La Metros
• Unemployment Claims in Cenla
• Total Unemployment Claims in Louisiana
• How Many Jobs Can Be Done at Home?
• Rapides Sales Tax
• Rapides Vehicle Sales Tax
• Alexandria Sales Tax
• Pineville Sales Tax
• RapidesArea Permits Issued
• RapidesArea Permit Valuations
• Allen Parish Permit Valuations
• Avoyelles Parish Permit Valuations
• Pineville Permit Valuations
• Rapides Parish Permit Valuations
• Residential Construction Permits
• City ofAlexandria Permits
• Rapides Hotel Occupancy Tax
• AEX Passenger Traffic
• Air Traveler Stats
• Air Passenger Traffic atAEX Hubs
• Louisiana Small Business Pulse Survey
• Open Table Reservations in Louisiana
• Oil & Gas Well Count in Cenla
Represents the change in the number of potential human encounters. Higher grades represent less mobility, while lower grades represent increased mobility.
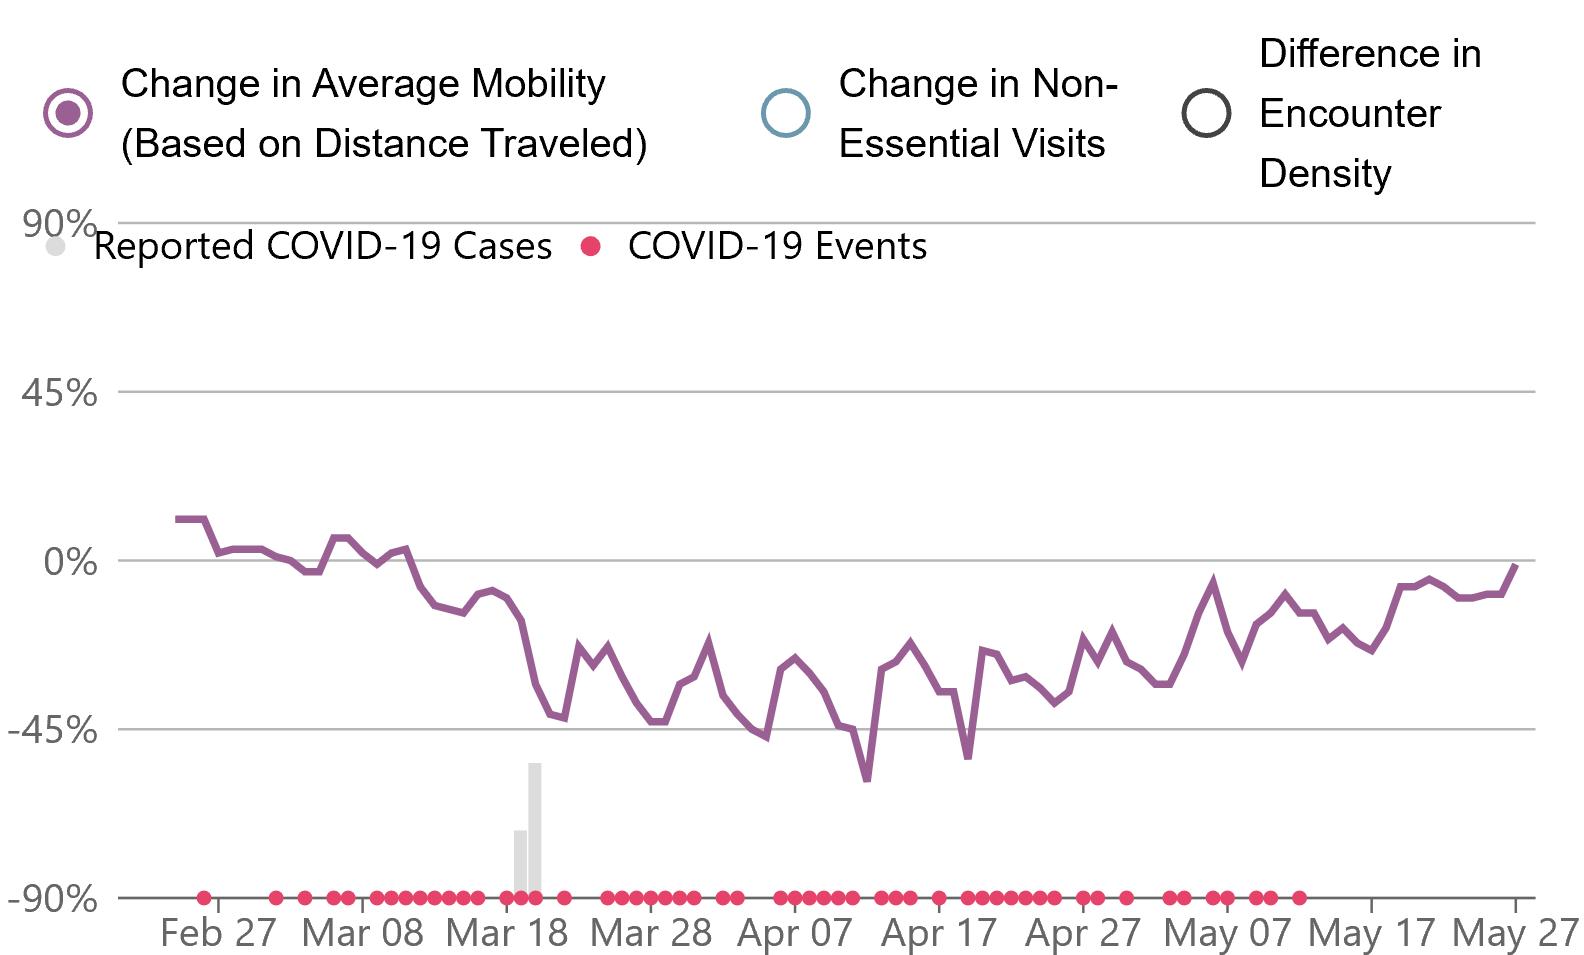
Feb. 25 – May 29, 2020
Source: Unacast.com, Social Distancing Scoreboard, https://www.unacast.com/covid19/social-distancing-scoreboard
Represents how visits and length of stay at different places changed on April 11, May 2, May 13, & May 29 relative to a February 16, 2020 baseline.
Note: * Not enough data for this date: Currently, there is not enough data to provide a complete analysis.
Source: Google Mobility Change Report as of March 29,April 11, May 2, May 29, 2020
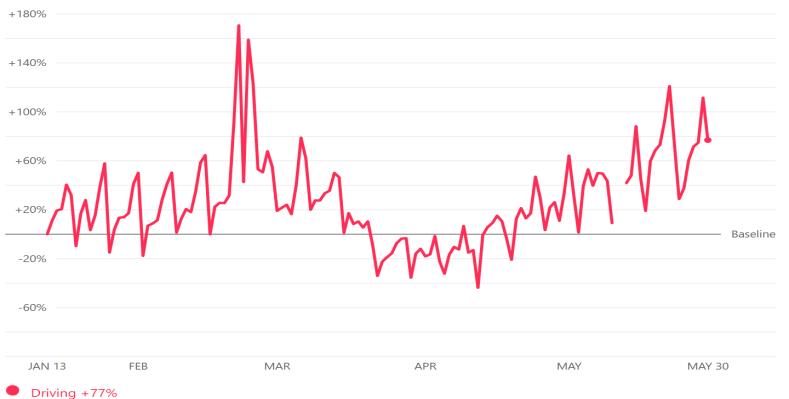
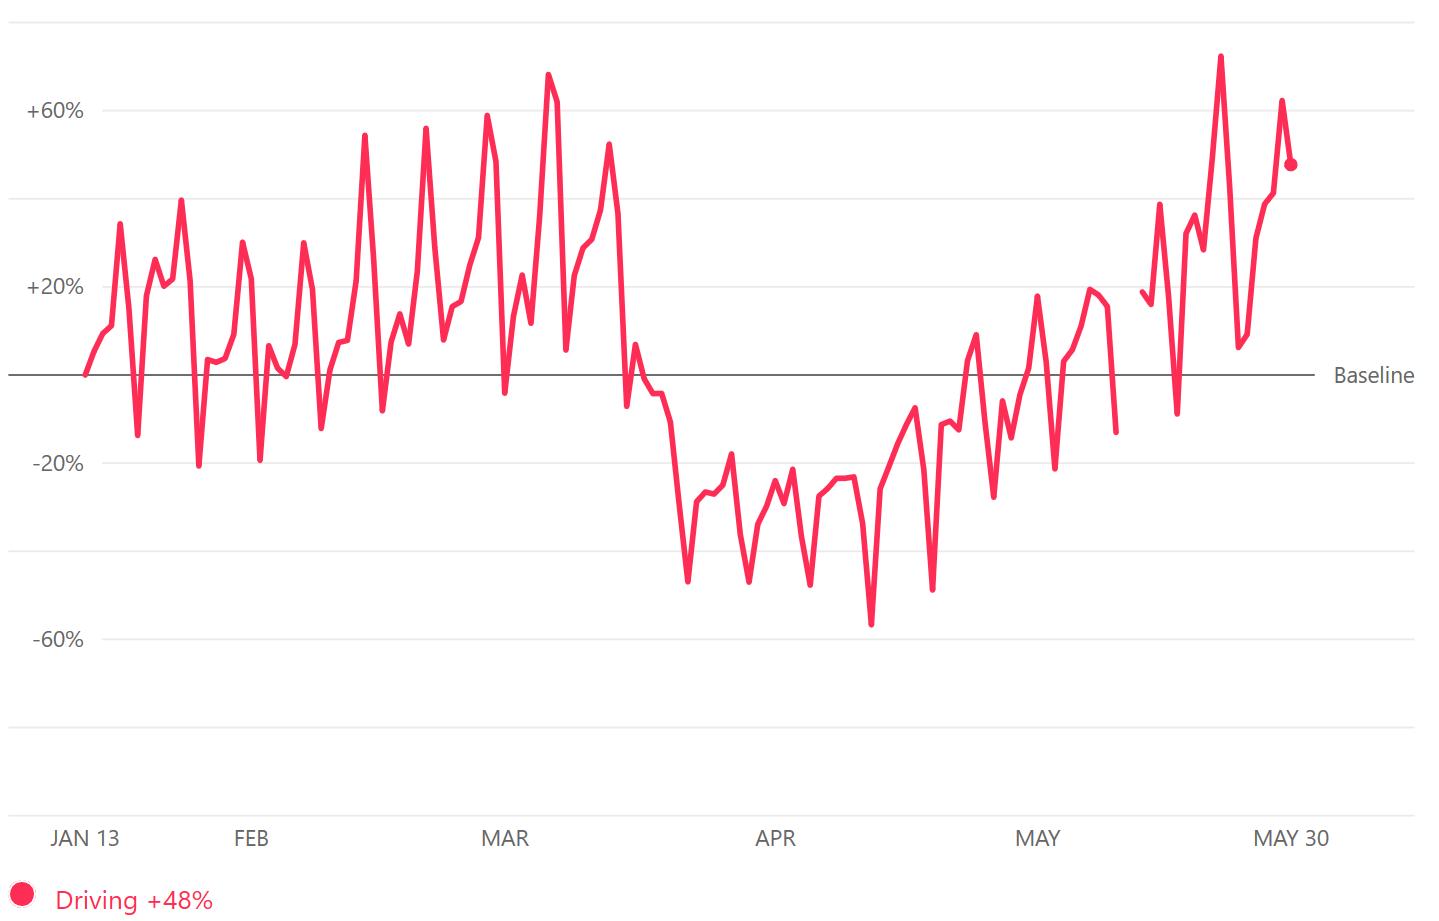
Apple’s Mobility Trends Report tracks aggregate changes in mobility from January 13 to May 30, 2020.
Avoyelles
Evangeline
Source: Apple Mobility Trends Report, https://www.apple.com/covid19/mobility
Rapides
COVID-19 Cases by Parish
March 19 - May 30, 2020
(L) Daily new cases in Rapides Parish.
(R) Daily new cases per week in Rapides Parish.

The table below shows April 2020 preliminary unemployment rate, labor force, and employment data for Metropolitan Statistical Areas in Louisiana.
At 9.9%, the Alexandria MSA had the lowest unemployment rate in the state among all major metro areas, well below the state’s 14.5% rate.
Data Source: Louisiana Workforce Commission, May 31, 2020
(L) Initial unemployment claims in Cenla March 21 – May 23
(R) Continued unemployment claims in Cenla March 21 – May 23


Louisiana Initial Unemployment Claims Mar 14 - May 23, 2020
Source: Louisiana Workforce Commission, June 1, 2020
Researchers at the Becker Friedman Institute for Economics at The University of Chicago classified the feasibility of working at home for all metro areas. “Approximately 32 percent of all U.S. jobs, accounting for 42 percent of overall wages, can be performed almost entirely at home.”
(Right) According to the study, approximately 30% of the jobs in Alexandria can be done from home and those jobs account for 33% of total local wages.
(Far Right) Approximately 82% of educational jobs and 80% of professional jobs can be done remotely.
Source: Becker Friedman Institute at
(TR) Rapides Parish total sales tax revenue for May with previous month, year, and YTD comparisons.
(BR) Rapides Parish total monthly sales tax revenue from 2017 to present.

Note: May sales tax revenue reflects sales activity in April.
Data Source: Rapides Parish Police Jury Treasurer’s Reports.
Rapides Parish vehicle sales tax revenue for May with previous month, year, and YTD comparisons.
Note: May tax revenue reflects sales activity in April.
Data Source: Tax revenue data from Rapides Parish Police Jury Treasurer’s Reports.
(TR) Alexandria sales tax revenue for May with previous month, year, and YTD comparisons.
(BR) Alexandria monthly sales tax revenue from 2017 to present.

Note: May sales tax revenue reflects sales activity in April.
Data Source: Rapides Parish Police Jury Treasurer’s Reports.
(TR) Pineville sales tax revenue for May with previous month, year, and YTD comparisons.
(BR) Pineville monthly sales tax revenue from 2017 to present.

Note: May sales tax revenue reflects sales activity in April.
Data Source: Rapides Parish Police Jury Treasurer’s Reports.
1,200
1,000
800
600
400
200
20% -
Number of Permits Issued
January - May 2017 - 2020 2017 2018 2019 2020
Note: Avoyelles Parish data not included until 2019. City ofAlexandria permits are accounted separately.
Data Source: RapidesArea Planning Commission.
Valuation of permits issued by Rapides Area Planning Commission between 2017-2020 year-to-date for major jurisdictions.
Valuation of RPAC permits issued between January - May, 2020 compared to same period in 2019.
-57%
Note: Avoyelles Parish data not included until 2019. City ofAlexandria permits are accounted separately. Three projects in Rapides in Feb. 2019 accounted for $29.8 million. Without these projects, which may be considered an anomaly, YTD for May 2020 compared to YTD for May 2019 increased 25.5%.
Data Source: RapidesArea Planning Commission.
Valuation of permits issued by Rapides Area Planning Commission in Allen Parish between 2017-2020 year-to-date.
Valuation of RPAC permits issued inAllen Parish between January-May, 2020 compared to same period in 2019
79%
Data Source: RapidesArea Planning Commission.
Valuation of permits issued by Rapides Area Planning Commission in Avoyelles Parish between 2017-2020 year-to-date.
Valuation of RPAC permits issued in Avoyelles Parish between January-May, 2020 compared to same period in 2019
Data Source: RapidesArea Planning Commission.
Valuation of permits issued by Rapides Area Planning Commission in Pineville between 2017-2020 year-to-date.
Valuation of RPAC permits issued in Pineville between January-May, 2020 compared to same period in 2019
Data Source: RapidesArea Planning Commission.
Valuation of permits issued by Rapides Area Planning Commission in Rapides (excluding Alexandria) between 2017-2020 year-to-date.
Note: Three projects in Rapides in Feb. 2019 accounted for $29.8 million. Excluding these projects, YTD permit valuations are up 25.5%.
Data Source: RapidesArea Planning Commission.
New residential construction permit valuation (estimated development cost) issued by Rapides Area Planning Commission by jurisdiction in May 2019 compared to May 2020.
Valuation of New Residential Construction
May 2019 vs May 2020
Note: Avoyelles Parish data not included until 2019. City ofAlexandria permits are accounted separately.
Data Source: RapidesArea Planning Commission.
New residential and commercial construction permit valuation (estimated development cost) issued by the City of Alexandria in 2019 compared to 2020.
May 2019 vs May 2020
Rapides Parish hotel occupancy tax revenue for May 2020 with previous month, year, and YTD comparisons.
Note: May tax revenue reflects hotel occupancy activity in April.
Data Source: Rapides Parish Police Jury Treasurer’s Reports.
Shows total passenger throughput at Alexandria International and nationwide from April 3 – May 28, 2020 as a percent of traffic a year ago.
Passenger Throughput as a Percent a Year Ago
Average percent travelers atAEX inApril & May compared to a year ago
Average percent travelers nationwide inApril & May compared to a year ago
14%
7%


Data Source: Alexandria International Airport, May 29, 2020
AEX vs Nationwide


(R)Nationwide daily number of passengers passing through TSA checkpoints in 2020 vs 2019. (L) Passenger traffic for American, Delta, and United for March 2020 compared to March 2019.
(L) Percentage change in passenger traffic at Houston, Dallas-Ft.
Worth, and Atlanta for March 2020 compared to March 2019.
(R) Passenger traffic at major hubs connecting AEX.
Passenger Traffic atAEX Connecting Hubs
March 2020 - March 2019
Data Source: HoustonAirports, www.fly2houston.com; DFW International, www.dfwairport.com; Hartsfield-Jackson International Airport, www.atl.com
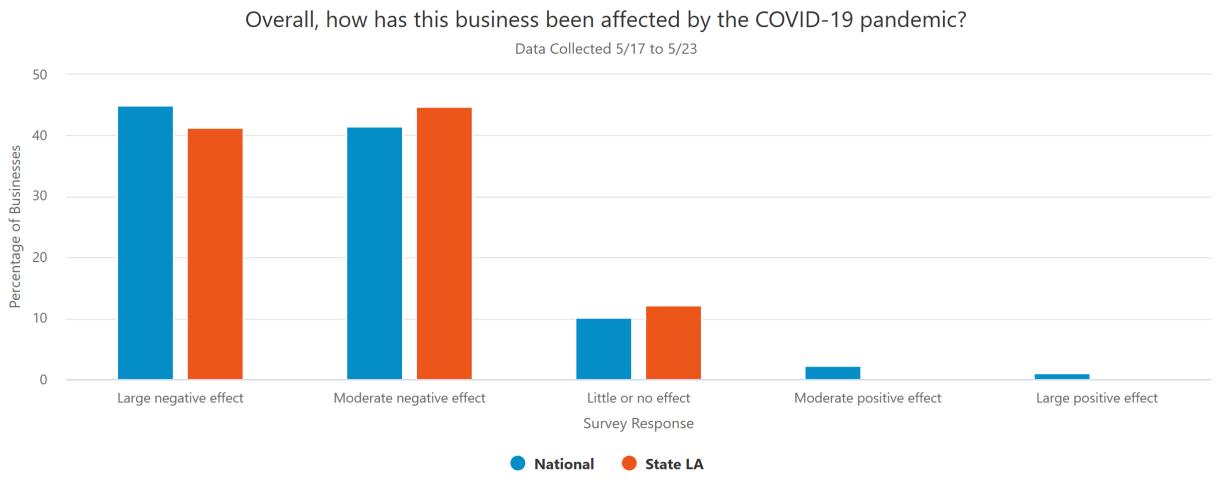
In April, the US Census initiated a survey to track the pulse of small businesses during the COVID-19 pandemic. Results for the May 17 – May 23 period in Louisiana are shown on the right.
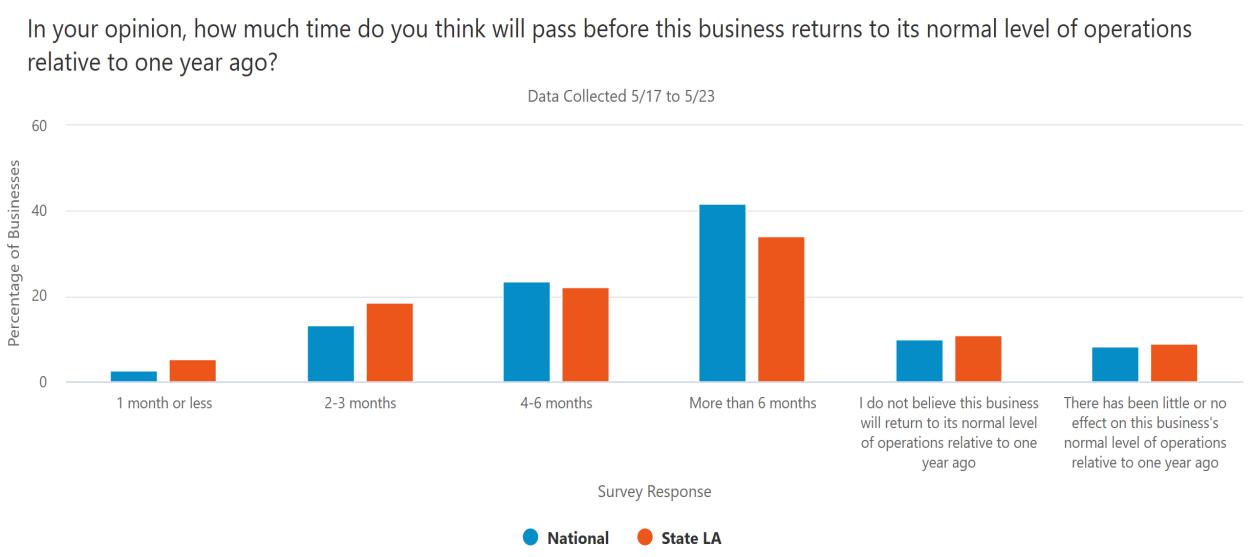
Louisiana small businesses were more optimistic on recovery time than the national average. Fifty-seven percent of small businesses in Louisiana said COVID-19 had little to moderate impact on their business compared to 51.6% nationwide.

This data shows year-over-year seated diners at restaurants on the OpenTable network in Louisiana across all channels: online reservations, phone reservations, and walk-ins. Year-overyear comparisons by day compare the same day of the week from the same week in the previous year.
Source: OpenTable, https://www.opentable.com/state-of-industry, May 30, 2020
Feb. 18 - Present
Count of oil and gas producing wells by parish from January to April 2020. Data from the La Dept of Natural Resources.
(TR) Well count in Cenla excluding LaSalle.
(BR) Well count in Cenla with LaSalle separate. LaSalle accounts for 6775% of the wells in Cenla.
Well Count in CENLA Parishes (excluding LaSalle)
January - April 2020
Total Well Count in CENLA (Including LaSalle)
January - April 2020
Source: Louisiana Department of Natural Resources, Strategic Online Natural Resource Information System, May 2020.
The data presented throughout the CENLA Economic Dashboard reflects contributions from the following local organizations.
• Rapides Parish Policy Jury Treasurer
• RapidesArea Planning Commission
• City ofAlexandria Planning Division
• Avoyelles Parish School Board
• St. Landry Parish School Board
• Evangeline Parish Sales Tax Commissioner
• Alexandria InternationalAirport
• Louisiana Workforce Commission
Also, special thanks to the following partners for distributing the dashboard to its members.
Next Issue: Week of June 15th
• LSUAFoundation
• Central Louisiana Regional Chamber of Commerce
• Marksville Chamber of Commerce
• Bunkie Chamber of Commerce