CENLA ECONOMIC DASHBOARD
May 18, 2020.
Dr.RandallDupont Dean,CollegeofBusiness
LouisianaStateUniversityofAlexandria
rdupont@lsua.edu

CONTENTS
May 18, 2020
• Social Distancing Scoreboard
• COVID-19 Community Mobility Report
• COVID-19 Community Mobility Graphs
• Apple Mobility Trends
• COVID-19 Cases in CENLA
• COVID-19 Cases in Rapides & Louisiana
• COVID-19 Economic Vulnerability Index
• Statewide Initial Claims by Industry
• Initial Unemployment Claims in Cenla
• Initial Unemployment Claims by Parish
• Total Unemployment Claims in Louisiana
• Job Openings
• Top Employers
• Top Occupations
• Avoyelles Sales Tax
• Avoyelles Vehicle Sales Tax
• Avoyelles Hotel Occupancy Tax
• Evangeline Sales Tax
• Evangeline Vehicle Sales Tax
• St. Landry Sales Tax
• St. Landry Vehicle Sales Tax
• Rapides Sales Tax
• Rapides Vehicle Sales Tax
• Rapides Hotel Occupancy Tax
• Alexandria MSAHousing Market
• Baker Hughes Rig Count
• Louisiana Gaming Revenue

• Small Business Pulse Survey
• National Economic Indicators
• Advance Monthly Retail Indicators
KEYTAKEAWAYS
May 18, 2020 CENLA Economic Dashboard
• Social distancing indicators show increased mobility throughout Rapides and Cenla.
• Economic research firm, Chmura, ranks theAlexandria MSAas one of the least economically vulnerable metro areas in U.S.
• Rapides hit a daily high in new COVID-19 cases.
• Initial unemployment claims in Cenla are down for fourth straight week.
• Rapides job openings reached a 12 month low.
• Sales tax revenue was up in Rapides,Avoyelles, Evangeline, and St. Landry inApril, which reflects increased March sales activity over February.
• Vehicles sales tax revenue was up in Rapides,Avoyelles, Evangeline, and St. Landry inApril, which reflects increased March sales activity over February,
• Active listings in theAlexandria MSAhousing market were at the lowest level in past year.
• Rig count in Louisiana is down 40% since January 1 and 57% nationwide.
• 38.5% of Louisiana small businesses believe the economy will be restored within three months compared to 28% nationwide.
COVID-19
SOCIALDISTANCINGSCOREBOARD
Represents the change in the number of potential human encounters. Higher grades represent less mobility, while lower grades represent increased mobility.
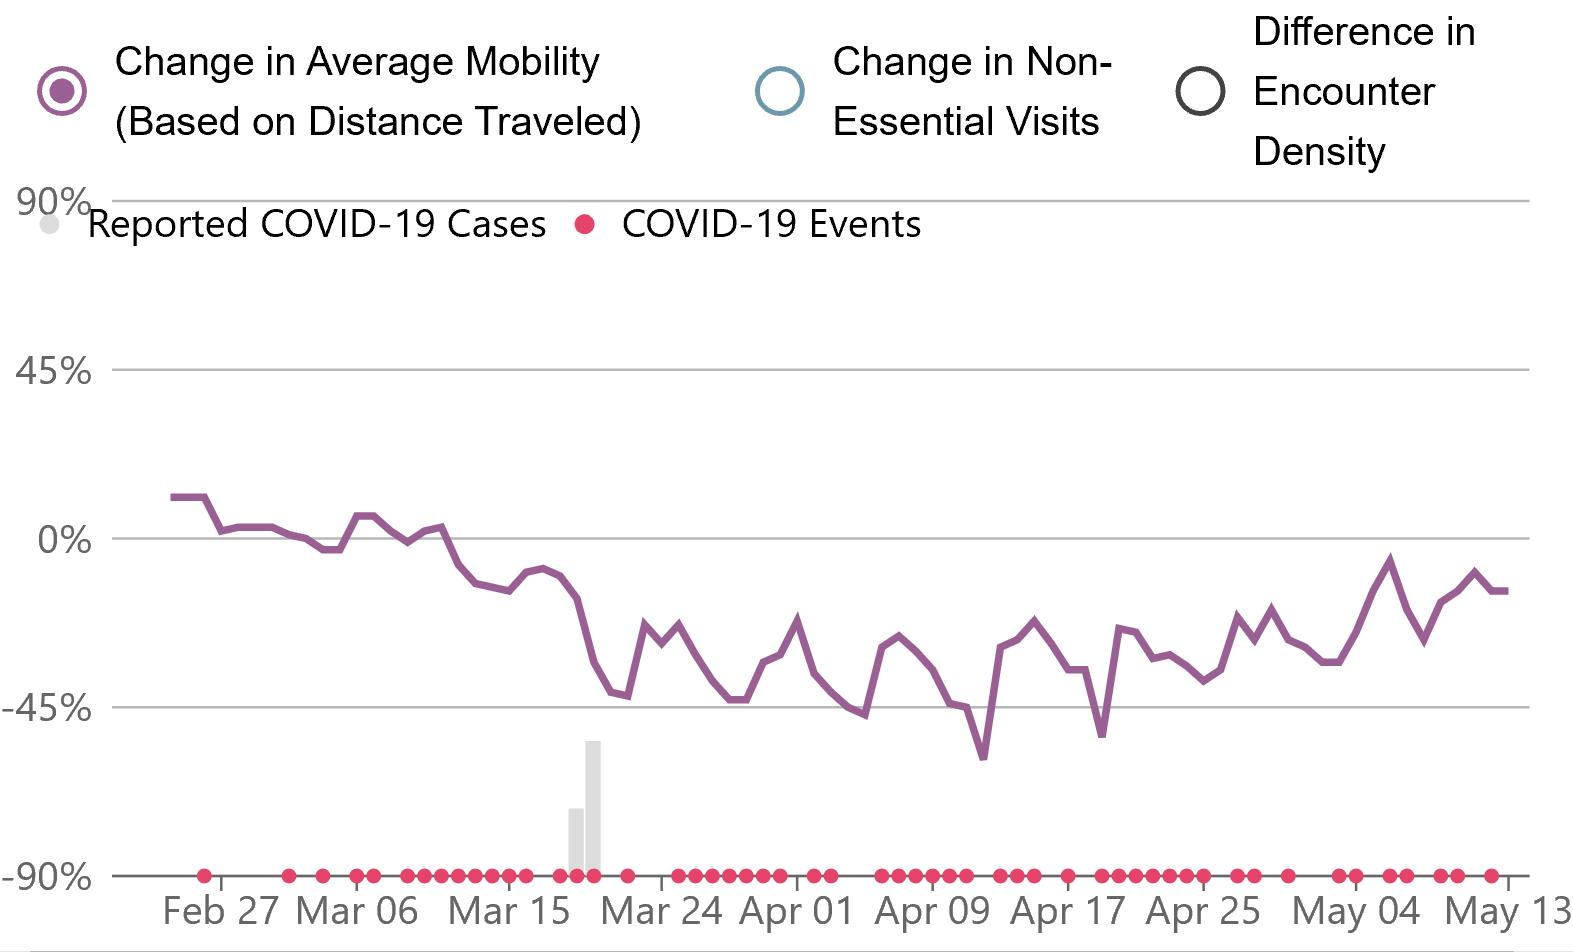
Rapides Parish
Feb. 25 – May 15, 2020
4-Apr
16-Apr
26-Apr 15-May
C D D F
D C- C D
D D D+ D
C C- C C
D D D+ D
D D+ D+ D
B B- B- C
D
Landry
D- D
Source: Unacast.com, Social Distancing Scoreboard, https://www.unacast.com/covid19/social-distancing-scoreboard D+
Louisiana
Allen
Avoyelles
Catahoula
Concordia
Evangeline
Grant
LaSalle D D D
Rapides B D F F St.
D
F Vernon C D
D
COVID-19COMMUNITYMOBILITYREPORT
Represents how visits and length of stay at different places changed on March 29, April 11, and May 2 relative to a February 16, 2020 baseline.
Source: Google Mobility Change Report as of March 29, April 11, and May 2, 2020 Retail Grocery & Pharmacies Workplaces 29-Mar 11-Apr 2-May 29-Mar 11-Apr 2-May 29-Mar 11-Apr 2-May Louisiana -45% -45% -30% -16% -2% 1% -35% -36% -26% Allen -34% -35% -35% -19% -10% -10% -33% -38% -26% Avoyelles -24% -16% -16% -8% 5% 5% -32% -27% -16% Catahoula -64% -64% -64% -20% -24% -24% -38% -44% -24% Concordia -23% -24% -24% -16% -16% -16% -20% -30% -16% Evangeline -16% -36% -36% -4% 1% 1% -25% -28% -20% Grant - - -13% 17% 17% -20% -20% -6% LaSalle -27% -36% -36% -9% 2% 2% -31% -41% -24% Rapides -40% -39% -21% -15% 0% 10% -30% -27% -21% St. Landry -28% 38% -19% -16% 20% 29% -28% -26% -15%
COVID-19COMMUNITYMOBILITYGRAPHS
Graphical representation of changes in Google’s Mobility Report for March 29 and May 2 relative to a February 16, 2020 baseline.
Source: Google Mobility Change Report as of March 29, April 11, and May 2, 2020
-70% -60% -50% -40% -30% -20% -10% 0% Retail Stores 29-Mar 2-May
-30% -20% -10% 0% 10% 20% 30% 40% Groceries & Pharmacies 29-Mar 2-May -40% -35% -30% -25% -20% -15% -10% -5% 0% Workplace 29-Mar 2-May
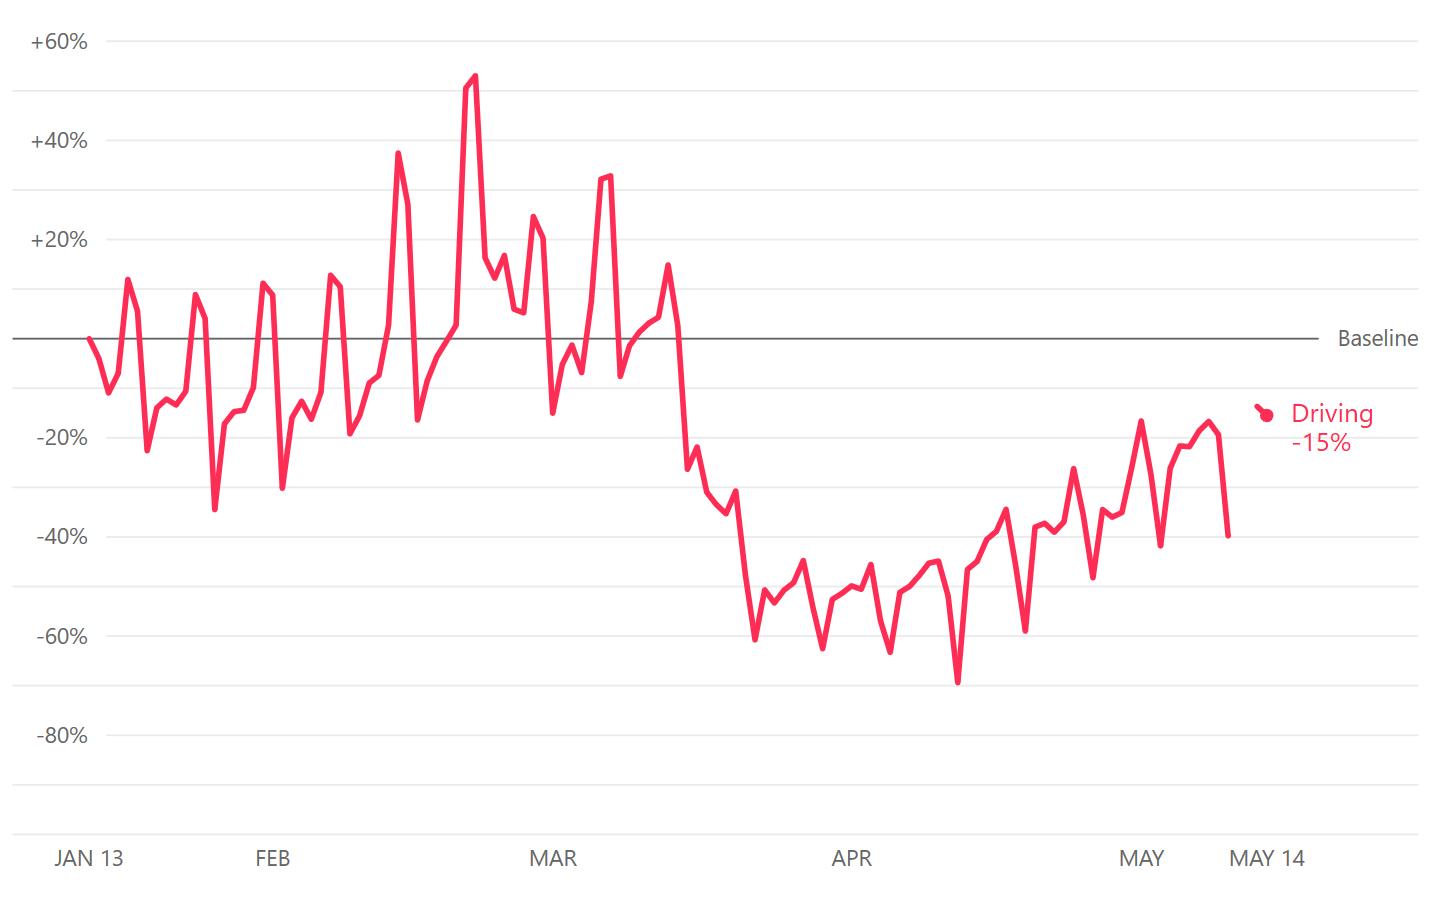
APPLEMOBILITYTRENDS
Apple’s Mobility Trends Report tracks aggregate changes in mobility from January 13 to May 14, 2020.
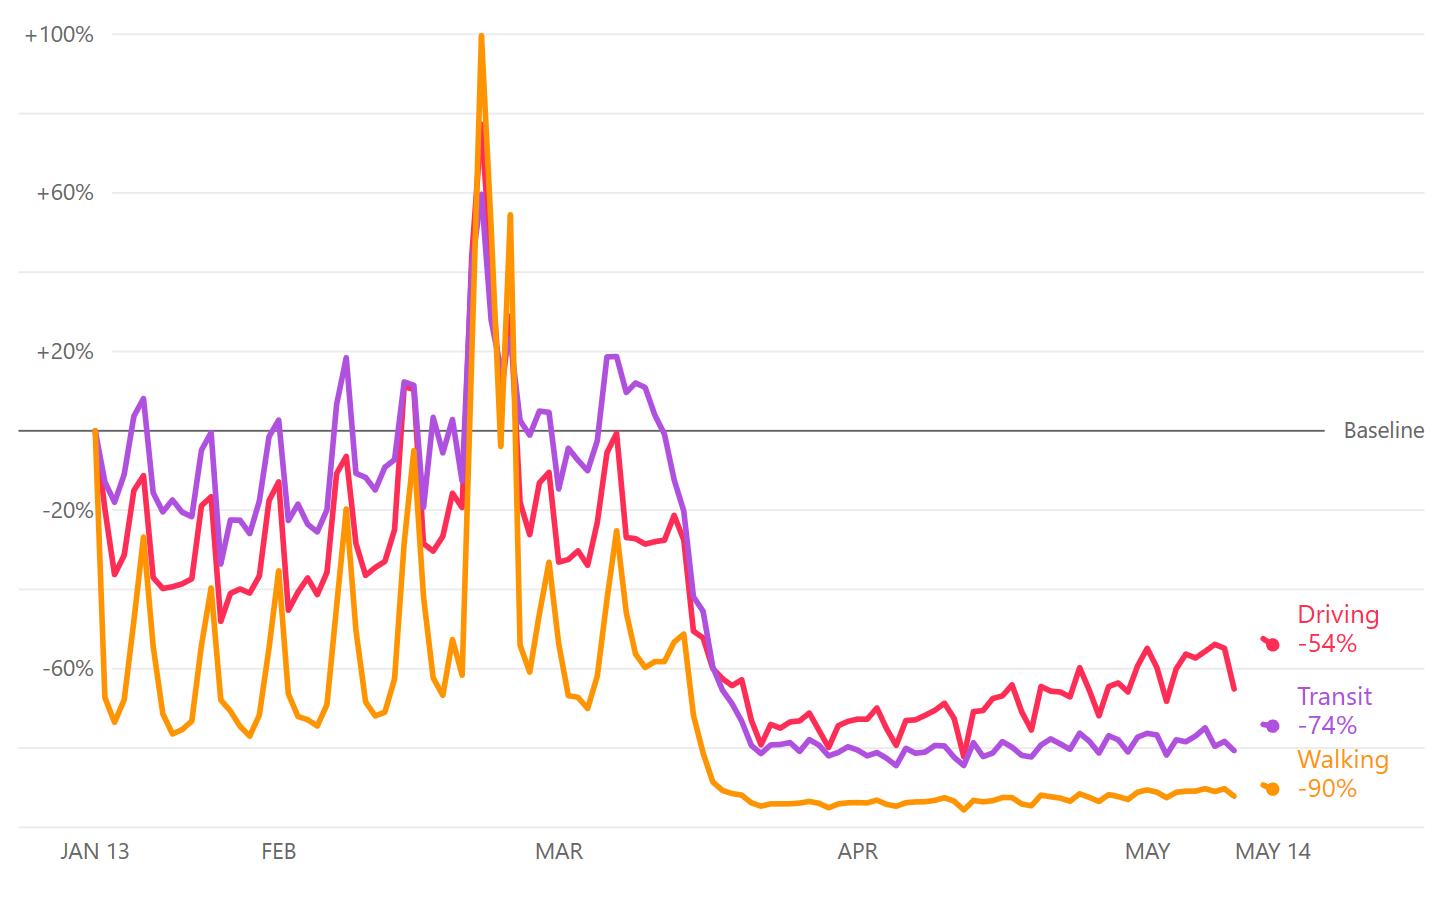
Louisiana
Source: Apple Mobility Trends Report, https://www.apple.com/covid19/mobility
New Orleans
COVID-19CASESINCENLA
(L) Cases per 1,000 population as of May 14.
(R) Cumulative cases by parish
COVID-19 Cases by Parish March 19 – May 14, 2020
Data from New York Times and US Census 2019 Population Estimate Parish Cases / 1000 Allen 3.67 Avoyelles 1.97 Catahoula 10.85 Concordia 2.80 Evangeline 2.22 Grant 0.80 LaSalle 2.35 Rapides 3.22 St Landry 2.95 0 50 100 150 200 250 300 350 400 450
Source:
Rapides Avoyelles Evangeline St Landry Allen Grant Catahoula Concordia LaSalle
COVID-19CASESINRAPIDES&LOUISIANA


Daily new cases in Rapides.
Daily new cases and deaths in Louisiana. Source: Data from New York Times and US Census 2019 Population Estimate 0 5 10 15 20 25 Daily New Cases in Rapides Parish March 20 - May 14, 2020 0 20 40 60 80 100 120 140 1/1/1900 1/4/1900 1/7/1900 1/10/1900 1/13/1900 1/16/1900 1/19/1900 1/22/1900 1/25/1900 1/28/1900 1/31/1900 2/3/1900 2/6/1900 2/9/1900 2/12/1900 2/15/1900 2/18/1900 2/21/1900 2/24/1900 2/27/1900 3/1/1900 3/4/1900 3/7/1900 0 500 1,000 1,500 2,000 2,500 3,000 Daily New Cases Daily New Cases & Deaths in Louisiana March 9 - May 14, 2020 New Cases New Deaths
(L)
(R)
EMPLOYMENT
COVID-19ECONOMICVULNERABILITYINDEX
The Economic Vulnerability Index is a measurement of the negative impact that the coronavirus crisis can have on employment based upon a region’s mix of industries. The average Vulnerability Index score is 100, representing the average job loss expected in the United States.
Higher scores indicate the degree to which job losses may be greater an index of 200, for example, means the rate of job loss can be twice as large as the national average. Conversely, an index of 50 would mean a possible job loss of half the national average.
Source: Chumra, http://www.chmuraecon.com/interactive/covid-19-economic-vulnerability-index/
Index Rank Alexandria 88 335 Baton Rouge 95 249 Hammond 107 75 Houma-Thibodaux 100 170 Lafayette 98 201 Lake Charles 100 171 Monroe 96 227 New Orleans-Metairie 126 25 Shreveport-Bossier 106 88
Index Rank Allen 164 56 Avoyelles 107 504 Catahoula 57 2836 Concordia 99 838 Evangeline 54 2898 Grant 99 841 La Salle 61 2694 Rapides 87 1500 St. Landry 86 1589 Vernon 59 2772
(Rank
Metro Area Vulnerability Index (Rank out of 384 Cities) Cenla Parish Vulnerability Index
out of 3141 Counties)
INITIALUNEMPLOYMENTCLAIMSBYINDUSTRY
Statewide initial unemployment claims by industry and week of filing.
Statewide initial unemployment claims are trending down in construction, manufacturing, retail trade, education, health care, and accommodation and food services.
Data Source: Louisiana Workforce Commission, May 15, 2020
Initial Unemployment Claims by Industry
March 21 - May 9, 2020
5,000 10,000 15,000 20,000 25,000 30,000 Construction
Manufacturing Retail Trade Educational Services Health Care Accomodation & Food Services
03/21/2020 03/28/2020 04/04/2020 04/11/2020 04/18/2020 04/25/2020 05/02/2020 05/09/2020
INITIALUNEMPLOYMENT CLAIMSINCENLA
(L) Initial unemployment claims by parish and week
(R) Total initial unemployment claims in Cenla.
Source: Louisiana Workforce Commission, May 15, 2020
28-Mar 4-Apr 11-Apr 18-Apr 25-Apr 2-May 9-May Allen 205 421 431 683 233 181 119 Avoyelles 618 467 412 491 359 290 234 Catahoula 87 95 83 135 88 69 52 Concordia 161 175 133 190 177 125 127 Evangeline 253 379 298 386 268 288 178 Grant 213 209 172 177 141 115 98 La Salle 329 351 293 339 243 178 142 Rapides 1,924 1,828 1,371 1,541 1,125 955 841 St. Landry 1,293 1,395 1,071 1,437 1,093 845 702 Vernon 488 523 393 368 390 266 204 Total 5,571 5,843 4,657 5,747 4,117 3,312 2,697 3,240 5,571 5,843 4,657 5,747 4,117 3,312 2,697
Mar 21 - May 9
Cenla Initial Unemployment Claims
INITIALUNEMPLOYMENTCLAIMSBYPARISH
Source: Louisiana Workforce Commission, May 15, 2020200 400 600 800 1,000 1,200 1,400 1,600 1,800 2,000 Avoyelles Evangeline Rapides St. Landry Initial Unemployment Claims for Select Parishes March 21 - May 9, 2020 21-Mar 28-Mar 4-Apr 11-Apr 18-Apr 25-Apr 2-May 9-May
Snapshot of weekly initial claims filed March 21 through May 9, 2020..
TOTALUNEMPLOYMENTCLAIMSINLOUISIANA


Initial and continued unemployment claims in Louisiana
Source: Louisiana Workforce Commission, May 15, 2020
50,000 100,000 150,000 200,000 250,000 300,000 350,000 0 20,000 40,000 60,000 80,000 100,000 120,000 Continued Claims Initial Claims 3/14 3/21 3/28 4/4 4/11 4/18 4/25 5/2 5/9 Initial 2,262 72,474 97,472 102,267 79,760 92,026 66,227 51,037 40,194 Continued 14,041 14,208 58,088 120,810 217,640 264,430 300791 310,152 325,283 Louisiana Initial and Continuing Unemployment Claims Mar 14 - May 9, 2020
JOBOPENINGS
(L) The number of job openings advertised online in Cenla on May 15, 2020 and (R) job openings in Rapides parish since April 2019
Data Source: Louisiana Workforce Commission, May 15, 2020 Area Job Openings Allen 119 Avoyelles 241 Catahoula 30 Concordia 131 Evangeline 152 Grant 38 La Salle 72 Rapides 3356 St. Landry 464 0 1,000 2,000 3,000 4,000 5,000 6,000 Rapides Job Openings
TOPEMPLOYERS
The tables below shows employers with the highest number of job openings advertised online on May 15, 2020.
AlexandriaMSA Louisiana Employer Name Job Openings Ochsner Clinic Foundation 1,452 Pizza Hut, Inc. 862 Christus Health 853 DoorDash, Inc. 782 Ochsner Health System 781 Dollar Tree, Inc. 601 SONIC Corp. 589 Army National Guard 522 Lafayette General Health 493 Burger King Corporation 430 Employer Job Openings CHRISTUS Health 354 Rapides Parish School Dist 119 Army National Guard 63 DoorDash, Inc. 54 Pizza Hut, Inc. 27 Veterans Health Admin 26 Encompass Health Corp 25 HCA Healthcare, Inc. 21 Walgreen Company 19 SONIC Corp. 18 Source: Louisiana Workforce Commission, May 15, 2020
TOPOCCUPATIONS
The tables below shows occupations with the highest number of job openings advertised online in Louisiana on May 15, 2020.
AlexandriaMSA Louisiana Occupation Job Openings Registered Nurses 3,011 Supervisors of Food Workers 1,129 Customer Service Reps 960 Food Preparation Workers 924 Retail Salespersons 905 General & Operations Mgrs 742 Physicians and Surgeons 726 Supv of Retail Sales Workers 713 Driver/Sales Workers 656 Licensed Practical Nurses 560 Occupation Job Openings Registered Nurses 248 Physicians and Surgeons 46 Retail Salespersons 36 Customer Service Reps 36 Supervisors of Food Workers 35 Food Preparation Workers 34 Driver/Sales Workers 32 Respiratory Therapists 31 Heavy Truck Drivers 25 Supv of Retail Sales Workers 21 Source: Louisiana Workforce Commission, May 15, 2020
TAXREVENUE
AVOYELLESSALESTAX
Avoyelles Parish total sales tax revenue for April with previous month and year comparisons.
Note: April sales tax revenue reflects sales activity in March.
Data Source: Avoyelles Parish School Board.
2016 2017 2018 2019 2020 April $ 1,525,874 $ 1,961,650 $ 1,942,351 $ 1,695,869 $ 1,580,351 March $ 1,251,136 $ 1,282,540 $ 1,202,024 $ 1,293,507 $ 1,117,939 % Chg over Prev Month 53.0% 61.6% 31.1% 41.4% % Chg over Prev Year 28.6% -1.0% -12.7% -6.8% April 41.4% April YoY -6.8% April
AVOYELLESVEHICLESALESTAX
Avoyelles Parish vehicle sales tax revenue for April with previous month and year comparisons.
Note: April sales tax revenue reflects sales activity in March.
Data Source: Avoyelles Parish School Board.
2016 2017 2018 2019 2020 April $ 280,701 $ 362,274 $ 320,682 $ 308,022 $ 296,018 March $ 268,752 $ 220,232 $ 224,927 $ 236,649 $ 243,753 % Chg over Prev Month 64.5% 42.6% 30.2% 21.4% % Chg over Prev Year 29.1% -11.5% -3.9% -3.9% April 21.4% April YoY -3.9% April
AVOYELLESHOTELOCCUPANCYTAX
Avoyelles Parish hotel occupancy tax revenue for April with previous month and year comparisons.
Note: April sales tax revenue reflects sales activity in March.
Data Source: Avoyelles Parish School Board.
2016 2017 2018 2019 2020 March $ 9,669 $ 11,290 $ 11,448 $ 12,256 $ 12,880 February $ 9,465 $ 10,853 $ 9,566 $ 8,137 $ 3,369 % Chg over Prev Month 4.0% 19.7% 50.6% 282.2% % Chg over Prev Year 16.8% 1.4% 7.1% 5.1% April 282% April YoY 5.1% April
EVANGELINESALESTAX
Evangeline Parish total sales tax revenue for April with previous month, year and YTD comparisons.
Note: April sales tax revenue reflects sales activity in March.
Data Source: Evangeline Parish Sales Tax Commissioner.
2016 2017 2018 2019 2020 April $ 1,910,432 $ 1,950,371 $ 1,724,796 $ 1,790,920 $ 1,760,760 March $ 1,355,963 $ 1,273,408 $ 1,295,041 $ 1,371,683 $ 1,323,124 % Chg over Prev Month 53.2% 33.2% 30.6% 33.1% % Chg over Prev Year 2.1% -11.6% -3.8% -1.7% YTD (Jan - Apr) $ 6,188,839 $ 6,401,094 $ 6,050,906 $$ 6,269,136 $ 6,217,033 % Chg over Prev YTD 3.4% -5.5% 3.6% -0.8% April 33.1% April YoY -1.7% April YTD -0.8% April
EVANGELINEVEHICLESALESTAX
Evangeline Parish vehicle sales tax revenue for April with previous month, year, and YTD comparisons.
Note: April sales tax revenue reflects sales activity in March.
Data Source: Evangeline Parish Sales Tax Commissioner.
2016 2017 2018 2019 2020 April $ 266,901 $ 390,369 $ 303,078 $ 310,254 $ 303,815 March $ 318,894 $ 258,717 $ 255,084 $ 259.766 $ 261,498 % Chg over Prev Month 50.9% 18.8% 19.4% 16.2% % Chg over Prev Year 46.3% -22.4% 2.4% -2.1% YTD (Jan - Apr) $ 1,118,653 $ 1,228,726 $ 1,090,004 $$ 1,210,092 $ 1,173,015 % Chg over Prev YTD 9.8% -11.3% 11.0% -3.1% April 16.2% April YoY -2.1% April YTD -3.1% April
ST.LANDRYSALESTAX
St. Landry Parish sales tax revenue for April with previous month, year, and YTD comparisons.
Note: April tax revenue reflects sales activity in March.
Data Source: Tax revenue data from St. Landry Parish School Board.
April 25.8% April YoY 3.3% April YTD 6.2% April 2016 2017 2018 2019 2020 April $6,277,911 $6,452,453 $6,783,548 $6,311,664 $6,518,801 March $4,790,526 $4,851,629 $4,901,561 $5,088,409 $5,181,543 % Chg over Prev Month 33.0% 38.4% 24.0% 25.8% % Chg over Prev Year 2.8% 5.1% -7.0% 3.3% YTD (Jan - Apr) $22,276,152 $23,246,777 $22,965,497 $23,610,202 $25,072,196 % Chg over Prev YTD 4.4% -1.2% 2.8% 6.2%
ST.LANDRYVEHICLESALESTAX
St. Landry Parish vehicle sales tax revenue for April with previous month, year, and YTD comparisons.
Note: April tax revenue reflects sales activity in March.
Data Source: Tax revenue data from St. Landry Parish School Board.
April 19.2% April YoY 11.4% April YTD 12.4% April 2016 2017 2018 2019 2020 April $891,016 $1,049,020 $879,480 $757,072 $843,064 March $663,730 $667,677 $730,772 $728,865 $706,995 % Chg over Prev Month 57.1% 20.3% 3.9% 19.2% % Chg over Prev Year 17.7% -16.2% -13.9% 11.4% YTD (Jan - Apr) $2,956,835 $3,321,499 $3,005,518 $2,977,610 $3,346,860 % Chg over Prev YTD 12.33% -9.51% -0.93% 12.40%
RAPIDESSALESTAX
(TR) Rapides Parish total sales tax revenue for April with previous month, year, and YTD comparisons.
(BR) Rapides Parish total monthly sales tax revenue from 2017 to present.
Note: April sales tax revenue reflects sales activity in March.
Data Source: Rapides Parish Police Jury Treasurer’s Reports.
2016 2017 2018 2019 2020 April $ 11,008,603 $12,303,146 $12,957,935 $12,371,569 $11,623,165 March $ 9,851,816 $ 9,821,434 $ 9,721,868 $10,050,046 $10,102,202 % Chg over Prev Month 25.3% 33.3% 23.1% 15.1% % Chg over Prev Year 11.8% 5.3% -4.5% -6.0% YTD (Jan - Apr) $ 41,723,587 $44,724,366 $45,801,027 $46,158,981 $46,870,723 % Chg over Prev YTD 7.2% 2.4% 0.8% 1.5% April 15.1% April YoY -6.0% April YTD 1.5% April $5 $7 $9 $11 $13 $15 Jan-17 Apr-17 Jul-17 Oct-17 Jan-18 Apr-18 Jul-18 Oct-18 Jan-19 Apr-19 Jul-19 Oct-19 Jan-20 Apr-20 Millions Rapides Parish Total Sales Tax Collections 2017 - 2020
RAPIDESVEHICLESALESTAX
(TR) Rapides Parish vehicle sales tax revenue for April with previous month, year, and YTD comparisons.
Note: April tax revenue reflects sales activity in March.
Data Source: Tax revenue data from Rapides Parish Police Jury Treasurer’s Reports.
2016 2017 2018 2019 2020 April $ 976,751 $1,196,510 $1,169,513 $1,102,630 $1,516,978 March $ 882,267 $ 842,791 $ 901,355 $ 874,535 $1,044,076 % Chg over Prev Month 42.0% 29.8% 26.1% 45.3% % Chg over Prev Year 22.5% -2.3% -5.7% 37.6% YTD (Jan - Apr) $ 3,625,035 $4,124,464 $4,073,175 $3,993,946 $4,772,678 % Chg over Prev YTD 13.8% -1.2% -1.9% 19.5%
April 45.3% April YoY 37.6% April YTD 19.5% April
RAPIDESHOTELOCCUPANCYTAX
Rapides Parish hotel occupancy tax revenue for April with previous month, year, and YTD comparisons.
Note: April tax revenue reflects hotel occupancy activity in March.
Data Source: Rapides Parish Police Jury Treasurer’s Reports.
April -26.9% April YoY -60.8% April YTD -21.1% 2017 2018 2019 2020 April $ 188,207 $ 196,377 $ 207,573 $ 81,343 March $ 130,568 $ 126,383 $ 146,322 $ 111,228 % Chg over Prev Month 44.1% 55.4% 41.9% -26.9% % Chg over Prev Year 4.3% 5.7% -60.8% YTD (Jan - Apr) $ 548,500 $ 579,597 $ 638,972 $ 504,102 % Chg over Prev YTD 5.7% 10.2% -21.1% April
HOUSING
ALEXANDRIAMSAHOUSINGMARKET
(L) The count of active single-family and condo/townhome listings for Alexandria MSA (excludes pending listings). (TR) The median number of days property listings spend on the market. (BR) The median listing price per square foot.
April 2020 = 88
April 2020 = 371


April 2020 = 101

88 90 92 94 96 98 100 102 2016-07-01 2017-03-01 2017-11-01 2018-07-01 2019-03-01 2019-11-01 Median Listing Price/SF in Alexandria July 2016 - April 2020 0 20 40 60 80 100 120 2016-07-01 2017-03-01 2017-11-01 2018-07-01 2019-03-01 2019-11-01 Median Days on Market in Alexandria July 2016 - April 2020 0 100 200 300 400 500 600 2016-07-01 2017-03-01 2017-11-01 2018-07-01 2019-03-01 2019-11-01 Active Listings Count in Alexandria July 2016 - April 2020
Data Source: Realtor.com. Retrieved from FRED, Federal Reserve Bank of St. Louis. May 15, 2020
LOUISIANA
BAKERHUGHESRIGCOUNT
Represents the number of drilling rigs actively exploring for or developing oil or natural gas in Louisiana and the U.S.


Source: Baker Hughes, https://rigcount.bakerhughes.com/na-rig-count
1-May 8-May 15-May N. LA-Land 22 22 22 S. LA –Int’l Water 0 0 0 S. LA-Land 1 1 1 S. LA-Offshore 16 15 12 TOTAL LOUISIANA 39 38 35 TOTAL US 408 374 339 0 10 20 30 40 50 60 70 0 100 200 300 400 500 600 700 800 900 3-Jan 10Jan 17Jan 24Jan 31Jan 7-Feb 14Feb 21Feb 28Feb 6Mar 13Mar 20Mar 27Mar 3-Apr9-Apr 17Apr 24Apr 1May 8May 15May US 796 781 796 794 790 790 790 791 790 793 792 772 728 664 602 529 465 408 374 339 Louisiana 58 55 54 54 52 52 52 51 50 52 47 47 44 44 43 41 40 39 38 35 Rig Count January 2020 - Present
LOUISIANAGAMINGREVENUE
Gaming revenue in Louisiana for March 2020 with previous month and year comparisons. Louisiana casinos closed March 16th and will reopen May 18th .
Data Source: Louisiana Gaming Control Board, April 2020. http://lgcb.dps.louisiana.gov/revenue_reports.html
March -51.7% March YoY -57.9% March 2020 19-Mar 20-Feb 20-Mar % Change % Change YoY Video Poker $60,847,349 $54,935,653 $32,189,300 -41.4% -47.1% Riverboat $181,281,173 $155,480,786 $72,075,616 -53.6% -60.2% Landbased $28,984,153 $26,588,129 $10,468,813 -60.6% -63.9% Slots $36,065,509 $30,384,134 $14,545,405 -52.1% -59.7% Total $307,178,184 $267,388,702 $129,279,134 -51.7% -57.9%
SMALLBUSINESSPULSESURVEY
In April, the US Census initiated a survey to track the pulse of small businesses during the COVID-19 pandemic. Initial results for the April 26 – May 2 period are shown.
Forty-five percent of small businesses in Louisiana said COVID-19 had a large negative impact on their business compared to 51% nationwide. Louisiana small businesses were more optimistic on recovery time and received more assistance from the Payroll Projection Program than the national average.
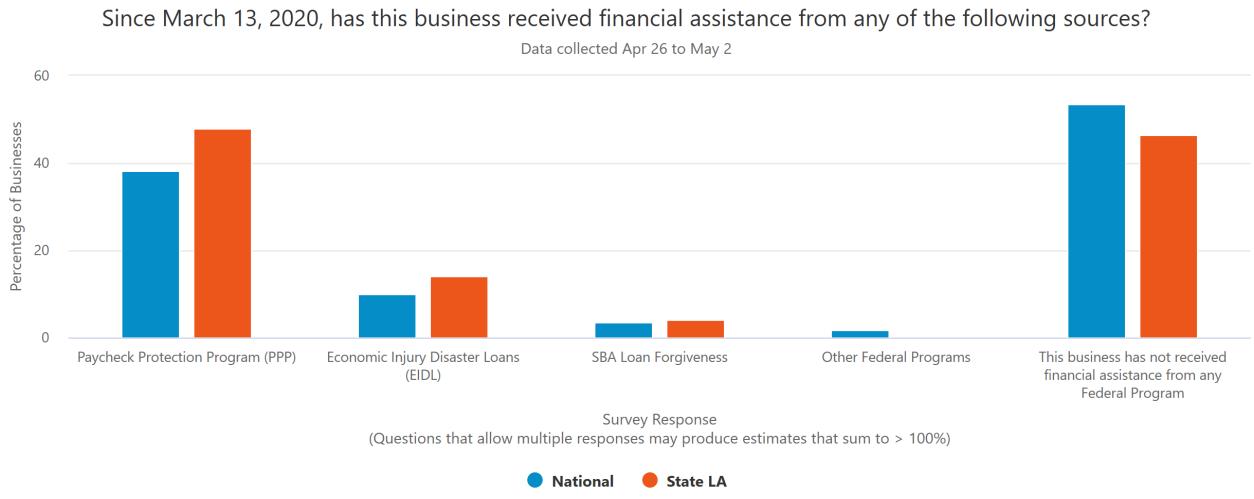
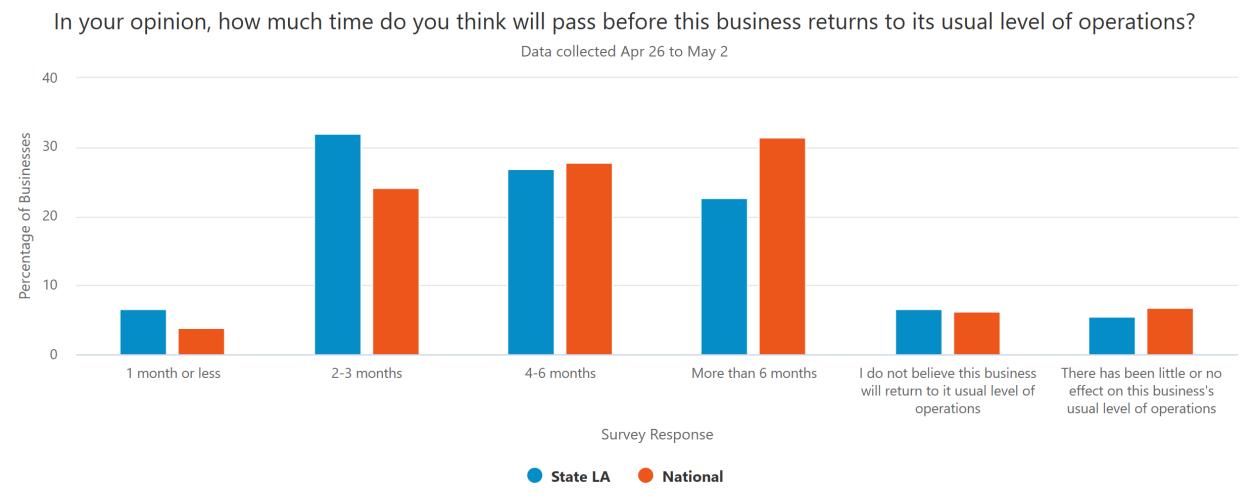
Source: U.S. Census Bureau,
LA US Recovery time < 1 month 6.6% 3.9% Recovery time 2-3 months 31.9% 24.1% Received PPP assistance 47.8% 38.1%
https://www.census.gov/data/experimental-data-products/small-business-pulse-survey.html
NATIONAL
NATIONALECONOMICINDICATORS
Monthly U.S. economic indicators for March 2020.
Data Source: U.S. Census, https://www.census.gov/economic-indicators/.
Indicator Mar-20 Feb-20 Monthly Wholesale Trade -0.8% -0.7% Manufacturers Shipments, Inventories, and Orders -10.3% -0.1% Construction Spending 0.9% -2.5% Advance Monthly Wholesale Inventories -1.0% -0.6% Advance Montly Retail Inventories 0.9% -0.4% Advance Durable Goods Manf. Shipments, Inventories, and Orders -14.4% 1.1% New Residential Sales -15.4% -4.6% New Residential Construction -22.3% -3.4% Advance Monthly Sales for Retail and Food Services -8.7% -0.4% Durable Goods -14.4% Residential Sales -15.4% Residential Construction -22.3%
ADVANCEMONTHLYRETAILINDICATORS
Data Source: U.S. Census, https://www.census.gov/retail/marts/www/marts_current.xls
20 Advance Retail Indicators Percent Change from Mar-20 Percent Change from Apr-19 Retail & Food Services -16% -22% Motor Vehicles & Parts -12% -33% Furniture -59% -67% Electronics & Applicances -61% -65% Building Materials -4% 0.4% Grocery Stores -13% 13% Gasoline Stations -29% -43% Sporting Goods -38% -49% Nonstore Retailers 8% 22%
April
Advance monthly U.S. retail indicators for April 2020.
THANKYOU
The data presented throughout the CENLA Economic Dashboard reflects contributions from the following local organizations.
• Rapides Parish Policy Jury Treasurer
• RapidesArea Planning Commission
• City ofAlexandria Planning Division
• Avoyelles Parish School Board
• St. Landry Parish School Board
• Evangeline Parish Sales Tax Commissioner
• Louisiana Workforce Commission
Also, special thanks to the following partners for distributing the dashboard to its members.
Next Issue: Week of June 1st
• LSUAFoundation
• Central Louisiana Regional Chamber of Commerce
• Marksville Chamber of Commerce