CENLA ECONOMIC DASHBOARD
May 1, 2020.
Dr.RandallDupont Dean,CollegeofBusiness
LouisianaStateUniversityofAlexandria
rdupont@lsua.edu

CONTENTS
May 1, 2020
• Social Distancing Scoreboard
• COVID-19 Cases in CENLA
• COVID-19 Cases in Louisiana
• COVID-19 Onset of Symptoms
• COVID-19 Impact Planning Report
• Local Unemployment Rate
• Initial Unemployment Claims by Industry
• Initial Unemployment Claims in Cenla
• Initial Unemployment Claims by Parish
• Total Unemployment Claims in Louisiana
• Rapides Parish Sales Tax
• City ofAlexandria Sales Tax

• City of Pineville Sales Tax
• Rapides Vehicle Sales Tax
• Rapides Hotel Occupancy Tax
• Alexandria Occupational License Tax
• Pineville Occupational License Tax
• Rapides Parish Occupational License Tax
• RapidesArea Permits Issued
• RapidesArea Permits Valuation
• RapidesArea New Residential Permits
• RapidesArea New Commercial Permits
• City ofAlexandria Permits
KEYTAKEAWAYS
May 1, 2020 CENLA Economic Dashboard
• Rapides Parish’s grade of D on the social distancing scoreboard means increased mobility in the area.
• The unemployment rate in Rapides increased to 6.1% in March from 4.4% in February.
• Health care workers filed 12% of initial unemployment claims, second toAccommodation and Food workers.
• Weekly initial unemployment claims reached new pandemic era highs in Allen, Catahoula, Concordia, Evangeline, and St. Landry, but continued a downward trend in Rapides,Avoyelles, and Vernon.
• Louisiana paid more in unemployment compensation in the last four weeks than in all of last year.
• Rapides Parish sales tax revenue increased 15% inApril over March and is up 1.5% for the year.
• Rapides Parish vehicle tax revenue increased 45% inApril over March and is up 19% for the year.
• Rapides Parish hotel occupancy tax decreased 27% inApril over March and is down 21% for the year.
• The value of current Rapides area permits is up 14.2% to $8.6 million.
• The value of Rapides Parish new residential construction is up 20% since March 1, compared to last year.
• $2.9 million in permits were issued for new commercial construction in Rapides Parish since March 1.
• The value ofAlexandria building permits is up 181% with new residential construction up 67% since March 1.
COVID-19
SOCIALDISTANCINGSCOREBOARD
Represents the change in the number of potential human encounters. Higher grades represent less mobility, while lower grades represent increased mobility.
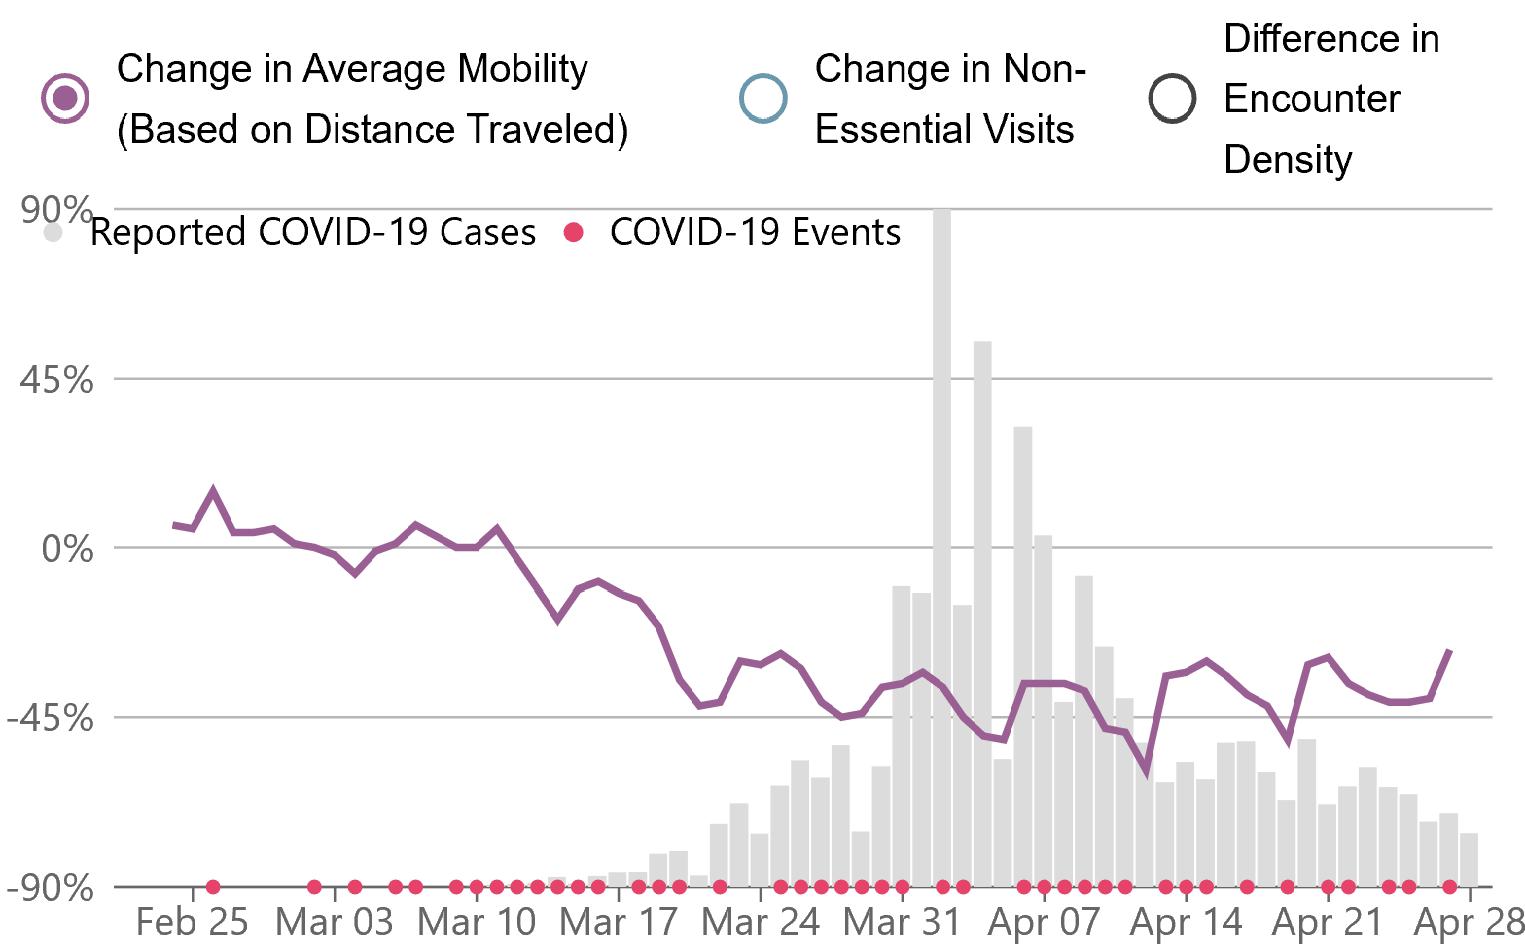
Rapides Parish
Feb. 25 – Apr 26, 2020
Source: Unacast.com, Social Distancing Scoreboard, https://www.unacast.com/covid19/social-distancing-scoreboard
4-Apr 16-Apr 26-Apr Allen D C- D Avoyelles D D C Catahoula C C- D+ Concordia D D C Evangeline D D+ D+ Grant B B- D+ LaSalle D D BRapides B D D St. Landry D D- F Vernon C D D
COVID-19CASESINCENLA
(L) Cases per 1,000 population as of April 26.
(R) Cumulative cases by parish
COVID-19 Cases by Parish
March 19 - April 26, 2020
Source: Data from New York Times and US Census 2019 Population Estimate 0 50 100 150 200 250 300 3/19/2020 3/20/2020 3/21/2020 3/22/2020 3/23/2020 3/24/2020 3/25/2020 3/26/2020 3/27/2020 3/28/2020 3/29/2020 3/30/2020 3/31/2020 4/1/2020 4/2/2020 4/3/2020 4/4/2020 4/5/2020 4/6/2020 4/7/2020 4/8/2020 4/9/2020 4/10/2020 4/11/2020 4/12/2020 4/13/2020 4/14/2020 4/15/2020 4/16/2020 4/17/2020 4/18/2020 4/19/2020 4/20/2020 4/21/2020 4/22/2020 4/23/2020 4/24/2020 4/25/2020 4/26/2020
Rapides Avoyelles Evangeline St Landry Allen Grant Catahoula Concordia LaSalle Parish Cases / 1000 Allen 3.20 Avoyelles 1.72 Catahoula 2.63 Concordia 1.56 Evangeline 1.35 Grant 0.49 LaSalle 1.28 Rapides 1.91 St Landry 1.97
COVID-19CASESINLOUISIANA
(L) Jefferson and Orleans parishes are bending the curve.
(R) Daily new cases and deaths in Louisiana.


COVID-19 Daily New Cases & Deaths in Louisiana
March 9 - April 26, 2020
March 9 - April 26, 2020
Source: Data from New York Times and US Census 2019 Population Estimate 0 500 1,000 1,500 2,000 2,500 3,000 3/9/2020 3/11/2020 3/13/2020 3/15/2020 3/17/2020 3/19/2020 3/21/2020 3/23/2020 3/25/2020 3/27/2020 3/29/2020 3/31/2020 4/2/2020 4/4/2020 4/6/2020 4/8/2020 4/10/2020 4/12/2020 4/14/2020 4/16/2020 4/18/2020 4/20/2020 4/22/2020 4/24/2020 4/26/2020 0 20 40 60 80 100 120 140 Daily New Cases Daily New Deaths
New Deaths New Cases 0 1000 2000 3000 4000 5000 6000 7000 3/9/2020 3/11/2020 3/13/2020 3/15/2020 3/17/2020 3/19/2020 3/21/2020 3/23/2020 3/25/2020 3/27/2020 3/29/2020 3/31/2020 4/2/2020 4/4/2020 4/6/2020 4/8/2020 4/10/2020 4/12/2020 4/14/2020 4/16/2020 4/18/2020 4/20/2020 4/22/2020 4/24/2020 4/26/2020 Jefferson and Orleans Parishes
Jefferson Orleans
COVID-19ONSETOFSYMPTOMS
Date of Onset of Symptoms for Cases and Deaths.
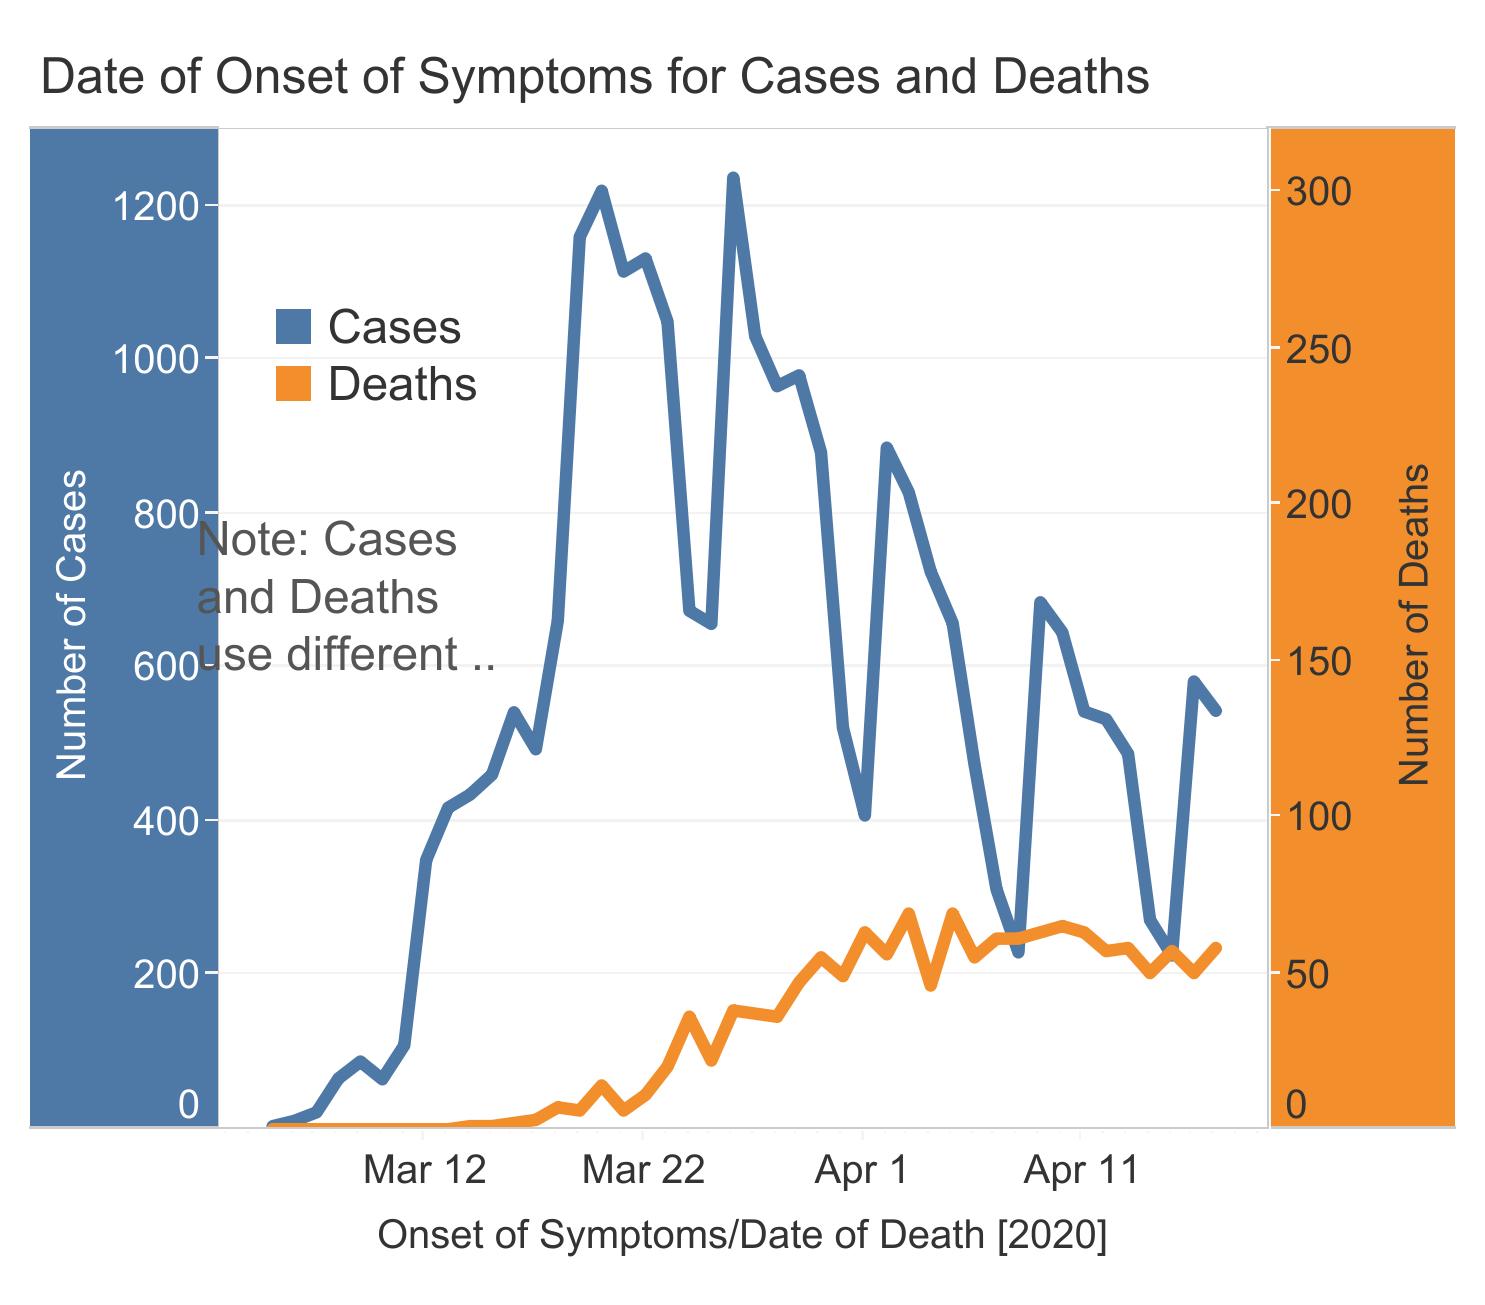
Source: Graph and data from Louisiana Department of Public Health
COVID-19IMPACTPLANNINGREPORT
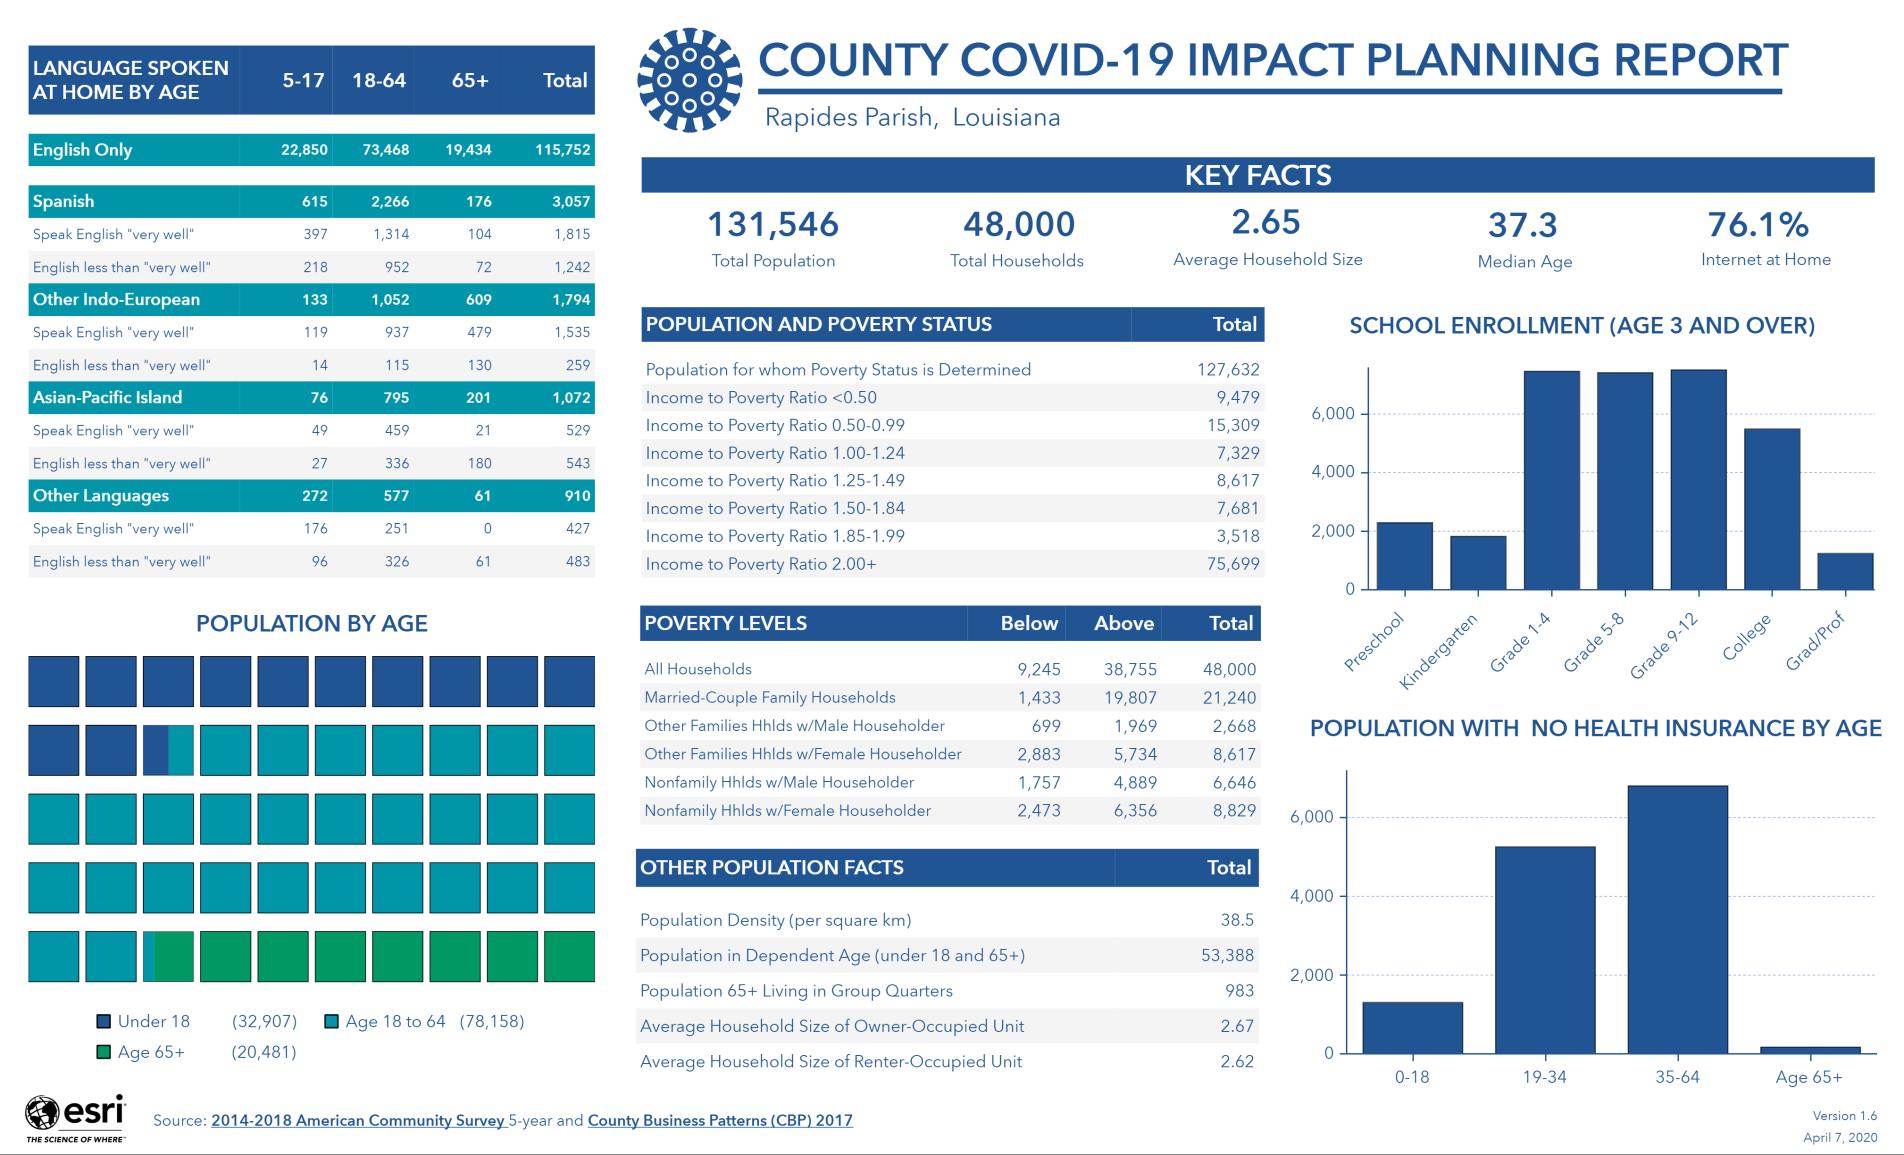
Published by the U.S. Census Bureau to provide demographic and economic analysis by parish.
Source: U.S. Census Bureau, https://covid19.census.gov/
UNEMPLOYMENT
LOCALUNEMPLOYMENTRATE
(L) Unemployment rate by parish and
(R) Unemployment rate by metro area.
• Rapides Parish unemployment rate increased from 4.4% in February to 6.1% in March, while the rate for Alexandria increased from 4.5% to 6.3%.
Source: Louisiana Workforce Commission,April 23, 2020
Mar-19 Feb-20 Mar-20 Louisiana 4.1% 4.3% 6.1% Allen Parish 4.8% 5.6% 7.4% Avoyelles Parish 4.7% 5.2% 7.4% Catahoula Parish 5.6% 5.5% 7.4% Concordia Parish 5.8% 6.2% 8.3% Evangeline Parish 5.0% 5.2% 7.2% Grant Parish 4.7% 5.4% 7.4% La Salle Parish 3.6% 3.7% 5.4% Rapides Parish 4.4% 4.4% 6.1% St. Landry Parish 5.4% 5.8% 7.9% Vernon Parish 5.3% 6.1% 9.0% Unemployment Rate in Cenla March 2020 Mar-19 Feb-20 Mar-20 Louisiana 4.1% 4.3% 6.1% Alexandria MSA 4.4% 4.5% 6.3% Baton Rouge MSA 3.6% 3.8% 5.4% Hammond MSA 4.7% 4.7% 6.8% Houma-Thibodaux MSA 4.0% 3.9% 5.7% Lafayette MSA 4.1% 4.3% 6.1% Lake Charles MSA 3.4% 4.0% 5.6% Monroe MSA 4.7% 5.0% 6.9% New Orleans-Metairie MSA 3.8% 3.9% 5.6% Shreveport-Bossier City MSA 4.4% 4.6% 6.4% Unemployment Rate by MSA March 2020
INITIALUNEMPLOYMENTCLAIMSBYINDUSTRY
(L) Cumulative initial unemployment claims by industry in Louisiana
(R) Initial claims in by industry and week of filing.
Cumulative Initial Unemployment Claims by Industry
March 21 – April 18, 2020
Initial Unemployment Claims by Industry and Week of Filing
March 21 - April 18
The above industries in Louisiana account for 74% of initial unemployment claims statewide, but 59% of employment.
Data Source: Louisiana Workforce Commission,April 25, 2020
Layoffs peaked at different times in various industries. Accommodation and food services in the first week. Health care, retail, and construction in third week.
Industry Total Percent Accomodation & Food Services 101,582 22.9% Health Care and Social Assistence 53,129 12.0% Retail Trade 52,567 11.9% Construction 37,549 8.5% Other Services 33,351 7.5% Administrative Services 26,782 6.0% Arts, Entertainment & Recreation 21,212 4.8%5,000 10,000 15,000 20,000 25,000 30,000 35,000 Accom & Food Sev Health Care Retail Trade Construction Other Services Administrative Serv Arts, Enter & Rec
21-Mar 28-Mar 4-Apr 11-Apr 18-Apr
INITIALUNEMPLOYMENT CLAIMSINCENLA
(L) Initial unemployment claims by parish and week
(R) Total initial unemployment claims in Cenla.
• Initial unemployment claims the week ofApril 18 in Cenla fell just short of theApril 4 high mark.
Source: Louisiana Workforce Commission,April 23, 2020
Mar 14 Mar 21 Mar 28 Apr 4 Apr 11 Apr 18 Total 148 3,240 5,571 5,843 4,657 5,7471,000 2,000 3,000 4,000 5,000 6,000 7,000 Total Unemployment Weekly Initial Claims in Cenla March 7 - April 18, 2020 14-Mar 21-Mar 28-Mar 4-Apr 11-Apr 18-Apr Total Allen 8 104 205 421 431 683 1,852 Avoyelles 14 707 618 467 412 491 2,709 Catahoula 3 22 87 95 83 135 425 Concordia 6 72 161 175 133 190 737 Evangeline 11 138 253 379 298 386 1,465 Grant 5 119 213 209 172 177 895 La Salle 10 195 329 351 293 339 1,517 Rapides 35 990 1,924 1,828 1,371 1,541 7,689 St. Landry 37 652 1,293 1,395 1,071 1,437 5,885 Vernon 19 241 488 523 393 368 2,032 Total 148 3,240 5,571 5,843 4,657 5,747 25,206
INITIALUNEMPLOYMENTCLAIMSBYPARISH
Snapshot of weekly initial claims filed March 14 through April 18, 2020 by parish.
• New highs in weekly initial unemployment were reached in Allen, Catahoula, Concordia, Evangeline, and St. Landry since March 14. • Rapides,Avoyelles, and Vernon continue downward trend.
Source: Louisiana Workforce Commission,April 23, 2020
200 400 600 800 1,000 1,200 1,400 1,600 1,800 2,000
Unemployment
March 7 - April 18, 2020 14-Mar 21-Mar 28-Mar 4-Apr 11-Apr 18-Apr
Allen Avoyelles Catahoula Concordia Evangeline Grant La Salle Rapides St. Landry Vernon
Compensation Weekly Initial Claims by Cenla Parish
TOTALUNEMPLOYMENTCLAIMSINLOUISIANA
(L) YTD claims paid statewide with 2019 comparison
(R) Initial and continued unemployment claims in Louisiana
Louisiana Initial Unemployment Claims and Pay Out
Feb 8 - Apr 18, 2020


• Since March 22, 2020, the Louisiana Workforce Commission has paid out $561,358,411 in total benefits to over 302,000 Louisianians whose employment has been impacted byCOVID-19.
• For comparison, in all of 2019, LWC paid a total of $151,781,786 for 103,000 claimants.
Source: Louisiana Workforce Commission,April 23, 2020
43897 43904 43911 43918 43925 43932 43939 Initial 1704 2262 72474 97472 102267 79760 92026 Continued 14254 14041 14208 58088 120810 217640 264430 0 50000 100000 150000 200000 250000 300000 0 20000 40000 60000 80000 100000 120000 Initial Claims
TAXREVENUE
RAPIDESPARISHSALESTAX
(TR) Rapides Parish total sales tax revenue for April with previous month, year, and YTD comparisons.
(BR) Rapides Parish total monthly sales tax revenue from 2017 to present.
Note: April sales tax revenue reflects sales activity in March.
Data Source: Rapides Parish Police Jury Treasurer’s Reports.
2016 2017 2018 2019 2020 April $ 11,008,603 $12,303,146 $12,957,935 $12,371,569 $11,623,165 March $ 9,851,816 $ 9,821,434 $ 9,721,868 $10,050,046 $10,102,202 % Chg over Prev Month 25.3% 33.3% 23.1% 15.1% % Chg over Prev Year 11.8% 5.3% -4.5% -6.0% YTD (Jan - Apr) $ 41,723,587 $44,724,366 $45,801,027 $46,158,981 $46,870,723 % Chg over Prev YTD 7.2% 2.4% 0.8% 1.5% April 15.1% April YoY -6.0% April YTD 1.5% April $5 $7 $9 $11 $13 $15 Jan-17 Apr-17 Jul-17 Oct-17 Jan-18 Apr-18 Jul-18 Oct-18 Jan-19 Apr-19 Jul-19 Oct-19 Jan-20 Apr-20 Millions Rapides Parish Total Sales Tax Collections 2017 - 2020
ALEXANDRIASALESTAX
(TR) Alexandria sales tax revenue for April with previous month, year, and YTD comparisons.
(BR) Alexandria monthly sales tax revenue from 2017 to present.

Note: April sales tax revenue reflects sales activity in March.
Data Source: Rapides Parish Police Jury Treasurer’s Reports.
April 7.5% April YoY -15.9% April YTD -3.3% 2017 2018 2019 2020 April $ 3,530,570 $ 3,753,388 $ 3,652,420 $ 3,071,113 March $ 2,915,659 $ 2,825,914 $ 2,924,817 $ 2,856,687 % Chg over Prev Month 21.1% 32.8% 24.9% 7.5% % Chg over Prev Year 6.3% -2.7% -15.9% YTD (Jan - Apr) $13,148,133 $13,673,285 $13,586,853 $13,140,523 % Chg over Prev YTD 4.0% -0.6% -3.3% April $2.0 $2.5 $3.0 $3.5 $4.0 $4.5 Jan-17 Apr-17 Jul-17 Oct-17 Jan-18 Apr-18 Jul-18 Oct-18 Jan-19 Apr-19 Jul-19 Oct-19 Jan-20 Apr-20 Millions Alexandria Sales Tax Revenue 2017 - 2020
PINEVILLESALESTAX
(RR) Pineville sales tax revenue for April with previous month, year, and YTD comparisons.
(BR) Pineville monthly sales tax revenue from 2017 to present.

Note: April sales tax revenue reflects sales activity in March.
Data Source: Rapides Parish Police Jury Treasurer’s Reports.
April 23.5% April YoY 2.7% April YTD 9.6% 2017 2018 2019 2020 April $ 981,715 $ 1,148,478 $ 994,888 $ 1,022,196 March $ 779,665 $ 806,993 $ 788,436 $ 827,925 % Chg over Prev Month 25.9% 42.3% 26.2% 23.5% % Chg over Prev Year 17.0% -13.4% 2.7% YTD (Jan - Apr) $ 3,527,550 $ 3,787,178 $ 3,605,910 $ 3,952,811 % Chg over Prev YTD 7.4% -4.8% 9.6% April $0.6 $0.7 $0.8 $0.9 $1.0 $1.1 $1.2 Millions Pineville Sales Tax Revenue 2017 - 2020
RAPIDESVEHICLESALESTAX
(TR) Rapides Parish vehicle sales tax revenue for April with previous month, year, and YTD comparisons.
(BR) State and national vehicle unit sales comparison.
Note: April tax revenue reflects sales activity in March.
Data Source: Tax revenue data from Rapides Parish Police Jury Treasurer’s Reports and vehicle sales from FourEyes.
2016 2017 2018 2019 2020 April $ 976,751 $1,196,510 $1,169,513 $1,102,630 $1,516,978 March $ 882,267 $ 842,791 $ 901,355 $ 874,535 $1,044,076 % Chg over Prev Month 42.0% 29.8% 26.1% 45.3% % Chg over Prev Year 22.5% -2.3% -5.7% 37.6% YTD (Jan - Apr) $ 3,625,035 $4,124,464 $4,073,175 $3,993,946 $4,772,678 % Chg over Prev YTD 13.8% -1.2% -1.9% 19.5% Period Louisiana National Past 27 days compared to prior 27 4/1-27/20 vs 3/5-31/20 -1% -17%
April 45.3% April YoY 37.6% April YTD 19.5% April Vehicle Sales
RAPIDESHOTELOCCUPANCYTAX
Rapides Parish hotel occupancy tax revenue for April with previous month, year, and YTD comparisons.
Note: April tax revenue reflects hotel occupancy activity in March.
Data Source: Rapides Parish Police Jury Treasurer’s Reports.
April -26.9% April YoY -60.8% April YTD -21.1% 2017 2018 2019 2020 April $ 188,207 $ 196,377 $ 207,573 $ 81,343 March $ 130,568 $ 126,383 $ 146,322 $ 111,228 % Chg over Prev Month 44.1% 55.4% 41.9% -26.9% % Chg over Prev Year 4.3% 5.7% -60.8% YTD (Jan - Apr) $ 548,500 $ 579,597 $ 638,972 $ 504,102 % Chg over Prev YTD 5.7% 10.2% -21.1% April
ALEXANDRIAOCCUPATIONALLICENSETAX
Alexandria occupational license tax revenue for April with previous month, year, and YTD comparisons.
Note: April tax revenue reflects activity in March.
Data Source: Rapides Parish Police Jury Treasurer’s Reports.
April -15.6% April YoY 8.9% April YTD -0.8% 2019 2020 April $ 70,168 $ 59,195 March $ 554,581 $ 604,137 % Chg over Prev Month -87.3% -90.2% % Chg over Prev Year 8.9% YTD (Jan - Apr) $ 1,801,342 $ 1,787,079 % Chg over Prev YTD -0.8%
April
PINEVILLEOCCUPATIONALLICENSETAX
Pineville occupational license tax revenue for April with previous month, year, and YTD comparisons.
Note: April tax revenue reflects activity in March.
Data Source: Rapides Parish Police Jury Treasurer’s Reports.
April -91.9% April YoY -4.0% April YTD 6.3% 2019 2020 April $ 10,353 $ 9,941 March $133,884 $122,870 % Chg over Prev Month -92.3% -91.9% % Chg over Prev Year -4.0% YTD (Jan - Apr) $392,621 $417,177 % Chg over Prev YTD 6.3% April
RAPIDESPARISHOCCUPATIONALLICENSETAX
Occupational license tax revenue for Rapides Parish (includingAlexandria and Pineville) for April with previous month, year, and YTD comparisons.
Note: April tax revenue reflects activity in March.
Data Source: Rapides Parish Police Jury Treasurer’s Reports.
April -91.0% April YoY -16.6% April YTD -0.7% 2019 2020 April $ 106,921 $ 89,174 March $ 951,957 $ 987,384 % Chg over Prev Month -88.8% -91.0% % Chg over Prev Year -16.6% YTD (Jan - Apr) $ 2,871,583 $ 2,851,121 % Chg over Prev YTD -0.7% April
BUILDINGPERMITS
RAPIDESAREAPERMITSISSUED
Total number of permits issued by RPAC between March 1 – April 22, 2017-2020 in major jurisdictions.
Total RPAC permits issued between Mar 1–Apr 22, 2020 compared to same period in 2019
-8.4%
Note: Avoyelles Parish data not included until 2019. City ofAlexandria permits are accounted separately.
Data Source: RapidesArea Planning Commission.
Allen Avoyelles Catahoula Pineville Evangeline LaSalle Rapides Parish Police Jury 2017 35 3 34 196 44 385 2018 19 29 227 40 360 2019 16 344 48 215 39 337 2020 22 351 2 32 167 36 305 0 50 100 150 200 250 300 350 400 450 Total Number Permits Issued March 1 - April 22 2017 - 2020 2017 2018 2019 2020
RAPIDESAREAPERMITVALUATIONS
Total valuation (estimated cost of development) of permits issued by RPAC for major jurisdictions between March 1 – April 22, 2017-2020.
Total Valuation of Permits Issued
1 - April 22
- 2022
Valuation of developments between Mar 1–Apr 22, 2020 compared to same period in 2019
14.2%
Note: Avoyelles Parish data not included until 2019. City ofAlexandria permits are accounted separately.
Data Source: RapidesArea Planning Commission.
Allen Avoyelles Catahoula Pineville Evangeline LaSalle Rapides Parish Police Jury 2017 $687,000 $525,000 $2,979,341 $4,327,943 $3,417,000 $11,029,574 2018 $636,788 $866,772 $550,000 $6,727,280 2019 $291,939 $11,099,777 $1,327,940 $1,931,496 $302,000 $4,919,833 2020 $1,656,000 $7,313,929 $225,000 $1,690,000 $2,636,592 $580,000 $8,601,450 $$2,000,000 $4,000,000 $6,000,000 $8,000,000 $10,000,000 $12,000,000
March
2017
2017 2018 2019 2020
RAPIDESAREANEWRESIDENTIALPERMITS
New residential construction permits issued by Rapides Area Planning Commission and related valuations (estimated development cost) by jurisdiction between March 1–April 22 for 2017-2020.
New Residential Construction Permits Issued
March 1 – April 22
2017 - 2020
Value of new residential construction in Rapides Parish from March 1 –April 22 compared to same period last year. 20%
Note: Avoyelles Parish data not included until 2019. City ofAlexandria permits are accounted separately.
Data Source: RapidesArea Planning Commission.
Jurisdiction 2017 2018 2019 2020 2017 2018 2019 2020 Allen 5 1 3 5 $ 672,000 $ 284,145 $ 1,656,000 Avoyelles 10 14 $ 1,714,599 $ 2,847,714 Catahoula 3 1 $ 525,000 $ 225,000 Pineville 8 5 $ 601,788 $ 825,000 Evangeline 3 9 9 6 $ 755,000 $ 600,272 $ 1,705,133 $ 2,254,364 LaSalle 6 1 1 1 $ 3,417,000 $ 400,000 $ 302,000 $ 125,000 Rapides Parish Police Jury 30 27 13 14 $ 6,167,630 $ 5,824,460 $ 2,994,959 $ 3,592,000 Valuation of New Residential Construction March 1 – April 22 2017 - 2020
RAPIDESAREANEWCOMMERCIALPERMITS
New commercial construction permits issued by the Rapides Area Planning Commission and related valuations (estimated development cost) by jurisdiction between March 1–April 22 for 2017-2020.
New Commercial Construction Permits Issued
March 1 – April 22
2017 - 2020
Valuation of New Commercial Construction
March 1 – April 22
2017 - 2020
Value of new commercial construction in Rapides Parish between March 1 –April 22.
$2,950,450
Note: Avoyelles Parish data not included until 2019. City ofAlexandria permits are accounted separately.
Data Source: RapidesArea Planning Commission.
Jurisdiction 2017 2018 2019 2020 2017 2018 2019 2020 Pineville 3 1 1 $ 457,000 $ 800,000 $ 680,000 Evangeline 1 1 $ 858,000 $ 163,000 LaSalle 1 $ 150,000 Rapides Parish Police Jury 3 2 4 $ 143,500 $ 310,000 $ 2,950,450
CITYOFALEXANDRIAPERMITS
Commercial, residential, and total construction permits issued by the City of Alexandria Planning Division and related valuations (estimated development cost) for the period March 1– April 28, 2019 and 2020.
Data Source: City ofAlexandria Planning Division. 2019 Permits Issued Valuation 2020 Permits Issued Valuation Commercial - Total 23 $ 2,088,631 19 $ 10,278,349 Commercial Construction - Existing 13 $ 1,168,727 6 $ 1,604,699 Commercial Construction - New 5 $ 229,810 8 $ 8,295,000 Residential - Total 96 $ 2,715,428 30 $ 3,572,408 Residential Construction - Existing 26 $ 220,848 5 $ 195,733 Residential Construction - New 9 $ 1,797,000 11 $ 3,009,997 Total All Permits 277 $ 4,950,315 99 $ 13,910,757 Total valuation of all permits in the 2020 period compared to 2019. 181% New residential construction valuation 67%
THANKYOU
The data presented throughout the CENLA Economic Dashboard reflects contributions from the following organizations.
• Rapides Parish Policy Jury Treasurer
• RapidesArea Planning Commission
• City ofAlexandria Planning Division
• Louisiana Workforce Commission
Also, special thanks to the following partners for distributing the dashboard to its members.
• LSUAFoundation
• Central Louisiana Regional Chamber of Commerce
• Marksville Chamber of Commerce
Next Issue: Week of May 18th .