CENLA ECONOMIC DASHBOARD
April 20, 2020.
Dr.RandallDupont CollegeofBusiness
LouisianaStateUniversityofAlexandria
rdupont@lsua.edu

SOCIALDISTANCINGSCOREBOARD
Represents the change in the number of potential human encounters. Higher grades represent less mobility, while lower grades represent increased mobility.
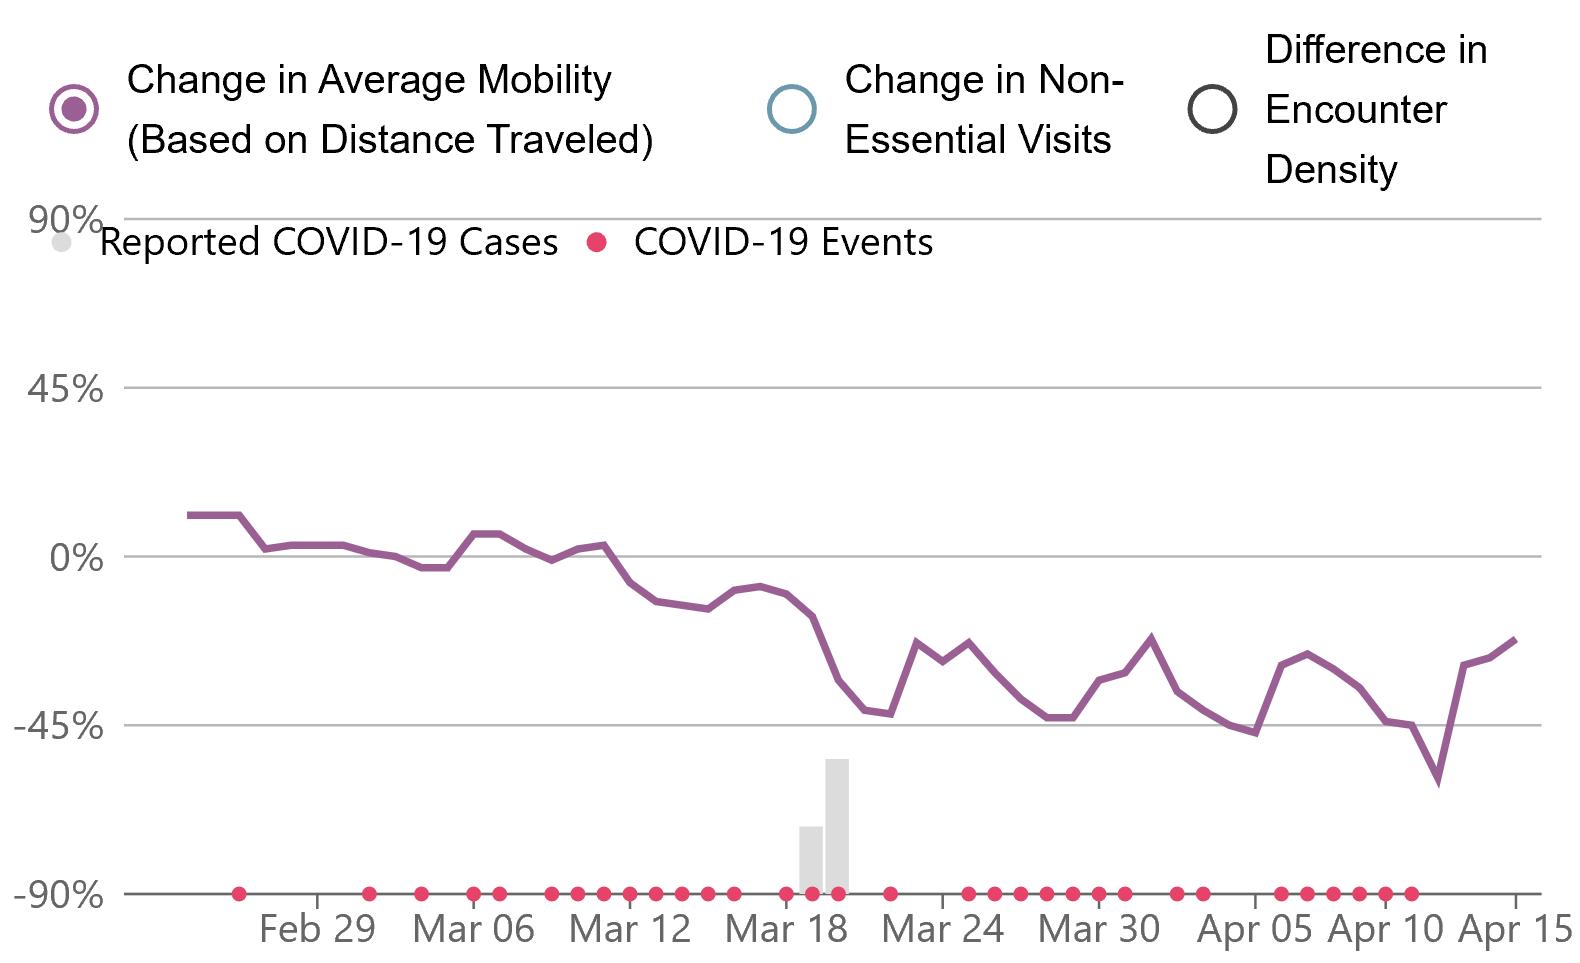
Rapides Parish
Feb. 25 – Apr 16, 2020
Source: Unacast.com, Social Distancing Scoreboard, https://www.unacast.com/covid19/social-distancing-scoreboard

4-Apr 16-Apr Allen D CAvoyelles D D Catahoula C CConcordia D D Evangeline D D+ Grant B BLaSalle D D Rapides B D St. Landry D D-
COVID-19COMMUNITYMOBILITYREPORT
Represents how visits and length of stay at different places changed on March 29 and April 11 relative to a February 16, 2020 baseline.
as of March 29, 2020 and April 11, 2020 Retail & Transportation Grocery and Pharmacy Workplace 29-Mar 11-Apr 29-Mar 11-Apr 29-Mar 11-Apr Louisiana -45% -45% -16% -2% -35% -36% Allen -34% -35% -19% -10% -33% -38% Avoyelles -24% -16% -8% 5% -32% -27% Catahoula -64% -64% -20% -24% -38% -44% Concordia -23% -24% -16% -16% -20% -30% Evangeline -16% -36% -4% 1% -25% -28% Grant - - -13% 17% -20% -20% LaSalle -27% -36% -9% 2% -31% -41% Rapides -40% -39% -15% 0% -30% -27% St. Landry -28% 38% -16% 20% -28% -26%
Source: Google Mobility Change Report
COVID-19CASESINCENLA
(L) Cases per 1000 population and (R) Cumulative cases by parish
COVID-19 Cases by Parish


March 19 - April 18, 2020
Source: Data from New York Times and US Census 2019 Population Estimate 0 50 100 150 200 250 3/19/2020 3/20/2020 3/21/2020 3/22/2020 3/23/2020 3/24/2020 3/25/2020 3/26/2020 3/27/2020 3/28/2020 3/29/2020 3/30/2020 3/31/2020 4/1/2020 4/2/2020 4/3/2020 4/4/2020 4/5/2020 4/6/2020 4/7/2020 4/8/2020 4/9/2020 4/10/2020 4/11/2020 4/12/2020 4/13/2020 4/14/2020 4/15/2020 4/16/2020 4/17/2020 4/18/2020
Rapides Avoyelles Evangeline St Landry Allen Grant Catahoula Concordia LaSalle Parish Cases / 1000 Allen 3.08 Avoyelles 1.69 Catahoula 2.42 Concordia 1.30 Evangeline 1.29 Grant 0.54 LaSalle 0.87 Rapides 1.55 St Landry 1.61
COVID-19CASESINLOUISIANA


Cases per 1000 population
(R)
new cases and deaths
Louisiana. Source: Data from New York Times and US Census 2019 Population Estimate Parish Cases / 1000 Allen 3.08 Avoyelles 1.69 Catahoula 2.42 Concordia 1.30 Evangeline 1.29 Grant 0.54 LaSalle 0.87 Rapides 1.55 St Landry 1.61 0 500 1,000 1,500 2,000 2,500 3,000 0 20 40 60 80 100 120 140 Daily New Cases Daily New Deaths
Daily New Cases & Deaths
Louisiana March 9 - April 18, 2020 New Deaths New Cases 12 days
(L)
and
Daily
in
COVID-19
in
UNEMPLOYMENTCLAIMS

(L) Trend in initial unemployment claims by parish and (R) Initial and continued claims statewide.
• Louisiana had 79,760 initial claims filed the week of April 11, in addition to 217,640 continuing claims.
Source: Louisiana Workforce Commission,April 16, 2020
14-Mar 21-Mar 28-Mar 4-Apr 11-Apr Total Allen 8 104 205 421 431 1,169 Avoyelles 14 707 618 467 412 2,218 Catahoula 3 22 87 95 83 290 Concordia 6 72 161 175 133 547 Evangeline 11 138 253 379 298 1,079 Grant 5 119 213 209 172 718 La Salle 10 195 329 351 293 1,178 Rapides 35 990 1,924 1,828 1,371 6,148 St. Landry 37 652 1,293 1,395 1,071 4,448 Total 129 2,999 5,083 5,320 4,264 17,7951,000 2,000 3,000 4,000 5,000 6,000 Total Unemployment Compensation Weekly Initial Claims in Cenla March 7 - April 11, 2020 7-Mar 14-Mar 21-Mar 28-Mar 4-Apr 11-Apr 0 20,000 40,000 60,000 80,000 100,000 120,000 2/8 2/15 2/22 2/29 3/7 3/14 3/21 3/28 4/4 4/11 Louisiana Initial Unemployment Claims Feb 8 - Apr 11
UNEMPLOYMENTCLAIMSINCENLA
Snapshot of weekly initial claims filed March 7 through April 11, 2020 by parish.
Source: Louisiana Workforce Commission,April 17, 2020
200 400 600 800 1,000 1,200 1,400 1,600 1,800 2,000 Allen
Catahoula
March 7
April 11 7-Mar 14-Mar 21-Mar 28-Mar 4-Apr 11-Apr
Avoyelles
Concordia Evangeline Grant La Salle Rapides St. Landry Unemployment Compensation Weekly Initial Claims by Parish
-
•
New unemployment claims appear to have peaked in most Cenla parishes.
LIKELYIMPACTONMETROAREAS
MSAs high in “at risk” industries are most vulnerable.
• “At Risk” industries included mining/oil and gas, transportation, employment services, travel arrangements, and leisure and hospitality.
• Alexandria ranked the least vulnerable in Louisiana and one of the least vulnerable in the nation.
The Brookings Institution analyzed 380 metropolitan areas to determine those MSAs most likely to be hardest hit by COVID-19. Louisiana metro areas are listed below with the corresponding national ranking. Source: The Brookings Institution, Retrieved
National Rank Metro (MSA) Jobs Share of metro jobs 8 Houma-Thibodaux 24,560 29% 19 New Orleans-Metairie 127,618 23% 31 Lafayette 40,981 21% 35 Shreveport-Bossier City 33,259 20% 116 Lake Charles 19,035 17% 218 Hammond 6,593 15% 287 Baton Rouge 55,099 14% 308 Monroe 10,945 13% 350 Alexandria 7,399 12%
April 17, 2020
Employment in high risk industries
RAPIDESPARISHSALESTAX
(TR) Rapides Parish total sales tax revenue for March with previous month, year, and YTD comparisons.
(BR) Rapides Parish total monthly sales tax revenue from 2017 to present.

Note: March sales tax revenue reflects sales activity in February.
Data Source: Rapides Parish Police Jury Treasurer’s Reports.
2016 2017 2018 2019 2020 March $ 9,851,816 $ 9,821,434 $ 9,721,868 $10,050,046 $10,102,202 February $ 8,517,157 $ 9,386,566 $ 9,777,756 $ 9,878,422 $11,163,592 % Chg over Prev Month 4.6% -0.6% 1.7% -9.5% % Chg over Prev Year -0.3% -1.0% 3.4% 0.5% YTD (Jan - Mar) $30,714,984 $32,421,220 $32,843,092 $33,787,433 $35,247,557 % Chg over Prev YTD 5.6% 1.3% 2.9% 4.3% $5 $6 $7 $8 $9 $10 $11 $12 $13 $14 $15 Jan-17 Apr-17 Jul-17 Oct-17 Jan-18 Apr-18 Jul-18 Oct-18 Jan-19 Apr-19 Jul-19 Oct-19 Jan-20 Millions March -9.5% March YoY 0.5% March YTD 4.3%
ALEXANDRIASALESTAX
(TR) Alexandria sales tax revenue for March with previous month, year, and YTD comparisons.
(BR) Alexandria monthly sales tax revenue from 2017 to present.

Note: March sales tax revenue reflects sales activity in February.
Data Source: Rapides Parish Police Jury Treasurer’s Reports.
March -7.2% March YoY -2.3% March YTD 1.4% 2017 2018 2019 2020 March $2,915,659 $2,825,914 $2,924,817 $ 2,856,687 February $2,724,430 $2,811,380 $2,868,637 $ 3,079,931 % Chg over Prev Month 7.0% 0.5% 2.0% -7.2% % Chg over Prev Year -3.1% 3.5% -2.3% YTD (Jan - Mar) $9,617,566 $9,669,776 $9,934,437 $10,069,414 % Chg over Prev YTD 0.5% 2.7% 1.4% $2.0 $2.5 $3.0 $3.5 $4.0 $4.5 Millions 2017 - 2020
PINEVILLESALESTAX
(RR) Pineville sales tax revenue for March with previous month, year, and YTD comparisons.
(BR) Pineville monthly sales tax revenue from 2017 to present.

Note: March sales tax revenue reflects sales activity in February.
Data Source: Rapides Parish Police Jury Treasurer’s Reports.
March -17.6% March YoY 5.0% March YTD 12.2% 2017 2018 2019 2020 March $ 779,665 $ 806,993 $ 788,436 $ 827,925 February $ 753,343 $ 819,414 $ 796,424 $ 1,004,243 % Chg over Prev Month 3.5% -1.5% -1.0% -17.6% % Chg over Prev Year 3.5% -2.3% 5.0% YTD (Jan - Mar) $2,545,840 $2,638,704 $2,611,027 $ 2,930,619 % Chg over Prev YTD 3.6% -1.0% 12.2% $0.6 $0.7 $0.8 $0.9 $1.0 $1.1 $1.2 Millions 2017 - 2020
VEHICLESALES
(TR) Rapides Parish vehicle sales tax revenue for March with previous month, year, and YTD comparisons.
(BR) State and national vehicle unit sales comparison.
Note: March sales tax revenue reflects sales activity in February.
Data Source: Rapides Parish Police Jury Treasurer’s Reports and FourEyes.
Revenue 2016 2017 2018 2019 2020 March $ 882,267 $ 842,791 $ 901,355 $ 874,535 $1,044,076 February $ 870,147 $1,060,425 $1,010,781 $1,142,474 $1,171,176 % Chg over Prev Month -20.5% -10.8% -23.5% -10.9% % Chg over Prev Year -4.5% 6.9% -3.0% 19.4% YTD (Jan - Mar) $ 2,648,284 $2,927,953 $2,903,661 $2,891,315 $3,244,699 % Chg over Prev YTD 10.6% -0.8% -0.4% 12.2% Period Louisiana National 3/1-31 vs 2/1-29 -5% -9% 3/13-4/13 vs 2/10-3/12 -27% -35%
Rapides Parish Vehicle Sales Tax
March -10.9% March YoY 19.4% March YTD 12.2%
HOTELOCCUPANCYTAX
(R) Rapides Parish hotel occupancy tax revenue for March with previous month, year, and YTD comparisons.
Note: March tax revenue reflects sales activity in February.
Data Source: Rapides Parish Police Jury Treasurer’s Reports.
March -36.9% March YoY -24.0% March YTD -2.0% 2017 2018 2019 2020 March $ 130,568 $ 126,383 $ 146,322 $ 111,228 February $ 131,467 $ 164,117 $ 170,915 $ 176,249 % Chg over Prev Month -0.7% -23.0% -14.4% -36.9% % Chg over Prev Year -3.2% 15.8% -24.0% YTD (Jan - Mar) $ 360,292 $ 383,220 $ 431,399 $ 422,758 % Chg over Prev YTD 6.4% 12.6% -2.0%