CENLA ECONOMIC DASHBOARD
April 13, 2020.
Dr.RandallDupont CollegeofBusiness
LouisianaStateUniversityofAlexandria

SOCIALDISTANCINGSCOREBOARD
Represents the change in the number of potential human encounters.
Parish Grade
Allen D
Avoyelles D
Catahoula C
Concordia D
Evangeline D
Grant B
LaSalle D
Rapides B
St. Landry D
Source: Unacast.com, Social Distancing Scoreboard
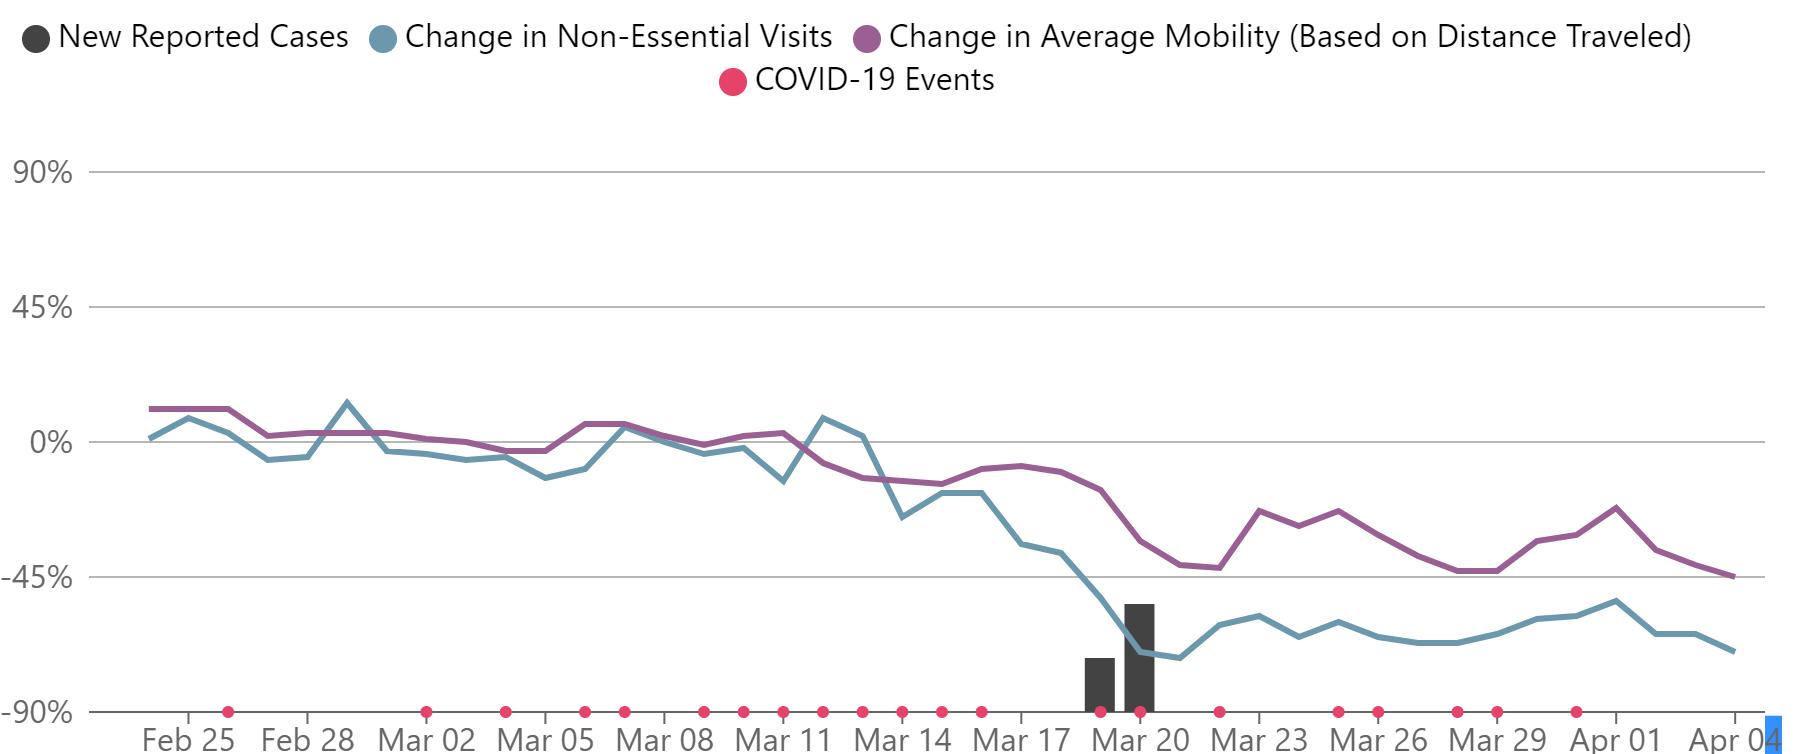
Rapides Parish
Feb. 25 – Apr 4, 2020

COVID-19COMMUNITYMOBILITYREPORT
Represents how visits and length of stay at different places change compared to February 16, 2020 as a baseline.
Source: Google Mobility Change Report as of March 29, 2020
Area Retail and Transportation Grocery and Pharmacy Parks Transit Stations Workplace Residential Louisiana -45% -16% -18% -49% -35% 11% Allen -34% -19% - - -33%Avoyelles -24% -8% - - -32%Catahoula -64% -20% - - -38%Concordia -23% -16% - - -20%Evangeline -16% -4% - - -25%Grant - -13% - - -20%LaSalle -27% -9% - - -31%Rapides -40% -15% -2% -55% -30% 10% St. Landry -28% -16% - -40% -28% 14%
COVID-19CASESINCENLA
Cases per 1000 population and (R) cumulative cases
parish Source: Data from New York Times and US Census 2019 Population Estimate Parish Cases / 1000 Allen 2.77 Catahoula 2.11 Avoyelles 1.52 St Landry 1.32 Rapides 1.23 Evangeline 1.02 Concordia 0.88 LaSalle 0.67 Grant 0.49 0 20 40 60 80 100 120 140 160 180
(L)
by
Rapides Avoyelles Evangeline St Landry Allen Grant Catahoula Concordia LaSalle
COVID-19 Cases by
Parish
UNEMPLOYMENTCLAIMS
(L) Trend in initial unemployment claims by parish and (R) initial and continued claims statewide.
Source: Louisiana Workforce Commission,April 9, 2020
Parish 7-Mar 14-Mar 21-Mar 28-Mar 4-Apr Allen 8 8 104 205 421 Avoyelles 8 14 707 618 467 Catahoula 4 3 22 87 95 Concordia 2 6 72 161 175 Evangeline 10 11 138 253 379 Grant 8 5 119 213 209 La Salle 8 10 195 329 351 Rapides 24 35 990 1,924 1,828 St. Landry 24 37 652 1,293 1,395 Total 96 129 2,999 5,083 5,320 0 20,000 40,000 60,000 80,000 100,000 120,000 2/8 2/15 2/22 2/29 3/7 3/14 3/21 3/28 4/4 Initial Unemployment Claims Louisiana 2/8-4/4/20 0 20,000 40,000 60,000 80,000 100,000 120,000 140,000 2/8 2/15 2/22 2/29 3/7 3/14 3/21 3/28 4/4 Continued Claims Louisiana 2/8-4/4/20
UNEMPLOYMENTCLAIMS
Snapshot of weekly initial claims filed March 14 and April 4, 2020 by parish
March 14, 2020
Source: Louisiana Workforce Commission,April 9, 2020
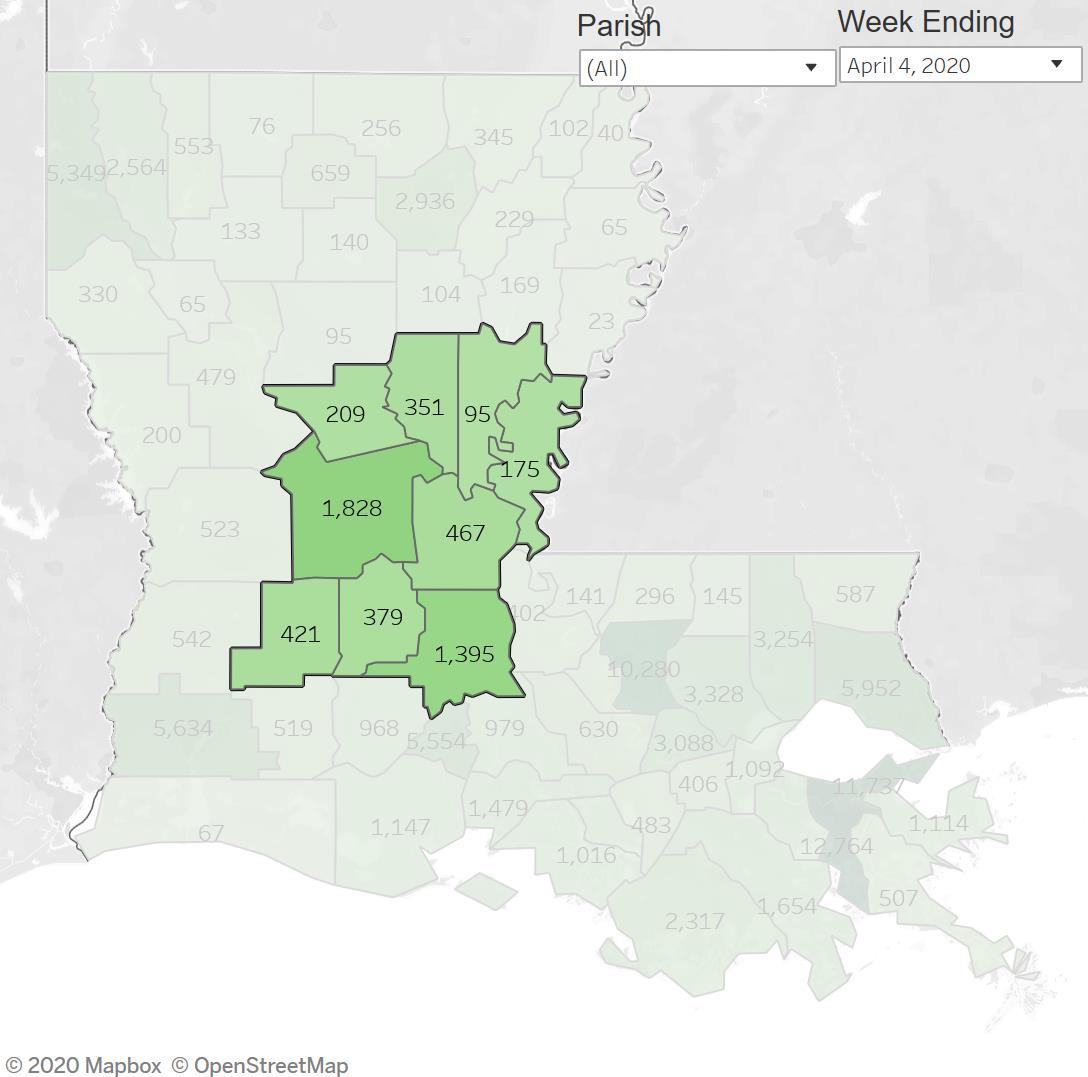
April 4, 2020

UNEMPLOYMENTCLAIMS
Historical overview of initial claims filed in Louisiana from 1987 - 2020
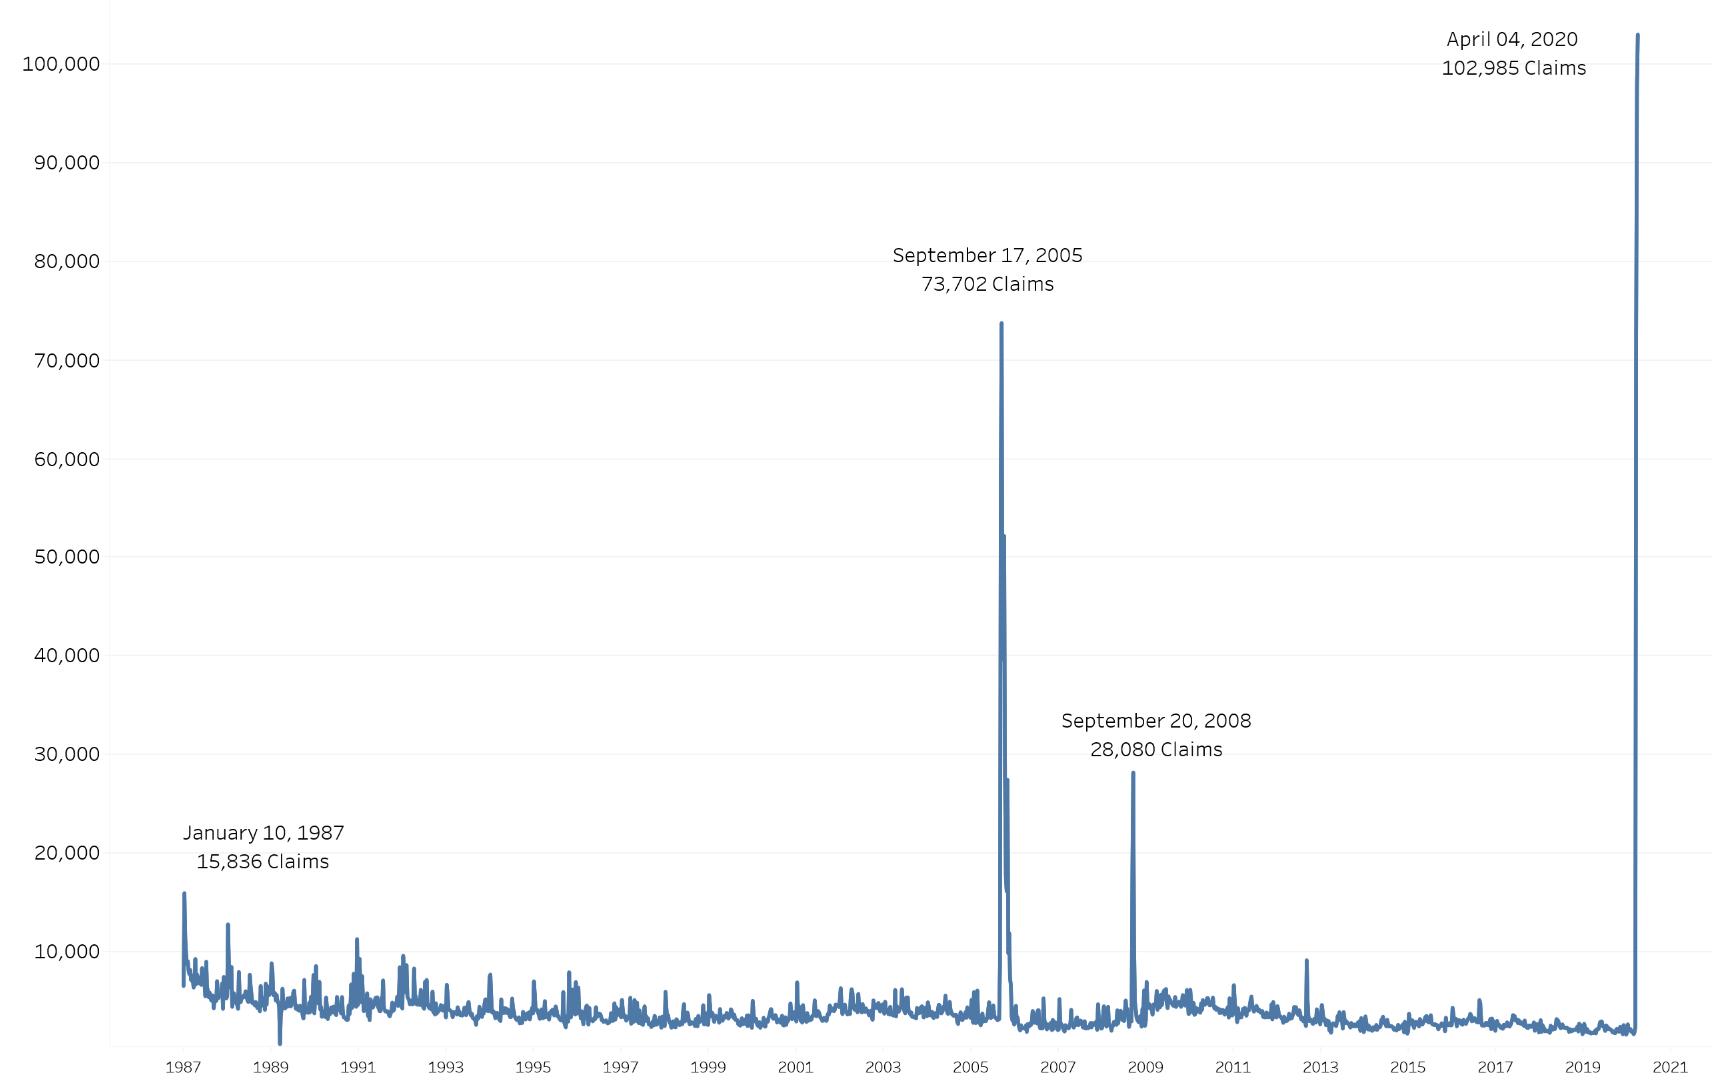
Source: Louisiana Workforce Commission,April 9, 2020
JOBOPENINGS
(L) Number of job openings advertised online in March, 2020 and (R) job openings for select parishes and state since March 2019
Louisiana Workforce Commission Area Job Openings Allen 163 Avoyelles 310 Catahoula 21 Concordia 167 Evangeline 291 Grant 72 La Salle 97 Rapides 4,203 St. Landry 849 0 50 100 150 200 250 300 350 400 450 500 Mar-19 Apr-19 May-19 Jun-19 Jul-19 Aug-19 Sep-19 Oct-19 Nov-19 Dec-19 Jan-20 Feb-20 Mar-20 Avoyelles 0 1,000 2,000 3,000 4,000 5,000 6,000 Mar-19 Apr-19 May-19 Jun-19 Jul-19 Aug-19 Sep-19 Oct-19 Nov-19 Dec-19 Jan-20 Feb-20 Mar-20 Rapides 0 50 100 150 200 250 300 350 Mar-19 Apr-19 May-19 Jun-19 Jul-19 Aug-19 Sep-19 Oct-19 Nov-19 Dec-19 Jan-20 Feb-20 Mar-20 Evangeline 0 20,000 40,000 60,000 80,000 100,000 120,000 Mar-19 Apr-19 May-19 Jun-19 Jul-19 Aug-19 Sep-19 Oct-19 Nov-19 Dec-19 Jan-20 Feb-20 Mar-20 Louisiana
Source:
TOPEMPLOYERS
Employers with the highest number of job openings advertised online in
Alexandria MSA
Louisiana
AlexandriaMSA Louisiana Employer Name Job Openings Ochsner Clinic Foundation 1,607 Ochsner Health System 1,015 Pizza Hut, Inc. 922 CHRISTUS Health 871 LCMC Health 606 SONIC Corp. 589 Dollar Tree, Inc. 577 Lafayette General Health 574 Army National Guard 502 McDonald's Corporation 448 Employer Job Openings CHRISTUS Health 363 DoorDash, Inc. 90 Army National Guard 89 Rapides Parish School Dist. 66 HCA Healthcare, Inc. 51 Wanderly 46 Pizza Hut, Inc. 35 Lowe's Companies, Inc 25 Encompass Health Corp 24 Hospital Corp of America 24
and
on April 8, 2020
NEWHOMECONSTRUCTIONPERMITS
Permits and valuation of new privately owned single family housing in Alexandria MSA January 2019present
Comparison
• 23 permits issued YTD through February 2020 compared to 35 for the same period in 2019.
• Permits were valued at $5,010,000 in YTD through February 2020 compared to $8,256,000 for same period in 2019.
New Privately Owned Single Family Housing Unit Permits Alexandria, LA MSA
January 2019 - February 2020
$$50,000 $100,000 $150,000 $200,000 $250,000 $300,000 $350,000 0 5 10 15 20 25 Jan-19 Feb-19 Mar-19 Apr-19 May-19 Jun-19 Jul-19 Aug-19 Sep-19 Oct-19 Nov-19 Dec-19 Jan-20 Feb-20 Average Valuation Number Permits Jan-19 Feb-19 Mar-19 Apr-19 May-19 Jun-19 Jul-19 Aug-19 Sep-19 Oct-19 Nov-19 Dec-19 Jan-20 Feb-20 Units 17 18 11 21 22 16 18 19 16 20 11 7 12 11 Avg Value $252,41 $220,27 $249,90 $220,28 $219,18 $261,75 $225,38 $240,68 $210,93 $240,10 $301,00 $273,71 $215,75 $220,09
Data Source: US Census Bureau, https://www.census.gov/construction/bps/msamonthly.html