

LOUISIANA ALICE IN THE CROSSCURRENTS

REGIONAL MAP OF LOUISIANA
United Way ALICE Project Participants
United Way of Northwest Louisiana www.unitedwaynwla.org
820 Jordan Street, Suite 370 Shreveport, LA 71101
United Way of Northeast Louisiana www.unitedwaynela.org 1201 Hudson Lane Monroe, LA 71201
United Way of Central Louisiana www.uwcl.org 1101 4th Street, Suite 202 Alexandria, LA 71301
St. Landry - Evangeline United Way www.uwsle.org
5367 I-49 S. Service Road Opelousas, LA 70570
Capital Area United Way www.cauw.org 700 Laurel Street Baton Rouge, LA 70802
United Way of Southeast Louisiana www.unitedwaysela.org 2401 Canal Street New Orleans, LA 70119
United Way of Southwest Louisiana www.unitedwayswla.org 815 Ryan Street Lake Charles, LA 70601
United Way of Acadiana www.unitedwayofacadiana.org
215 E. Pinhook Road Lafayette, LA 70501
St. John United Way www.stjohnunitedway.org 408 Belle Terre Boulevard LaPlace, LA 70068
United Way of St. Charles www.uwaysc.org 13207 River Road Luling, LA 70070
LETTERS TO THE COMMUNITY
Louisiana Association of United Ways
Message from Sarah H. Berthelot, President and CEO for Louisiana at Entergy
Corporation
Message from Patty Riddlebarger, Vice President of Corporate Social Responsibility
That’s why we are proud to have partnered with United Ways this past year to for Louisiana ALICE workers so they can access much-needed tax credits to
Participating United Ways:
Capital Area United Way
President/CEO
St. John United Way
Executive Director
St. Landry-Evangeline United Way
Executive Director
United Way of Acadiana
President/CEO
United Way of Central Louisiana
President
United Way of Northeast Louisiana
President
United Way of Northwest Louisiana
LaToria Thomas
President/CEO
United Way of Southeast Louisiana
President/CEO
United Way of Southwest Louisiana
President/CEO
United Way of St. Charles
John Dias
Executive Director

A LICE IN THE CROSSCURRENTS 2024 UPDATE AN UPDATE ON FINANCIAL HARDSHIP IN LOUISIANA
In 2022, financial hardship in Louisiana continued to be shaped by the conflicting economic forces of the pandemic, and remained substantially undercounted by official measures.
These powerful crosscurrents — COVID-19, inflation, wage growth, and the expansion and expiration of pandemic public assistance — impacted how many Louisiana households were below the ALICE Threshold of Financial Survival
Between 2021 and 2022, the number of households in poverty in Louisiana decreased by 913 (remaining at 19% of all households). At the same time, the number of ALICE households increased by 4,960 (remaining at 32% of all households), continuing a more than decade-long trend in the growth of this population. In 2022, of the 1,799,695 households in Louisiana, 906,515 — 50%* — were below the ALICE Threshold.
With the latest data from the American Community Survey (2022), the U.S. Census Bureau’s Household Pulse Survey (2023), and the Federal Reserve Board’s Survey of Household Economics and Decisionmaking (SHED) (2022), this Update highlights the conflicting forces that continue to present opportunities for, and barriers to, financial stability in Louisiana.
*In Louisiana in 2022, out of 1,799,695 households, there were 339,003 (18.8%) in poverty plus 567,512 (31.5%) that were ALICE, totaling 906,515 (50.3%) below the ALICE Threshold, which is rounded to 50% in this Update.
KEY TERMS
z ALICE: Asset Limited, Income Constrained, Employed — households that earn above the Federal Poverty Level (FPL) but cannot afford the basic cost of living in their parish. Despite struggling to make ends meet, ALICE households often do not qualify for public assistance.
z ALICE Household Survival Budget: Reflects the minimum costs of household necessities in Louisiana (housing, child care, food, transportation, health care, and technology) plus taxes, adjusted for different parishes and household types
z ALICE Threshold of Financial Survival: Derived from the Household Survival Budget, the minimum average income that a household needs to afford basic costs, calculated for all U.S. counties/parishes
z Below ALICE Threshold: Includes households in poverty and ALICE households combined
z ALICE Essentials Index: A measure of the average change over time in the costs of essential goods and services
HOUSEHOLD COSTS, PUBLIC ASSISTANCE, AND WAGES
Financial hardship among Louisiana households shifted from 2021 to 2022 based primarily on three factors:
z Costs: From 2021 to 2022, the ALICE Household Survival Budget for a single adult in Louisiana increased from $26,760 to $27,420, well above the FPL of $13,590. For a family of four with two children in child care, the budget (including tax credits) increased from $66,288 to $78,744, nearly three times the FPL of $27,750. Excluding tax credits, costs for a family of four totaled $84,060 in 2022, up from $82,284 in 2021. (More data on inflation is available in the ALICE Essentials Index June 2024 Update.)
z Public assistance: Pandemic assistance had the most pronounced effects on families with children. The Economic Impact Payments and the expansions of the Child Tax Credit (CTC) and the Child and Dependent Care Tax Credit (CDCTC) helped many ALICE families through 2021. But this assistance was substantially reduced when the 2021 American Rescue Plan expired, stimulus payments ended, and tax credits reverted to 2020 levels. In 2022, a family of four with two children in childcare in Louisiana was eligible for approximately $15,000 less in maximum federal tax credits and stimulus payments than in 2021.
z Wages: As pandemic assistance wound down, wages increased for most low-wage jobs. For example, median retail sales wages in Louisiana increased from $11.19 per hour in 2021 to $12.66 per hour in 2022.


Comparison of Costs, Public Assistance, and Wages, Family of Four, Louisiana, 2021 and 2022
Survival Budget total costs for this family increased from $82,284 in 2021 to $84,060 in 2022
This family was eligible for nearly $15,000 less in federal tax credits and stimulus payments in 2022 than in 2021
Total annual wages for these two common jobs increased by 9% from 2021 to 2022
Note: CTC = Child Tax Credit, CDCTC = Child and Dependent Care Tax Credit. Full-time income is calculated based on 40 hours per week.
Sources: ALICE Threshold, 2021 and 2022; Bureau of Labor Statistics—Occupational Employment Statistics, 2021 and 2022; Internal Revenue Service, tax credits—CTC, CDCTC, EITC, 2021 and 2022; U.S. Department of the Treasury, 2022 and 2023.
See page 13 for Household Survival Budget sources and visit UnitedForALICE.org/Household-Budgets/Louisiana to see the Household Survival Budget for all parishes and for any household composition.
Across the country, between 2019 and 2022, wages for the lowest-paid jobs increased at a faster rate than at any point since 1979. This was in part due to a tighter labor market in which workers reevaluated their employment situation in the wake of the pandemic and inflation, and employers had to offer more competitive wages to attract and retain them. While minimum wage increases in some states also contributed to this effect, that wasn’t the case in Louisiana; the state’s minimum wage workers are paid the federal minimum wage (which has been $7.25 per hour since 2010). But overall, low-wage jobs in Louisiana still saw notable wage increases from 2019 to 2022.
While these increases helped fill the gap when pandemic assistance ended, they were not enough to make up for years of falling behind. In 2022, of the 20 most common occupations in Louisiana as reported by the Bureau of Labor Statistics (BLS), 75% still paid less than $20 per hour. And of the workers in these 20 most common occupations, 41% were below the ALICE Threshold in 2022. Occupations with the largest share of ALICE workers included personal care aides, cooks, cashiers, fast food and counter workers, and waiters/waitresses.
Labor C h a racteristics of Most Common Occupations, Louisiana, 2019–2022
Note: BLS = Bureau of Labor Statistics; ACS PUMS = American Community Survey Public Use Microdata Sample. Occupation titles and percent of workers below the ALICE Threshold come from ACS PUMS. ALICE Threshold status is determined by comparing workers’ household income to the Household Survival Budget for their household composition and location. Employment and wage numbers are from BLS and are matched to the closest PUMS occupation title (which are generally broader than those in BLS).
Sources: ALICE Threshold, 2022; Bureau of Labor Statistics—Occupational Employment Statistics, 2022; U.S. Census Bureau, American Community Survey, PUMS, 2019 and 2022
To see the most common occupations for workers below the ALICE Threshold in your community, visit UnitedForALICE.org/ALICE-EVD. For more data on jobs by hourly wages and full-time, part-time, and hourly work schedules, visit UnitedForALICE.org/Labor-Force/Louisiana
Financial Hardship Over Time
Despite some ups and downs in rates of financial hardship since the end of the Great Recession, the trend is clear: The number of ALICE households in Louisiana has been steadily growing. Between 2010 and 2022, the total number of households in the state increased by 7%, households in poverty increased by 15%, and the number of ALICE households increased by 20%. By 2022, 19% (339,003) of all households were below the FPL, and 32% (567,512) of all households were ALICE — a combined 50%* (906,515) of households struggling to make ends meet.
Zooming in to the period around the COVID-19 pandemic (2019–2022), there was surprisingly little change in the rate of financial hardship in Louisiana (51% of households below the ALICE Threshold in 2019 and 50% in 2022).
Households by Income, Louisiana, 2010–2022
Yet by number, ALICE households and households below the ALICE Threshold continued to grow.
This consistent trend — a growing number of households that are struggling financially, often ineligible for public assistance, and undercounted by official measures — represents a major vulnerability in our economic system. It also suggests that overall social and economic policies are falling short in addressing the root causes of financial instability.
*In Louisiana in 2022, out of 1,799,695 households, there were 339,003 (18.8%) in poverty plus 567,512 (31.5%) that were ALICE, totaling 906,515 (50.3%) below the ALICE Threshold, which is rounded to 50% in this Update.
Total households increased by 7% between 2010 and 2022
567,512
339,003
Note: The gray dashed trend lines in this figure highlight the general direction of the point-in-time data for the years shown. These lines indicate whether the numbers of ALICE and Poverty-Level households have been generally increasing, decreasing, or remaining flat. The ALICE and Poverty trend lines are both statistically significant (ALICE at p<0.001 and Poverty at p<0.05).
Sources: ALICE Threshold, 2010–2022; U.S. Census Bureau, American Community Survey, 2010–2022
To see additional data on financial hardship over time in Louisiana, visit UnitedForALICE.org/Louisiana
SPOTLIGHT ON ALICE DEMOGRAPHICS
Families With Children
While recent attention has focused on the rising Supplemental Poverty Rate for children following the expansion and reversal of Child Tax Credits during and after the pandemic, longer-term trends — specifically, the decline in total families with children and the rise in ALICE households with children — tell a more nuanced story.
The number of households with children in Louisiana has been declining (down 6% from 2010 to 2022). This trend has been driven by a decrease in the number of married-parent households, which fell from 298,363 in 2010 to 275,155 in 2022 (down 8%), and single-female-headed households, which fell from 159,788 in 2010 to 147,023 in 2022 (also down 8%). At the same time, the number of single-male-headed households increased, from 37,864 in 2010 to 43,848 in 2022 (up 16%).
Households With Children, Louisiana
In Louisiana, the number of households with children in poverty declined over the past decade for married-parent and single-female-headed households but increased for single-male-headed households. At the same time, the number of ALICE households with children increased across all three family types. By 2022, 43% of families with children in Louisiana were below the ALICE Threshold. And longstanding disparities in financial hardship by household type remained: 82% of single-female-headed families and 57% of single-male-headed families were below the ALICE Threshold in 2022, compared to 20% of married-parent families.
Note: Poverty rates for families with children differ from rates for individual children, in part due to different surveys and in part because there are often multiple children in a single household, which can accentuate swings.
Sources: ALICE Threshold, 2010–2022; U.S. Census Bureau, American Community Survey, 2010–2022
THE C OST OF CHILD CAR E
Child care remains one of the highest Survival Budget costs for households with children, and the child care system is still feeling the impact of the COVID-19 pandemic. Provider shortages and lack of affordable care present fewer options for parents. According to the October 2023 Household Pulse Survey, when families in the West South Central Census Region (which includes Louisiana) were asked what they did when child care was closed, unavailable, or unaffordable, the most common responses for respondents below the ALICE Threshold were to cut work hours (30%), take unpaid leave (25%), or supervise one or more children while working (19%).
Households Headed by People Age 65 and Over
With the aging of the Baby Boomer generation, households headed by people age 65 and over are the fastest-growing age group in Louisiana (up 40% between 2010 and 2022). They are also the age group with the most substantial increase in the number of households below the ALICE Threshold (also up 40% during the same period).
In 2022, 58% of Louisiana’s 65+ households were below the ALICE Threshold (285,259). While Social Security helps reduce the poverty rate for households headed by older adults (17% in Louisiana in 2022), benefits not been enough to help bring older adults to financial stability. As a result,
for more than a decade, a substantial number of these households have been ALICE (41% in 2022). In 2022, monthly costs for the ALICE 65+ Survival Budget for one adult in Louisiana were $989 more than the average Social Security payment and $1,483 more than the FPL.
With increasing costs and insufficient retirement savings, many older adults have needed to continue working. In 2022, just over 277,000 people age 65 and over living below the ALICE Threshold in Louisiana did not have retirement savings beyond Social Security, and more than 35,800 were working.
Monthly ALICE 65+ Survival Budget Total, Average Monthly Social Security Payments, and the Federal Poverty Level, Louisiana, 2022
Households by Race/Ethnicity
Rates of financial hardship differ substantially by race/ ethnicity in Louisiana due to persistent systemic racism, discrimination, and geographic barriers that limit many families’ access to resources and opportunities for financial stability. In 2022, 67% of Black, 50% of Hispanic, and 51% of American Indian/Alaska Native households, as well as 49% of households headed by someone of Two or More Races, were below the ALICE Threshold in Louisiana, compared to 42% of White, 41% of Native Hawaiian/Pacific Islander, and 40% of Asian households.
These disparities are mirrored in the workforce. For example, Black and Hispanic workers were more likely than White workers to experience disruption in employment during the pandemic. And gaps in employment by income and race persisted. Overall, adults age 16+ below the ALICE Threshold in Louisiana were more likely to not be working, but looking for work (12%) than those above the Threshold (2%) in 2022, and the rate was even higher for Black workers (15%).


Household Financial Status and Key Demographics, Louisiana, 2022
HOUSEHOLD TYPE
RURAL/URBAN
Note: The groups shown in this figure are based on head of household and overlap across categories. Within the race/ethnicity category, all racial categories except Two or More Races are for one race alone. Race and ethnicity are overlapping categories; in this Update, the American Indian/Alaska Native, Asian, Black, Native Hawaiian (includes other Pacific Islanders), and Two or More Races groups may include Hispanic households. The White group includes only White, non-Hispanic households. The Hispanic group may include households of any race. Because household poverty data is not available for the American Community Survey’s race/ethnicity categories, annual income below $15,000 is used as a proxy. Parishes are defined as rural or urban based on the USDA’s designation of metropolitan or non-metropolitan at the census tract level. Parishes with 50% or more of the population in metropolitan tracts are designated as urban; those with 50% or more of the
in
(31.5%) that were ALICE, totaling
Sources:
tracts are designated as rural. In Louisiana in 2022, out of 1,799,695
below the ALICE Threshold, which is rounded to 50% in this Update.
ALICE REMAINS IN THE CROSSCURRENTS
Many ALICE households face ongoing distress because they have not recovered from the Great Recession, debt accumulation, a job loss, or other major challenges. Many are working hard and still struggling to find safe housing, quality child care, nutritious food, accessible health care, and reliable transportation that they can afford. Rising wages and pandemic assistance mitigated some of the financial impact of business disruptions, a health crisis, and rising inflation that characterized the past few years. Yet half of households in Louisiana were still struggling in 2022 — ranking Louisiana 50th among all states and the District of Columbia in financial hardship (with 1st representing the lowest rate of hardship). Insights from the Federal Reserve SHED and the Household Pulse Survey help explain why:
Inflation is Hitting ALICE Harder
z The cost of basics is increasing faster than the overall rate of inflation, as reported by the ALICE Essentials Index. And it has gotten harder for ALICE to keep up with bills than at the height of the pandemic. According to the Household Pulse Survey, 61% of households below the ALICE Threshold in Louisiana reported that it was somewhat or very difficult to pay for usual items such as food, rent or mortgage, car payments, and medical expenses in October 2023, up from 55% in August 2020.

z Housing costs are on the rise in many parts of the state, and the impact is greater for those who were already struggling financially. According to the SHED, in 2022, 29% of households below the ALICE Threshold in Louisiana reported that their rent or mortgage had increased in the prior 12 months (compared to 21% of households above the Threshold).
Changes in Public Assistance Impact ALICE
z Food assistance: Increased need for food assistance was a hallmark of the pandemic. Food pantries experienced a substantial increase in demand for services, and Supplemental Nutrition Assistance Program (SNAP) eligibility criteria broadened and monthly payments increased (through February 2023). In 2022, the need remained high, with one in six Americans (49 million) receiving private charitable food assistance — down from the height of the pandemic, but still up markedly from 40 million in 2019. In part due to the SNAP income eligibility level in Louisiana (130% of the FPL), public food assistance was not accessible to all households that were struggling financially: Only 46% of all Louisiana households in poverty and 23% of all ALICE households participated in SNAP
in 2022. Among all eligible people, estimated SNAP participation rates were higher.
z Rent: With rising costs, the expiration of pandemic rental assistance, and the end of the federal moratorium on evictions, many Louisianians continued to struggle to pay their rent. According to the Household Pulse Survey, 23% of renter households below the ALICE Threshold in Louisiana were still behind on rent payments in October 2023, down from 28% in August 2020. In Louisiana in 2022, 63% of households below the ALICE Threshold were rent burdened (paying more than 30% of their income on rent) and 38% were severely rent burdened (paying more than 50% of their income on rent).
ALICE is Less Prepared for Crises and Retirement
z ALICE struggles to save: According to the SHED, 45% of respondents in Louisiana had emergency savings in 2022 (down from 55% in 2019). Yet only 25% of households below the ALICE Threshold had emergency savings (or rainy day funds) that would cover their expenses for three months in the event of sickness, job loss, economic downturn, or another emergency in 2022, down from 37% in 2019.
z ALICE faces unexpected medical expenses: According to the SHED, 17% of respondents below the ALICE Threshold in Louisiana incurred an unexpected major medical expense that they had to pay for out of pocket because it was not completely paid for by insurance in 2022, the same rate as in 2021. Medical debt generally reflects poorer health and lower rates of health care coverage, and can lead to lower credit scores and additional financial hardship. Additionally, the consequences of medical debt are not experienced equally; those with lower incomes and people of color are more likely than their counterparts to be contacted by collection agencies and denied future care.
z Financial hardship impedes retirement savings: According to the SHED, in 2022, 18% of all non-retired adults and 22% of non-retired adults above the ALICE

Threshold in Louisiana reported that their retirement savings plan was currently on track. Yet only 14% of those below the Threshold reported the same.
z Financial hardship takes a toll on mental health: The negative impact of financial stress on mental health has been well established. According to the Household Pulse Survey, 22% of respondents below the ALICE Threshold in Louisiana reported feeling nervous, anxious, or on edge nearly every day over the prior two weeks in October 2023 – up from August 2020 (20%), and considerably higher than for those above the Threshold (14% in 2023).
This research shows a clear trend in our communities and our economy: Financial hardship is widespread, and it’s not going away. The current system is not working for ALICE. The narrative in this Update helps make the case for innovative, cross-sector change in Louisiana and across the U.S. The data, tools, and resources on the United For ALICE website can equip business, government, education, and nonprofit leaders to make data-informed decisions that address the root causes of financial hardship. Collaborative effort at all levels — local, state, and federal — will be needed to change the trajectory for ALICE households.

ALICE ONLINE
Visit UnitedForALICE.org to explore interactive data and resources. Click the icons below to get started.
Interactive Maps
Data at the state, parish, municipal, and ZIP-code levels
Data Sheet
Spreadsheet of ALICE data over time and by location
Legislative District Tool
ALICE data by legislative district, including state upper and lower chambers and congressional districts
Research Advisory Committees
Information about the members and role of these critical groups
ALICE Demographics
Information about ALICE households by age, race/ ethnicity, household type, and location
ALICE Household Budgets
ALICE Household Survival and Stability Budgets for the state and one or more parishes
National Overview
National ALICE data and a comparison of financial hardship across U.S. states
ALICE Methodology
Overview of the sources and calculations used in the ALICE research
ALICE Voices
Are you ALICE? Use this tool to share your story
ALICE in Action
Programs, practices, and policy changes implemented by partners across the United For ALICE network
Parish Reports
An in-depth look at ALICE data, parish by parish
ALICE Essentials Index
Key data on the increase in the cost of household basics over time
Economic Viability Dashboard
Key data on the local economic conditions that matter most to ALICE households: Work, Housing, and Community Resources
Equity for ALICE
Creating equity for ALICE by illustrating how structural racism and systemic barriers limit life outcomes, and working to remove those barriers so that all people can participate fully in all aspects of our social and economic systems
ALICE Videos
Videos that highlight the ALICE research and partner network
ALICE RESEARCH & METHODOLOGY
The ALICE Household Survival Budget calculates the cost of household essentials for each parish in Louisiana and relies on a wide range of public data sources, listed below. For household income, the ALICE measures rely on the U.S. Census Bureau’s American Community Survey (ACS) — both household tabulated data and individual data from the Public Use Microdata Sample (PUMS) records. Household costs are compared to household income to determine if households are below the ALICE Threshold. The latest ALICE Methodology review was completed in the summer of 2023. Methodology enhancements include:
z Health care costs: A “poor health multiplier” is used to capture the additional costs lower-income households incur for being in poor or fair health. Based on the latest research, out-of-pocket costs in the health care line item are increased by 19% (a more conservative estimate than the 30% used in prior years).
ALICE
z Broadband added: To reflect the finding that the majority of Americans now have home broadband, basic broadband internet has been added to technology costs. The smartphone plan has been updated to include an unlimited (albeit less expensive than the previous 10GB version) smartphone plan for each adult in the household.
z Determining ALICE status: For 2021 data and years prior, the ALICE Threshold was rounded by budget total to the nearest ACS income bracket (e.g., Threshold of $32,500 corresponded to bracket $30,000–$34,999; all households in that bracket were below the ALICE Threshold). Starting this year (2022 data), the Threshold is calculated in proportion to where it falls within the bracket (e.g., if Threshold is $32,500, half of households in the bracket are below the Threshold).
Household Survival Budget, Louisiana, 2022
Note: CTC = Child Tax Credit, CDCTC = Child and Dependent Care Tax Credit. Full-time hourly wage represents the wage needed at 40 hours per week to support the annual total, with credits. For the family of four, this represents the combined wage needed for two workers. Many households incur higher costs, especially for housing, as units may not be available at Fair Market Rent.
Sources: AAA, 2022; Agency for Healthcare Research and Quality, 2022; American Community Survey, 2022; Bureau of Labor Statistics, 2022—Consumer Expenditure Surveys; Bureau of Labor Statistics, 2022—Occupational Employment Statistics; Centers for Medicare & Medicaid Services, 2023—Medicare - Chronic Conditions; Centers for Medicare & Medicaid Services, 2020— Medicare Current Beneficiary Survey; Centers for Medicare & Medicaid Services, 2023; Federal Reserve Bank of Atlanta—Policy Rules Database; Federal Highway Administration, 2017; Feeding America, 2023; Frank, 2022; Internal Revenue Service, 2022; Louisiana Department of Education, 2021—Narrow Cost Analysis; Medicare.gov; The Zebra, 2022; U.S. Department of Agriculture, 2022—Official USDA Food Plans; U.S. Department of Housing and Urban Development, 2022—Fair Market Rents; USTelecom, 2022.
To view ALICE Household Survival Budgets for all parishes and for any household composition, visit UnitedForALICE.org/Household-Budgets/Louisiana.
Data Notes: The income data used in this Update rely on ACS estimates. The ACS is based on a representative sample, rather than all housing units and people; therefore, these estimates have a degree of uncertainty. Some data points are geographic averages, others are one- or five-year averages depending on population size (see the Data Sheet for details). Percentages are rounded to whole numbers, sometimes resulting in percentages totaling 99% or 101%. ALICE analysis includes households regardless of work status, as employment is fluid and most households have members who are working, have worked, are out on disability, or are looking for work. ALICE analysis does not include people who are unhoused or living in group quarters.
ABOUT UNITED FOR ALICE AND OUR PARTNERS
ALICE in the Crosscurrents: An Update on Financial Hardship in Louisiana is brought to you by Louisiana Association of United Ways in partnership with United For ALICE, a driver of innovative research and action around financial hardship for ALICE households. With a commitment to racial and economic justice, United For ALICE and United Ways across Louisiana share this work with foundations, government, corporations, and other nonprofits to inform policy and promote positive change for ALICE households. The grassroots ALICE movement, developed by United Way of Northern New Jersey, has spread to 31 states and the District of Columbia. Learn more about the ALICE movement here
Louisiana Research Advisory Committee:
z Stephen R. Barnes, Ph.D., Kathleen Babineaux Blanco Public Policy Center, University of Louisiana at Lafayette
z Tristi Charpentier, M.M.C., Huey and Angelina Wilson Foundation
z Jerome Cox, Ph.D., Milestones Counseling Services, LLC
z Steven J. Dick, Ph.D., RMC Research Corporation
z Barry Erwin, Council for a Better Louisiana
z Lamar M. Gardere, M.S.C.S., The Data Center
z Jaimie L. Hebert, Ph.D., University of Louisiana at Lafayette
z Holly K. Howat, Ph.D., Beacon Community Connections
z Sandra McQuain, The McQuain Group, LLC
z James E. Mitchell, Ph.D., Governor’s Advisory Council on Disability Affairs
z Jan Moller, Invest in Louisiana
To create the ALICE Reports, our team of researchers works with Research Advisory Committees composed of experts from our partner states. This work is guided by our rigorous methodology, which is updated biennially with experts from across our Research Advisory Committees.
Director and Lead Researcher: Stephanie Hoopes, Ph.D.
ALICE Research Team: Andrew Abrahamson; Ashley Anglin, Ph.D.; Catherine Connelly, D.M.H., M.A.; Max Holdsworth, M.A.; Dana Isaac
z Susan East Nelson, J.D., Louisiana Partnership for Children and Families
z Dave N. Norris, Jr., Ph.D., Louisiana Tech University
z Marshall Pierite, Tunica-Biloxi Tribe of Louisiana
z Patty Riddlebarger, M.B.A., Entergy Corporation
z Randall E. Roach, J.D., former Mayor of Lake Charles
z Bill Rodier, M.I.B., St. Landry Parish Economic Development
z Bently Senegal, C.P.A., C.G.M.A., Our Lady of Lourdes Regional Medical Center
z Adrienne C. Slack, Federal Reserve Bank of Atlanta
z Libbie Sonnier, Ph.D., Louisiana Policy Institute for Children
z Monty Sullivan, Ed.D., Louisiana Community and Technical College System
Louisiana Association of United Ways partners with United For ALICE to bring the ALICE research to Louisiana. Entergy Corporation is an ALICE Statewide Sponsor and National ALICE Advisory Council Member.

To learn more about ALICE in Louisiana, contact: Sarah Berthelot, Louisiana Association of United Ways, at Sarah@launitedway.org
To access interactive ALICE data and resources for Louisiana, go to UnitedForALICE.org/Louisiana.
© Copyright 2009–2024 United Way of Northern New Jersey. All rights reserved.
ALICE IN ACADIA PARISH
2022 Point-in-Time Data
Population: 57,674 • Number of Households: 21,388
Median Household Income: $44,977 (state average: $55,416)
Labor Force Participation Rate: 55.7% (state average: 59.4%)
ALICE Households: 32% (state average: 32%) • Households in Poverty: 23% (state average: 19%)
Financial Hardship Over Time
ALICE is an acronym for Asset Limited, Income Constrained, Employed — households that earn more than the Federal Poverty Level, but less than the basic cost of living for the parish (the ALICE Threshold). Households below the ALICE Threshold — ALICE households plus those in poverty — can’t afford the essentials.
Households move below or above the ALICE Threshold as economic factors and circumstances change. This was especially true amid the economic crosscurrents of the COVID-19 pandemic, with higher wages, inflation, and additional pandemic assistance. By 2022, 11,790 households (55%) were below the ALICE Threshold in Acadia Parish.
The Cost of Basics Outpaces Wages
The Household Survival Budget reflects the minimum cost to live and work in the current economy and includes housing, child care, food, transportation, health care, technology, and taxes. It does not include savings for emergencies or future goals like college or retirement. The Household Survival Budget is calculated at the parish level and by household composition, as costs can vary greatly depending on location and household needs.
In 2022, household costs in Acadia Parish were well above the Federal Poverty Level of $13,590 for a single adult and $27,750 for a family of four.
To see costs for different household compositions in Acadia Parish, visit UnitedForALICE.org/Household-Budgets/ Louisiana
Households by Income, Acadia Parish, 2010–2022
Note: See an interactive version of this data at UnitedForALICE.org/Louisiana Sources: ALICE Threshold, 2010–2022; American Community Survey, 2010–2022
*Wage working full-time required to support this budget For ALICE Survival Budget sources, visit UnitedForALICE.org/Methodology
Survival Budget, Acadia Parish,
Financial Hardship
is Not Evenly Distributed
Groups with the largest number of households below the ALICE Threshold tend to also be the largest demographic groups. However, when looking at the percentage of each group that is below the ALICE Threshold, some groups are more likely to be ALICE than others. By addressing the disparities in financial hardship by parish demographics, community members can move toward more equitable solutions. Visit UnitedForALICE.org/Louisiana to view more national, state, and parish data.
Household Financial Status by Household Type, Acadia Parish, 2022
Sources: ALICE Threshold, 2022; American Community Survey, 2022
Household Financial Status by Race/Ethnicity, Acadia Parish, 2022
Note: Asian, Black, and White racial categories are for one race alone. Race and Hispanic ethnicity are overlapping categories. The Asian and Black groups may include Hispanic households; the White group includes only White, non-Hispanic households. The Hispanic ethnic group may include households of any race.
Sources: ALICE Threshold, 2022; American Community Survey, 2022
Note: Municipal-level data on this page is 1 or 5-year averages for Incorporated Places (1-year for populations over 65,000 and 5-year for populations under 65,000). Geographies with fewer than 100 households are not included. Therefore, totals will not match the parish-level numbers.
ALICE IN ALLEN PARISH
2022 Point-in-Time Data
Population: 22,798 • Number of Households: 7,636
Median Household Income: $52,755 (state average: $55,416)
Labor Force Participation Rate: 47.1% (state average: 59.4%)
ALICE Households: 36% (state average: 32%) • Households in Poverty: 21% (state average: 19%)
Financial Hardship Over Time
ALICE is an acronym for Asset Limited, Income Constrained, Employed — households that earn more than the Federal Poverty Level, but less than the basic cost of living for the parish (the ALICE Threshold). Households below the ALICE Threshold — ALICE households plus those in poverty — can’t afford the essentials.
Households move below or above the ALICE Threshold as economic factors and circumstances change. This was especially true amid the economic crosscurrents of the COVID-19 pandemic, with higher wages, inflation, and additional pandemic assistance. By 2022, 4,345 households (57%) were below the ALICE Threshold in Allen Parish.
The Cost of Basics Outpaces Wages
The Household Survival Budget reflects the minimum cost to live and work in the current economy and includes housing, child care, food, transportation, health care, technology, and taxes. It does not include savings for emergencies or future goals like college or retirement. The Household Survival Budget is calculated at the parish level and by household composition, as costs can vary greatly depending on location and household needs.
In 2022, household costs in Allen Parish were well above the Federal Poverty Level of $13,590 for a single adult and $27,750 for a family of four.
To see costs for different household compositions in Allen Parish, visit UnitedForALICE.org/Household-Budgets/ Louisiana
Households by Income, Allen Parish, 2010–2022
Note: See an interactive version of this data at UnitedForALICE.org/Louisiana
Sources: ALICE Threshold, 2010–2022; American Community Survey, 2010–2022
*Wage working full-time required to support this budget For ALICE Survival Budget sources, visit UnitedForALICE.org/Methodology
Household Survival Budget, Allen Parish, 2022
Financial Hardship
is Not Evenly Distributed
Groups with the largest number of households below the ALICE Threshold tend to also be the largest demographic groups. However, when looking at the percentage of each group that is below the ALICE Threshold, some groups are more likely to be ALICE than others. By addressing the disparities in financial hardship by parish demographics, community members can move toward more equitable solutions. Visit UnitedForALICE.org/Louisiana to view more national, state, and parish data.
Household Financial Status by Household Type, Allen Parish, 2022
Sources: ALICE Threshold, 2022; American Community Survey, 2022
Household Financial Status by Race/Ethnicity, Allen Parish, 2022
Note: Asian, Black, and White racial categories are for one race alone. Race and Hispanic ethnicity are overlapping categories. The Asian and Black groups may include Hispanic households; the White group includes only White, non-Hispanic households. The Hispanic ethnic group may include households of any race.
Sources: ALICE Threshold, 2022; American Community Survey, 2022
Note: Municipal-level data on this page is 1 or 5-year averages for Incorporated Places (1-year for populations over 65,000 and 5-year for populations under 65,000). Geographies with fewer than 100 households are not included. Therefore, totals will not match the parish-level numbers.
ALICE IN ASCENSION PARISH
2022 Point-in-Time Data
Population: 130,458 • Number of Households: 48,462
Median Household Income: $79,515 (state average: $55,416)
Labor Force Participation Rate: 69.7% (state average: 59.4%)
ALICE Households: 29% (state average: 32%) • Households in Poverty: 12% (state average: 19%)
Financial Hardship Over Time
ALICE is an acronym for Asset Limited, Income Constrained, Employed — households that earn more than the Federal Poverty Level, but less than the basic cost of living for the parish (the ALICE Threshold). Households below the ALICE Threshold — ALICE households plus those in poverty — can’t afford the essentials.
Households move below or above the ALICE Threshold as economic factors and circumstances change. This was especially true amid the economic crosscurrents of the COVID-19 pandemic, with higher wages, inflation, and additional pandemic assistance. By 2022, 19,677 households (41%) were below the ALICE Threshold in Ascension Parish.
The Cost of Basics Outpaces Wages
The Household Survival Budget reflects the minimum cost to live and work in the current economy and includes housing, child care, food, transportation, health care, technology, and taxes. It does not include savings for emergencies or future goals like college or retirement. The Household Survival Budget is calculated at the parish level and by household composition, as costs can vary greatly depending on location and household needs.
In 2022, household costs in Ascension Parish were well above the Federal Poverty Level of $13,590 for a single adult and $27,750 for a family of four.
To see costs for different household compositions in Ascension Parish, visit UnitedForALICE.org/Household-Budgets/ Louisiana
Households by Income, Ascension Parish, 2010–2022
Note: See an interactive version of this data at UnitedForALICE.org/Louisiana
Sources: ALICE Threshold, 2010–2022; American Community Survey, 2010–2022
*Wage working full-time required to support this budget For ALICE Survival Budget sources, visit UnitedForALICE.org/Methodology
Financial Hardship
is Not Evenly Distributed
Groups with the largest number of households below the ALICE Threshold tend to also be the largest demographic groups. However, when looking at the percentage of each group that is below the ALICE Threshold, some groups are more likely to be ALICE than others. By addressing the disparities in financial hardship by parish demographics, community members can move toward more equitable solutions. Visit UnitedForALICE.org/Louisiana to view more national, state, and parish data.
Household Financial Status by Household Type, Ascension Parish, 2022
Sources: ALICE Threshold, 2022; American Community Survey, 2022
Household Financial Status by Race/Ethnicity, Ascension Parish, 2022
Note: Asian, Black, and White racial categories are for one race alone. Race and Hispanic ethnicity are overlapping categories. The Asian and Black groups may include Hispanic households; the White group includes only White, non-Hispanic households. The Hispanic ethnic group may include households of any race.
Sources: ALICE Threshold, 2022; American Community Survey, 2022
Note: Municipal-level data on this page is 1 or 5-year averages for Incorporated Places (1-year for populations over 65,000 and 5-year for populations under 65,000). Geographies with fewer than 100 households are not included. Therefore, totals will not match the parish-level numbers.
ALICE IN ASSUMPTION PARISH
2022 Point-in-Time Data
Population: 21,067 • Number of Households: 8,368
Median Household Income: $47,023 (state average: $55,416)
Labor Force Participation Rate: 54.4% (state average: 59.4%)
ALICE Households: 35% (state average: 32%) • Households in Poverty: 19% (state average: 19%)
Financial Hardship Over Time
ALICE is an acronym for Asset Limited, Income Constrained, Employed — households that earn more than the Federal Poverty Level, but less than the basic cost of living for the parish (the ALICE Threshold). Households below the ALICE Threshold — ALICE households plus those in poverty — can’t afford the essentials.
Households move below or above the ALICE Threshold as economic factors and circumstances change. This was especially true amid the economic crosscurrents of the COVID-19 pandemic, with higher wages, inflation, and additional pandemic assistance. By 2022, 4,545 households (54%) were below the ALICE Threshold in Assumption Parish.
The Cost of Basics Outpaces Wages
The Household Survival Budget reflects the minimum cost to live and work in the current economy and includes housing, child care, food, transportation, health care, technology, and taxes. It does not include savings for emergencies or future goals like college or retirement. The Household Survival Budget is calculated at the parish level and by household composition, as costs can vary greatly depending on location and household needs.
In 2022, household costs in Assumption Parish were well above the Federal Poverty Level of $13,590 for a single adult and $27,750 for a family of four.
To see costs for different household compositions in Assumption Parish, visit UnitedForALICE.org/Household-Budgets/ Louisiana
Households by Income, Assumption Parish, 2010–2022
Note: See an interactive version of this data at UnitedForALICE.org/Louisiana
Sources: ALICE Threshold, 2010–2022; American Community Survey, 2010–2022
*Wage working full-time required to support this budget For ALICE Survival Budget sources, visit UnitedForALICE.org/Methodology
Financial Hardship
is Not Evenly Distributed
Groups with the largest number of households below the ALICE Threshold tend to also be the largest demographic groups. However, when looking at the percentage of each group that is below the ALICE Threshold, some groups are more likely to be ALICE than others. By addressing the disparities in financial hardship by parish demographics, community members can move toward more equitable solutions. Visit UnitedForALICE.org/Louisiana to view more national, state, and parish data.
Household Financial Status by Household Type, Assumption Parish, 2022
Sources: ALICE Threshold, 2022; American Community Survey, 2022
Household Financial Status by Race/Ethnicity, Assumption Parish, 2022
Note: Asian, Black, and White racial categories are for one race alone. Race and Hispanic ethnicity are overlapping categories. The Asian and Black groups may include Hispanic households; the White group includes only White, non-Hispanic households. The Hispanic ethnic group may include households of any race.
Sources: ALICE Threshold, 2022; American Community Survey, 2022
Note: Municipal-level data on this page is 1 or 5-year averages for Incorporated Places (1-year for populations over 65,000 and 5-year for populations under 65,000). Geographies with fewer than 100 households are not included. Therefore, totals will not match the parish-level numbers.
ALICE IN AVOYELLES PARISH
2022 Point-in-Time Data
Population: 39,529 • Number of Households: 14,600
Median Household Income: $38,696 (state average: $55,416)
Labor Force Participation Rate: 51.6% (state average: 59.4%)
ALICE Households: 33% (state average: 32%) • Households in Poverty: 28% (state average: 19%)
Financial Hardship Over Time
ALICE is an acronym for Asset Limited, Income Constrained, Employed — households that earn more than the Federal Poverty Level, but less than the basic cost of living for the parish (the ALICE Threshold). Households below the ALICE Threshold — ALICE households plus those in poverty — can’t afford the essentials.
Households move below or above the ALICE Threshold as economic factors and circumstances change. This was especially true amid the economic crosscurrents of the COVID-19 pandemic, with higher wages, inflation, and additional pandemic assistance. By 2022, 8,833 households (61%) were below the ALICE Threshold in Avoyelles Parish.
The Cost of Basics Outpaces Wages
The Household Survival Budget reflects the minimum cost to live and work in the current economy and includes housing, child care, food, transportation, health care, technology, and taxes. It does not include savings for emergencies or future goals like college or retirement. The Household Survival Budget is calculated at the parish level and by household composition, as costs can vary greatly depending on location and household needs.
In 2022, household costs in Avoyelles Parish were well above the Federal Poverty Level of $13,590 for a single adult and $27,750 for a family of four.
To see costs for different household compositions in Avoyelles Parish, visit UnitedForALICE.org/Household-Budgets/ Louisiana
Households by Income, Avoyelles Parish, 2010–2022
Note: See an interactive version of this data at UnitedForALICE.org/Louisiana Sources: ALICE Threshold, 2010–2022; American Community Survey, 2010–2022
*Wage working full-time required to support this budget For ALICE Survival Budget sources, visit UnitedForALICE.org/Methodology
Household Survival Budget, Avoyelles Parish, 2022
Financial Hardship
is Not Evenly Distributed
Groups with the largest number of households below the ALICE Threshold tend to also be the largest demographic groups. However, when looking at the percentage of each group that is below the ALICE Threshold, some groups are more likely to be ALICE than others. By addressing the disparities in financial hardship by parish demographics, community members can move toward more equitable solutions. Visit UnitedForALICE.org/Louisiana to view more national, state, and parish data.
Household Financial Status by Household Type, Avoyelles Parish, 2022
Sources: ALICE Threshold, 2022; American Community Survey, 2022
Household Financial Status by Race/Ethnicity, Avoyelles Parish, 2022
Note: Asian, Black, and White racial categories are for one race alone. Race and Hispanic ethnicity are overlapping categories. The Asian and Black groups may include Hispanic households; the White group includes only White, non-Hispanic households. The Hispanic ethnic group may include households of any race.
Sources: ALICE Threshold, 2022; American Community Survey, 2022
Avoyelles Parish, 2022
Note: Municipal-level data on this page is 1 or 5-year averages for Incorporated Places (1-year for populations over 65,000 and 5-year for populations under 65,000). Geographies with fewer than 100 households are not included. Therefore, totals will not match the parish-level numbers.
ALICE IN BEAUREGARD PARISH
2022 Point-in-Time Data
Population: 36,553 • Number of Households: 13,587
Median Household Income: $68,525 (state average: $55,416)
Labor Force Participation Rate: 56.9% (state average: 59.4%)
ALICE Households: 24% (state average: 32%) • Households in Poverty: 15% (state average: 19%)
Financial Hardship Over Time
ALICE is an acronym for Asset Limited, Income Constrained, Employed — households that earn more than the Federal Poverty Level, but less than the basic cost of living for the parish (the ALICE Threshold). Households below the ALICE Threshold — ALICE households plus those in poverty — can’t afford the essentials.
Households move below or above the ALICE Threshold as economic factors and circumstances change. This was especially true amid the economic crosscurrents of the COVID-19 pandemic, with higher wages, inflation, and additional pandemic assistance. By 2022, 5,283 households (39%) were below the ALICE Threshold in Beauregard Parish.
The Cost of Basics Outpaces Wages
The Household Survival Budget reflects the minimum cost to live and work in the current economy and includes housing, child care, food, transportation, health care, technology, and taxes. It does not include savings for emergencies or future goals like college or retirement. The Household Survival Budget is calculated at the parish level and by household composition, as costs can vary greatly depending on location and household needs.
In 2022, household costs in Beauregard Parish were well above the Federal Poverty Level of $13,590 for a single adult and $27,750 for a family of four.
To see costs for different household compositions in Beauregard Parish, visit UnitedForALICE.org/Household-Budgets/ Louisiana
Households by Income, Beauregard Parish, 2010–2022
Note: See an interactive version of this data at UnitedForALICE.org/Louisiana Sources: ALICE Threshold, 2010–2022; American Community Survey, 2010–2022
*Wage working full-time required to support this budget For ALICE Survival Budget sources, visit UnitedForALICE.org/Methodology
Household Survival Budget, Beauregard Parish, 2022
Financial Hardship
is Not Evenly Distributed
Groups with the largest number of households below the ALICE Threshold tend to also be the largest demographic groups. However, when looking at the percentage of each group that is below the ALICE Threshold, some groups are more likely to be ALICE than others. By addressing the disparities in financial hardship by parish demographics, community members can move toward more equitable solutions. Visit UnitedForALICE.org/Louisiana to view more national, state, and parish data.
Household Financial Status by Household Type, Beauregard Parish, 2022
Sources: ALICE Threshold, 2022; American Community Survey, 2022
Household Financial Status by Race/Ethnicity, Beauregard Parish, 2022
Note: Asian, Black, and White racial categories are for one race alone. Race and Hispanic ethnicity are overlapping categories. The Asian and Black groups may include Hispanic households; the White group includes only White, non-Hispanic households. The Hispanic ethnic group may include households of any race.
Sources: ALICE Threshold, 2022; American Community Survey, 2022
Beauregard Parish, 2022
Note: Municipal-level data on this page is 1 or 5-year averages for Incorporated Places (1-year for populations over 65,000 and 5-year for populations under 65,000). Geographies with fewer than 100 households are not included. Therefore, totals will not match the parish-level numbers.
ALICE IN BIENVILLE PARISH
2022 Point-in-Time Data
Population: 12,958 • Number of Households: 5,375
Median Household Income: $34,268 (state average: $55,416)
Labor Force Participation Rate: 45.8% (state average: 59.4%)
ALICE Households: 37% (state average: 32%) • Households in Poverty: 27% (state average: 19%)
Financial Hardship Over Time
ALICE is an acronym for Asset Limited, Income Constrained, Employed — households that earn more than the Federal Poverty Level, but less than the basic cost of living for the parish (the ALICE Threshold). Households below the ALICE Threshold — ALICE households plus those in poverty — can’t afford the essentials.
Households move below or above the ALICE Threshold as economic factors and circumstances change. This was especially true amid the economic crosscurrents of the COVID-19 pandemic, with higher wages, inflation, and additional pandemic assistance. By 2022, 3,428 households (64%) were below the ALICE Threshold in Bienville Parish.
The Cost of Basics Outpaces Wages
The Household Survival Budget reflects the minimum cost to live and work in the current economy and includes housing, child care, food, transportation, health care, technology, and taxes. It does not include savings for emergencies or future goals like college or retirement. The Household Survival Budget is calculated at the parish level and by household composition, as costs can vary greatly depending on location and household needs.
In 2022, household costs in Bienville Parish were well above the Federal Poverty Level of $13,590 for a single adult and $27,750 for a family of four.
To see costs for different household compositions in Bienville Parish, visit UnitedForALICE.org/Household-Budgets/ Louisiana
Households by Income, Bienville Parish, 2010–2022
Note: See an interactive version of this data at UnitedForALICE.org/Louisiana
Sources: ALICE Threshold, 2010–2022; American Community Survey, 2010–2022
*Wage working full-time required to support this budget For ALICE Survival Budget sources, visit UnitedForALICE.org/Methodology
Financial
Hardship is Not Evenly Distributed
Groups with the largest number of households below the ALICE Threshold tend to also be the largest demographic groups. However, when looking at the percentage of each group that is below the ALICE Threshold, some groups are more likely to be ALICE than others. By addressing the disparities in financial hardship by parish demographics, community members can move toward more equitable solutions.
Visit UnitedForALICE.org/Louisiana to view more national, state, and parish data.
Household Financial Status by Household Type, Bienville Parish, 2022
Sources: ALICE Threshold, 2022; American Community Survey, 2022
Household Financial Status by Race/Ethnicity, Bienville Parish, 2022
Note: Asian, Black, and White racial categories are for one race alone. Race and Hispanic ethnicity are overlapping categories. The Asian and Black groups may include Hispanic households; the White group includes only White, non-Hispanic households. The Hispanic ethnic group may include households of any race.
Sources: ALICE Threshold, 2022; American Community Survey, 2022
Note: Municipal-level data on this page is 1 or 5-year averages for Incorporated Places (1-year for populations over 65,000 and 5-year for populations under 65,000). Geographies with fewer than 100 households are not included. Therefore, totals will not match the parish-level numbers.
ALICE IN BOSSIER PARISH
2022 Point-in-Time Data
Population: 129,276 • Number of Households: 51,316
Median Household Income: $62,421 (state average: $55,416)
Labor Force Participation Rate: 62.9% (state average: 59.4%)
ALICE Households: 34% (state average: 32%) • Households in Poverty: 12% (state average: 19%)
Financial Hardship Over Time
ALICE is an acronym for Asset Limited, Income Constrained, Employed — households that earn more than the Federal Poverty Level, but less than the basic cost of living for the parish (the ALICE Threshold). Households below the ALICE Threshold — ALICE households plus those in poverty — can’t afford the essentials.
Households move below or above the ALICE Threshold as economic factors and circumstances change. This was especially true amid the economic crosscurrents of the COVID-19 pandemic, with higher wages, inflation, and additional pandemic assistance. By 2022, 23,576 households (46%) were below the ALICE Threshold in Bossier Parish.
The Cost of Basics Outpaces Wages
The Household Survival Budget reflects the minimum cost to live and work in the current economy and includes housing, child care, food, transportation, health care, technology, and taxes. It does not include savings for emergencies or future goals like college or retirement. The Household Survival Budget is calculated at the parish level and by household composition, as costs can vary greatly depending on location and household needs.
In 2022, household costs in Bossier Parish were well above the Federal Poverty Level of $13,590 for a single adult and $27,750 for a family of four.
To see costs for different household compositions in Bossier Parish, visit UnitedForALICE.org/Household-Budgets/ Louisiana
Households by Income, Bossier Parish, 2010–2022
Note: See an interactive version of this data at UnitedForALICE.org/Louisiana Sources: ALICE Threshold, 2010–2022; American Community Survey, 2010–2022
*Wage working full-time required to support this budget For ALICE Survival Budget sources, visit UnitedForALICE.org/Methodology
Household Survival Budget, Bossier Parish, 2022
Financial Hardship
is Not Evenly Distributed
Groups with the largest number of households below the ALICE Threshold tend to also be the largest demographic groups. However, when looking at the percentage of each group that is below the ALICE Threshold, some groups are more likely to be ALICE than others. By addressing the disparities in financial hardship by parish demographics, community members can move toward more equitable solutions. Visit UnitedForALICE.org/Louisiana to view more national, state, and parish data.
Household Financial Status by Household Type, Bossier Parish, 2022
Sources: ALICE Threshold, 2022; American Community Survey, 2022
Household Financial Status by Race/Ethnicity, Bossier Parish, 2022
Note: Asian, Black, and White racial categories are for one race alone. Race and Hispanic ethnicity are overlapping categories. The Asian and Black groups may include Hispanic households; the White group includes only White, non-Hispanic households. The Hispanic ethnic group may include households of any race.
Sources: ALICE Threshold, 2022; American Community Survey, 2022
Note: Municipal-level data on this page is 1 or 5-year averages for Incorporated Places (1-year for populations over 65,000 and 5-year for populations under 65,000). Geographies with fewer than 100 households are not included. Therefore, totals will not match the parish-level numbers.
ALICE IN CADDO PARISH
2022 Point-in-Time Data
Population: 229,025 • Number of Households: 95,772
Median Household Income: $46,967 (state average: $55,416)
Labor Force Participation Rate: 59.1% (state average: 59.4%)
ALICE Households: 34% (state average: 32%) • Households in Poverty: 23% (state average: 19%)
Financial Hardship Over Time
ALICE is an acronym for Asset Limited, Income Constrained, Employed — households that earn more than the Federal Poverty Level, but less than the basic cost of living for the parish (the ALICE Threshold). Households below the ALICE Threshold — ALICE households plus those in poverty — can’t afford the essentials.
Households move below or above the ALICE Threshold as economic factors and circumstances change. This was especially true amid the economic crosscurrents of the COVID-19 pandemic, with higher wages, inflation, and additional pandemic assistance. By 2022, 54,379 households (57%) were below the ALICE Threshold in Caddo Parish.
The Cost of Basics Outpaces Wages
The Household Survival Budget reflects the minimum cost to live and work in the current economy and includes housing, child care, food, transportation, health care, technology, and taxes. It does not include savings for emergencies or future goals like college or retirement. The Household Survival Budget is calculated at the parish level and by household composition, as costs can vary greatly depending on location and household needs.
In 2022, household costs in Caddo Parish were well above the Federal Poverty Level of $13,590 for a single adult and $27,750 for a family of four.
To see costs for different household compositions in Caddo Parish, visit UnitedForALICE.org/Household-Budgets/ Louisiana
Households by Income, Caddo Parish, 2010–2022
Note: See an interactive version of this data at UnitedForALICE.org/Louisiana Sources: ALICE Threshold, 2010–2022; American Community Survey, 2010–2022
*Wage working full-time required to support this budget For ALICE Survival Budget sources, visit UnitedForALICE.org/Methodology
Household Survival Budget, Caddo Parish, 2022
Financial Hardship
is Not Evenly Distributed
Groups with the largest number of households below the ALICE Threshold tend to also be the largest demographic groups. However, when looking at the percentage of each group that is below the ALICE Threshold, some groups are more likely to be ALICE than others. By addressing the disparities in financial hardship by parish demographics, community members can move toward more equitable solutions. Visit UnitedForALICE.org/Louisiana to view more national, state, and parish data.
Household Financial Status by Household Type, Caddo Parish, 2022
Sources: ALICE Threshold, 2022; American Community Survey, 2022
Household Financial Status by Race/Ethnicity, Caddo Parish, 2022
Note: Asian, Black, and White racial categories are for one race alone. Race and Hispanic ethnicity are overlapping categories. The Asian and Black groups may include Hispanic households; the White group includes only White, non-Hispanic households. The Hispanic ethnic group may include households of any race.
Sources: ALICE Threshold, 2022; American Community Survey, 2022
Note: Municipal-level data on this page is 1 or 5-year averages for Incorporated Places (1-year for populations over 65,000 and 5-year for populations under 65,000). Geographies with fewer than 100 households are not included. Therefore, totals will not match the parish-level numbers.
Caddo Parish, 2022
ALICE IN CALCASIEU PARISH
2022 Point-in-Time Data
Population: 202,418 • Number of Households: 78,144
Median Household Income: $62,197 (state average: $55,416)
Labor Force Participation Rate: 59.2% (state average: 59.4%)
ALICE Households: 26% (state average: 32%) • Households in Poverty: 18% (state average: 19%)
Financial Hardship Over Time
ALICE is an acronym for Asset Limited, Income Constrained, Employed — households that earn more than the Federal Poverty Level, but less than the basic cost of living for the parish (the ALICE Threshold). Households below the ALICE Threshold — ALICE households plus those in poverty — can’t afford the essentials.
Households move below or above the ALICE Threshold as economic factors and circumstances change. This was especially true amid the economic crosscurrents of the COVID-19 pandemic, with higher wages, inflation, and additional pandemic assistance. By 2022, 34,185 households (44%) were below the ALICE Threshold in Calcasieu Parish.
The Cost of Basics Outpaces Wages
The Household Survival Budget reflects the minimum cost to live and work in the current economy and includes housing, child care, food, transportation, health care, technology, and taxes. It does not include savings for emergencies or future goals like college or retirement. The Household Survival Budget is calculated at the parish level and by household composition, as costs can vary greatly depending on location and household needs.
In 2022, household costs in Calcasieu Parish were well above the Federal Poverty Level of $13,590 for a single adult and $27,750 for a family of four.
To see costs for different household compositions in Calcasieu Parish, visit UnitedForALICE.org/Household-Budgets/ Louisiana
Households by Income, Calcasieu Parish, 2010–2022
Note: See an interactive version of this data at UnitedForALICE.org/Louisiana
Sources: ALICE Threshold, 2010–2022; American Community Survey, 2010–2022
*Wage working full-time required to support this budget For ALICE Survival Budget sources, visit UnitedForALICE.org/Methodology
Household Survival Budget, Calcasieu Parish, 2022
Financial Hardship
is Not Evenly Distributed
Groups with the largest number of households below the ALICE Threshold tend to also be the largest demographic groups. However, when looking at the percentage of each group that is below the ALICE Threshold, some groups are more likely to be ALICE than others. By addressing the disparities in financial hardship by parish demographics, community members can move toward more equitable solutions. Visit UnitedForALICE.org/Louisiana to view more national, state, and parish data.
Household Financial Status by Household Type, Calcasieu Parish, 2022
Sources: ALICE Threshold, 2022; American Community Survey, 2022
Household Financial Status by Race/Ethnicity, Calcasieu Parish, 2022
Note: Asian, Black, and White racial categories are for one race alone. Race and Hispanic ethnicity are overlapping categories. The Asian and Black groups may include Hispanic households; the White group includes only White, non-Hispanic households. The Hispanic ethnic group may include households of any race.
Sources: ALICE Threshold, 2022; American Community Survey, 2022
Note: Municipal-level data on this page is 1 or 5-year averages for Incorporated Places (1-year for populations over 65,000 and 5-year for populations under 65,000). Geographies with fewer than 100 households are not included. Therefore, totals will not match the parish-level numbers.
Calcasieu Parish, 2022
ALICE IN CALDWELL PARISH
2022 Point-in-Time Data
Population: 9,658 • Number of Households: 3,521
Median Household Income: $45,707 (state average: $55,416)
Labor Force Participation Rate: 47.3% (state average: 59.4%)
ALICE Households: 30% (state average: 32%) • Households in Poverty: 26% (state average: 19%)
Financial Hardship Over Time
ALICE is an acronym for Asset Limited, Income Constrained, Employed — households that earn more than the Federal Poverty Level, but less than the basic cost of living for the parish (the ALICE Threshold). Households below the ALICE Threshold — ALICE households plus those in poverty — can’t afford the essentials.
Households move below or above the ALICE Threshold as economic factors and circumstances change. This was especially true amid the economic crosscurrents of the COVID-19 pandemic, with higher wages, inflation, and additional pandemic assistance. By 2022, 1,950 households (55%) were below the ALICE Threshold in Caldwell Parish.
The Cost of Basics Outpaces Wages
The Household Survival Budget reflects the minimum cost to live and work in the current economy and includes housing, child care, food, transportation, health care, technology, and taxes. It does not include savings for emergencies or future goals like college or retirement. The Household Survival Budget is calculated at the parish level and by household composition, as costs can vary greatly depending on location and household needs.
In 2022, household costs in Caldwell Parish were well above the Federal Poverty Level of $13,590 for a single adult and $27,750 for a family of four.
To see costs for different household compositions in Caldwell Parish, visit UnitedForALICE.org/Household-Budgets/ Louisiana
Households by Income, Caldwell Parish, 2010–2022
Note: See an interactive version of this data at UnitedForALICE.org/Louisiana
Sources: ALICE Threshold, 2010–2022; American Community Survey, 2010–2022
*Wage working full-time required to support this budget For ALICE Survival Budget sources, visit UnitedForALICE.org/Methodology
Household Survival Budget, Caldwell Parish, 2022
Financial Hardship is Not Evenly Distributed
Groups with the largest number of households below the ALICE Threshold tend to also be the largest demographic groups. However, when looking at the percentage of each group that is below the ALICE Threshold, some groups are more likely to be ALICE than others. By addressing the disparities in financial hardship by parish demographics, community members can move toward more equitable solutions.
Visit UnitedForALICE.org/Louisiana to view more national, state, and parish data.
Household Financial Status by Household Type, Caldwell Parish, 2022
Sources: ALICE Threshold, 2022; American Community Survey, 2022
Household Financial Status by Race/Ethnicity, Caldwell Parish, 2022
Note: Asian, Black, and White racial categories are for one race alone. Race and Hispanic ethnicity are overlapping categories. The Asian and Black groups may include Hispanic households; the White group includes only White, non-Hispanic households. The Hispanic ethnic group may include households of any race.
Sources: ALICE Threshold, 2022; American Community Survey, 2022
Note: Municipal-level data on this page is 1 or 5-year averages for Incorporated Places (1-year for populations over 65,000 and 5-year for populations under 65,000). Geographies with fewer than 100 households are not included. Therefore, totals will not match the parish-level numbers.
Caldwell Parish, 2022
ALICE IN CAMERON PARISH
2022 Point-in-Time Data
Population: 5,447 • Number of Households: 2,166
Median Household Income: $69,847 (state average: $55,416)
Labor Force Participation Rate: 59.5% (state average: 59.4%)
ALICE Households: 31% (state average: 32%) • Households in Poverty: 8% (state average: 19%)
Financial Hardship Over Time
ALICE is an acronym for Asset Limited, Income Constrained, Employed — households that earn more than the Federal Poverty Level, but less than the basic cost of living for the parish (the ALICE Threshold). Households below the ALICE Threshold — ALICE households plus those in poverty — can’t afford the essentials.
Households move below or above the ALICE Threshold as economic factors and circumstances change. This was especially true amid the economic crosscurrents of the COVID-19 pandemic, with higher wages, inflation, and additional pandemic assistance. By 2022, 861 households (40%) were below the ALICE Threshold in Cameron Parish.
The Cost of Basics Outpaces Wages
The Household Survival Budget reflects the minimum cost to live and work in the current economy and includes housing, child care, food, transportation, health care, technology, and taxes. It does not include savings for emergencies or future goals like college or retirement. The Household Survival Budget is calculated at the parish level and by household composition, as costs can vary greatly depending on location and household needs.
In 2022, household costs in Cameron Parish were well above the Federal Poverty Level of $13,590 for a single adult and $27,750 for a family of four.
To see costs for different household compositions in Cameron Parish, visit UnitedForALICE.org/Household-Budgets/ Louisiana
Households by Income, Cameron Parish, 2010–2022
Note: See an interactive version of this data at UnitedForALICE.org/Louisiana
Sources: ALICE Threshold, 2010–2022; American Community Survey, 2010–2022
*Wage working full-time required to support this budget For ALICE Survival Budget sources, visit UnitedForALICE.org/Methodology
Household Survival Budget, Cameron Parish, 2022
Financial Hardship is Not Evenly Distributed
Groups with the largest number of households below the ALICE Threshold tend to also be the largest demographic groups. However, when looking at the percentage of each group that is below the ALICE Threshold, some groups are more likely to be ALICE than others. By addressing the disparities in financial hardship by parish demographics, community members can move toward more equitable solutions. Visit UnitedForALICE.org/Louisiana to view more national, state, and parish data.
Household Financial Status by Household Type, Cameron Parish, 2022
Sources: ALICE Threshold, 2022; American Community Survey, 2022
Household Financial Status by Race/Ethnicity, Cameron Parish, 2022
Note: Asian, Black, and White racial categories are for one race alone. Race and Hispanic ethnicity are overlapping categories. The Asian and Black groups may include Hispanic households; the White group includes only White, non-Hispanic households. The Hispanic ethnic group may include households of any race.
Sources: ALICE Threshold, 2022; American Community Survey, 2022
Note: Municipal-level data on this page is 1 or 5-year averages for Incorporated Places (1-year for populations over 65,000 and 5-year for populations under 65,000). Geographies with fewer than 100 households are not included. Therefore, totals will not match the parish-level numbers.
Cameron Parish, 2022
ALICE IN CATAHOULA PARISH
2022 Point-in-Time Data
Population: 8,895 • Number of Households: 3,030
Median Household Income: $48,259 (state average: $55,416)
Labor Force Participation Rate: 43.6% (state average: 59.4%)
ALICE Households: 29% (state average: 32%) • Households in Poverty: 23% (state average: 19%)
Financial Hardship Over Time
ALICE is an acronym for Asset Limited, Income Constrained, Employed — households that earn more than the Federal Poverty Level, but less than the basic cost of living for the parish (the ALICE Threshold). Households below the ALICE Threshold — ALICE households plus those in poverty — can’t afford the essentials.
Households move below or above the ALICE Threshold as economic factors and circumstances change. This was especially true amid the economic crosscurrents of the COVID-19 pandemic, with higher wages, inflation, and additional pandemic assistance. By 2022, 1,586 households (52%) were below the ALICE Threshold in Catahoula Parish.
The Cost of Basics
Outpaces Wages
The Household Survival Budget reflects the minimum cost to live and work in the current economy and includes housing, child care, food, transportation, health care, technology, and taxes. It does not include savings for emergencies or future goals like college or retirement. The Household Survival Budget is calculated at the parish level and by household composition, as costs can vary greatly depending on location and household needs.
In 2022, household costs in Catahoula Parish were well above the Federal Poverty Level of $13,590 for a single adult and $27,750 for a family of four.
To see costs for different household compositions in Catahoula Parish, visit UnitedForALICE.org/Household-Budgets/ Louisiana
Households by Income, Catahoula Parish, 2010–2022
Note: See an interactive version of this data at UnitedForALICE.org/Louisiana
Sources: ALICE Threshold, 2010–2022; American Community Survey, 2010–2022
*Wage working full-time required to support this budget For ALICE Survival Budget sources, visit UnitedForALICE.org/Methodology
Financial Hardship is
Not Evenly Distributed
Groups with the largest number of households below the ALICE Threshold tend to also be the largest demographic groups. However, when looking at the percentage of each group that is below the ALICE Threshold, some groups are more likely to be ALICE than others. By addressing the disparities in financial hardship by parish demographics, community members can move toward more equitable solutions. Visit UnitedForALICE.org/Louisiana to view more national, state, and parish data.
Household Financial Status by Household Type, Catahoula Parish, 2022

Sources: ALICE Threshold, 2022; American Community Survey, 2022
Household Financial Status by Race/Ethnicity, Catahoula Parish, 2022
Note: Asian, Black, and White racial categories are for one race alone. Race and Hispanic ethnicity are overlapping categories. The Asian and Black groups may include Hispanic households; the White group includes only White, non-Hispanic households. The Hispanic ethnic group may include households of any race.
Sources: ALICE Threshold, 2022; American Community Survey, 2022
Note: Municipal-level data on this page is 1 or 5-year averages for Incorporated Places (1-year for populations over 65,000 and 5-year for populations under 65,000). Geographies with fewer than 100 households are not included. Therefore, totals will not match the parish-level numbers.
Catahoula Parish, 2022
ALICE IN CLAIBORNE PARISH
2022 Point-in-Time Data
Population: 14,203 • Number of Households: 5,060
Median Household Income: $32,034 (state average: $55,416)
Labor Force Participation Rate: 38.4% (state average: 59.4%)
ALICE Households: 40% (state average: 32%) • Households in Poverty: 32% (state average: 19%)
Financial Hardship Over Time
ALICE is an acronym for Asset Limited, Income Constrained, Employed — households that earn more than the Federal Poverty Level, but less than the basic cost of living for the parish (the ALICE Threshold). Households below the ALICE Threshold — ALICE households plus those in poverty — can’t afford the essentials.
Households move below or above the ALICE Threshold as economic factors and circumstances change. This was especially true amid the economic crosscurrents of the COVID-19 pandemic, with higher wages, inflation, and additional pandemic assistance. By 2022, 3,665 households (72%) were below the ALICE Threshold in Claiborne Parish.
The Cost of Basics Outpaces Wages
The Household Survival Budget reflects the minimum cost to live and work in the current economy and includes housing, child care, food, transportation, health care, technology, and taxes. It does not include savings for emergencies or future goals like college or retirement. The Household Survival Budget is calculated at the parish level and by household composition, as costs can vary greatly depending on location and household needs.
In 2022, household costs in Claiborne Parish were well above the Federal Poverty Level of $13,590 for a single adult and $27,750 for a family of four.
To see costs for different household compositions in Claiborne Parish, visit UnitedForALICE.org/Household-Budgets/ Louisiana
Households by Income, Claiborne Parish, 2010–2022
Note: See an interactive version of this data at UnitedForALICE.org/Louisiana
Sources: ALICE Threshold, 2010–2022; American Community Survey, 2010–2022
*Wage working full-time required to support this budget For ALICE Survival Budget sources, visit UnitedForALICE.org/Methodology
Survival Budget, Claiborne Parish, 2022
Financial Hardship is Not Evenly Distributed
Groups with the largest number of households below the ALICE Threshold tend to also be the largest demographic groups. However, when looking at the percentage of each group that is below the ALICE Threshold, some groups are more likely to be ALICE than others. By addressing the disparities in financial hardship by parish demographics, community members can move toward more equitable solutions. Visit UnitedForALICE.org/Louisiana to view more national, state, and parish data.
Household Financial Status by Household Type, Claiborne Parish, 2022
Sources: ALICE Threshold, 2022; American Community Survey, 2022
Household Financial Status by Race/Ethnicity, Claiborne Parish, 2022
Note: Asian, Black, and White racial categories are for one race alone. Race and Hispanic ethnicity are overlapping categories. The Asian and Black groups may include Hispanic households; the White group includes only White, non-Hispanic households. The Hispanic ethnic group may include households of any race.
Sources: ALICE Threshold, 2022; American Community Survey, 2022
Note: Municipal-level data on this page is 1 or 5-year averages for Incorporated Places (1-year for populations over 65,000 and 5-year for populations under 65,000). Geographies with fewer than 100 households are not included. Therefore, totals will not match the parish-level numbers.
Claiborne Parish, 2022
ALICE IN CONCORDIA PARISH
2022 Point-in-Time Data
Population: 18,677 • Number of Households: 6,302
Median Household Income: $38,929 (state average: $55,416)
Labor Force Participation Rate: 41.7% (state average: 59.4%)
ALICE Households: 35% (state average: 32%) • Households in Poverty: 29% (state average: 19%)
Financial Hardship Over Time
ALICE is an acronym for Asset Limited, Income Constrained, Employed — households that earn more than the Federal Poverty Level, but less than the basic cost of living for the parish (the ALICE Threshold). Households below the ALICE Threshold — ALICE households plus those in poverty — can’t afford the essentials.
Households move below or above the ALICE Threshold as economic factors and circumstances change. This was especially true amid the economic crosscurrents of the COVID-19 pandemic, with higher wages, inflation, and additional pandemic assistance. By 2022, 3,987 households (63%) were below the ALICE Threshold in Concordia Parish.
The Cost of Basics Outpaces Wages
The Household Survival Budget reflects the minimum cost to live and work in the current economy and includes housing, child care, food, transportation, health care, technology, and taxes. It does not include savings for emergencies or future goals like college or retirement. The Household Survival Budget is calculated at the parish level and by household composition, as costs can vary greatly depending on location and household needs.
In 2022, household costs in Concordia Parish were well above the Federal Poverty Level of $13,590 for a single adult and $27,750 for a family of four.
To see costs for different household compositions in Concordia Parish, visit UnitedForALICE.org/Household-Budgets/ Louisiana
Households by Income, Concordia Parish, 2010–2022
Note: See an interactive version of this data at UnitedForALICE.org/Louisiana
Sources: ALICE Threshold, 2010–2022; American Community Survey, 2010–2022
*Wage working full-time required to support this budget For ALICE Survival Budget sources, visit UnitedForALICE.org/Methodology
Household Survival Budget, Concordia Parish, 2022
Financial Hardship is Not Evenly Distributed
Groups with the largest number of households below the ALICE Threshold tend to also be the largest demographic groups. However, when looking at the percentage of each group that is below the ALICE Threshold, some groups are more likely to be ALICE than others. By addressing the disparities in financial hardship by parish demographics, community members can move toward more equitable solutions. Visit UnitedForALICE.org/Louisiana to view more national, state, and parish data.
Household Financial Status by Household Type, Concordia Parish, 2022

Sources: ALICE Threshold, 2022; American Community Survey, 2022
Household Financial Status by Race/Ethnicity, Concordia Parish, 2022
Note: Asian, Black, and White racial categories are for one race alone. Race and Hispanic ethnicity are overlapping categories. The Asian and Black groups may include Hispanic households; the White group includes only White, non-Hispanic households. The Hispanic ethnic group may include households of any race.
Sources: ALICE Threshold, 2022; American Community Survey, 2022
Note: Municipal-level data on this page is 1 or 5-year averages for Incorporated Places (1-year for populations over 65,000 and 5-year for populations under 65,000). Geographies with fewer than 100 households are not included. Therefore, totals will not match the parish-level numbers.
Concordia Parish, 2022
ALICE IN DE SOTO PARISH
2022 Point-in-Time Data
Population: 26,821 • Number of Households: 10,235
Median Household Income: $49,807 (state average: $55,416)
Labor Force Participation Rate: 52.4% (state average: 59.4%)
ALICE Households: 33% (state average: 32%) • Households in Poverty: 21% (state average: 19%)
Financial Hardship Over Time
ALICE is an acronym for Asset Limited, Income Constrained, Employed — households that earn more than the Federal Poverty Level, but less than the basic cost of living for the parish (the ALICE Threshold). Households below the ALICE Threshold — ALICE households plus those in poverty — can’t afford the essentials.
Households move below or above the ALICE Threshold as economic factors and circumstances change. This was especially true amid the economic crosscurrents of the COVID-19 pandemic, with higher wages, inflation, and additional pandemic assistance. By 2022, 5,567 households (54%) were below the ALICE Threshold in De Soto Parish.
The Cost of Basics
Outpaces Wages
The Household Survival Budget reflects the minimum cost to live and work in the current economy and includes housing, child care, food, transportation, health care, technology, and taxes. It does not include savings for emergencies or future goals like college or retirement. The Household Survival Budget is calculated at the parish level and by household composition, as costs can vary greatly depending on location and household needs.
In 2022, household costs in De Soto Parish were well above the Federal Poverty Level of $13,590 for a single adult and $27,750 for a family of four.
To see costs for different household compositions in De Soto Parish, visit UnitedForALICE.org/Household-Budgets/ Louisiana
Households by Income, De Soto Parish, 2010–2022
Note: See an interactive version of this data at UnitedForALICE.org/Louisiana Sources: ALICE Threshold, 2010–2022; American Community Survey, 2010–2022
*Wage working full-time required to support this budget For ALICE Survival Budget sources, visit UnitedForALICE.org/Methodology
Survival Budget, De Soto Parish,
Financial Hardship
is Not Evenly Distributed
Groups with the largest number of households below the ALICE Threshold tend to also be the largest demographic groups. However, when looking at the percentage of each group that is below the ALICE Threshold, some groups are more likely to be ALICE than others. By addressing the disparities in financial hardship by parish demographics, community members can move toward more equitable solutions. Visit UnitedForALICE.org/Louisiana to view more national, state, and parish data.
Household Financial Status by Household Type, De Soto Parish, 2022
Sources: ALICE Threshold, 2022; American Community Survey, 2022
Household Financial Status by Race/Ethnicity, De Soto Parish, 2022
Note: Asian, Black, and White racial categories are for one race alone. Race and Hispanic ethnicity are overlapping categories. The Asian and Black groups may include Hispanic households; the White group includes only White, non-Hispanic households. The Hispanic ethnic group may include households of any race.
Sources: ALICE Threshold, 2022; American Community Survey, 2022
De Soto Parish, 2022
Note: Municipal-level data on this page is 1 or 5-year averages for Incorporated Places (1-year for populations over 65,000 and 5-year for populations under 65,000). Geographies with fewer than 100 households are not included. Therefore, totals will not match the parish-level numbers.
ALICE IN EAST BATON ROUGE PARISH
2022 Point-in-Time Data
Population: 450,544 • Number of Households: 180,749
Median Household Income: $61,387 (state average: $55,416)
Labor Force Participation Rate: 64.3% (state average: 59.4%)
ALICE Households: 31% (state average: 32%) • Households in Poverty: 19% (state average: 19%)
Financial Hardship Over Time
ALICE is an acronym for Asset Limited, Income Constrained, Employed — households that earn more than the Federal Poverty Level, but less than the basic cost of living for the parish (the ALICE Threshold). Households below the ALICE Threshold — ALICE households plus those in poverty — can’t afford the essentials.
Households move below or above the ALICE Threshold as economic factors and circumstances change. This was especially true amid the economic crosscurrents of the COVID-19 pandemic, with higher wages, inflation, and additional pandemic assistance. By 2022, 89,677 households (50%) were below the ALICE Threshold in East Baton Rouge Parish.
The Cost of Basics
Outpaces Wages
The Household Survival Budget reflects the minimum cost to live and work in the current economy and includes housing, child care, food, transportation, health care, technology, and taxes. It does not include savings for emergencies or future goals like college or retirement. The Household Survival Budget is calculated at the parish level and by household composition, as costs can vary greatly depending on location and household needs.
In 2022, household costs in East Baton Rouge Parish were well above the Federal Poverty Level of $13,590 for a single adult and $27,750 for a family of four.
To see costs for different household compositions in East Baton Rouge Parish, visit UnitedForALICE.org/HouseholdBudgets/Louisiana
Households by Income, East Baton Rouge Parish, 2010–2022
Note: See an interactive version of this data at UnitedForALICE.org/Louisiana
Sources: ALICE Threshold, 2010–2022; American Community Survey, 2010–2022
*Wage working full-time required to support this budget For ALICE Survival Budget sources, visit UnitedForALICE.org/Methodology
Household Survival Budget, East Baton Rouge Parish, 2022
Financial Hardship
is Not Evenly Distributed
Groups with the largest number of households below the ALICE Threshold tend to also be the largest demographic groups. However, when looking at the percentage of each group that is below the ALICE Threshold, some groups are more likely to be ALICE than others. By addressing the disparities in financial hardship by parish demographics, community members can move toward more equitable solutions. Visit UnitedForALICE.org/Louisiana to view more national, state, and parish data.
Household Financial Status by Household Type, East Baton Rouge Parish, 2022
Sources: ALICE Threshold, 2022; American Community Survey, 2022
Household Financial Status by Race/Ethnicity, East Baton Rouge Parish, 2022
Note: Asian, Black, and White racial categories are for one race alone. Race and Hispanic ethnicity are overlapping categories. The Asian and Black groups may include Hispanic households; the White group includes only White, non-Hispanic households. The Hispanic ethnic group may include households of any race.
Sources: ALICE Threshold, 2022; American Community Survey, 2022
Note: Municipal-level data on this page is 1 or 5-year averages for Incorporated Places (1-year for populations over 65,000 and 5-year for populations under 65,000). Geographies with fewer than 100 households are not included. Therefore, totals will not match the parish-level numbers.
East Baton Rouge Parish, 2022
ALICE IN EAST CARROLL PARISH
2022 Point-in-Time Data
Population: 7,371 • Number of Households: 2,381
Median Household Income: $30,856 (state average: $55,416)
Labor Force Participation Rate: 33.6% (state average: 59.4%)
ALICE Households: 35% (state average: 32%) • Households in Poverty: 36% (state average: 19%)
Financial Hardship Over Time
ALICE is an acronym for Asset Limited, Income Constrained, Employed — households that earn more than the Federal Poverty Level, but less than the basic cost of living for the parish (the ALICE Threshold). Households below the ALICE Threshold — ALICE households plus those in poverty — can’t afford the essentials.
Households move below or above the ALICE Threshold as economic factors and circumstances change. This was especially true amid the economic crosscurrents of the COVID-19 pandemic, with higher wages, inflation, and additional pandemic assistance. By 2022, 1,697 households (71%) were below the ALICE Threshold in East Carroll Parish.
The Cost of Basics Outpaces Wages
The Household Survival Budget reflects the minimum cost to live and work in the current economy and includes housing, child care, food, transportation, health care, technology, and taxes. It does not include savings for emergencies or future goals like college or retirement. The Household Survival Budget is calculated at the parish level and by household composition, as costs can vary greatly depending on location and household needs.
In 2022, household costs in East Carroll Parish were well above the Federal Poverty Level of $13,590 for a single adult and $27,750 for a family of four.
To see costs for different household compositions in East Carroll Parish, visit UnitedForALICE.org/Household-Budgets/ Louisiana
Households by Income, East Carroll Parish, 2010–2022
Note: See an interactive version of this data at UnitedForALICE.org/Louisiana
Sources: ALICE Threshold, 2010–2022; American Community Survey, 2010–2022
*Wage working full-time required to support this budget For ALICE Survival Budget sources, visit UnitedForALICE.org/Methodology
Household Survival Budget, East Carroll Parish,
Financial Hardship is
Not Evenly Distributed
Groups with the largest number of households below the ALICE Threshold tend to also be the largest demographic groups. However, when looking at the percentage of each group that is below the ALICE Threshold, some groups are more likely to be ALICE than others. By addressing the disparities in financial hardship by parish demographics, community members can move toward more equitable solutions.
Visit UnitedForALICE.org/Louisiana to view more national, state, and parish data.
Household Financial Status by Household Type, East Carroll Parish, 2022

Sources: ALICE Threshold, 2022; American Community Survey, 2022
Household Financial Status by Race/Ethnicity, East Carroll Parish, 2022
Note: Asian, Black, and White racial categories are for one race alone. Race and Hispanic ethnicity are overlapping categories. The Asian and Black groups may include Hispanic households; the White group includes only White, non-Hispanic households. The Hispanic ethnic group may include households of any race.
Sources: ALICE Threshold, 2022; American Community Survey, 2022
Note: Municipal-level data on this page is 1 or 5-year averages for Incorporated Places (1-year for populations over 65,000 and 5-year for populations under 65,000). Geographies with fewer than 100 households are not included. Therefore, totals will not match the parish-level numbers.
East Carroll Parish, 2022
ALICE IN EAST FELICIANA PARISH
2022 Point-in-Time Data
Population: 19,452 • Number of Households: 6,613
Median Household Income: $64,709 (state average: $55,416)
Labor Force Participation Rate: 42.5% (state average: 59.4%)
ALICE Households: 34% (state average: 32%) • Households in Poverty: 14% (state average: 19%)
Financial Hardship Over Time
ALICE is an acronym for Asset Limited, Income Constrained, Employed — households that earn more than the Federal Poverty Level, but less than the basic cost of living for the parish (the ALICE Threshold). Households below the ALICE Threshold — ALICE households plus those in poverty — can’t afford the essentials.
Households move below or above the ALICE Threshold as economic factors and circumstances change. This was especially true amid the economic crosscurrents of the COVID-19 pandemic, with higher wages, inflation, and additional pandemic assistance. By 2022, 3,166 households (48%) were below the ALICE Threshold in East Feliciana Parish.
The Cost of Basics Outpaces Wages
The Household Survival Budget reflects the minimum cost to live and work in the current economy and includes housing, child care, food, transportation, health care, technology, and taxes. It does not include savings for emergencies or future goals like college or retirement. The Household Survival Budget is calculated at the parish level and by household composition, as costs can vary greatly depending on location and household needs.
In 2022, household costs in East Feliciana Parish were well above the Federal Poverty Level of $13,590 for a single adult and $27,750 for a family of four.
To see costs for different household compositions in East Feliciana Parish, visit UnitedForALICE.org/Household-Budgets/ Louisiana
Households by Income, East Feliciana Parish, 2010–2022
Note: See an interactive version of this data at UnitedForALICE.org/Louisiana Sources: ALICE Threshold, 2010–2022; American Community Survey, 2010–2022
*Wage working full-time required to support this budget For ALICE Survival Budget sources, visit UnitedForALICE.org/Methodology
Household Survival Budget, East Feliciana Parish, 2022
Financial Hardship
is Not Evenly Distributed
Groups with the largest number of households below the ALICE Threshold tend to also be the largest demographic groups. However, when looking at the percentage of each group that is below the ALICE Threshold, some groups are more likely to be ALICE than others. By addressing the disparities in financial hardship by parish demographics, community members can move toward more equitable solutions. Visit UnitedForALICE.org/Louisiana to view more national, state, and parish data.
Household Financial Status by Household Type, East Feliciana Parish, 2022
Sources: ALICE Threshold, 2022; American Community Survey, 2022
Household Financial Status by Race/Ethnicity, East Feliciana Parish, 2022
Note: Asian, Black, and White racial categories are for one race alone. Race and Hispanic ethnicity are overlapping categories. The Asian and Black groups may include Hispanic households; the White group includes only White, non-Hispanic households. The Hispanic ethnic group may include households of any race.
Sources: ALICE Threshold, 2022; American Community Survey, 2022
East Feliciana Parish, 2022
Note: Municipal-level data on this page is 1 or 5-year averages for Incorporated Places (1-year for populations over 65,000 and 5-year for populations under 65,000). Geographies with fewer than 100 households are not included. Therefore, totals will not match the parish-level numbers.
ALICE IN EVANGELINE PARISH
2022 Point-in-Time Data
Population: 32,335 • Number of Households: 12,128
Median Household Income: $34,526 (state average: $55,416)
Labor Force Participation Rate: 52.8% (state average: 59.4%)
ALICE Households: 37% (state average: 32%) • Households in Poverty: 27% (state average: 19%)
Financial Hardship Over Time
ALICE is an acronym for Asset Limited, Income Constrained, Employed — households that earn more than the Federal Poverty Level, but less than the basic cost of living for the parish (the ALICE Threshold). Households below the ALICE Threshold — ALICE households plus those in poverty — can’t afford the essentials.
Households move below or above the ALICE Threshold as economic factors and circumstances change. This was especially true amid the economic crosscurrents of the COVID-19 pandemic, with higher wages, inflation, and additional pandemic assistance. By 2022, 7,785 households (64%) were below the ALICE Threshold in Evangeline Parish.
The Cost of Basics Outpaces Wages
The Household Survival Budget reflects the minimum cost to live and work in the current economy and includes housing, child care, food, transportation, health care, technology, and taxes. It does not include savings for emergencies or future goals like college or retirement. The Household Survival Budget is calculated at the parish level and by household composition, as costs can vary greatly depending on location and household needs.
In 2022, household costs in Evangeline Parish were well above the Federal Poverty Level of $13,590 for a single adult and $27,750 for a family of four.
To see costs for different household compositions in Evangeline Parish, visit UnitedForALICE.org/Household-Budgets/ Louisiana
Households by Income, Evangeline Parish, 2010–2022
Note: See an interactive version of this data at UnitedForALICE.org/Louisiana
Sources: ALICE Threshold, 2010–2022; American Community Survey, 2010–2022
*Wage working full-time required to support this budget For ALICE Survival Budget sources, visit UnitedForALICE.org/Methodology
Survival Budget, Evangeline Parish,
Financial Hardship
is Not Evenly Distributed
Groups with the largest number of households below the ALICE Threshold tend to also be the largest demographic groups. However, when looking at the percentage of each group that is below the ALICE Threshold, some groups are more likely to be ALICE than others. By addressing the disparities in financial hardship by parish demographics, community members can move toward more equitable solutions. Visit UnitedForALICE.org/Louisiana to view more national, state, and parish data.
Household Financial Status by Household Type, Evangeline Parish, 2022
Sources: ALICE Threshold, 2022; American Community Survey, 2022
Household Financial Status by Race/Ethnicity, Evangeline Parish, 2022
Note: Asian, Black, and White racial categories are for one race alone. Race and Hispanic ethnicity are overlapping categories. The Asian and Black groups may include Hispanic households; the White group includes only White, non-Hispanic households. The Hispanic ethnic group may include households of any race.
Sources: ALICE Threshold, 2022; American Community Survey, 2022
Note: Municipal-level data on this page is 1 or 5-year averages for Incorporated Places (1-year for populations over 65,000 and 5-year for populations under 65,000). Geographies with fewer than 100 households are not included. Therefore, totals will not match the parish-level numbers.
ALICE IN FRANKLIN PARISH
2022 Point-in-Time Data
Population: 19,752 • Number of Households: 7,308
Median Household Income: $41,129 (state average: $55,416)
Labor Force Participation Rate: 48.1% (state average: 59.4%)
ALICE Households: 35% (state average: 32%) • Households in Poverty: 24% (state average: 19%)
Financial Hardship Over Time
ALICE is an acronym for Asset Limited, Income Constrained, Employed — households that earn more than the Federal Poverty Level, but less than the basic cost of living for the parish (the ALICE Threshold). Households below the ALICE Threshold — ALICE households plus those in poverty — can’t afford the essentials.
Households move below or above the ALICE Threshold as economic factors and circumstances change. This was especially true amid the economic crosscurrents of the COVID-19 pandemic, with higher wages, inflation, and additional pandemic assistance. By 2022, 4,353 households (60%) were below the ALICE Threshold in Franklin Parish.
The Cost of Basics Outpaces Wages
The Household Survival Budget reflects the minimum cost to live and work in the current economy and includes housing, child care, food, transportation, health care, technology, and taxes. It does not include savings for emergencies or future goals like college or retirement. The Household Survival Budget is calculated at the parish level and by household composition, as costs can vary greatly depending on location and household needs.
In 2022, household costs in Franklin Parish were well above the Federal Poverty Level of $13,590 for a single adult and $27,750 for a family of four.
To see costs for different household compositions in Franklin Parish, visit UnitedForALICE.org/Household-Budgets/ Louisiana
Households by Income, Franklin Parish, 2010–2022
Note: See an interactive version of this data at UnitedForALICE.org/Louisiana
Sources: ALICE Threshold, 2010–2022; American Community Survey, 2010–2022
*Wage working full-time required to support this budget For ALICE Survival Budget sources, visit UnitedForALICE.org/Methodology
Household Survival Budget, Franklin Parish, 2022
Financial Hardship is Not Evenly
Distributed
Groups with the largest number of households below the ALICE Threshold tend to also be the largest demographic groups. However, when looking at the percentage of each group that is below the ALICE Threshold, some groups are more likely to be ALICE than others. By addressing the disparities in financial hardship by parish demographics, community members can move toward more equitable solutions.
Visit UnitedForALICE.org/Louisiana to view more national, state, and parish data.
Household Financial Status by Household Type, Franklin Parish, 2022
Sources: ALICE Threshold, 2022; American Community Survey, 2022
Household Financial Status by Race/Ethnicity, Franklin Parish, 2022
Note: Asian, Black, and White racial categories are for one race alone. Race and Hispanic ethnicity are overlapping categories. The Asian and Black groups may include Hispanic households; the White group includes only White, non-Hispanic households. The Hispanic ethnic group may include households of any race.
Sources: ALICE Threshold, 2022; American Community Survey, 2022
Note: Municipal-level data on this page is 1 or 5-year averages for Incorporated Places (1-year for populations over 65,000 and 5-year for populations under 65,000). Geographies with fewer than 100 households are not included. Therefore, totals will not match the parish-level numbers.
ALICE IN GRANT PARISH
2022 Point-in-Time Data
Population: 22,185 • Number of Households: 6,719
Median Household Income: $57,362 (state average: $55,416)
Labor Force Participation Rate: 44.9% (state average: 59.4%)
ALICE Households: 40% (state average: 32%) • Households in Poverty: 15% (state average: 19%)
Financial Hardship Over Time
ALICE is an acronym for Asset Limited, Income Constrained, Employed — households that earn more than the Federal Poverty Level, but less than the basic cost of living for the parish (the ALICE Threshold). Households below the ALICE Threshold — ALICE households plus those in poverty — can’t afford the essentials.
Households move below or above the ALICE Threshold as economic factors and circumstances change. This was especially true amid the economic crosscurrents of the COVID-19 pandemic, with higher wages, inflation, and additional pandemic assistance. By 2022, 3,703 households (55%) were below the ALICE Threshold in Grant Parish.
The Cost of Basics Outpaces Wages
The Household Survival Budget reflects the minimum cost to live and work in the current economy and includes housing, child care, food, transportation, health care, technology, and taxes. It does not include savings for emergencies or future goals like college or retirement. The Household Survival Budget is calculated at the parish level and by household composition, as costs can vary greatly depending on location and household needs.
In 2022, household costs in Grant Parish were well above the Federal Poverty Level of $13,590 for a single adult and $27,750 for a family of four.
To see costs for different household compositions in Grant Parish, visit UnitedForALICE.org/Household-Budgets/ Louisiana
Households by Income, Grant Parish, 2010–2022
Note: See an interactive version of this data at UnitedForALICE.org/Louisiana
Sources: ALICE Threshold, 2010–2022; American Community Survey, 2010–2022
*Wage working full-time required to support this budget For ALICE Survival Budget sources, visit UnitedForALICE.org/Methodology
Household Survival Budget, Grant Parish, 2022
Financial Hardship is
Not Evenly Distributed
Groups with the largest number of households below the ALICE Threshold tend to also be the largest demographic groups. However, when looking at the percentage of each group that is below the ALICE Threshold, some groups are more likely to be ALICE than others. By addressing the disparities in financial hardship by parish demographics, community members can move toward more equitable solutions.
Visit UnitedForALICE.org/Louisiana to view more national, state, and parish data.
Household Financial Status by Household Type, Grant Parish, 2022
Sources: ALICE Threshold, 2022; American Community Survey, 2022
Household Financial Status by Race/Ethnicity, Grant Parish, 2022
Note: Asian, Black, and White racial categories are for one race alone. Race and Hispanic ethnicity are overlapping categories. The Asian and Black groups may include Hispanic households; the White group includes only White, non-Hispanic households. The Hispanic ethnic group may include households of any race.
Sources: ALICE Threshold, 2022; American Community Survey, 2022
Grant Parish, 2022
Note: Municipal-level data on this page is 1 or 5-year averages for Incorporated Places (1-year for populations over 65,000 and 5-year for populations under 65,000). Geographies with fewer than 100 households are not included. Therefore, totals will not match the parish-level numbers.
ALICE IN IBERIA PARISH
2022 Point-in-Time Data
Population: 68,327 • Number of Households: 28,039
Median Household Income: $43,513 (state average: $55,416)
Labor Force Participation Rate: 58.3% (state average: 59.4%)
ALICE Households: 33% (state average: 32%) • Households in Poverty: 23% (state average: 19%)
Financial Hardship Over Time
ALICE is an acronym for Asset Limited, Income Constrained, Employed — households that earn more than the Federal Poverty Level, but less than the basic cost of living for the parish (the ALICE Threshold). Households below the ALICE Threshold — ALICE households plus those in poverty — can’t afford the essentials.
Households move below or above the ALICE Threshold as economic factors and circumstances change. This was especially true amid the economic crosscurrents of the COVID-19 pandemic, with higher wages, inflation, and additional pandemic assistance. By 2022, 15,573 households (56%) were below the ALICE Threshold in Iberia Parish.
The Cost of Basics Outpaces Wages
The Household Survival Budget reflects the minimum cost to live and work in the current economy and includes housing, child care, food, transportation, health care, technology, and taxes. It does not include savings for emergencies or future goals like college or retirement. The Household Survival Budget is calculated at the parish level and by household composition, as costs can vary greatly depending on location and household needs.
In 2022, household costs in Iberia Parish were well above the Federal Poverty Level of $13,590 for a single adult and $27,750 for a family of four.
To see costs for different household compositions in Iberia Parish, visit UnitedForALICE.org/Household-Budgets/ Louisiana
Households by Income, Iberia Parish, 2010–2022
Note: See an interactive version of this data at UnitedForALICE.org/Louisiana Sources: ALICE Threshold, 2010–2022; American Community Survey, 2010–2022
*Wage working full-time required to support this budget For ALICE Survival Budget sources, visit UnitedForALICE.org/Methodology
Household Survival Budget, Iberia Parish, 2022
Financial Hardship
is Not Evenly Distributed
Groups with the largest number of households below the ALICE Threshold tend to also be the largest demographic groups. However, when looking at the percentage of each group that is below the ALICE Threshold, some groups are more likely to be ALICE than others. By addressing the disparities in financial hardship by parish demographics, community members can move toward more equitable solutions. Visit UnitedForALICE.org/Louisiana to view more national, state, and parish data.
Household Financial Status by Household Type, Iberia Parish, 2022
Sources: ALICE Threshold, 2022; American Community Survey, 2022
Household Financial Status by Race/Ethnicity, Iberia Parish, 2022
Note: Asian, Black, and White racial categories are for one race alone. Race and Hispanic ethnicity are overlapping categories. The Asian and Black groups may include Hispanic households; the White group includes only White, non-Hispanic households. The Hispanic ethnic group may include households of any race.
Sources: ALICE Threshold, 2022; American Community Survey, 2022
Note: Municipal-level data on this page is 1 or 5-year averages for Incorporated Places (1-year for populations over 65,000 and 5-year for populations under 65,000). Geographies with fewer than 100 households are not included. Therefore, totals will not match the parish-level numbers.
Iberia
ALICE IN IBERVILLE PARISH
2022 Point-in-Time Data
Population: 30,210 • Number of Households: 11,042
Median Household Income: $59,410 (state average: $55,416)
Labor Force Participation Rate: 54% (state average: 59.4%)
ALICE Households: 29% (state average: 32%) • Households in Poverty: 18% (state average: 19%)
Financial Hardship Over Time
ALICE is an acronym for Asset Limited, Income Constrained, Employed — households that earn more than the Federal Poverty Level, but less than the basic cost of living for the parish (the ALICE Threshold). Households below the ALICE Threshold — ALICE households plus those in poverty — can’t afford the essentials.
Households move below or above the ALICE Threshold as economic factors and circumstances change. This was especially true amid the economic crosscurrents of the COVID-19 pandemic, with higher wages, inflation, and additional pandemic assistance. By 2022, 5,149 households (47%) were below the ALICE Threshold in Iberville Parish.
The Cost of Basics Outpaces Wages
The Household Survival Budget reflects the minimum cost to live and work in the current economy and includes housing, child care, food, transportation, health care, technology, and taxes. It does not include savings for emergencies or future goals like college or retirement. The Household Survival Budget is calculated at the parish level and by household composition, as costs can vary greatly depending on location and household needs.
In 2022, household costs in Iberville Parish were well above the Federal Poverty Level of $13,590 for a single adult and $27,750 for a family of four.
To see costs for different household compositions in Iberville Parish, visit UnitedForALICE.org/Household-Budgets/ Louisiana
Households by Income, Iberville Parish, 2010–2022
Note: See an interactive version of this data at UnitedForALICE.org/Louisiana Sources: ALICE Threshold, 2010–2022; American Community Survey, 2010–2022
*Wage working full-time required to support this budget For ALICE Survival Budget sources, visit UnitedForALICE.org/Methodology
Household Survival Budget, Iberville Parish, 2022
Financial Hardship
is Not Evenly Distributed
Groups with the largest number of households below the ALICE Threshold tend to also be the largest demographic groups. However, when looking at the percentage of each group that is below the ALICE Threshold, some groups are more likely to be ALICE than others. By addressing the disparities in financial hardship by parish demographics, community members can move toward more equitable solutions. Visit UnitedForALICE.org/Louisiana to view more national, state, and parish data.
Household Financial Status by Household Type, Iberville Parish, 2022
Sources: ALICE Threshold, 2022; American Community Survey, 2022
Household Financial Status by Race/Ethnicity, Iberville Parish, 2022
Note: Asian, Black, and White racial categories are for one race alone. Race and Hispanic ethnicity are overlapping categories. The Asian and Black groups may include Hispanic households; the White group includes only White, non-Hispanic households. The Hispanic ethnic group may include households of any race.
Sources: ALICE Threshold, 2022; American Community Survey, 2022
Iberville Parish, 2022
Note: Municipal-level data on this page is 1 or 5-year averages for Incorporated Places (1-year for populations over 65,000 and 5-year for populations under 65,000). Geographies with fewer than 100 households are not included. Therefore, totals will not match the parish-level numbers.
ALICE IN JACKSON PARISH
Point-in-Time Data
Population: 15,093 • Number of Households: 5,461
Median Household Income: $40,406 (state average: $55,416)
Labor Force Participation Rate: 42.6% (state average: 59.4%)
ALICE Households: 40% (state average: 32%) • Households in Poverty: 25% (state average: 19%)
Financial Hardship Over Time
ALICE is an acronym for Asset Limited, Income Constrained, Employed — households that earn more than the Federal Poverty Level, but less than the basic cost of living for the parish (the ALICE Threshold). Households below the ALICE Threshold — ALICE households plus those in poverty — can’t afford the essentials.
Households move below or above the ALICE Threshold as economic factors and circumstances change. This was especially true amid the economic crosscurrents of the COVID-19 pandemic, with higher wages, inflation, and additional pandemic assistance. By 2022, 3,525 households (65%) were below the ALICE Threshold in Jackson Parish.
The Cost of Basics Outpaces Wages
The Household Survival Budget reflects the minimum cost to live and work in the current economy and includes housing, child care, food, transportation, health care, technology, and taxes. It does not include savings for emergencies or future goals like college or retirement. The Household Survival Budget is calculated at the parish level and by household composition, as costs can vary greatly depending on location and household needs.
In 2022, household costs in Jackson Parish were well above the Federal Poverty Level of $13,590 for a single adult and $27,750 for a family of four.
To see costs for different household compositions in Jackson Parish, visit UnitedForALICE.org/Household-Budgets/ Louisiana
Households by Income, Jackson Parish, 2010–2022
Note: See an interactive version of this data at UnitedForALICE.org/Louisiana
Sources: ALICE Threshold, 2010–2022; American Community Survey, 2010–2022
*Wage working full-time required to support this budget For ALICE Survival Budget sources, visit UnitedForALICE.org/Methodology
Household Survival Budget, Jackson Parish, 2022
Financial Hardship
is Not Evenly Distributed
Groups with the largest number of households below the ALICE Threshold tend to also be the largest demographic groups. However, when looking at the percentage of each group that is below the ALICE Threshold, some groups are more likely to be ALICE than others. By addressing the disparities in financial hardship by parish demographics, community members can move toward more equitable solutions.
Visit UnitedForALICE.org/Louisiana to view more national, state, and parish data.
Household Financial Status by Household Type, Jackson Parish, 2022
Sources: ALICE Threshold, 2022; American Community Survey, 2022
Household Financial Status by Race/Ethnicity, Jackson Parish, 2022
Note: Asian, Black, and White racial categories are for one race alone. Race and Hispanic ethnicity are overlapping categories. The Asian and Black groups may include Hispanic households; the White group includes only White, non-Hispanic households. The Hispanic ethnic group may include households of any race.
Sources: ALICE Threshold, 2022; American Community Survey, 2022
Note: Municipal-level data on this page is 1 or 5-year averages for Incorporated Places (1-year for populations over 65,000 and 5-year for populations under 65,000). Geographies with fewer than 100 households are not included. Therefore, totals will not match the parish-level numbers.
JACKSON PARISH, LOUISIANA
Jackson Parish, 2022
ALICE IN JEFFERSON PARISH
2022 Point-in-Time Data
Population: 425,884 • Number of Households: 176,925
Median Household Income: $61,397 (state average: $55,416)
Labor Force Participation Rate: 62.9% (state average: 59.4%)
ALICE Households: 32% (state average: 32%) • Households in Poverty: 14% (state average: 19%)
Financial Hardship Over Time
ALICE is an acronym for Asset Limited, Income Constrained, Employed — households that earn more than the Federal Poverty Level, but less than the basic cost of living for the parish (the ALICE Threshold). Households below the ALICE Threshold — ALICE households plus those in poverty — can’t afford the essentials.
Households move below or above the ALICE Threshold as economic factors and circumstances change. This was especially true amid the economic crosscurrents of the COVID-19 pandemic, with higher wages, inflation, and additional pandemic assistance. By 2022, 82,493 households (47%) were below the ALICE Threshold in Jefferson Parish.
The Cost of Basics Outpaces Wages
The Household Survival Budget reflects the minimum cost to live and work in the current economy and includes housing, child care, food, transportation, health care, technology, and taxes. It does not include savings for emergencies or future goals like college or retirement. The Household Survival Budget is calculated at the parish level and by household composition, as costs can vary greatly depending on location and household needs.
In 2022, household costs in Jefferson Parish were well above the Federal Poverty Level of $13,590 for a single adult and $27,750 for a family of four.
To see costs for different household compositions in Jefferson Parish, visit UnitedForALICE.org/Household-Budgets/ Louisiana
Households by Income, Jefferson Parish, 2010–2022
Note: See an interactive version of this data at UnitedForALICE.org/Louisiana
Sources: ALICE Threshold, 2010–2022; American Community Survey, 2010–2022
*Wage working full-time required to support this budget For ALICE Survival Budget sources, visit UnitedForALICE.org/Methodology
Household Survival Budget, Jefferson Parish, 2022
Financial Hardship is Not Evenly
Distributed
Groups with the largest number of households below the ALICE Threshold tend to also be the largest demographic groups. However, when looking at the percentage of each group that is below the ALICE Threshold, some groups are more likely to be ALICE than others. By addressing the disparities in financial hardship by parish demographics, community members can move toward more equitable solutions. Visit UnitedForALICE.org/Louisiana to view more national, state, and parish data.
Household Financial Status by Household Type, Jefferson Parish, 2022
Sources: ALICE Threshold, 2022; American Community Survey, 2022
Household Financial Status by Race/Ethnicity, Jefferson Parish, 2022
Note: Asian, Black, and White racial categories are for one race alone. Race and Hispanic ethnicity are overlapping categories. The Asian and Black groups may include Hispanic households; the White group includes only White, non-Hispanic households. The Hispanic ethnic group may include households of any race.
Sources: ALICE Threshold, 2022; American Community Survey, 2022
Note: Municipal-level data on this page is 1 or 5-year averages for Incorporated Places (1-year for populations over 65,000 and 5-year for populations under 65,000). Geographies with fewer than 100 households are not included. Therefore, totals will not match the parish-level numbers.
ALICE IN JEFFERSON DAVIS PARISH
2022 Point-in-Time Data
Population: 32,277 • Number of Households: 11,682
Median Household Income: $52,470 (state average: $55,416)
Labor Force Participation Rate: 55.1% (state average: 59.4%)
ALICE Households: 35% (state average: 32%) • Households in Poverty: 16% (state average: 19%)
Financial Hardship Over Time
ALICE is an acronym for Asset Limited, Income Constrained, Employed — households that earn more than the Federal Poverty Level, but less than the basic cost of living for the parish (the ALICE Threshold). Households below the ALICE Threshold — ALICE households plus those in poverty — can’t afford the essentials.
Households move below or above the ALICE Threshold as economic factors and circumstances change. This was especially true amid the economic crosscurrents of the COVID-19 pandemic, with higher wages, inflation, and additional pandemic assistance. By 2022, 6,016 households (51%) were below the ALICE Threshold in Jefferson Davis Parish.
The Cost of Basics Outpaces Wages
The Household Survival Budget reflects the minimum cost to live and work in the current economy and includes housing, child care, food, transportation, health care, technology, and taxes. It does not include savings for emergencies or future goals like college or retirement. The Household Survival Budget is calculated at the parish level and by household composition, as costs can vary greatly depending on location and household needs.
In 2022, household costs in Jefferson Davis Parish were well above the Federal Poverty Level of $13,590 for a single adult and $27,750 for a family of four.
To see costs for different household compositions in Jefferson Davis Parish, visit UnitedForALICE.org/HouseholdBudgets/Louisiana
Households by Income, Jefferson Davis Parish, 2010–2022
Note: See an interactive version of this data at UnitedForALICE.org/Louisiana
Sources: ALICE Threshold, 2010–2022; American Community Survey, 2010–2022
*Wage working full-time required to support this budget For ALICE Survival Budget sources, visit UnitedForALICE.org/Methodology
Household Survival Budget, Jefferson Davis Parish, 2022
Financial Hardship
is Not Evenly Distributed
Groups with the largest number of households below the ALICE Threshold tend to also be the largest demographic groups. However, when looking at the percentage of each group that is below the ALICE Threshold, some groups are more likely to be ALICE than others. By addressing the disparities in financial hardship by parish demographics, community members can move toward more equitable solutions. Visit UnitedForALICE.org/Louisiana to view more national, state, and parish data.
Household Financial Status by Household Type, Jefferson Davis Parish, 2022
Sources: ALICE Threshold, 2022; American Community Survey, 2022
Household Financial Status by Race/Ethnicity, Jefferson Davis Parish, 2022
Note: Asian, Black, and White racial categories are for one race alone. Race and Hispanic ethnicity are overlapping categories. The Asian and Black groups may include Hispanic households; the White group includes only White, non-Hispanic households. The Hispanic ethnic group may include households of any race.
Sources: ALICE Threshold, 2022; American Community Survey, 2022
Note: Municipal-level data on this page is 1 or 5-year averages for Incorporated Places (1-year for populations over 65,000 and 5-year for populations under 65,000). Geographies with fewer than 100 households are not included. Therefore, totals will not match the parish-level numbers.
Jefferson Davis Parish,
ALICE IN LAFAYETTE PARISH
2022 Point-in-Time Data
Population: 247,866 • Number of Households: 103,581
Median Household Income: $56,496 (state average: $55,416)
Labor Force Participation Rate: 64.1% (state average: 59.4%)
ALICE Households: 28% (state average: 32%) • Households in Poverty: 18% (state average: 19%)
Financial Hardship Over Time
ALICE is an acronym for Asset Limited, Income Constrained, Employed — households that earn more than the Federal Poverty Level, but less than the basic cost of living for the parish (the ALICE Threshold). Households below the ALICE Threshold — ALICE households plus those in poverty — can’t afford the essentials.
Households move below or above the ALICE Threshold as economic factors and circumstances change. This was especially true amid the economic crosscurrents of the COVID-19 pandemic, with higher wages, inflation, and additional pandemic assistance. By 2022, 48,219 households (47%) were below the ALICE Threshold in Lafayette Parish.
The Cost of Basics Outpaces Wages
The Household Survival Budget reflects the minimum cost to live and work in the current economy and includes housing, child care, food, transportation, health care, technology, and taxes. It does not include savings for emergencies or future goals like college or retirement. The Household Survival Budget is calculated at the parish level and by household composition, as costs can vary greatly depending on location and household needs.
In 2022, household costs in Lafayette Parish were well above the Federal Poverty Level of $13,590 for a single adult and $27,750 for a family of four.
To see costs for different household compositions in Lafayette Parish, visit UnitedForALICE.org/Household-Budgets/ Louisiana
Households by Income, Lafayette Parish, 2010–2022
Note: See an interactive version of this data at UnitedForALICE.org/Louisiana
Sources: ALICE Threshold, 2010–2022; American Community Survey, 2010–2022
*Wage working full-time required to support this budget For ALICE Survival Budget sources, visit UnitedForALICE.org/Methodology
Household Survival Budget, Lafayette Parish,
Financial Hardship
is Not Evenly Distributed
Groups with the largest number of households below the ALICE Threshold tend to also be the largest demographic groups. However, when looking at the percentage of each group that is below the ALICE Threshold, some groups are more likely to be ALICE than others. By addressing the disparities in financial hardship by parish demographics, community members can move toward more equitable solutions. Visit UnitedForALICE.org/Louisiana to view more national, state, and parish data.
Household Financial Status by Household Type, Lafayette Parish, 2022
Sources: ALICE Threshold, 2022; American Community Survey, 2022
Household Financial Status by Race/Ethnicity, Lafayette Parish, 2022
Note: Asian, Black, and White racial categories are for one race alone. Race and Hispanic ethnicity are overlapping categories. The Asian and Black groups may include Hispanic households; the White group includes only White, non-Hispanic households. The Hispanic ethnic group may include households of any race.
Sources: ALICE Threshold, 2022; American Community Survey, 2022
Note: Municipal-level data on this page is 1 or 5-year averages for Incorporated Places (1-year for populations over 65,000 and 5-year for populations under 65,000). Geographies with fewer than 100 households are not included. Therefore, totals will not match the parish-level numbers.
ALICE IN LAFOURCHE PARISH
2022 Point-in-Time Data
Population: 95,870 • Number of Households: 38,523
Median Household Income: $58,593 (state average: $55,416)
Labor Force Participation Rate: 55.4% (state average: 59.4%)
ALICE Households: 27% (state average: 32%) • Households in Poverty: 18% (state average: 19%)
Financial Hardship Over Time
ALICE is an acronym for Asset Limited, Income Constrained, Employed — households that earn more than the Federal Poverty Level, but less than the basic cost of living for the parish (the ALICE Threshold). Households below the ALICE Threshold — ALICE households plus those in poverty — can’t afford the essentials.
Households move below or above the ALICE Threshold as economic factors and circumstances change. This was especially true amid the economic crosscurrents of the COVID-19 pandemic, with higher wages, inflation, and additional pandemic assistance. By 2022, 17,571 households (46%) were below the ALICE Threshold in Lafourche Parish.
The Cost of Basics Outpaces Wages
The Household Survival Budget reflects the minimum cost to live and work in the current economy and includes housing, child care, food, transportation, health care, technology, and taxes. It does not include savings for emergencies or future goals like college or retirement. The Household Survival Budget is calculated at the parish level and by household composition, as costs can vary greatly depending on location and household needs.
In 2022, household costs in Lafourche Parish were well above the Federal Poverty Level of $13,590 for a single adult and $27,750 for a family of four.
To see costs for different household compositions in Lafourche Parish, visit UnitedForALICE.org/Household-Budgets/ Louisiana
Households by Income, Lafourche Parish, 2010–2022
Note: See an interactive version of this data at UnitedForALICE.org/Louisiana
Sources: ALICE Threshold, 2010–2022; American Community Survey, 2010–2022
*Wage working full-time required to support this budget For ALICE Survival Budget sources, visit UnitedForALICE.org/Methodology
Household Survival Budget, Lafourche Parish, 2022
Financial Hardship
is Not Evenly Distributed
Groups with the largest number of households below the ALICE Threshold tend to also be the largest demographic groups. However, when looking at the percentage of each group that is below the ALICE Threshold, some groups are more likely to be ALICE than others. By addressing the disparities in financial hardship by parish demographics, community members can move toward more equitable solutions. Visit UnitedForALICE.org/Louisiana to view more national, state, and parish data.
Household Financial Status by Household Type, Lafourche Parish, 2022
Sources: ALICE Threshold, 2022; American Community Survey, 2022
Household Financial Status by Race/Ethnicity, Lafourche Parish, 2022
Note: Asian, Black, and White racial categories are for one race alone. Race and Hispanic ethnicity are overlapping categories. The Asian and Black groups may include Hispanic households; the White group includes only White, non-Hispanic households. The Hispanic ethnic group may include households of any race.
Sources: ALICE Threshold, 2022; American Community Survey, 2022
Note: Municipal-level data on this page is 1 or 5-year averages for Incorporated Places (1-year for populations over 65,000 and 5-year for populations under 65,000). Geographies with fewer than 100 households are not included. Therefore, totals will not match the parish-level numbers.
ALICE IN LASALLE PARISH
2022 Point-in-Time Data
Population: 14,764 • Number of Households: 4,665
Median Household Income: $59,926 (state average: $55,416)
Labor Force Participation Rate: 55.8% (state average: 59.4%)
ALICE Households: 33% (state average: 32%) • Households in Poverty: 17% (state average: 19%)
Financial Hardship Over Time
ALICE is an acronym for Asset Limited, Income Constrained, Employed — households that earn more than the Federal Poverty Level, but less than the basic cost of living for the parish (the ALICE Threshold). Households below the ALICE Threshold — ALICE households plus those in poverty — can’t afford the essentials.
Households move below or above the ALICE Threshold as economic factors and circumstances change. This was especially true amid the economic crosscurrents of the COVID-19 pandemic, with higher wages, inflation, and additional pandemic assistance. By 2022, 2,340 households (50%) were below the ALICE Threshold in LaSalle Parish.
The Cost of Basics
Outpaces Wages
The Household Survival Budget reflects the minimum cost to live and work in the current economy and includes housing, child care, food, transportation, health care, technology, and taxes. It does not include savings for emergencies or future goals like college or retirement. The Household Survival Budget is calculated at the parish level and by household composition, as costs can vary greatly depending on location and household needs.
In 2022, household costs in LaSalle Parish were well above the Federal Poverty Level of $13,590 for a single adult and $27,750 for a family of four.
To see costs for different household compositions in LaSalle Parish, visit UnitedForALICE.org/Household-Budgets/ Louisiana
Households by Income, LaSalle Parish, 2010–2022
Note: See an interactive version of this data at UnitedForALICE.org/Louisiana Sources: ALICE Threshold, 2010–2022; American Community Survey, 2010–2022
*Wage working full-time required to support this budget For ALICE Survival Budget sources, visit UnitedForALICE.org/Methodology
Household Survival Budget, LaSalle Parish, 2022
Financial Hardship is Not Evenly
Distributed
Groups with the largest number of households below the ALICE Threshold tend to also be the largest demographic groups. However, when looking at the percentage of each group that is below the ALICE Threshold, some groups are more likely to be ALICE than others. By addressing the disparities in financial hardship by parish demographics, community members can move toward more equitable solutions. Visit UnitedForALICE.org/Louisiana to view more national, state, and parish data.
Household Financial Status by Household Type, LaSalle Parish, 2022
Sources: ALICE Threshold, 2022; American Community Survey, 2022
Household Financial Status by Race/Ethnicity, LaSalle Parish, 2022
Note: Asian, Black, and White racial categories are for one race alone. Race and Hispanic ethnicity are overlapping categories. The Asian and Black groups may include Hispanic households; the White group includes only White, non-Hispanic households. The Hispanic ethnic group may include households of any race.
Sources: ALICE Threshold, 2022; American Community Survey, 2022
LaSalle Parish, 2022
Note: Municipal-level data on this page is 1 or 5-year averages for Incorporated Places (1-year for populations over 65,000 and 5-year for populations under 65,000). Geographies with fewer than 100 households are not included. Therefore, totals will not match the parish-level numbers.
ALICE IN LINCOLN PARISH
2022 Point-in-Time Data
Population: 48,323 • Number of Households: 18,043
Median Household Income: $37,001 (state average: $55,416)
Labor Force Participation Rate: 55.4% (state average: 59.4%)
ALICE Households: 35% (state average: 32%) • Households in Poverty: 28% (state average: 19%)
Financial Hardship Over Time
ALICE is an acronym for Asset Limited, Income Constrained, Employed — households that earn more than the Federal Poverty Level, but less than the basic cost of living for the parish (the ALICE Threshold). Households below the ALICE Threshold — ALICE households plus those in poverty — can’t afford the essentials.
Households move below or above the ALICE Threshold as economic factors and circumstances change. This was especially true amid the economic crosscurrents of the COVID-19 pandemic, with higher wages, inflation, and additional pandemic assistance. By 2022, 11,304 households (63%) were below the ALICE Threshold in Lincoln Parish.
The Cost of Basics Outpaces Wages
The Household Survival Budget reflects the minimum cost to live and work in the current economy and includes housing, child care, food, transportation, health care, technology, and taxes. It does not include savings for emergencies or future goals like college or retirement. The Household Survival Budget is calculated at the parish level and by household composition, as costs can vary greatly depending on location and household needs.
In 2022, household costs in Lincoln Parish were well above the Federal Poverty Level of $13,590 for a single adult and $27,750 for a family of four.
To see costs for different household compositions in Lincoln Parish, visit UnitedForALICE.org/Household-Budgets/ Louisiana
Households by Income, Lincoln Parish, 2010–2022
Note: See an interactive version of this data at UnitedForALICE.org/Louisiana
Sources: ALICE Threshold, 2010–2022; American Community Survey, 2010–2022
*Wage working full-time required to support this budget For ALICE Survival Budget sources, visit UnitedForALICE.org/Methodology
Financial Hardship
is Not Evenly Distributed
Groups with the largest number of households below the ALICE Threshold tend to also be the largest demographic groups. However, when looking at the percentage of each group that is below the ALICE Threshold, some groups are more likely to be ALICE than others. By addressing the disparities in financial hardship by parish demographics, community members can move toward more equitable solutions. Visit UnitedForALICE.org/Louisiana to view more national, state, and parish data.
Household Financial Status by Household Type, Lincoln Parish, 2022
Sources: ALICE Threshold, 2022; American Community Survey, 2022
Household Financial Status by Race/Ethnicity, Lincoln Parish, 2022
Note: Asian, Black, and White racial categories are for one race alone. Race and Hispanic ethnicity are overlapping categories. The Asian and Black groups may include Hispanic households; the White group includes only White, non-Hispanic households. The Hispanic ethnic group may include households of any race.
Sources: ALICE Threshold, 2022; American Community Survey, 2022
Note: Municipal-level data on this page is 1 or 5-year averages for Incorporated Places (1-year for populations over 65,000 and 5-year for populations under 65,000). Geographies with fewer than 100 households are not included. Therefore, totals will not match the parish-level numbers.
ALICE IN LIVINGSTON PARISH
2022 Point-in-Time Data
Population: 148,425 • Number of Households: 54,424
Median Household Income: $73,126 (state average: $55,416)
Labor Force Participation Rate: 64.1% (state average: 59.4%)
ALICE Households: 28% (state average: 32%) • Households in Poverty: 15% (state average: 19%)
Financial Hardship Over Time
ALICE is an acronym for Asset Limited, Income Constrained, Employed — households that earn more than the Federal Poverty Level, but less than the basic cost of living for the parish (the ALICE Threshold). Households below the ALICE Threshold — ALICE households plus those in poverty — can’t afford the essentials.
Households move below or above the ALICE Threshold as economic factors and circumstances change. This was especially true amid the economic crosscurrents of the COVID-19 pandemic, with higher wages, inflation, and additional pandemic assistance. By 2022, 23,665 households (43%) were below the ALICE Threshold in Livingston Parish.
The Cost of Basics Outpaces Wages
The Household Survival Budget reflects the minimum cost to live and work in the current economy and includes housing, child care, food, transportation, health care, technology, and taxes. It does not include savings for emergencies or future goals like college or retirement. The Household Survival Budget is calculated at the parish level and by household composition, as costs can vary greatly depending on location and household needs.
In 2022, household costs in Livingston Parish were well above the Federal Poverty Level of $13,590 for a single adult and $27,750 for a family of four.
To see costs for different household compositions in Livingston Parish, visit UnitedForALICE.org/Household-Budgets/ Louisiana
Households by Income, Livingston Parish, 2010–2022
Note: See an interactive version of this data at UnitedForALICE.org/Louisiana
Sources: ALICE Threshold, 2010–2022; American Community Survey, 2010–2022
*Wage working full-time required to support this budget For ALICE Survival Budget sources, visit UnitedForALICE.org/Methodology
Household Survival Budget, Livingston Parish, 2022
Financial Hardship
is Not Evenly Distributed
Groups with the largest number of households below the ALICE Threshold tend to also be the largest demographic groups. However, when looking at the percentage of each group that is below the ALICE Threshold, some groups are more likely to be ALICE than others. By addressing the disparities in financial hardship by parish demographics, community members can move toward more equitable solutions. Visit UnitedForALICE.org/Louisiana to view more national, state, and parish data.
Household Financial Status by Household Type, Livingston Parish, 2022
Sources: ALICE Threshold, 2022; American Community Survey, 2022
Household Financial Status by Race/Ethnicity, Livingston Parish, 2022
Note: Asian, Black, and White racial categories are for one race alone. Race and Hispanic ethnicity are overlapping categories. The Asian and Black groups may include Hispanic households; the White group includes only White, non-Hispanic households. The Hispanic ethnic group may include households of any race.
Sources: ALICE Threshold, 2022; American Community Survey, 2022
Note: Municipal-level data on this page is 1 or 5-year averages for Incorporated Places (1-year for populations over 65,000 and 5-year for populations under 65,000). Geographies with fewer than 100 households are not included. Therefore, totals will not match the parish-level numbers.
ALICE IN MADISON PARISH
2022 Point-in-Time Data
Population: 10,028 • Number of Households: 3,092
Median Household Income: $34,508 (state average: $55,416)
Labor Force Participation Rate: 40.9% (state average: 59.4%)
ALICE Households: 34% (state average: 32%) • Households in Poverty: 34% (state average: 19%)
Financial Hardship Over Time
ALICE is an acronym for Asset Limited, Income Constrained, Employed — households that earn more than the Federal Poverty Level, but less than the basic cost of living for the parish (the ALICE Threshold). Households below the ALICE Threshold — ALICE households plus those in poverty — can’t afford the essentials.
Households move below or above the ALICE Threshold as economic factors and circumstances change. This was especially true amid the economic crosscurrents of the COVID-19 pandemic, with higher wages, inflation, and additional pandemic assistance. By 2022, 2,118 households (68%) were below the ALICE Threshold in Madison Parish.
The Cost of Basics Outpaces Wages
The Household Survival Budget reflects the minimum cost to live and work in the current economy and includes housing, child care, food, transportation, health care, technology, and taxes. It does not include savings for emergencies or future goals like college or retirement. The Household Survival Budget is calculated at the parish level and by household composition, as costs can vary greatly depending on location and household needs.
In 2022, household costs in Madison Parish were well above the Federal Poverty Level of $13,590 for a single adult and $27,750 for a family of four.
To see costs for different household compositions in Madison Parish, visit UnitedForALICE.org/Household-Budgets/ Louisiana
Households by Income, Madison Parish, 2010–2022
Note: See an interactive version of this data at UnitedForALICE.org/Louisiana
Sources: ALICE Threshold, 2010–2022; American Community Survey, 2010–2022
*Wage working full-time required to support this budget For ALICE Survival Budget sources, visit UnitedForALICE.org/Methodology
Household Survival Budget, Madison Parish, 2022
Financial Hardship is Not Evenly Distributed
Groups with the largest number of households below the ALICE Threshold tend to also be the largest demographic groups. However, when looking at the percentage of each group that is below the ALICE Threshold, some groups are more likely to be ALICE than others. By addressing the disparities in financial hardship by parish demographics, community members can move toward more equitable solutions. Visit UnitedForALICE.org/Louisiana to view more national, state, and parish data.
Household Financial Status by Household Type, Madison Parish, 2022
Sources: ALICE Threshold, 2022; American Community Survey, 2022
Household Financial Status by Race/Ethnicity, Madison Parish, 2022
Note: Asian, Black, and White racial categories are for one race alone. Race and Hispanic ethnicity are overlapping categories. The Asian and Black groups may include Hispanic households; the White group includes only White, non-Hispanic households. The Hispanic ethnic group may include households of any race.
Sources: ALICE Threshold, 2022; American Community Survey, 2022
Note: Municipal-level data on this page is 1 or 5-year averages for Incorporated Places (1-year for populations over 65,000 and 5-year for populations under 65,000). Geographies with fewer than 100 households are not included. Therefore, totals will not match the parish-level numbers.
Madison Parish, 2022
ALICE IN MOREHOUSE PARISH
2022 Point-in-Time Data
Population: 25,438 • Number of Households: 9,474
Median Household Income: $37,875 (state average: $55,416)
Labor Force Participation Rate: 50.9% (state average: 59.4%)
ALICE Households: 34% (state average: 32%) • Households in Poverty: 28% (state average: 19%)
Financial Hardship Over Time
ALICE is an acronym for Asset Limited, Income Constrained, Employed — households that earn more than the Federal Poverty Level, but less than the basic cost of living for the parish (the ALICE Threshold). Households below the ALICE Threshold — ALICE households plus those in poverty — can’t afford the essentials.
Households move below or above the ALICE Threshold as economic factors and circumstances change. This was especially true amid the economic crosscurrents of the COVID-19 pandemic, with higher wages, inflation, and additional pandemic assistance. By 2022, 5,838 households (62%) were below the ALICE Threshold in Morehouse Parish.
The Cost of Basics Outpaces Wages
The Household Survival Budget reflects the minimum cost to live and work in the current economy and includes housing, child care, food, transportation, health care, technology, and taxes. It does not include savings for emergencies or future goals like college or retirement. The Household Survival Budget is calculated at the parish level and by household composition, as costs can vary greatly depending on location and household needs.
In 2022, household costs in Morehouse Parish were well above the Federal Poverty Level of $13,590 for a single adult and $27,750 for a family of four.
To see costs for different household compositions in Morehouse Parish, visit UnitedForALICE.org/Household-Budgets/ Louisiana
Households by Income, Morehouse Parish, 2010–2022
Note: See an interactive version of this data at UnitedForALICE.org/Louisiana
Sources: ALICE Threshold, 2010–2022; American Community Survey, 2010–2022
*Wage working full-time required to support this budget For ALICE Survival Budget sources, visit UnitedForALICE.org/Methodology
Financial Hardship
is Not Evenly Distributed
Groups with the largest number of households below the ALICE Threshold tend to also be the largest demographic groups. However, when looking at the percentage of each group that is below the ALICE Threshold, some groups are more likely to be ALICE than others. By addressing the disparities in financial hardship by parish demographics, community members can move toward more equitable solutions. Visit UnitedForALICE.org/Louisiana to view more national, state, and parish data.
Household Financial Status by Household Type, Morehouse Parish, 2022
Sources: ALICE Threshold, 2022; American Community Survey, 2022
Household Financial Status by Race/Ethnicity, Morehouse Parish, 2022
Note: Asian, Black, and White racial categories are for one race alone. Race and Hispanic ethnicity are overlapping categories. The Asian and Black groups may include Hispanic households; the White group includes only White, non-Hispanic households. The Hispanic ethnic group may include households of any race.
Sources: ALICE Threshold, 2022; American Community Survey, 2022
Note: Municipal-level data on this page is 1 or 5-year averages for Incorporated Places (1-year for populations over 65,000 and 5-year for populations under 65,000). Geographies with fewer than 100 households are not included. Therefore, totals will not match the parish-level numbers.
ALICE IN NATCHITOCHES PARISH
2022 Point-in-Time Data
Population: 37,478 • Number of Households: 13,866
Median Household Income: $41,310 (state average: $55,416)
Labor Force Participation Rate: 51.9% (state average: 59.4%)
ALICE Households: 33% (state average: 32%) • Households in Poverty: 27% (state average: 19%)
Financial Hardship Over Time
ALICE is an acronym for Asset Limited, Income Constrained, Employed — households that earn more than the Federal Poverty Level, but less than the basic cost of living for the parish (the ALICE Threshold). Households below the ALICE Threshold — ALICE households plus those in poverty — can’t afford the essentials.
Households move below or above the ALICE Threshold as economic factors and circumstances change. This was especially true amid the economic crosscurrents of the COVID-19 pandemic, with higher wages, inflation, and additional pandemic assistance. By 2022, 8,407 households (61%) were below the ALICE Threshold in Natchitoches Parish.
The Cost of Basics Outpaces Wages
The Household Survival Budget reflects the minimum cost to live and work in the current economy and includes housing, child care, food, transportation, health care, technology, and taxes. It does not include savings for emergencies or future goals like college or retirement. The Household Survival Budget is calculated at the parish level and by household composition, as costs can vary greatly depending on location and household needs.
In 2022, household costs in Natchitoches Parish were well above the Federal Poverty Level of $13,590 for a single adult and $27,750 for a family of four.
To see costs for different household compositions in Natchitoches Parish, visit UnitedForALICE.org/Household-Budgets/ Louisiana
Households
Note: See an interactive version of this data at UnitedForALICE.org/Louisiana Sources: ALICE Threshold, 2010–2022; American Community Survey, 2010–2022
*Wage working full-time required to support this budget For ALICE Survival Budget sources, visit UnitedForALICE.org/Methodology
by Income, Natchitoches Parish, 2010–2022
Household Survival Budget, Natchitoches Parish, 2022
Financial Hardship
is Not Evenly Distributed
Groups with the largest number of households below the ALICE Threshold tend to also be the largest demographic groups. However, when looking at the percentage of each group that is below the ALICE Threshold, some groups are more likely to be ALICE than others. By addressing the disparities in financial hardship by parish demographics, community members can move toward more equitable solutions. Visit UnitedForALICE.org/Louisiana to view more national, state, and parish data.
Household Financial Status by Household Type, Natchitoches Parish, 2022
Sources: ALICE Threshold, 2022; American Community Survey, 2022
Household Financial Status by Race/Ethnicity, Natchitoches Parish, 2022
Note: Asian, Black, and White racial categories are for one race alone. Race and Hispanic ethnicity are overlapping categories. The Asian and Black groups may include Hispanic households; the White group includes only White, non-Hispanic households. The Hispanic ethnic group may include households of any race.
Sources: ALICE Threshold, 2022; American Community Survey, 2022
Natchitoches Parish, 2022
Note: Municipal-level data on this page is 1 or 5-year averages for Incorporated Places (1-year for populations over 65,000 and 5-year for populations under 65,000). Geographies with fewer than 100 households are not included. Therefore, totals will not match the parish-level numbers.
ALICE IN ORLEANS PARISH
2022 Point-in-Time Data
Population: 369,749 • Number of Households: 150,880
Median Household Income: $52,322 (state average: $55,416)
Labor Force Participation Rate: 60.6% (state average: 59.4%)
ALICE Households: 32% (state average: 32%) • Households in Poverty: 23% (state average: 19%)
Financial Hardship Over Time
ALICE is an acronym for Asset Limited, Income Constrained, Employed — households that earn more than the Federal Poverty Level, but less than the basic cost of living for the parish (the ALICE Threshold). Households below the ALICE Threshold — ALICE households plus those in poverty — can’t afford the essentials.
Households move below or above the ALICE Threshold as economic factors and circumstances change. This was especially true amid the economic crosscurrents of the COVID-19 pandemic, with higher wages, inflation, and additional pandemic assistance. By 2022, 81,982 households (54%) were below the ALICE Threshold in Orleans Parish.
The Cost of Basics Outpaces Wages
The Household Survival Budget reflects the minimum cost to live and work in the current economy and includes housing, child care, food, transportation, health care, technology, and taxes. It does not include savings for emergencies or future goals like college or retirement. The Household Survival Budget is calculated at the parish level and by household composition, as costs can vary greatly depending on location and household needs.
In 2022, household costs in Orleans Parish were well above the Federal Poverty Level of $13,590 for a single adult and $27,750 for a family of four.
To see costs for different household compositions in Orleans Parish, visit UnitedForALICE.org/Household-Budgets/ Louisiana
Households by Income, Orleans Parish, 2010–2022
Note: See an interactive version of this data at UnitedForALICE.org/Louisiana
Sources: ALICE Threshold, 2010–2022; American Community Survey, 2010–2022
*Wage working full-time required to support this budget For ALICE Survival Budget sources, visit UnitedForALICE.org/Methodology
Household Survival Budget, Orleans Parish, 2022
Financial Hardship is Not Evenly
Distributed
Groups with the largest number of households below the ALICE Threshold tend to also be the largest demographic groups. However, when looking at the percentage of each group that is below the ALICE Threshold, some groups are more likely to be ALICE than others. By addressing the disparities in financial hardship by parish demographics, community members can move toward more equitable solutions. Visit UnitedForALICE.org/Louisiana to view more national, state, and parish data.
Household Financial Status by Household Type, Orleans Parish, 2022
Sources: ALICE Threshold, 2022; American Community Survey, 2022
Household Financial Status by Race/Ethnicity, Orleans Parish, 2022
Note: Asian, Black, and White racial categories are for one race alone. Race and Hispanic ethnicity are overlapping categories. The Asian and Black groups may include Hispanic households; the White group includes only White, non-Hispanic households. The Hispanic ethnic group may include households of any race.
Sources: ALICE Threshold, 2022; American Community Survey, 2022
Note: Municipal-level data on this page is 1 or 5-year averages for Incorporated Places (1-year for populations over 65,000 and 5-year for populations under 65,000). Geographies with fewer than 100 households are not included. Therefore, totals will not match the parish-level numbers.
ALICE IN OUACHITA PARISH
2022 Point-in-Time Data
Population: 157,702 • Number of Households: 63,192
Median Household Income: $45,840 (state average: $55,416)
Labor Force Participation Rate: 61.7% (state average: 59.4%)
ALICE Households: 31% (state average: 32%) • Households in Poverty: 25% (state average: 19%)
Financial Hardship Over Time
ALICE is an acronym for Asset Limited, Income Constrained, Employed — households that earn more than the Federal Poverty Level, but less than the basic cost of living for the parish (the ALICE Threshold). Households below the ALICE Threshold — ALICE households plus those in poverty — can’t afford the essentials.
Households move below or above the ALICE Threshold as economic factors and circumstances change. This was especially true amid the economic crosscurrents of the COVID-19 pandemic, with higher wages, inflation, and additional pandemic assistance. By 2022, 35,244 households (56%) were below the ALICE Threshold in Ouachita Parish.
The Cost of Basics Outpaces Wages
The Household Survival Budget reflects the minimum cost to live and work in the current economy and includes housing, child care, food, transportation, health care, technology, and taxes. It does not include savings for emergencies or future goals like college or retirement. The Household Survival Budget is calculated at the parish level and by household composition, as costs can vary greatly depending on location and household needs.
In 2022, household costs in Ouachita Parish were well above the Federal Poverty Level of $13,590 for a single adult and $27,750 for a family of four.
To see costs for different household compositions in Ouachita Parish, visit UnitedForALICE.org/Household-Budgets/ Louisiana
Households by Income, Ouachita Parish, 2010–2022
Note: See an interactive version of this data at UnitedForALICE.org/Louisiana
Sources: ALICE Threshold, 2010–2022; American Community Survey, 2010–2022
*Wage working full-time required to support this budget For ALICE Survival Budget sources, visit UnitedForALICE.org/Methodology
Household Survival Budget, Ouachita Parish, 2022
Financial
Hardship is Not Evenly Distributed
Groups with the largest number of households below the ALICE Threshold tend to also be the largest demographic groups. However, when looking at the percentage of each group that is below the ALICE Threshold, some groups are more likely to be ALICE than others. By addressing the disparities in financial hardship by parish demographics, community members can move toward more equitable solutions. Visit UnitedForALICE.org/Louisiana to view more national, state, and parish data.
Household Financial Status by Household Type, Ouachita Parish, 2022
Sources: ALICE Threshold, 2022; American Community Survey, 2022
Household Financial Status by Race/Ethnicity, Ouachita Parish, 2022
Note: Asian, Black, and White racial categories are for one race alone. Race and Hispanic ethnicity are overlapping categories. The Asian and Black groups may include Hispanic households; the White group includes only White, non-Hispanic households. The Hispanic ethnic group may include households of any race.
Sources: ALICE Threshold, 2022; American Community Survey, 2022
Note: Municipal-level data on this page is 1 or 5-year averages for Incorporated Places (1-year for populations over 65,000 and 5-year for populations under 65,000). Geographies with fewer than 100 households are not included. Therefore, totals will not match the parish-level numbers.
Ouachita Parish, 2022
ALICE IN PLAQUEMINES PARISH
2022 Point-in-Time Data
Population: 23,305 • Number of Households: 8,172
Median Household Income: $77,996 (state average: $55,416)
Labor Force Participation Rate: 65% (state average: 59.4%)
ALICE Households: 27% (state average: 32%) • Households in Poverty: 16% (state average: 19%)
Financial Hardship Over Time
ALICE is an acronym for Asset Limited, Income Constrained, Employed — households that earn more than the Federal Poverty Level, but less than the basic cost of living for the parish (the ALICE Threshold). Households below the ALICE Threshold — ALICE households plus those in poverty — can’t afford the essentials.
Households move below or above the ALICE Threshold as economic factors and circumstances change. This was especially true amid the economic crosscurrents of the COVID-19 pandemic, with higher wages, inflation, and additional pandemic assistance. By 2022, 3,538 households (43%) were below the ALICE Threshold in Plaquemines Parish.
The Cost of Basics Outpaces Wages
The Household Survival Budget reflects the minimum cost to live and work in the current economy and includes housing, child care, food, transportation, health care, technology, and taxes. It does not include savings for emergencies or future goals like college or retirement. The Household Survival Budget is calculated at the parish level and by household composition, as costs can vary greatly depending on location and household needs.
In 2022, household costs in Plaquemines Parish were well above the Federal Poverty Level of $13,590 for a single adult and $27,750 for a family of four.
To see costs for different household compositions in Plaquemines Parish, visit UnitedForALICE.org/Household-Budgets/ Louisiana
Households by Income, Plaquemines Parish, 2010–2022
Note: See an interactive version of this data at UnitedForALICE.org/Louisiana Sources: ALICE Threshold, 2010–2022; American Community Survey, 2010–2022
*Wage working full-time required to support this budget For ALICE Survival Budget sources, visit UnitedForALICE.org/Methodology
Household Survival Budget, Plaquemines Parish, 2022
Financial Hardship is Not Evenly
Distributed
Groups with the largest number of households below the ALICE Threshold tend to also be the largest demographic groups. However, when looking at the percentage of each group that is below the ALICE Threshold, some groups are more likely to be ALICE than others. By addressing the disparities in financial hardship by parish demographics, community members can move toward more equitable solutions. Visit UnitedForALICE.org/Louisiana to view more national, state, and parish data.
Household Financial Status by Household Type, Plaquemines Parish, 2022
Sources: ALICE Threshold, 2022; American Community Survey, 2022
Household Financial Status by Race/Ethnicity, Plaquemines Parish, 2022
Note: Asian, Black, and White racial categories are for one race alone. Race and Hispanic ethnicity are overlapping categories. The Asian and Black groups may include Hispanic households; the White group includes only White, non-Hispanic households. The Hispanic ethnic group may include households of any race.
Sources: ALICE Threshold, 2022; American Community Survey, 2022
Note: Municipal-level data on this page is 1 or 5-year averages for Incorporated Places (1-year for populations over 65,000 and 5-year for populations under 65,000). Geographies with fewer than 100 households are not included. Therefore, totals will not match the parish-level numbers.
ALICE IN POINTE COUPEE PARISH
2022 Point-in-Time Data
Population: 20,652 • Number of Households: 8,203
Median Household Income: $53,045 (state average: $55,416)
Labor Force Participation Rate: 53% (state average: 59.4%)
ALICE Households: 31% (state average: 32%) • Households in Poverty: 24% (state average: 19%)
Financial Hardship Over Time
ALICE is an acronym for Asset Limited, Income Constrained, Employed — households that earn more than the Federal Poverty Level, but less than the basic cost of living for the parish (the ALICE Threshold). Households below the ALICE Threshold — ALICE households plus those in poverty — can’t afford the essentials.
Households move below or above the ALICE Threshold as economic factors and circumstances change. This was especially true amid the economic crosscurrents of the COVID-19 pandemic, with higher wages, inflation, and additional pandemic assistance. By 2022, 4,509 households (55%) were below the ALICE Threshold in Pointe Coupee Parish.
The Cost of Basics Outpaces Wages
The Household Survival Budget reflects the minimum cost to live and work in the current economy and includes housing, child care, food, transportation, health care, technology, and taxes. It does not include savings for emergencies or future goals like college or retirement. The Household Survival Budget is calculated at the parish level and by household composition, as costs can vary greatly depending on location and household needs.
In 2022, household costs in Pointe Coupee Parish were well above the Federal Poverty Level of $13,590 for a single adult and $27,750 for a family of four.
To see costs for different household compositions in Pointe Coupee Parish, visit UnitedForALICE.org/HouseholdBudgets/Louisiana
Households by Income, Pointe Coupee Parish, 2010–2022
Note: See an interactive version of this data at UnitedForALICE.org/Louisiana
Sources: ALICE Threshold, 2010–2022; American Community Survey, 2010–2022
*Wage working full-time required to support this budget For ALICE Survival Budget sources, visit UnitedForALICE.org/Methodology
Household Survival Budget, Pointe Coupee Parish, 2022
Financial Hardship
is Not Evenly Distributed
Groups with the largest number of households below the ALICE Threshold tend to also be the largest demographic groups. However, when looking at the percentage of each group that is below the ALICE Threshold, some groups are more likely to be ALICE than others. By addressing the disparities in financial hardship by parish demographics, community members can move toward more equitable solutions. Visit UnitedForALICE.org/Louisiana to view more national, state, and parish data.
Household Financial Status by Household Type, Pointe Coupee Parish, 2022
Sources: ALICE Threshold, 2022; American Community Survey, 2022
Household Financial Status by Race/Ethnicity, Pointe Coupee Parish, 2022
Note: Asian, Black, and White racial categories are for one race alone. Race and Hispanic ethnicity are overlapping categories. The Asian and Black groups may include Hispanic households; the White group includes only White, non-Hispanic households. The Hispanic ethnic group may include households of any race.
Sources: ALICE Threshold, 2022; American Community Survey, 2022
Pointe Coupee Parish, 2022
Note: Municipal-level data on this page is 1 or 5-year averages for Incorporated Places (1-year for populations over 65,000 and 5-year for populations under 65,000). Geographies with fewer than 100 households are not included. Therefore, totals will not match the parish-level numbers.
ALICE IN RAPIDES PARISH
2022 Point-in-Time Data
Population: 127,189 • Number of Households: 47,887
Median Household Income: $58,161 (state average: $55,416)
Labor Force Participation Rate: 59.4% (state average: 59.4%)
ALICE Households: 32% (state average: 32%) • Households in Poverty: 16% (state average: 19%)
Financial Hardship Over Time
ALICE is an acronym for Asset Limited, Income Constrained, Employed — households that earn more than the Federal Poverty Level, but less than the basic cost of living for the parish (the ALICE Threshold). Households below the ALICE Threshold — ALICE households plus those in poverty — can’t afford the essentials.
Households move below or above the ALICE Threshold as economic factors and circumstances change. This was especially true amid the economic crosscurrents of the COVID-19 pandemic, with higher wages, inflation, and additional pandemic assistance. By 2022, 23,217 households (48%) were below the ALICE Threshold in Rapides Parish.
The Cost of Basics Outpaces Wages
The Household Survival Budget reflects the minimum cost to live and work in the current economy and includes housing, child care, food, transportation, health care, technology, and taxes. It does not include savings for emergencies or future goals like college or retirement. The Household Survival Budget is calculated at the parish level and by household composition, as costs can vary greatly depending on location and household needs.
In 2022, household costs in Rapides Parish were well above the Federal Poverty Level of $13,590 for a single adult and $27,750 for a family of four.
To see costs for different household compositions in Rapides Parish, visit UnitedForALICE.org/Household-Budgets/ Louisiana
Households by Income, Rapides Parish, 2010–2022
Note: See an interactive version of this data at UnitedForALICE.org/Louisiana Sources: ALICE Threshold, 2010–2022; American Community Survey, 2010–2022
*Wage working full-time required to support this budget For ALICE Survival Budget sources, visit UnitedForALICE.org/Methodology
Household Survival Budget, Rapides Parish, 2022
Financial Hardship
is Not Evenly Distributed
Groups with the largest number of households below the ALICE Threshold tend to also be the largest demographic groups. However, when looking at the percentage of each group that is below the ALICE Threshold, some groups are more likely to be ALICE than others. By addressing the disparities in financial hardship by parish demographics, community members can move toward more equitable solutions. Visit UnitedForALICE.org/Louisiana to view more national, state, and parish data.
Household Financial Status by Household Type, Rapides Parish, 2022
Sources: ALICE Threshold, 2022; American Community Survey, 2022
Household Financial Status by Race/Ethnicity, Rapides Parish, 2022
Note: Asian, Black, and White racial categories are for one race alone. Race and Hispanic ethnicity are overlapping categories. The Asian and Black groups may include Hispanic households; the White group includes only White, non-Hispanic households. The Hispanic ethnic group may include households of any race.
Sources: ALICE Threshold, 2022; American Community Survey, 2022
Note: Municipal-level data on this page is 1 or 5-year averages for Incorporated Places (1-year for populations over 65,000 and 5-year for populations under 65,000). Geographies with fewer than 100 households are not included. Therefore, totals will not match the parish-level numbers.
Rapides Parish, 2022
ALICE IN RED RIVER PARISH
2022 Point-in-Time Data
Population: 7,631 • Number of Households: 2,934
Median Household Income: $43,821 (state average: $55,416)
Labor Force Participation Rate: 49.4% (state average: 59.4%)
ALICE Households: 29% (state average: 32%) • Households in Poverty: 26% (state average: 19%)
Financial Hardship Over Time
ALICE is an acronym for Asset Limited, Income Constrained, Employed — households that earn more than the Federal Poverty Level, but less than the basic cost of living for the parish (the ALICE Threshold). Households below the ALICE Threshold — ALICE households plus those in poverty — can’t afford the essentials.
Households move below or above the ALICE Threshold as economic factors and circumstances change. This was especially true amid the economic crosscurrents of the COVID-19 pandemic, with higher wages, inflation, and additional pandemic assistance. By 2022, 1,606 households (55%) were below the ALICE Threshold in Red River Parish.
The Cost of Basics
Outpaces Wages
The Household Survival Budget reflects the minimum cost to live and work in the current economy and includes housing, child care, food, transportation, health care, technology, and taxes. It does not include savings for emergencies or future goals like college or retirement. The Household Survival Budget is calculated at the parish level and by household composition, as costs can vary greatly depending on location and household needs.
In 2022, household costs in Red River Parish were well above the Federal Poverty Level of $13,590 for a single adult and $27,750 for a family of four.
To see costs for different household compositions in Red River Parish, visit UnitedForALICE.org/Household-Budgets/ Louisiana
Households by Income, Red River Parish, 2010–2022
Note: See an interactive version of this data at UnitedForALICE.org/Louisiana
Sources: ALICE Threshold, 2010–2022; American Community Survey, 2010–2022
*Wage working full-time required to support this budget For ALICE Survival Budget sources, visit UnitedForALICE.org/Methodology
Household Survival Budget, Red River Parish,
Financial Hardship
is Not Evenly Distributed
Groups with the largest number of households below the ALICE Threshold tend to also be the largest demographic groups. However, when looking at the percentage of each group that is below the ALICE Threshold, some groups are more likely to be ALICE than others. By addressing the disparities in financial hardship by parish demographics, community members can move toward more equitable solutions.
Visit UnitedForALICE.org/Louisiana to view more national, state, and parish data.
Household Financial Status by Household Type, Red River Parish, 2022
Sources: ALICE Threshold, 2022; American Community Survey, 2022
Household Financial Status by Race/Ethnicity, Red River Parish, 2022
Note: Asian, Black, and White racial categories are for one race alone. Race and Hispanic ethnicity are overlapping categories. The Asian and Black groups may include Hispanic households; the White group includes only White, non-Hispanic households. The Hispanic ethnic group may include households of any race.
Sources: ALICE Threshold, 2022; American Community Survey, 2022
Note: Municipal-level data on this page is 1 or 5-year averages for Incorporated Places (1-year for populations over 65,000 and 5-year for populations under 65,000). Geographies with fewer than 100 households are not included. Therefore, totals will not match the parish-level numbers.
Red River Parish, 2022
ALICE IN RICHLAND PARISH
2022 Point-in-Time Data
Population: 20,028 • Number of Households: 7,295
Median Household Income: $48,125 (state average: $55,416)
Labor Force Participation Rate: 51.3% (state average: 59.4%)
ALICE Households: 32% (state average: 32%) • Households in Poverty: 23% (state average: 19%)
Financial Hardship Over Time
ALICE is an acronym for Asset Limited, Income Constrained, Employed — households that earn more than the Federal Poverty Level, but less than the basic cost of living for the parish (the ALICE Threshold). Households below the ALICE Threshold — ALICE households plus those in poverty — can’t afford the essentials.
Households move below or above the ALICE Threshold as economic factors and circumstances change. This was especially true amid the economic crosscurrents of the COVID-19 pandemic, with higher wages, inflation, and additional pandemic assistance. By 2022, 4,029 households (55%) were below the ALICE Threshold in Richland Parish.
The Cost of Basics Outpaces Wages
The Household Survival Budget reflects the minimum cost to live and work in the current economy and includes housing, child care, food, transportation, health care, technology, and taxes. It does not include savings for emergencies or future goals like college or retirement. The Household Survival Budget is calculated at the parish level and by household composition, as costs can vary greatly depending on location and household needs.
In 2022, household costs in Richland Parish were well above the Federal Poverty Level of $13,590 for a single adult and $27,750 for a family of four.
To see costs for different household compositions in Richland Parish, visit UnitedForALICE.org/Household-Budgets/ Louisiana
Households by Income, Richland Parish, 2010–2022
Note: See an interactive version of this data at UnitedForALICE.org/Louisiana
Sources: ALICE Threshold, 2010–2022; American Community Survey, 2010–2022
*Wage working full-time required to support this budget For ALICE Survival Budget sources, visit UnitedForALICE.org/Methodology
Household Survival Budget, Richland Parish, 2022
Financial Hardship
is Not Evenly Distributed
Groups with the largest number of households below the ALICE Threshold tend to also be the largest demographic groups. However, when looking at the percentage of each group that is below the ALICE Threshold, some groups are more likely to be ALICE than others. By addressing the disparities in financial hardship by parish demographics, community members can move toward more equitable solutions.
Visit UnitedForALICE.org/Louisiana to view more national, state, and parish data.
Household Financial Status by Household Type, Richland Parish, 2022
Sources: ALICE Threshold, 2022; American Community Survey, 2022
Household Financial Status by Race/Ethnicity, Richland Parish, 2022
Note: Asian, Black, and White racial categories are for one race alone. Race and Hispanic ethnicity are overlapping categories. The Asian and Black groups may include Hispanic households; the White group includes only White, non-Hispanic households. The Hispanic ethnic group may include households of any race.
Sources: ALICE Threshold, 2022; American Community Survey, 2022
Note: Municipal-level data on this page is 1 or 5-year averages for Incorporated Places (1-year for populations over 65,000 and 5-year for populations under 65,000). Geographies with fewer than 100 households are not included. Therefore, totals will not match the parish-level numbers.
ALICE IN SABINE PARISH
2022 Point-in-Time Data
Population: 22,209 • Number of Households: 8,339
Median Household Income: $40,777 (state average: $55,416)
Labor Force Participation Rate: 44.7% (state average: 59.4%)
ALICE Households: 36% (state average: 32%) • Households in Poverty: 23% (state average: 19%)
Financial Hardship Over Time
ALICE is an acronym for Asset Limited, Income Constrained, Employed — households that earn more than the Federal Poverty Level, but less than the basic cost of living for the parish (the ALICE Threshold). Households below the ALICE Threshold — ALICE households plus those in poverty — can’t afford the essentials.
Households move below or above the ALICE Threshold as economic factors and circumstances change. This was especially true amid the economic crosscurrents of the COVID-19 pandemic, with higher wages, inflation, and additional pandemic assistance. By 2022, 4,937 households (59%) were below the ALICE Threshold in Sabine Parish.
The Cost of Basics Outpaces Wages
The Household Survival Budget reflects the minimum cost to live and work in the current economy and includes housing, child care, food, transportation, health care, technology, and taxes. It does not include savings for emergencies or future goals like college or retirement. The Household Survival Budget is calculated at the parish level and by household composition, as costs can vary greatly depending on location and household needs.
In 2022, household costs in Sabine Parish were well above the Federal Poverty Level of $13,590 for a single adult and $27,750 for a family of four.
To see costs for different household compositions in Sabine Parish, visit UnitedForALICE.org/Household-Budgets/ Louisiana
Households by Income, Sabine Parish, 2010–2022
Note: See an interactive version of this data at UnitedForALICE.org/Louisiana
Sources: ALICE Threshold, 2010–2022; American Community Survey, 2010–2022
*Wage working full-time required to support this budget For ALICE Survival Budget sources, visit UnitedForALICE.org/Methodology
Financial Hardship
is Not Evenly Distributed
Groups with the largest number of households below the ALICE Threshold tend to also be the largest demographic groups. However, when looking at the percentage of each group that is below the ALICE Threshold, some groups are more likely to be ALICE than others. By addressing the disparities in financial hardship by parish demographics, community members can move toward more equitable solutions. Visit UnitedForALICE.org/Louisiana to view more national, state, and parish data.
Household Financial Status by Household Type, Sabine Parish, 2022
Sources: ALICE Threshold, 2022; American Community Survey, 2022
Household Financial Status by Race/Ethnicity, Sabine Parish, 2022
Note: Asian, Black, and White racial categories are for one race alone. Race and Hispanic ethnicity are overlapping categories. The Asian and Black groups may include Hispanic households; the White group includes only White, non-Hispanic households. The Hispanic ethnic group may include households of any race.
Sources: ALICE Threshold, 2022; American Community Survey, 2022
Note: Municipal-level data on this page is 1 or 5-year averages for Incorporated Places (1-year for populations over 65,000 and 5-year for populations under 65,000). Geographies with fewer than 100 households are not included. Therefore, totals will not match the parish-level numbers.
ALICE IN ST. BERNARD PARISH
2022 Point-in-Time Data
Population: 44,038 • Number of Households: 15,732
Median Household Income: $55,857 (state average: $55,416)
Labor Force Participation Rate: 60.5% (state average: 59.4%)
ALICE Households: 32% (state average: 32%) • Households in Poverty: 22% (state average: 19%)
Financial Hardship Over Time
ALICE is an acronym for Asset Limited, Income Constrained, Employed — households that earn more than the Federal Poverty Level, but less than the basic cost of living for the parish (the ALICE Threshold). Households below the ALICE Threshold — ALICE households plus those in poverty — can’t afford the essentials.
Households move below or above the ALICE Threshold as economic factors and circumstances change. This was especially true amid the economic crosscurrents of the COVID-19 pandemic, with higher wages, inflation, and additional pandemic assistance. By 2022, 8,556 households (54%) were below the ALICE Threshold in St. Bernard Parish.
The Cost of Basics
Outpaces Wages
The Household Survival Budget reflects the minimum cost to live and work in the current economy and includes housing, child care, food, transportation, health care, technology, and taxes. It does not include savings for emergencies or future goals like college or retirement. The Household Survival Budget is calculated at the parish level and by household composition, as costs can vary greatly depending on location and household needs.
In 2022, household costs in St. Bernard Parish were well above the Federal Poverty Level of $13,590 for a single adult and $27,750 for a family of four.
To see costs for different household compositions in St. Bernard Parish, visit UnitedForALICE.org/Household-Budgets/ Louisiana
Households by Income, St. Bernard Parish, 2010–2022
Note: See an interactive version of this data at UnitedForALICE.org/Louisiana Sources: ALICE Threshold, 2010–2022; American Community Survey, 2010–2022
*Wage working full-time required to support this budget For ALICE Survival Budget sources, visit UnitedForALICE.org/Methodology
Household Survival Budget, St. Bernard Parish, 2022
Financial Hardship
is Not Evenly Distributed
Groups with the largest number of households below the ALICE Threshold tend to also be the largest demographic groups. However, when looking at the percentage of each group that is below the ALICE Threshold, some groups are more likely to be ALICE than others. By addressing the disparities in financial hardship by parish demographics, community members can move toward more equitable solutions. Visit UnitedForALICE.org/Louisiana to view more national, state, and parish data.
Household Financial Status by Household Type, St. Bernard Parish, 2022
Sources: ALICE Threshold, 2022; American Community Survey, 2022
Household Financial Status by Race/Ethnicity, St. Bernard Parish, 2022
Note: Asian, Black, and White racial categories are for one race alone. Race and Hispanic ethnicity are overlapping categories. The Asian and Black groups may include Hispanic households; the White group includes only White, non-Hispanic households. The Hispanic ethnic group may include households of any race.
Sources: ALICE Threshold, 2022; American Community Survey, 2022
Note: Municipal-level data on this page is 1 or 5-year averages for Incorporated Places (1-year for populations over 65,000 and 5-year for populations under 65,000). Geographies with fewer than 100 households are not included. Therefore, totals will not match the parish-level numbers.
ALICE IN ST. CHARLES PARISH
2022 Point-in-Time Data
Population: 52,191 • Number of Households: 18,591
Median Household Income: $79,191 (state average: $55,416)
Labor Force Participation Rate: 63.9% (state average: 59.4%)
ALICE Households: 31% (state average: 32%) • Households in Poverty: 11% (state average: 19%)
Financial Hardship Over Time
ALICE is an acronym for Asset Limited, Income Constrained, Employed — households that earn more than the Federal Poverty Level, but less than the basic cost of living for the parish (the ALICE Threshold). Households below the ALICE Threshold — ALICE households plus those in poverty — can’t afford the essentials.
Households move below or above the ALICE Threshold as economic factors and circumstances change. This was especially true amid the economic crosscurrents of the COVID-19 pandemic, with higher wages, inflation, and additional pandemic assistance. By 2022, 7,820 households (42%) were below the ALICE Threshold in St. Charles Parish.
The Cost of Basics Outpaces Wages
The Household Survival Budget reflects the minimum cost to live and work in the current economy and includes housing, child care, food, transportation, health care, technology, and taxes. It does not include savings for emergencies or future goals like college or retirement. The Household Survival Budget is calculated at the parish level and by household composition, as costs can vary greatly depending on location and household needs.
In 2022, household costs in St. Charles Parish were well above the Federal Poverty Level of $13,590 for a single adult and $27,750 for a family of four.
To see costs for different household compositions in St. Charles Parish, visit UnitedForALICE.org/Household-Budgets/ Louisiana
Households by Income, St. Charles Parish, 2010–2022
Note: See an interactive version of this data at UnitedForALICE.org/Louisiana Sources: ALICE Threshold, 2010–2022; American Community Survey, 2010–2022
*Wage working full-time required to support this budget For ALICE Survival Budget sources, visit UnitedForALICE.org/Methodology
Household Survival Budget, St. Charles Parish, 2022
Financial Hardship
is Not Evenly Distributed
Groups with the largest number of households below the ALICE Threshold tend to also be the largest demographic groups. However, when looking at the percentage of each group that is below the ALICE Threshold, some groups are more likely to be ALICE than others. By addressing the disparities in financial hardship by parish demographics, community members can move toward more equitable solutions. Visit UnitedForALICE.org/Louisiana to view more national, state, and parish data.
Household Financial Status by Household Type,
St. Charles Parish, 2022
Sources: ALICE Threshold, 2022; American Community Survey, 2022
Household Financial Status by Race/Ethnicity, St. Charles Parish, 2022
Note: Asian, Black, and White racial categories are for one race alone. Race and Hispanic ethnicity are overlapping categories. The Asian and Black groups may include Hispanic households; the White group includes only White, non-Hispanic households. The Hispanic ethnic group may include households of any race.
Sources: ALICE Threshold, 2022; American Community Survey, 2022
Note: Municipal-level data on this page is 1 or 5-year averages for Incorporated Places (1-year for populations over 65,000 and 5-year for populations under 65,000). Geographies with fewer than 100 households are not included. Therefore, totals will not match the parish-level numbers.
ALICE IN ST. HELENA PARISH
2022 Point-in-Time Data
Population: 10,872 • Number of Households: 4,004
Median Household Income: $46,402 (state average: $55,416)
Labor Force Participation Rate: 55.8% (state average: 59.4%)
ALICE Households: 35% (state average: 32%) • Households in Poverty: 29% (state average: 19%)
Financial Hardship Over Time
ALICE is an acronym for Asset Limited, Income Constrained, Employed — households that earn more than the Federal Poverty Level, but less than the basic cost of living for the parish (the ALICE Threshold). Households below the ALICE Threshold — ALICE households plus those in poverty — can’t afford the essentials.
Households move below or above the ALICE Threshold as economic factors and circumstances change. This was especially true amid the economic crosscurrents of the COVID-19 pandemic, with higher wages, inflation, and additional pandemic assistance. By 2022, 2,566 households (64%) were below the ALICE Threshold in St. Helena Parish.
The Cost of Basics
Outpaces Wages
The Household Survival Budget reflects the minimum cost to live and work in the current economy and includes housing, child care, food, transportation, health care, technology, and taxes. It does not include savings for emergencies or future goals like college or retirement. The Household Survival Budget is calculated at the parish level and by household composition, as costs can vary greatly depending on location and household needs.
In 2022, household costs in St. Helena Parish were well above the Federal Poverty Level of $13,590 for a single adult and $27,750 for a family of four.
To see costs for different household compositions in St. Helena Parish, visit UnitedForALICE.org/Household-Budgets/ Louisiana
Households by Income, St. Helena Parish, 2010–2022
Note: See an interactive version of this data at UnitedForALICE.org/Louisiana
Sources: ALICE Threshold, 2010–2022; American Community Survey, 2010–2022
*Wage working full-time required to support this budget For ALICE Survival Budget sources, visit UnitedForALICE.org/Methodology
Household Survival Budget, St. Helena Parish, 2022
Financial Hardship is Not Evenly
Distributed
Groups with the largest number of households below the ALICE Threshold tend to also be the largest demographic groups. However, when looking at the percentage of each group that is below the ALICE Threshold, some groups are more likely to be ALICE than others. By addressing the disparities in financial hardship by parish demographics, community members can move toward more equitable solutions.
Visit UnitedForALICE.org/Louisiana to view more national, state, and parish data.
Household Financial Status by Household Type, St. Helena Parish, 2022
Sources: ALICE Threshold, 2022; American Community Survey, 2022
Household Financial Status by Race/Ethnicity, St. Helena Parish, 2022
Note: Asian, Black, and White racial categories are for one race alone. Race and Hispanic ethnicity are overlapping categories. The Asian and Black groups may include Hispanic households; the White group includes only White, non-Hispanic households. The Hispanic ethnic group may include households of any race.
Sources: ALICE Threshold, 2022; American Community Survey, 2022
Note: Municipal-level data on this page is 1 or 5-year averages for Incorporated Places (1-year for populations over 65,000 and 5-year for populations under 65,000). Geographies with fewer than 100 households are not included. Therefore, totals will not match the parish-level numbers.
St. Helena Parish, 2022
ALICE IN ST. JAMES PARISH
2022 Point-in-Time Data
Population: 20,090 • Number of Households: 7,498
Median Household Income: $62,946 (state average: $55,416)
Labor Force Participation Rate: 57.9% (state average: 59.4%)
ALICE Households: 35% (state average: 32%) • Households in Poverty: 13% (state average: 19%)
Financial Hardship Over Time
ALICE is an acronym for Asset Limited, Income Constrained, Employed — households that earn more than the Federal Poverty Level, but less than the basic cost of living for the parish (the ALICE Threshold). Households below the ALICE Threshold — ALICE households plus those in poverty — can’t afford the essentials.
Households move below or above the ALICE Threshold as economic factors and circumstances change. This was especially true amid the economic crosscurrents of the COVID-19 pandemic, with higher wages, inflation, and additional pandemic assistance. By 2022, 3,551 households (47%) were below the ALICE Threshold in St. James Parish.
The Cost of Basics Outpaces Wages
The Household Survival Budget reflects the minimum cost to live and work in the current economy and includes housing, child care, food, transportation, health care, technology, and taxes. It does not include savings for emergencies or future goals like college or retirement. The Household Survival Budget is calculated at the parish level and by household composition, as costs can vary greatly depending on location and household needs.
In 2022, household costs in St. James Parish were well above the Federal Poverty Level of $13,590 for a single adult and $27,750 for a family of four.
To see costs for different household compositions in St. James Parish, visit UnitedForALICE.org/Household-Budgets/ Louisiana
Households by Income, St. James Parish, 2010–2022
Note: See an interactive version of this data at UnitedForALICE.org/Louisiana
Sources: ALICE Threshold, 2010–2022; American Community Survey, 2010–2022
*Wage working full-time required to support this budget For ALICE Survival Budget sources, visit UnitedForALICE.org/Methodology
Household Survival Budget, St. James Parish,
Financial Hardship
is Not Evenly Distributed
Groups with the largest number of households below the ALICE Threshold tend to also be the largest demographic groups. However, when looking at the percentage of each group that is below the ALICE Threshold, some groups are more likely to be ALICE than others. By addressing the disparities in financial hardship by parish demographics, community members can move toward more equitable solutions. Visit UnitedForALICE.org/Louisiana to view more national, state, and parish data.
Household Financial Status by Household Type, St. James Parish, 2022
Sources: ALICE Threshold, 2022; American Community Survey, 2022
Household Financial Status by Race/Ethnicity, St. James Parish, 2022
Note: Asian, Black, and White racial categories are for one race alone. Race and Hispanic ethnicity are overlapping categories. The Asian and Black groups may include Hispanic households; the White group includes only White, non-Hispanic households. The Hispanic ethnic group may include households of any race.
Sources: ALICE Threshold, 2022; American Community Survey, 2022
Note: Municipal-level data on this page is 1 or 5-year averages for Incorporated Places (1-year for populations over 65,000 and 5-year for populations under 65,000). Geographies with fewer than 100 households are not included. Therefore, totals will not match the parish-level numbers.
ALICE IN ST. JOHN THE BAPTIST PARISH
2022 Point-in-Time Data
Population: 41,986 • Number of Households: 15,232
Median Household Income: $65,114 (state average: $55,416)
Labor Force Participation Rate: 60.1% (state average: 59.4%)
ALICE Households: 33% (state average: 32%) • Households in Poverty: 14% (state average: 19%)
Financial Hardship Over Time
ALICE is an acronym for Asset Limited, Income Constrained, Employed — households that earn more than the Federal Poverty Level, but less than the basic cost of living for the parish (the ALICE Threshold). Households below the ALICE Threshold — ALICE households plus those in poverty — can’t afford the essentials.
Households move below or above the ALICE Threshold as economic factors and circumstances change. This was especially true amid the economic crosscurrents of the COVID-19 pandemic, with higher wages, inflation, and additional pandemic assistance. By 2022, 7,127 households (47%) were below the ALICE Threshold in St. John the Baptist Parish.
The Cost of Basics
Outpaces Wages
The Household Survival Budget reflects the minimum cost to live and work in the current economy and includes housing, child care, food, transportation, health care, technology, and taxes. It does not include savings for emergencies or future goals like college or retirement. The Household Survival Budget is calculated at the parish level and by household composition, as costs can vary greatly depending on location and household needs.
In 2022, household costs in St. John the Baptist Parish were well above the Federal Poverty Level of $13,590 for a single adult and $27,750 for a family of four.
To see costs for different household compositions in St. John the Baptist Parish, visit UnitedForALICE.org/ Household-Budgets/Louisiana
Households
Note: See an interactive version of this data at UnitedForALICE.org/Louisiana Sources: ALICE Threshold, 2010–2022; American Community Survey, 2010–2022
*Wage working full-time required to support this budget For ALICE Survival Budget sources, visit UnitedForALICE.org/Methodology
by Income, St. John the Baptist Parish, 2010–2022
Household Survival Budget, St. John the Baptist Parish, 2022
Financial
Hardship is Not Evenly Distributed
Groups with the largest number of households below the ALICE Threshold tend to also be the largest demographic groups. However, when looking at the percentage of each group that is below the ALICE Threshold, some groups are more likely to be ALICE than others. By addressing the disparities in financial hardship by parish demographics, community members can move toward more equitable solutions. Visit UnitedForALICE.org/Louisiana to view more national, state, and parish data.
Household Financial Status by Household Type, St. John the Baptist Parish, 2022
Sources: ALICE Threshold, 2022; American Community Survey, 2022
Household Financial Status by Race/Ethnicity, St.
John the Baptist Parish, 2022
Note: Asian, Black, and White racial categories are for one race alone. Race and Hispanic ethnicity are overlapping categories. The Asian and Black groups may include Hispanic households; the White group includes only White, non-Hispanic households. The Hispanic ethnic group may include households of any race.
Sources: ALICE Threshold, 2022; American Community Survey, 2022
St. John the Baptist Parish, 2022
Note: Municipal-level data on this page is 1 or 5-year averages for Incorporated Places (1-year for populations over 65,000 and 5-year for populations under 65,000). Geographies with fewer than 100 households are not included. Therefore, totals will not match the parish-level numbers.
ALICE IN ST. LANDRY PARISH
2022 Point-in-Time Data
Population: 81,773 • Number of Households: 32,021
Median Household Income: $41,976 (state average: $55,416)
Labor Force Participation Rate: 52.3% (state average: 59.4%)
ALICE Households: 28% (state average: 32%) • Households in Poverty: 29% (state average: 19%)
Financial Hardship Over Time
ALICE is an acronym for Asset Limited, Income Constrained, Employed — households that earn more than the Federal Poverty Level, but less than the basic cost of living for the parish (the ALICE Threshold). Households below the ALICE Threshold — ALICE households plus those in poverty — can’t afford the essentials.
Households move below or above the ALICE Threshold as economic factors and circumstances change. This was especially true amid the economic crosscurrents of the COVID-19 pandemic, with higher wages, inflation, and additional pandemic assistance. By 2022, 18,376 households (57%) were below the ALICE Threshold in St. Landry Parish.
The Cost of Basics
Outpaces Wages
The Household Survival Budget reflects the minimum cost to live and work in the current economy and includes housing, child care, food, transportation, health care, technology, and taxes. It does not include savings for emergencies or future goals like college or retirement. The Household Survival Budget is calculated at the parish level and by household composition, as costs can vary greatly depending on location and household needs.
In 2022, household costs in St. Landry Parish were well above the Federal Poverty Level of $13,590 for a single adult and $27,750 for a family of four.
To see costs for different household compositions in St. Landry Parish, visit UnitedForALICE.org/Household-Budgets/ Louisiana
Households by Income, St. Landry Parish, 2010–2022
Note: See an interactive version of this data at UnitedForALICE.org/Louisiana Sources: ALICE Threshold, 2010–2022; American Community Survey, 2010–2022
*Wage working full-time required to support this budget For ALICE Survival Budget sources, visit UnitedForALICE.org/Methodology
Household Survival Budget, St. Landry Parish, 2022
Financial Hardship
is Not Evenly Distributed
Groups with the largest number of households below the ALICE Threshold tend to also be the largest demographic groups. However, when looking at the percentage of each group that is below the ALICE Threshold, some groups are more likely to be ALICE than others. By addressing the disparities in financial hardship by parish demographics, community members can move toward more equitable solutions. Visit UnitedForALICE.org/Louisiana to view more national, state, and parish data.
Household Financial Status by Household Type,
St. Landry Parish, 2022
Sources: ALICE Threshold, 2022; American Community Survey, 2022
Household Financial Status by Race/Ethnicity, St. Landry Parish, 2022
Note: Asian, Black, and White racial categories are for one race alone. Race and Hispanic ethnicity are overlapping categories. The Asian and Black groups may include Hispanic households; the White group includes only White, non-Hispanic households. The Hispanic ethnic group may include households of any race.
Sources: ALICE Threshold, 2022; American Community Survey, 2022
Note: Municipal-level data on this page is 1 or 5-year averages for Incorporated Places (1-year for populations over 65,000 and 5-year for populations under 65,000). Geographies with fewer than 100 households are not included. Therefore, totals will not match the parish-level numbers.
St. Landry Parish, 2022
ALICE IN ST. MARTIN PARISH
2022 Point-in-Time Data
Population: 51,856 • Number of Households: 19,874
Median Household Income: $50,806 (state average: $55,416)
Labor Force Participation Rate: 57.7% (state average: 59.4%)
ALICE Households: 35% (state average: 32%) • Households in Poverty: 19% (state average: 19%)
Financial Hardship Over Time
ALICE is an acronym for Asset Limited, Income Constrained, Employed — households that earn more than the Federal Poverty Level, but less than the basic cost of living for the parish (the ALICE Threshold). Households below the ALICE Threshold — ALICE households plus those in poverty — can’t afford the essentials.
Households move below or above the ALICE Threshold as economic factors and circumstances change. This was especially true amid the economic crosscurrents of the COVID-19 pandemic, with higher wages, inflation, and additional pandemic assistance. By 2022, 10,677 households (54%) were below the ALICE Threshold in St. Martin Parish.
The Cost of Basics
Outpaces Wages
The Household Survival Budget reflects the minimum cost to live and work in the current economy and includes housing, child care, food, transportation, health care, technology, and taxes. It does not include savings for emergencies or future goals like college or retirement. The Household Survival Budget is calculated at the parish level and by household composition, as costs can vary greatly depending on location and household needs.
In 2022, household costs in St. Martin Parish were well above the Federal Poverty Level of $13,590 for a single adult and $27,750 for a family of four.
To see costs for different household compositions in St. Martin Parish, visit UnitedForALICE.org/Household-Budgets/ Louisiana
Households by Income, St. Martin Parish, 2010–2022
Note: See an interactive version of this data at UnitedForALICE.org/Louisiana Sources: ALICE Threshold, 2010–2022; American Community Survey, 2010–2022
*Wage working full-time required to support this budget For ALICE Survival Budget sources, visit UnitedForALICE.org/Methodology
Household Survival Budget, St. Martin Parish, 2022
Financial Hardship
is Not Evenly Distributed
Groups with the largest number of households below the ALICE Threshold tend to also be the largest demographic groups. However, when looking at the percentage of each group that is below the ALICE Threshold, some groups are more likely to be ALICE than others. By addressing the disparities in financial hardship by parish demographics, community members can move toward more equitable solutions. Visit UnitedForALICE.org/Louisiana to view more national, state, and parish data.
Household Financial Status by Household Type, St. Martin Parish, 2022
Sources: ALICE Threshold, 2022; American Community Survey, 2022
Household Financial Status by Race/Ethnicity, St. Martin Parish, 2022
Note: Asian, Black, and White racial categories are for one race alone. Race and Hispanic ethnicity are overlapping categories. The Asian and Black groups may include Hispanic households; the White group includes only White, non-Hispanic households. The Hispanic ethnic group may include households of any race.
Sources: ALICE Threshold, 2022; American Community Survey, 2022
Martin Parish, 2022
Note: Municipal-level data on this page is 1 or 5-year averages for Incorporated Places (1-year for populations over 65,000 and 5-year for populations under 65,000). Geographies with fewer than 100 households are not included. Therefore, totals will not match the parish-level numbers.
St.
ALICE IN ST. MARY PARISH
2022 Point-in-Time Data
Population: 49,114 • Number of Households: 18,628
Median Household Income: $47,322 (state average: $55,416)
Labor Force Participation Rate: 53.4% (state average: 59.4%)
ALICE Households: 32% (state average: 32%) • Households in Poverty: 23% (state average: 19%)
Financial Hardship Over Time
ALICE is an acronym for Asset Limited, Income Constrained, Employed — households that earn more than the Federal Poverty Level, but less than the basic cost of living for the parish (the ALICE Threshold). Households below the ALICE Threshold — ALICE households plus those in poverty — can’t afford the essentials.
Households move below or above the ALICE Threshold as economic factors and circumstances change. This was especially true amid the economic crosscurrents of the COVID-19 pandemic, with higher wages, inflation, and additional pandemic assistance. By 2022, 10,233 households (55%) were below the ALICE Threshold in St. Mary Parish.
The Cost of Basics Outpaces Wages
The Household Survival Budget reflects the minimum cost to live and work in the current economy and includes housing, child care, food, transportation, health care, technology, and taxes. It does not include savings for emergencies or future goals like college or retirement. The Household Survival Budget is calculated at the parish level and by household composition, as costs can vary greatly depending on location and household needs.
In 2022, household costs in St. Mary Parish were well above the Federal Poverty Level of $13,590 for a single adult and $27,750 for a family of four.
To see costs for different household compositions in St. Mary Parish, visit UnitedForALICE.org/Household-Budgets/ Louisiana
Households by Income, St. Mary Parish, 2010–2022
Note: See an interactive version of this data at UnitedForALICE.org/Louisiana Sources: ALICE Threshold, 2010–2022; American Community Survey, 2010–2022
*Wage working full-time required to support this budget For ALICE Survival Budget sources, visit UnitedForALICE.org/Methodology
Household Survival Budget, St. Mary Parish, 2022
Financial Hardship
is Not Evenly Distributed
Groups with the largest number of households below the ALICE Threshold tend to also be the largest demographic groups. However, when looking at the percentage of each group that is below the ALICE Threshold, some groups are more likely to be ALICE than others. By addressing the disparities in financial hardship by parish demographics, community members can move toward more equitable solutions. Visit UnitedForALICE.org/Louisiana to view more national, state, and parish data.
Household Financial Status by Household Type,
St. Mary Parish, 2022
Sources: ALICE Threshold, 2022; American Community Survey, 2022
Household Financial Status by Race/Ethnicity, St. Mary Parish, 2022
Note: Asian, Black, and White racial categories are for one race alone. Race and Hispanic ethnicity are overlapping categories. The Asian and Black groups may include Hispanic households; the White group includes only White, non-Hispanic households. The Hispanic ethnic group may include households of any race.
Sources: ALICE Threshold, 2022; American Community Survey, 2022
Note: Municipal-level data on this page is 1 or 5-year averages for Incorporated Places (1-year for populations over 65,000 and 5-year for populations under 65,000). Geographies with fewer than 100 households are not included. Therefore, totals will not match the parish-level numbers.
St. Mary Parish,
ALICE IN ST. TAMMANY PARISH
2022 Point-in-Time Data
Population: 273,263 • Number of Households: 106,109
Median Household Income: $76,269 (state average: $55,416)
Labor Force Participation Rate: 63% (state average: 59.4%)
ALICE Households: 33% (state average: 32%) • Households in Poverty: 11% (state average: 19%)
Financial Hardship Over Time
ALICE is an acronym for Asset Limited, Income Constrained, Employed — households that earn more than the Federal Poverty Level, but less than the basic cost of living for the parish (the ALICE Threshold). Households below the ALICE Threshold — ALICE households plus those in poverty — can’t afford the essentials.
Households move below or above the ALICE Threshold as economic factors and circumstances change. This was especially true amid the economic crosscurrents of the COVID-19 pandemic, with higher wages, inflation, and additional pandemic assistance. By 2022, 46,546 households (44%) were below the ALICE Threshold in St. Tammany Parish.
The Cost of Basics Outpaces Wages
The Household Survival Budget reflects the minimum cost to live and work in the current economy and includes housing, child care, food, transportation, health care, technology, and taxes. It does not include savings for emergencies or future goals like college or retirement. The Household Survival Budget is calculated at the parish level and by household composition, as costs can vary greatly depending on location and household needs.
In 2022, household costs in St. Tammany Parish were well above the Federal Poverty Level of $13,590 for a single adult and $27,750 for a family of four.
To see costs for different household compositions in St. Tammany Parish, visit UnitedForALICE.org/Household-Budgets/ Louisiana
Households by Income, St. Tammany Parish, 2010–2022
Note: See an interactive version of this data at UnitedForALICE.org/Louisiana Sources: ALICE Threshold, 2010–2022; American Community Survey, 2010–2022
*Wage working full-time required to support this budget For ALICE Survival Budget sources, visit UnitedForALICE.org/Methodology
Household Survival Budget, St. Tammany Parish, 2022
Financial Hardship
is Not Evenly Distributed
Groups with the largest number of households below the ALICE Threshold tend to also be the largest demographic groups. However, when looking at the percentage of each group that is below the ALICE Threshold, some groups are more likely to be ALICE than others. By addressing the disparities in financial hardship by parish demographics, community members can move toward more equitable solutions. Visit UnitedForALICE.org/Louisiana to view more national, state, and parish data.
Household Financial Status by Household Type, St. Tammany Parish, 2022
Sources: ALICE Threshold, 2022; American Community Survey, 2022
Household Financial Status by Race/Ethnicity, St. Tammany Parish, 2022
Note: Asian, Black, and White racial categories are for one race alone. Race and Hispanic ethnicity are overlapping categories. The Asian and Black groups may include Hispanic households; the White group includes only White, non-Hispanic households. The Hispanic ethnic group may include households of any race.
Sources: ALICE Threshold, 2022; American Community Survey, 2022
Note: Municipal-level data on this page is 1 or 5-year averages for Incorporated Places (1-year for populations over 65,000 and 5-year for populations under 65,000). Geographies with fewer than 100 households are not included. Therefore, totals will not match the parish-level numbers.
St. Tammany Parish, 2022
ALICE IN TANGIPAHOA PARISH
2022 Point-in-Time Data
Population: 137,048 • Number of Households: 51,689
Median Household Income: $55,391 (state average: $55,416)
Labor Force Participation Rate: 60.1% (state average: 59.4%)
ALICE Households: 32% (state average: 32%) • Households in Poverty: 20% (state average: 19%)
Financial Hardship Over Time
ALICE is an acronym for Asset Limited, Income Constrained, Employed — households that earn more than the Federal Poverty Level, but less than the basic cost of living for the parish (the ALICE Threshold). Households below the ALICE Threshold — ALICE households plus those in poverty — can’t afford the essentials.
Households move below or above the ALICE Threshold as economic factors and circumstances change. This was especially true amid the economic crosscurrents of the COVID-19 pandemic, with higher wages, inflation, and additional pandemic assistance. By 2022, 27,097 households (52%) were below the ALICE Threshold in Tangipahoa Parish.
The Cost of Basics
Outpaces Wages
The Household Survival Budget reflects the minimum cost to live and work in the current economy and includes housing, child care, food, transportation, health care, technology, and taxes. It does not include savings for emergencies or future goals like college or retirement. The Household Survival Budget is calculated at the parish level and by household composition, as costs can vary greatly depending on location and household needs.
In 2022, household costs in Tangipahoa Parish were well above the Federal Poverty Level of $13,590 for a single adult and $27,750 for a family of four.
To see costs for different household compositions in Tangipahoa Parish, visit UnitedForALICE.org/Household-Budgets/ Louisiana
Households
Note: See an interactive version of this data at UnitedForALICE.org/Louisiana Sources: ALICE Threshold, 2010–2022; American Community Survey, 2010–2022
*Wage working full-time required to support this budget For ALICE Survival Budget sources, visit UnitedForALICE.org/Methodology
by Income, Tangipahoa Parish, 2010–2022
Household Survival Budget, Tangipahoa Parish, 2022
Financial Hardship
is Not Evenly Distributed
Groups with the largest number of households below the ALICE Threshold tend to also be the largest demographic groups. However, when looking at the percentage of each group that is below the ALICE Threshold, some groups are more likely to be ALICE than others. By addressing the disparities in financial hardship by parish demographics, community members can move toward more equitable solutions. Visit UnitedForALICE.org/Louisiana to view more national, state, and parish data.
Household Financial Status by Household Type, Tangipahoa Parish, 2022
Sources: ALICE Threshold, 2022; American Community Survey, 2022
Household Financial Status by Race/Ethnicity, Tangipahoa Parish, 2022
Note: Asian, Black, and White racial categories are for one race alone. Race and Hispanic ethnicity are overlapping categories. The Asian and Black groups may include Hispanic households; the White group includes only White, non-Hispanic households. The Hispanic ethnic group may include households of any race.
Sources: ALICE Threshold, 2022; American Community Survey, 2022
Parish, 2022
Note: Municipal-level data on this page is 1 or 5-year averages for Incorporated Places (1-year for populations over 65,000 and 5-year for populations under 65,000). Geographies with fewer than 100 households are not included. Therefore, totals will not match the parish-level numbers.
Tangipahoa
ALICE IN TENSAS PARISH
2022 Point-in-Time Data
Population: 4,127 • Number of Households: 1,593
Median Household Income: $35,653 (state average: $55,416)
Labor Force Participation Rate: 40.6% (state average: 59.4%)
ALICE Households: 40% (state average: 32%) • Households in Poverty: 28% (state average: 19%)
Financial Hardship Over Time
ALICE is an acronym for Asset Limited, Income Constrained, Employed — households that earn more than the Federal Poverty Level, but less than the basic cost of living for the parish (the ALICE Threshold). Households below the ALICE Threshold — ALICE households plus those in poverty — can’t afford the essentials.
Households move below or above the ALICE Threshold as economic factors and circumstances change. This was especially true amid the economic crosscurrents of the COVID-19 pandemic, with higher wages, inflation, and additional pandemic assistance. By 2022, 1,074 households (67%) were below the ALICE Threshold in Tensas Parish.
The Cost of Basics Outpaces Wages
The Household Survival Budget reflects the minimum cost to live and work in the current economy and includes housing, child care, food, transportation, health care, technology, and taxes. It does not include savings for emergencies or future goals like college or retirement. The Household Survival Budget is calculated at the parish level and by household composition, as costs can vary greatly depending on location and household needs.
In 2022, household costs in Tensas Parish were well above the Federal Poverty Level of $13,590 for a single adult and $27,750 for a family of four.
To see costs for different household compositions in Tensas Parish, visit UnitedForALICE.org/Household-Budgets/ Louisiana
Households by Income, Tensas Parish, 2010–2022
Note: See an interactive version of this data at UnitedForALICE.org/Louisiana
Sources: ALICE Threshold, 2010–2022; American Community Survey, 2010–2022
*Wage working full-time required to support this budget For ALICE Survival Budget sources, visit UnitedForALICE.org/Methodology
Household Survival Budget, Tensas Parish, 2022
Financial Hardship is Not Evenly Distributed
Groups with the largest number of households below the ALICE Threshold tend to also be the largest demographic groups. However, when looking at the percentage of each group that is below the ALICE Threshold, some groups are more likely to be ALICE than others. By addressing the disparities in financial hardship by parish demographics, community members can move toward more equitable solutions. Visit UnitedForALICE.org/Louisiana to view more national, state, and parish data.
Household Financial Status by Household Type, Tensas Parish, 2022
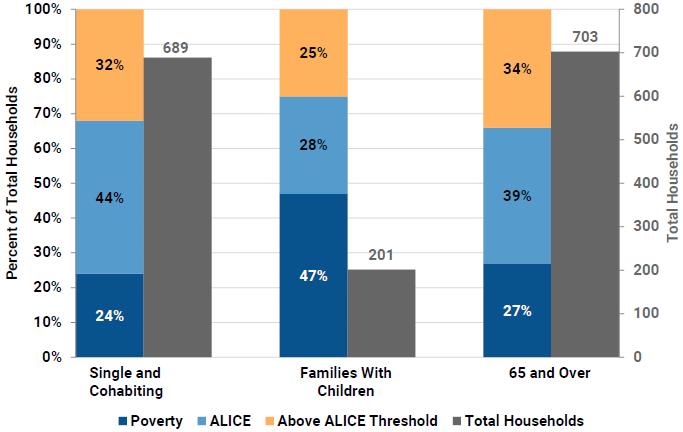
Sources: ALICE Threshold, 2022; American Community Survey, 2022
Household Financial Status by Race/Ethnicity, Tensas Parish, 2022
Note: Asian, Black, and White racial categories are for one race alone. Race and Hispanic ethnicity are overlapping categories. The Asian and Black groups may include Hispanic households; the White group includes only White, non-Hispanic households. The Hispanic ethnic group may include households of any race.
Sources: ALICE Threshold, 2022; American Community Survey, 2022
Note: Municipal-level data on this page is 1 or 5-year averages for Incorporated Places (1-year for populations over 65,000 and 5-year for populations under 65,000). Geographies with fewer than 100 households are not included. Therefore, totals will not match the parish-level numbers.
Tensas Parish, 2022
ALICE IN TERREBONNE PARISH
2022 Point-in-Time Data
Population: 104,786 • Number of Households: 40,011
Median Household Income: $57,299 (state average: $55,416)
Labor Force Participation Rate: 56.9% (state average: 59.4%)
ALICE Households: 32% (state average: 32%) • Households in Poverty: 15% (state average: 19%)
Financial Hardship Over Time
ALICE is an acronym for Asset Limited, Income Constrained, Employed — households that earn more than the Federal Poverty Level, but less than the basic cost of living for the parish (the ALICE Threshold). Households below the ALICE Threshold — ALICE households plus those in poverty — can’t afford the essentials.
Households move below or above the ALICE Threshold as economic factors and circumstances change. This was especially true amid the economic crosscurrents of the COVID-19 pandemic, with higher wages, inflation, and additional pandemic assistance. By 2022, 18,967 households (47%) were below the ALICE Threshold in Terrebonne Parish.
The Cost of Basics Outpaces Wages
The Household Survival Budget reflects the minimum cost to live and work in the current economy and includes housing, child care, food, transportation, health care, technology, and taxes. It does not include savings for emergencies or future goals like college or retirement. The Household Survival Budget is calculated at the parish level and by household composition, as costs can vary greatly depending on location and household needs.
In 2022, household costs in Terrebonne Parish were well above the Federal Poverty Level of $13,590 for a single adult and $27,750 for a family of four.
To see costs for different household compositions in Terrebonne Parish, visit UnitedForALICE.org/Household-Budgets/ Louisiana
Households by Income, Terrebonne Parish, 2010–2022
Note: See an interactive version of this data at UnitedForALICE.org/Louisiana Sources: ALICE Threshold, 2010–2022; American Community Survey, 2010–2022
*Wage working full-time required to support this budget For ALICE Survival Budget sources, visit UnitedForALICE.org/Methodology
Household Survival Budget, Terrebonne Parish, 2022
Financial Hardship
is Not Evenly Distributed
Groups with the largest number of households below the ALICE Threshold tend to also be the largest demographic groups. However, when looking at the percentage of each group that is below the ALICE Threshold, some groups are more likely to be ALICE than others. By addressing the disparities in financial hardship by parish demographics, community members can move toward more equitable solutions. Visit UnitedForALICE.org/Louisiana to view more national, state, and parish data.
Household Financial Status by Household Type, Terrebonne Parish, 2022
Sources: ALICE Threshold, 2022; American Community Survey, 2022
Household Financial Status by Race/Ethnicity, Terrebonne Parish, 2022
Note: Asian, Black, and White racial categories are for one race alone. Race and Hispanic ethnicity are overlapping categories. The Asian and Black groups may include Hispanic households; the White group includes only White, non-Hispanic households. The Hispanic ethnic group may include households of any race.
Sources: ALICE Threshold, 2022; American Community Survey, 2022
Terrebonne Parish, 2022
Note: Municipal-level data on this page is 1 or 5-year averages for Incorporated Places (1-year for populations over 65,000 and 5-year for populations under 65,000). Geographies with fewer than 100 households are not included. Therefore, totals will not match the parish-level numbers.
ALICE IN UNION PARISH
Point-in-Time Data
Population: 21,049 • Number of Households: 8,172
Median Household Income: $47,068 (state average: $55,416)
Labor Force Participation Rate: 49.7% (state average: 59.4%)
ALICE Households: 28% (state average: 32%) • Households in Poverty: 26% (state average: 19%)
Financial Hardship Over Time
ALICE is an acronym for Asset Limited, Income Constrained, Employed — households that earn more than the Federal Poverty Level, but less than the basic cost of living for the parish (the ALICE Threshold). Households below the ALICE Threshold — ALICE households plus those in poverty — can’t afford the essentials.
Households move below or above the ALICE Threshold as economic factors and circumstances change. This was especially true amid the economic crosscurrents of the COVID-19 pandemic, with higher wages, inflation, and additional pandemic assistance. By 2022, 4,432 households (54%) were below the ALICE Threshold in Union Parish.
The Cost of Basics Outpaces Wages
The Household Survival Budget reflects the minimum cost to live and work in the current economy and includes housing, child care, food, transportation, health care, technology, and taxes. It does not include savings for emergencies or future goals like college or retirement. The Household Survival Budget is calculated at the parish level and by household composition, as costs can vary greatly depending on location and household needs.
In 2022, household costs in Union Parish were well above the Federal Poverty Level of $13,590 for a single adult and $27,750 for a family of four.
To see costs for different household compositions in Union Parish, visit UnitedForALICE.org/Household-Budgets/ Louisiana
Households by Income, Union Parish, 2010–2022
Note: See an interactive version of this data at UnitedForALICE.org/Louisiana
Sources: ALICE Threshold, 2010–2022; American Community Survey, 2010–2022
*Wage working full-time required to support this budget For ALICE Survival Budget sources, visit UnitedForALICE.org/Methodology
Household Survival Budget, Union Parish,
Financial Hardship
is Not Evenly Distributed
Groups with the largest number of households below the ALICE Threshold tend to also be the largest demographic groups. However, when looking at the percentage of each group that is below the ALICE Threshold, some groups are more likely to be ALICE than others. By addressing the disparities in financial hardship by parish demographics, community members can move toward more equitable solutions. Visit UnitedForALICE.org/Louisiana to view more national, state, and parish data.
Household Financial Status by Household Type, Union Parish, 2022
Sources: ALICE Threshold, 2022; American Community Survey, 2022
Household Financial Status by Race/Ethnicity, Union Parish, 2022
Note: Asian, Black, and White racial categories are for one race alone. Race and Hispanic ethnicity are overlapping categories. The Asian and Black groups may include Hispanic households; the White group includes only White, non-Hispanic households. The Hispanic ethnic group may include households of any race.
Sources: ALICE Threshold, 2022; American Community Survey, 2022
Note: Municipal-level data on this page is 1 or 5-year averages for Incorporated Places (1-year for populations over 65,000 and 5-year for populations under 65,000). Geographies with fewer than 100 households are not included. Therefore, totals will not match the parish-level numbers.
ALICE IN VERMILION PARISH
2022 Point-in-Time Data
Population: 57,202 • Number of Households: 21,704
Median Household Income: $56,194 (state average: $55,416)
Labor Force Participation Rate: 55.6% (state average: 59.4%)
ALICE Households: 27% (state average: 32%) • Households in Poverty: 20% (state average: 19%)
Financial Hardship Over Time
ALICE is an acronym for Asset Limited, Income Constrained, Employed — households that earn more than the Federal Poverty Level, but less than the basic cost of living for the parish (the ALICE Threshold). Households below the ALICE Threshold — ALICE households plus those in poverty — can’t afford the essentials.
Households move below or above the ALICE Threshold as economic factors and circumstances change. This was especially true amid the economic crosscurrents of the COVID-19 pandemic, with higher wages, inflation, and additional pandemic assistance. By 2022, 10,177 households (47%) were below the ALICE Threshold in Vermilion Parish.
The Cost of Basics Outpaces Wages
The Household Survival Budget reflects the minimum cost to live and work in the current economy and includes housing, child care, food, transportation, health care, technology, and taxes. It does not include savings for emergencies or future goals like college or retirement. The Household Survival Budget is calculated at the parish level and by household composition, as costs can vary greatly depending on location and household needs.
In 2022, household costs in Vermilion Parish were well above the Federal Poverty Level of $13,590 for a single adult and $27,750 for a family of four.
To see costs for different household compositions in Vermilion Parish, visit UnitedForALICE.org/Household-Budgets/ Louisiana
Households by Income, Vermilion Parish, 2010–2022
Note: See an interactive version of this data at UnitedForALICE.org/Louisiana Sources: ALICE Threshold, 2010–2022; American Community Survey, 2010–2022
*Wage working full-time required to support this budget For ALICE Survival Budget sources, visit UnitedForALICE.org/Methodology
Survival Budget, Vermilion Parish,
Financial Hardship is Not
Evenly Distributed
Groups with the largest number of households below the ALICE Threshold tend to also be the largest demographic groups. However, when looking at the percentage of each group that is below the ALICE Threshold, some groups are more likely to be ALICE than others. By addressing the disparities in financial hardship by parish demographics, community members can move toward more equitable solutions. Visit UnitedForALICE.org/Louisiana to view more national, state, and parish data.
Household Financial Status by Household Type, Vermilion Parish, 2022
Sources: ALICE Threshold, 2022; American Community Survey, 2022
Household Financial Status by Race/Ethnicity, Vermilion Parish, 2022
Note: Asian, Black, and White racial categories are for one race alone. Race and Hispanic ethnicity are overlapping categories. The Asian and Black groups may include Hispanic households; the White group includes only White, non-Hispanic households. The Hispanic ethnic group may include households of any race.
Sources: ALICE Threshold, 2022; American Community Survey, 2022
Note: Municipal-level data on this page is 1 or 5-year averages for Incorporated Places (1-year for populations over 65,000 and 5-year for populations under 65,000). Geographies with fewer than 100 households are not included. Therefore, totals will not match the parish-level numbers.
Vermilion Parish, 2022
ALICE IN VERNON PARISH
2022 Point-in-Time Data
Population: 48,452 • Number of Households: 17,726
Median Household Income: $56,547 (state average: $55,416)
Labor Force Participation Rate: 59.8% (state average: 59.4%)
ALICE Households: 33% (state average: 32%) • Households in Poverty: 18% (state average: 19%)
Financial Hardship Over Time
ALICE is an acronym for Asset Limited, Income Constrained, Employed — households that earn more than the Federal Poverty Level, but less than the basic cost of living for the parish (the ALICE Threshold). Households below the ALICE Threshold — ALICE households plus those in poverty — can’t afford the essentials.
Households move below or above the ALICE Threshold as economic factors and circumstances change. This was especially true amid the economic crosscurrents of the COVID-19 pandemic, with higher wages, inflation, and additional pandemic assistance. By 2022, 9,196 households (52%) were below the ALICE Threshold in Vernon Parish.
The Cost of Basics Outpaces Wages
The Household Survival Budget reflects the minimum cost to live and work in the current economy and includes housing, child care, food, transportation, health care, technology, and taxes. It does not include savings for emergencies or future goals like college or retirement. The Household Survival Budget is calculated at the parish level and by household composition, as costs can vary greatly depending on location and household needs.
In 2022, household costs in Vernon Parish were well above the Federal Poverty Level of $13,590 for a single adult and $27,750 for a family of four.
To see costs for different household compositions in Vernon Parish, visit UnitedForALICE.org/Household-Budgets/ Louisiana
Households by Income, Vernon Parish, 2010–2022
Note: See an interactive version of this data at UnitedForALICE.org/Louisiana Sources: ALICE Threshold, 2010–2022; American Community Survey, 2010–2022
*Wage working full-time required to support this budget For ALICE Survival Budget sources, visit UnitedForALICE.org/Methodology
Household Survival Budget, Vernon Parish, 2022
Financial Hardship
is Not Evenly Distributed
Groups with the largest number of households below the ALICE Threshold tend to also be the largest demographic groups. However, when looking at the percentage of each group that is below the ALICE Threshold, some groups are more likely to be ALICE than others. By addressing the disparities in financial hardship by parish demographics, community members can move toward more equitable solutions. Visit UnitedForALICE.org/Louisiana to view more national, state, and parish data.
Household Financial Status by Household Type, Vernon Parish, 2022
Sources: ALICE Threshold, 2022; American Community Survey, 2022
Household Financial Status by Race/Ethnicity, Vernon Parish, 2022
Note: Asian, Black, and White racial categories are for one race alone. Race and Hispanic ethnicity are overlapping categories. The Asian and Black groups may include Hispanic households; the White group includes only White, non-Hispanic households. The Hispanic ethnic group may include households of any race.
Sources: ALICE Threshold, 2022; American Community Survey, 2022
Note: Municipal-level data on this page is 1 or 5-year averages for Incorporated Places (1-year for populations over 65,000 and 5-year for populations under 65,000). Geographies with fewer than 100 households are not included. Therefore, totals will not match the parish-level numbers.
ALICE IN WASHINGTON PARISH
2022 Point-in-Time Data
Population: 45,514 • Number of Households: 17,162
Median Household Income: $41,803 (state average: $55,416)
Labor Force Participation Rate: 51.7% (state average: 59.4%)
ALICE Households: 36% (state average: 32%) • Households in Poverty: 25% (state average: 19%)
Financial Hardship Over Time
ALICE is an acronym for Asset Limited, Income Constrained, Employed — households that earn more than the Federal Poverty Level, but less than the basic cost of living for the parish (the ALICE Threshold). Households below the ALICE Threshold — ALICE households plus those in poverty — can’t afford the essentials.
Households move below or above the ALICE Threshold as economic factors and circumstances change. This was especially true amid the economic crosscurrents of the COVID-19 pandemic, with higher wages, inflation, and additional pandemic assistance. By 2022, 10,423 households (61%) were below the ALICE Threshold in Washington Parish.
The Cost of Basics Outpaces Wages
The Household Survival Budget reflects the minimum cost to live and work in the current economy and includes housing, child care, food, transportation, health care, technology, and taxes. It does not include savings for emergencies or future goals like college or retirement. The Household Survival Budget is calculated at the parish level and by household composition, as costs can vary greatly depending on location and household needs.
In 2022, household costs in Washington Parish were well above the Federal Poverty Level of $13,590 for a single adult and $27,750 for a family of four.
To see costs for different household compositions in Washington Parish, visit UnitedForALICE.org/Household-Budgets/ Louisiana
Households by Income, Washington Parish, 2010–2022
Note: See an interactive version of this data at UnitedForALICE.org/Louisiana
Sources: ALICE Threshold, 2010–2022; American Community Survey, 2010–2022
*Wage working full-time required to support this budget For ALICE Survival Budget sources, visit UnitedForALICE.org/Methodology
Household Survival Budget, Washington Parish, 2022
Financial Hardship
is Not Evenly Distributed
Groups with the largest number of households below the ALICE Threshold tend to also be the largest demographic groups. However, when looking at the percentage of each group that is below the ALICE Threshold, some groups are more likely to be ALICE than others. By addressing the disparities in financial hardship by parish demographics, community members can move toward more equitable solutions. Visit UnitedForALICE.org/Louisiana to view more national, state, and parish data.
Household Financial Status by Household Type, Washington Parish, 2022
Sources: ALICE Threshold, 2022; American Community Survey, 2022
Household Financial Status by Race/Ethnicity, Washington Parish, 2022
Note: Asian, Black, and White racial categories are for one race alone. Race and Hispanic ethnicity are overlapping categories. The Asian and Black groups may include Hispanic households; the White group includes only White, non-Hispanic households. The Hispanic ethnic group may include households of any race.
Sources: ALICE Threshold, 2022; American Community Survey, 2022
Note: Municipal-level data on this page is 1 or 5-year averages for Incorporated Places (1-year for populations over 65,000 and 5-year for populations under 65,000). Geographies with fewer than 100 households are not included. Therefore, totals will not match the parish-level numbers.
ALICE IN WEBSTER PARISH
2022 Point-in-Time Data
Population: 36,761 • Number of Households: 14,801
Median Household Income: $34,263 (state average: $55,416)
Labor Force Participation Rate: 46.7% (state average: 59.4%)
ALICE Households: 37% (state average: 32%) • Households in Poverty: 28% (state average: 19%)
Financial Hardship Over Time
ALICE is an acronym for Asset Limited, Income Constrained, Employed — households that earn more than the Federal Poverty Level, but less than the basic cost of living for the parish (the ALICE Threshold). Households below the ALICE Threshold — ALICE households plus those in poverty — can’t afford the essentials.
Households move below or above the ALICE Threshold as economic factors and circumstances change. This was especially true amid the economic crosscurrents of the COVID-19 pandemic, with higher wages, inflation, and additional pandemic assistance. By 2022, 9,546 households (64%) were below the ALICE Threshold in Webster Parish.
The Cost of Basics Outpaces Wages
The Household Survival Budget reflects the minimum cost to live and work in the current economy and includes housing, child care, food, transportation, health care, technology, and taxes. It does not include savings for emergencies or future goals like college or retirement. The Household Survival Budget is calculated at the parish level and by household composition, as costs can vary greatly depending on location and household needs.
In 2022, household costs in Webster Parish were well above the Federal Poverty Level of $13,590 for a single adult and $27,750 for a family of four.
To see costs for different household compositions in Webster Parish, visit UnitedForALICE.org/Household-Budgets/ Louisiana
Households by Income, Webster Parish, 2010–2022
Note: See an interactive version of this data at UnitedForALICE.org/Louisiana
Sources: ALICE Threshold, 2010–2022; American Community Survey, 2010–2022
*Wage working full-time required to support this budget For ALICE Survival Budget sources, visit UnitedForALICE.org/Methodology
Household Survival Budget, Webster Parish, 2022
Financial Hardship
is Not Evenly Distributed
Groups with the largest number of households below the ALICE Threshold tend to also be the largest demographic groups. However, when looking at the percentage of each group that is below the ALICE Threshold, some groups are more likely to be ALICE than others. By addressing the disparities in financial hardship by parish demographics, community members can move toward more equitable solutions. Visit UnitedForALICE.org/Louisiana to view more national, state, and parish data.
Household Financial Status by Household Type, Webster Parish, 2022
Sources: ALICE Threshold, 2022; American Community Survey, 2022
Household Financial Status by Race/Ethnicity, Webster Parish, 2022
Note: Asian, Black, and White racial categories are for one race alone. Race and Hispanic ethnicity are overlapping categories. The Asian and Black groups may include Hispanic households; the White group includes only White, non-Hispanic households. The Hispanic ethnic group may include households of any race.
Sources: ALICE Threshold, 2022; American Community Survey, 2022
Note: Municipal-level data on this page is 1 or 5-year averages for Incorporated Places (1-year for populations over 65,000 and 5-year for populations under 65,000). Geographies with fewer than 100 households are not included. Therefore, totals will not match the parish-level numbers.
ALICE IN WEST BATON ROUGE PARISH
2022 Point-in-Time Data
Population: 27,377 • Number of Households: 10,080
Median Household Income: $80,510 (state average: $55,416)
Labor Force Participation Rate: 63% (state average: 59.4%)
ALICE Households: 28% (state average: 32%) • Households in Poverty: 12% (state average: 19%)
Financial Hardship Over Time
ALICE is an acronym for Asset Limited, Income Constrained, Employed — households that earn more than the Federal Poverty Level, but less than the basic cost of living for the parish (the ALICE Threshold). Households below the ALICE Threshold — ALICE households plus those in poverty — can’t afford the essentials.
Households move below or above the ALICE Threshold as economic factors and circumstances change. This was especially true amid the economic crosscurrents of the COVID-19 pandemic, with higher wages, inflation, and additional pandemic assistance. By 2022, 3,958 households (39%) were below the ALICE Threshold in West Baton Rouge Parish.
The Cost of Basics Outpaces Wages
The Household Survival Budget reflects the minimum cost to live and work in the current economy and includes housing, child care, food, transportation, health care, technology, and taxes. It does not include savings for emergencies or future goals like college or retirement. The Household Survival Budget is calculated at the parish level and by household composition, as costs can vary greatly depending on location and household needs.
In 2022, household costs in West Baton Rouge Parish were well above the Federal Poverty Level of $13,590 for a single adult and $27,750 for a family of four.
To see costs for different household compositions in West Baton Rouge Parish, visit UnitedForALICE.org/HouseholdBudgets/Louisiana
Households by Income, West Baton Rouge Parish, 2010–2022
Note: See an interactive version of this data at UnitedForALICE.org/Louisiana
Sources: ALICE Threshold, 2010–2022; American Community Survey, 2010–2022
*Wage working full-time required to support this budget For ALICE Survival Budget sources, visit UnitedForALICE.org/Methodology
Household Survival Budget, West Baton Rouge Parish, 2022
Financial Hardship
is Not Evenly Distributed
Groups with the largest number of households below the ALICE Threshold tend to also be the largest demographic groups. However, when looking at the percentage of each group that is below the ALICE Threshold, some groups are more likely to be ALICE than others. By addressing the disparities in financial hardship by parish demographics, community members can move toward more equitable solutions.
Visit UnitedForALICE.org/Louisiana to view more national, state, and parish data.
Household Financial Status by Household Type, West Baton Rouge Parish, 2022
Sources: ALICE Threshold, 2022; American Community Survey, 2022
Household Financial Status by Race/Ethnicity, West Baton Rouge Parish, 2022
Note: Asian, Black, and White racial categories are for one race alone. Race and Hispanic ethnicity are overlapping categories. The Asian and Black groups may include Hispanic households; the White group includes only White, non-Hispanic households. The Hispanic ethnic group may include households of any race.
Sources: ALICE Threshold, 2022; American Community Survey, 2022
Note: Municipal-level data on this page is 1 or 5-year averages for Incorporated Places (1-year for populations over 65,000 and 5-year for populations under 65,000). Geographies with fewer than 100 households are not included. Therefore, totals will not match the parish-level numbers.
West Baton Rouge Parish,
ALICE IN WEST CARROLL PARISH
2022 Point-in-Time Data
Population: 9,800 • Number of Households: 3,785
Median Household Income: $45,035 (state average: $55,416)
Labor Force Participation Rate: 48.5% (state average: 59.4%)
ALICE Households: 37% (state average: 32%) • Households in Poverty: 19% (state average: 19%)
Financial Hardship Over Time
ALICE is an acronym for Asset Limited, Income Constrained, Employed — households that earn more than the Federal Poverty Level, but less than the basic cost of living for the parish (the ALICE Threshold). Households below the ALICE Threshold — ALICE households plus those in poverty — can’t afford the essentials.
Households move below or above the ALICE Threshold as economic factors and circumstances change. This was especially true amid the economic crosscurrents of the COVID-19 pandemic, with higher wages, inflation, and additional pandemic assistance. By 2022, 2,091 households (55%) were below the ALICE Threshold in West Carroll Parish.
The Cost of Basics Outpaces Wages
The Household Survival Budget reflects the minimum cost to live and work in the current economy and includes housing, child care, food, transportation, health care, technology, and taxes. It does not include savings for emergencies or future goals like college or retirement. The Household Survival Budget is calculated at the parish level and by household composition, as costs can vary greatly depending on location and household needs.
In 2022, household costs in West Carroll Parish were well above the Federal Poverty Level of $13,590 for a single adult and $27,750 for a family of four.
To see costs for different household compositions in West Carroll Parish, visit UnitedForALICE.org/Household-Budgets/ Louisiana
Households by Income, West Carroll Parish, 2010–2022
Note: See an interactive version of this data at UnitedForALICE.org/Louisiana
Sources: ALICE Threshold, 2010–2022; American Community Survey, 2010–2022
*Wage working full-time required to support this budget For ALICE Survival Budget sources, visit UnitedForALICE.org/Methodology
Household Survival Budget, West Carroll Parish,
Financial Hardship
is Not Evenly Distributed
Groups with the largest number of households below the ALICE Threshold tend to also be the largest demographic groups. However, when looking at the percentage of each group that is below the ALICE Threshold, some groups are more likely to be ALICE than others. By addressing the disparities in financial hardship by parish demographics, community members can move toward more equitable solutions.
Visit UnitedForALICE.org/Louisiana to view more national, state, and parish data.
Household Financial Status by Household Type, West Carroll Parish, 2022
Sources: ALICE Threshold, 2022; American Community Survey, 2022
Household Financial Status by Race/Ethnicity, West Carroll Parish, 2022
Note: Asian, Black, and White racial categories are for one race alone. Race and Hispanic ethnicity are overlapping categories. The Asian and Black groups may include Hispanic households; the White group includes only White, non-Hispanic households. The Hispanic ethnic group may include households of any race.
Sources: ALICE Threshold, 2022; American Community Survey, 2022
Note: Municipal-level data on this page is 1 or 5-year averages for Incorporated Places (1-year for populations over 65,000 and 5-year for populations under 65,000). Geographies with fewer than 100 households are not included. Therefore, totals will not match the parish-level numbers.
ALICE IN WEST FELICIANA PARISH
2022 Point-in-Time Data
Population: 15,358 • Number of Households: 3,822
Median Household Income: $71,985 (state average: $55,416)
Labor Force Participation Rate: 47% (state average: 59.4%)
ALICE Households: 38% (state average: 32%) • Households in Poverty: 14% (state average: 19%)
Financial Hardship Over Time
ALICE is an acronym for Asset Limited, Income Constrained, Employed — households that earn more than the Federal Poverty Level, but less than the basic cost of living for the parish (the ALICE Threshold). Households below the ALICE Threshold — ALICE households plus those in poverty — can’t afford the essentials.
Households move below or above the ALICE Threshold as economic factors and circumstances change. This was especially true amid the economic crosscurrents of the COVID-19 pandemic, with higher wages, inflation, and additional pandemic assistance. By 2022, 1,980 households (52%) were below the ALICE Threshold in West Feliciana Parish.
The Cost of Basics Outpaces Wages
The Household Survival Budget reflects the minimum cost to live and work in the current economy and includes housing, child care, food, transportation, health care, technology, and taxes. It does not include savings for emergencies or future goals like college or retirement. The Household Survival Budget is calculated at the parish level and by household composition, as costs can vary greatly depending on location and household needs.
In 2022, household costs in West Feliciana Parish were well above the Federal Poverty Level of $13,590 for a single adult and $27,750 for a family of four.
To see costs for different household compositions in West Feliciana Parish, visit UnitedForALICE.org/HouseholdBudgets/Louisiana
Households by Income, West Feliciana Parish, 2010–2022
Note: See an interactive version of this data at UnitedForALICE.org/Louisiana
Sources: ALICE Threshold, 2010–2022; American Community Survey, 2010–2022
*Wage working full-time required to support this budget For ALICE Survival Budget sources, visit UnitedForALICE.org/Methodology
Household Survival Budget, West Feliciana Parish, 2022
Financial Hardship
is Not Evenly Distributed
Groups with the largest number of households below the ALICE Threshold tend to also be the largest demographic groups. However, when looking at the percentage of each group that is below the ALICE Threshold, some groups are more likely to be ALICE than others. By addressing the disparities in financial hardship by parish demographics, community members can move toward more equitable solutions.
Visit UnitedForALICE.org/Louisiana to view more national, state, and parish data.
Household Financial Status by Household Type, West Feliciana Parish, 2022
Sources: ALICE Threshold, 2022; American Community Survey, 2022
Household Financial Status by Race/Ethnicity, West Feliciana Parish, 2022
Note: Asian, Black, and White racial categories are for one race alone. Race and Hispanic ethnicity are overlapping categories. The Asian and Black groups may include Hispanic households; the White group includes only White, non-Hispanic households. The Hispanic ethnic group may include households of any race.
Sources: ALICE Threshold, 2022; American Community Survey, 2022
Note: Municipal-level data on this page is 1 or 5-year averages for Incorporated Places (1-year for populations over 65,000 and 5-year for populations under 65,000). Geographies with fewer than 100 households are not included. Therefore, totals will not match the parish-level numbers.
West Feliciana Parish, 2022
ALICE IN WINN PARISH
2022 Point-in-Time Data
Population: 13,665 • Number of Households: 4,882
Median Household Income: $44,922 (state average: $55,416)
Labor Force Participation Rate: 45.3% (state average: 59.4%)
ALICE Households: 38% (state average: 32%) • Households in Poverty: 19% (state average: 19%)
Financial Hardship Over Time
ALICE is an acronym for Asset Limited, Income Constrained, Employed — households that earn more than the Federal Poverty Level, but less than the basic cost of living for the parish (the ALICE Threshold). Households below the ALICE Threshold — ALICE households plus those in poverty — can’t afford the essentials.
Households move below or above the ALICE Threshold as economic factors and circumstances change. This was especially true amid the economic crosscurrents of the COVID-19 pandemic, with higher wages, inflation, and additional pandemic assistance. By 2022, 2,804 households (57%) were below the ALICE Threshold in Winn Parish.
The Cost of Basics Outpaces Wages
The Household Survival Budget reflects the minimum cost to live and work in the current economy and includes housing, child care, food, transportation, health care, technology, and taxes. It does not include savings for emergencies or future goals like college or retirement. The Household Survival Budget is calculated at the parish level and by household composition, as costs can vary greatly depending on location and household needs.
In 2022, household costs in Winn Parish were well above the Federal Poverty Level of $13,590 for a single adult and $27,750 for a family of four.
To see costs for different household compositions in Winn Parish, visit UnitedForALICE.org/Household-Budgets/ Louisiana
Households by Income, Winn Parish, 2010–2022
Note: See an interactive version of this data at UnitedForALICE.org/Louisiana
Sources: ALICE Threshold, 2010–2022; American Community Survey, 2010–2022
*Wage working full-time required to support this budget For ALICE Survival Budget sources, visit UnitedForALICE.org/Methodology
Household Survival Budget, Winn Parish, 2022
Financial Hardship is Not Evenly
Distributed
Groups with the largest number of households below the ALICE Threshold tend to also be the largest demographic groups. However, when looking at the percentage of each group that is below the ALICE Threshold, some groups are more likely to be ALICE than others. By addressing the disparities in financial hardship by parish demographics, community members can move toward more equitable solutions.
Visit UnitedForALICE.org/Louisiana to view more national, state, and parish data.
Household Financial Status by Household Type, Winn Parish, 2022
Sources: ALICE Threshold, 2022; American Community Survey, 2022
Household Financial Status by Race/Ethnicity, Winn Parish, 2022
Note: Asian, Black, and White racial categories are for one race alone. Race and Hispanic ethnicity are overlapping categories. The Asian and Black groups may include Hispanic households; the White group includes only White, non-Hispanic households. The Hispanic ethnic group may include households of any race.
Sources: ALICE Threshold, 2022; American Community Survey, 2022
Note: Municipal-level data on this page is 1 or 5-year averages for Incorporated Places (1-year for populations over 65,000 and 5-year for populations under 65,000). Geographies with fewer than 100 households are not included. Therefore, totals will not match the parish-level numbers.
Winn Parish, 2022