


STATUS REPORT Page 1 of 74 2010
the
Carlingford
Irish Lights Commission Report Ref: LA/CSR/07/11 Fairywater
Catchment Status Report
Loughs Agency of
Foyle
and
and Tributaries
Fairywater and Tributaries Catchment Status Report 2010

Report Reference LA/CSR/07/11
Headquarters 22, Victoria Road Londonderry
BT47 2AB
Northern Ireland
Tel: +44(0)28 71 342100
Fax: +44(0)28 71 342720
general@loughs ‐ agency.org
www.loughs ‐ agency.org
Regional Office
Dundalk Street
Carlingford Co Louth
Republic of Ireland
Tel+353(0)42 938 3888
Fax+353(0)42 938 3888
carlingford@loughs ‐agency.org
www.loughs ‐ agency.org
Picture of hen salmon courtesy of Atlantic Salmon Trust
Written and prepared by: Art Niven Rico Santiago Mairead O’Connor Declan Lawlor
FAIRYWATER AND TRIBUTARIES CATCHMENT STATUS REPORT Page 2 of 74
FAIRYWATER AND TRIBUTARIES CATCHMENT STATUS REPORT Page 3 of 74 Table of Contents 1.0 INTRODUCTION ................................................................................................................ 8 1.1 The Fairywater Catchment ........................................................................................ 10 Fig 1.11. Strule catchment topographical map with river network. .............................. 11 1.2 Atlantic Salmon and Sea Trout .................................................................................. 12 1.3 Non Salmonid Fish Species ........................................................................................ 12 Fig 1.3 Sample of fish from the Foyle estuary ................................................................ 12 2.0 ATLANTIC SALMON STOCKS ........................................................................................... 13 2.1 Redd Counts 13 Table 2.1 Redd counts for Foyle system 2004/05 – 2010/11. *Note 2006/07 had extremely poor water conditions for redd counting. 13 Fig 2.12 Redd counts for Foyle system 1952/53 – 2010/11. 14 2.2 Juvenile Abundance 15 Table 2.2 Loughs Agency semi‐quantitative electrofishing classification system for 0+ salmon and trout 16 Fig 2.2 Fairywater catchment salmon fry index 2000‐2010, based on mean salmon fry numbers at 9 standard sites surveyed annually 16 Fig 2.22. The mean abundance of salmon fry in 16 catchments in 2010 from semi quantitative electrofishing. 17 Fig 2.23 Salmon 0+ electrofishing site classification 2010 18 3.0 TROUT STOCKS................................................................................................................ 19 Fig 3 Electrofishing survey and trout parr ...................................................................... 19 Fig 3.1 Fairywater catchment trout fry index 2005‐2010, based on mean salmon fry numbers at 9 standard sites surveyed annually. ............................................................ 19 Fig 3.11. The mean abundance of trout fry in 16 catchments in 2010 from semi quantitative electrofishing. ............................................................................................ 20 Fig 3.12 Trout 0+ electrofishing site classification 2010 ................................................ 21 Fig 3.13 Salmon and Trout fry distribution 2010 ............................................................ 22 Fig 3.15 Total salmonid (salmon/trout fry and parr) distribution 2010 ......................... 23 Fig 3.16 Eel presence as recorded during semi quantitative electrofishing surveys 2010. *Note technique used is designed specifically for salmonids. ....................................... 24
Fig 3.17 Lamprey presence as recorded during semi quantitative electrofishing surveys 2010. *Note technique used is designed specifically for salmonids. Further surveys will be required to accurately monitor lamprey populations. .............................................. 25
Fig 3.18 Stickleback presence as recorded during semi quantitative electrofishing surveys 2010. *Note technique used is designed specifically for salmonids. ................ 26
Fig 3.18 Stoneloach presence as recorded during semi quantitative electrofishing surveys 2010. *Note technique used is designed specifically for salmonids. 27
Fig 3.19 Minnow presence as recorded during semi quantitative electrofishing surveys 2010. *Note technique used is designed specifically for salmonids. 28
4.0 MARINE SURVIVAL
Table 4 Marine survival rates for the River Bush of 1SW grilse (after exploitation at sea) pre 1996 and 2002‐2009 smolt cohort. Data supplied by Agri Food and Bioscience Institute, River Bush Salmon Research Station
Fig 4 Marine survey areas for salmon in 2008
Fig 4.1 Marine survey areas for salmon in 2009
Fig 4a RV Celtic Explorer SALSEA
Figure 4b Picture from the Irish Research Vessel Celtic Explorer taken during the second SALSEA research cruise 16‐24th May 2008
Figure 4c Rotary screw trap in position on the River Faughan directly below the fish pass at Campsie barrage. 33
Table 4.1 Numbers and average weight and length of salmon smolts tagged on the River Faughan 2003‐2009. Coded Wire Tagging equipment was purchased by the Loughs Agency in 2005 with funding secured from the European Regional Development Fund through the INTERREG IIIA Programme, administered by the Environment and Heritage Service, on behalf of the Department of Environment. ..... 33
Table 4.12 Recapture data from River Faughan CWT programme. No recaptures of fish tagged in 2008 were made in 2009. Data for fish tagged in 2009 and recovered in 2010 will not be available until 2011. It should also be noted that no commercial fishery has operated in the Foyle area since 2009. Screening of the commercial fishery produced the majority of tag recoveries in the Foyle area. ........................................................... 34
Figure 4d Salmon smolt run timing and abundance from rotary screw trap sub sample, River Faughan 2004‐2009. Breaks in data are due to closure of trap during high water conditions. ...................................................................................................................... 34
Table 4.13 Age class of salmon smolts migrating from the Faughan catchment in 2004
FAIRYWATER AND TRIBUTARIES CATCHMENT STATUS REPORT Page 4 of 74
29
29
30
31
32
research cruise
32
........................................................................................................................................
35
Fig 4.14. From top to bottom, Atlantic salmon smolts from the Faughan Catchment, brook lamprey, river lamprey and sea lamprey also caught in the River Faughan smolt trap
5.1
Table 5 Declared rod catch returns for salmon and trout in the Foyle and Carlingford areas. Note figures include the Clanrye and Whitewater in the Carlingford area from 2001 onwards. Carcass tagging was introduced in 2001.*Denotes all trout. 36
Table 5.1 Salmon rod
5.1
5.2 Commercial Fisheries
Table 5.2 Declared catch from the commercial salmon fisheries 1998‐2009. Note 100% rate of catch returns. * Reduced numbers of commercial nets operating in the Foyle area from 2007. No commercial Atlantic salmon fisheries have been pursued in the Foyle area since 2009 as a result of the enforcement of The Foyle Area (Control of Fishing) Regulations 2010; this does not prevent the reinstatement of commercial fisheries if prescribed conditions are met in the future. 39
Fig 5.21 Commercial Fishing. Draft netting on the tidal River Foyle and drift
Fig 5.3
Table 5.3 River Strule fish counter figures 2007‐2010. *Note 2007 figure is a partial count, also note the River Strule fish counter is a partial counting station. Fish may bypass the counting channel in high water conditions ..................................................
Fig 5.32
Table 5.31 Sion Mills fish counter figures 2002‐2010. *Note low counts in 2007 and 2008 were influenced by high water levels during peak run timing during June and July. Sion Mills is a partial counter and does not cover the entire length of the weir. In high water levels as experienced in 2007 and 2008 significant numbers of fish can bypass the counting channels. Methods to reduce this are being investigated as part of the Fish Counter Programme Review, commissioned in 2008. 2010 result affected by flooding and freezing conditions. ...................................................................................
Fig 5.33 Monthly fish counts on the River Mourne 2004‐2010 as recorded at Sion
FAIRYWATER AND TRIBUTARIES CATCHMENT STATUS REPORT Page 5 of 74
35 5.0 ADULT ABUNDANCE ....................................................................................................... 36
.................................................................................................................................
36
Recreational Fisheries ...............................................................................................
catch 37
38
Fig
Recreational fishers
38
netting in Lough Foyle 39
Counters 39
5.3
New
on
location for electronic fish counter ................................................................................ 40 Fig
Fish counting facilities at Sion Mills, River Mourne .......................................... 40
weir constructed
the River Strule in Omagh. Note central fish pass,
5.31
40
Monthly
counts
recorded at Omagh ............................................................................................................................ 41
fish
on the River Strule September 2007‐2010 as
41
42
Mills ........................................................................................................................................
8.0
Table 5.41 Upstream of Sion Mills estimated egg deposition 2005‐2010. *Note 2007, 2008 AND 2010 figures are minimum estimates of escapement due to high water levels resulting in the bypassing of the Sion Mills counting channels as well as damage caused to the counter in 2010 by the freezing winter conditions.
Fig 6.0 Life cycle unit depicting the type of habitat found in spawning,
Fig
Fig 8.01 Fairywater catchment average suspended solids
Fig. 8.06: How the different water quality element results are combined to classify ecological status, chemical status and the overall surface water status: Adapted from the ‘Recommendations on Surface Water Classifications Schemes for the purposes of the Water Framework Directive’ UKTAG 2006. .............................................................
Table
Table 8.08. Environmental Quality Ratio classifications for ASPT and NTaxa.
Table 8.09. Environmental Quality Ration Classifications for Diatoms and Macrophytes.
Table 8.010. Classification for General Chemical & Physiochemical Quality Elements.
Table 8.011. Favourable condition targets for Atlantic salmon .....................................
Figure 8.012. Flattened mayfly nymph from the order ephemeroptera high scoring macro
FAIRYWATER AND TRIBUTARIES CATCHMENT STATUS REPORT Page 6 of 74 Fig 5.34 Annual fish counts on the River Mourne 1957‐2010 ........................................ 43 5.4 Conservation Limits/Spawning targets ..................................................................... 44
44 6.0 HABITAT MONITORING 45
zones 45 Fig
habitat 45 Fig
46
LAND USE 47 Fig
Fairywater catchment land use classification 47
nursery and holding
6.01 Examples of spawning, nursery and holding
6.02 Habitat overview key for Fairywater Catchment
7.0
7.0
WATER QUALITY 49
quality testing in the laboratory ....................... 49
8.0 Loughs Agency chemical water
are in
52
Fairywater
2010.
in
.................. 53
2010. Values are in mg/l ............. 54
results 2010. Values
mg/l .................................................................................................................................
Fig 8.02
catchment Ammonia results
Values are
mg/l
Fig 8.03 Fairywater catchment phosphorous results
Fairywater catchment Biological Oxygen Demand (BOD) results 2010. Values are in mg/l....................................................................................................................... 55 Fig 8.05 Fairywater catchment Biological Monitoring Working Party results 2010 ...... 56
Fig 8.04
57
.............. 58
8.07. Quality elements which are monitored for the ecological status.
59
...............
........................................................................................................................................ 59
60
61
indicative of good water quality 61
invertebrate
Figure 8.013. Overall WFD surface water status for the Fairywater catchment 2009, at the time of writing no updated classification was available for 2010. ..........................
Figure 9.11. LA fish classification 2010 based on five sites surveyed within the Foyle area. ............................................................................................................................... .
Table 8.14 Depletion sampling results from WFD quantitative electrofishing survey on the Cappagh Burn 2009 (Strule Catchment)
Table 8.15 Species and numbers caught
Table 8.16 Density of species by age class per 100m2
FAIRYWATER AND TRIBUTARIES CATCHMENT STATUS REPORT Page 7 of 74
2010
63
62 8.1 WFD Fish Classifications
...................................................................................
63
WFD
surveillance monitoring stations in the Foyle system 64
Figure 8.12.
fish
Foyle system 65
Figure 8.13. WFD fish classifications in the
66
66
66
Length frequency distribution of juvenile salmon 67
Figure 8.17
distinct age groups/cohorts 67 9.0 CONSERVATION AND PROTECTION ................................................................................ 68 Table 9.0. Breakdown of conservation and protection duties in the Fairywater catchment 2002‐2010. ................................................................................................... 68 Table
Seized
salmon,
vehicles in the Foyle system 2003‐2010 ........................................................................................................................................ 68 Table 9.02 Seizures in the Fairywater catchment 2006‐2010. ....................................... 68 9.1 Habitat Improvement Works .................................................................................... 69 10.0 ENVIRONMENTAL ISSUES ............................................................................................. 69 11.0 DESIGNATED AREAS ...................................................................................................... 70 12.0 GENETIC STUDY ............................................................................................................. 71 13.0 POLLUTION MONITORING ............................................................................................ 71 14.0 FISHERY OFFICERS FAIRYWATER AREA REPORT 2010 .................................................. 72 15.0 ACTIONS FOR 2011 72 15.2 Fairywater Catchment Potential Habitat Improvement Schemes for 2011.......... 73 15.3 Fairywater Catchment Specific Actions for 2011 73
Figure 8.18 Length weight relationship of juvenile trout. *Note approximately 3
9.01
nets,
rod/reels and
Fairywater and Tributaries Catchment Status Report 2010
1.0 INTRODUCTION
Welcome to the 2010 series of Loughs Agency catchment status reports. Written in 2011 and reporting on 2010 the reports provide a review of fisheries and other associated information collected and management measures implemented within the freshwater catchments of the Foyle and Carlingford areas.
This is one of an annual series of catchment status reports produced by the Loughs Agency. The primary objective of the catchment status reports is to disseminate catchment specific information to all interested stakeholders. The reports continue to be consulted widely by a variety of stakeholders including local angling associations, fishery owners, statutory bodies, environmental consultants, students, conservation Non Governmental Organisations and private individuals. The catchment status reports provide summary data which demonstrates the work that the Loughs Agency conducts within specific catchments and outlines catchment specific objectives.
2010 witnessed significant regulatory change within the Foyle area with the implementation of the Foyle Area (Control of Fishing) Regulations 2010. This regulation expanded upon existing regulation governing the in season management of commercial and recreational Atlantic salmon and trout fisheries. The regulation also created a mechanism for regulating fisheries based on an assessment of the attainment of management targets for returning adult Atlantic salmon. In the event that set numbers of fish have not ascended key fish counter sites on the Rivers Roe, Faughan, Mourne and Finn prescribed management actions including suspension of commercial fisheries and recreational fisheries can be made. Additionally if management targets have not been met for a prescribed number of years the recreational fisheries can be made to adhere to compulsory catch and release and the commercial fisheries curtailed until prescribed conditions are met.
Due to the failure of the River Finn in Co Donegal to meet its management target for the prescribed period the commercial fisheries in Lough Foyle and the River Foyle were suspended in 2010 and the recreational game fisheries in the Rivers Foyle and Finn became compulsory catch and release.
Populations of Atlantic salmon are currently experiencing the lowest levels of marine survival on record. The Loughs Agency is continuing to conserve and protect the freshwater resources and habitats of the Foyle and Carlingford areas to ensure
FAIRYWATER AND TRIBUTARIES CATCHMENT STATUS REPORT Page 8 of 74
optimum conditions are available for all fish populations and the aquatic and riparian ecosystems that they form an integral part of.
The theme for the 2010 series of catchment status reports is fisheries biodiversity, monitoring and conservation. In 2010 the Loughs Agency in partnership with other statutory agencies has developed monitoring programmes for salmonids, lake fish, lampreys and European smelt. A series of individual reports on these surveys are available at www.loughs-agency.org under the publications section.
2010 saw the first specific lamprey surveys which we hope can contribute towards condition monitoring reports under reporting requirements for the European Union Habitats Directive. Baseline surveys of the native European smelt another fish species of conservation importance were also conducted demonstrating the diversity of fish populations within the Foyle and Carlingford areas.
A number of lake fish surveys following sampling methodologies developed under the Water Framework Directive were conducted in addition to the annual Water Framework Directive fish in rivers monitoring programme.
Other partnership programmes were also developed including the Lough Derg, wild trout conservation project.
The increasing diversity of freshwater monitoring programmes within the Foyle and Carlingford areas contributes towards the development of the area for sustainable recreation sympathetic towards the significant biodiversity resources present throughout the catchments.
All these programmes and more are presented and discussed across the 2010 series of fourteen catchment status reports.
Loughs Agency staff have continued to contribute significantly towards the conservation and protection of the fishery and aquatic resources of the Foyle and Carlingford areas, encouraging partnership building and actively engaging in participatory processes designed to ensure the sustainable development of our aquatic resources.
FAIRYWATER AND TRIBUTARIES CATCHMENT STATUS REPORT Page 9 of 74
1.1 The Fairywater Catchment
The Fairywater River flows eastwards from the foot of Bolaght Mountain in the west of Co Tyrone towards the River Strule to the north of Omagh. The Fairywater catchment includes the broad, marshy valley of the main Fairywater River and the undulating branching valley of the Drumquin River to the south.
The Fairywater valley is an expanse of peaty marsh, which extends across the valley floor. Fragmented remnants of the regular patchwork of small pastures remain on the outer margins of the valley floor but the field pattern breaks down in poorly drained areas to form a random, irregular mosaic of peaty marsh and woodland. Patches of woodland on the valley floor are a dense mixture of birch, willow and hawthorn. The Fairywater River and its many tributaries flow within gullies and branching channels on the valley floor. Small round loughs are found within the marsh, although they are often hidden from view by damp woodland. Towards the bottom of the Fairywater valley nearing the River Strule at Omagh, farmland has been drained and there is a considerable amount of intensive agricultural.
To the south, the Drumquin valley has a flat valley floor and undulating valley slopes with a small-scale, irregular patchwork of pastures. It is on the margins of the drumlin lowlands and the rounded landforms reflect this glacial influence. The Fairywater River has a main channel length of approximately 37km and has a catchment area of 179km2
The Fairywater catchment is impacted upon by a wide range of anthropogenic factors within both the terrestrial and aquatic environments. A diverse array of impacts include amongst others; agriculture, sand and gravel extraction, commercial forestry, commercial and recreational fishing, industry, water abstraction, sewage treatment, diffuse and point source pollution, invasive plant species, urban sprawl and flood defences.
Increasing pressures on the aquatic environment within the Fairywater catchment requires appropriate monitoring, control and remediation if native biodiversity is to be preserved. The proximity of the Fairywater catchment to an urban area and the surrounding land-use exacerbates many of these issues
As the competent authority for fishery issues within the catchment the Loughs Agency are required to fulfil a variety of national and international obligations. European Directives including the Habitats Directive and Water Framework Directive and the transposing national legislation have assisted in creating a legislative framework in which to drive forward sustainable management of riparian and aquatic habitats and the native species which inhabit them.
FAIRYWATER AND TRIBUTARIES CATCHMENT STATUS REPORT Page 10 of 74

STATUS REPORT Page
74
11 of
Fig 1.11. Strule catchment topographical map with river network.
1.2 Atlantic Salmon and Sea Trout
Salmon and Sea Trout are referred to as being anadromous meaning that they migrate between the freshwater and marine environments returning to freshwater to reproduce. This complex life history exposes them to varied environmental pressures and recreational and commercial fisheries.
Adult Atlantic salmon return to their natal rivers where spawning takes place. Sea trout also demonstrate an ability to return to their natal river but their homing instinct may not be as strong as those of the Atlantic salmon. After the eggs hatch the juveniles (initially referred to as fry and then parr) remain in freshwater for up to three years.
Smoltification is the physiological adaptation which occurs when the juvenile salmon change from the parr stage (freshwater phase) to the smolt stage (marine phase). In the Foyle system this can occur after one, two or three years. Most Foyle salmon (referred to as post smolts) will remain after smoltification in the North Atlantic for one year and are referred to on their return to the coast and rivers as grilse. Salmon which stay at sea for longer than one year are referred to as multi sea winter (MSW) salmon.
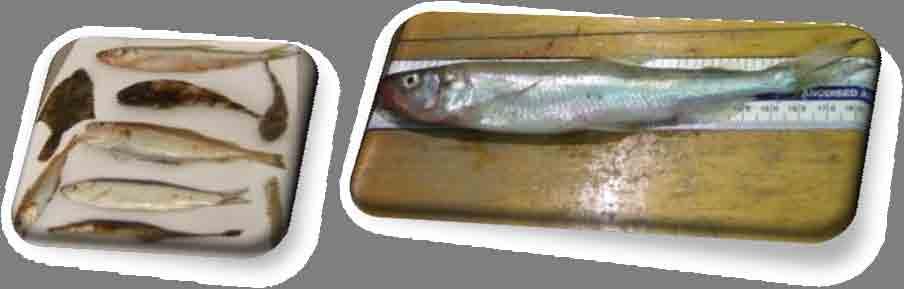
1.3 Non Salmonid Fish Species
As highlighted earlier populations of other non salmonid fish species occur within the Strule catchment. In the past monitoring was targeted at salmonid species however with obligations under the Water Framework Directive other non salmonid fish species are being monitored more closely.
Fish species presence and abundance can act as a good environmental/ecological indicator demonstrating the ability of the aquatic habitat to support a diverse array of native species. Populations of the European Eel, Stickleback, River/Brook and possibly Sea Lamprey form an important part of the native fisheries biodiversity of the Fairywater catchment. Maintaining high standards of water quality and appropriate habitat for these species is essential for the overall health of the aquatic ecosystem.
STATUS REPORT Page 12 of 74
Fig 1.3 Sample of fish from the Foyle estuary
2.0 ATLANTIC SALMON STOCKS
In order to describe the status of salmon stocks each of the following points need to be considered:
• Redd Counts
• Juvenile abundance
• Marine survival
• Adult abundance
• Exploitation
2.1 Redd Counts
Redds are spawning nests created by salmon or trout. Differentiation between salmon and trout redds can be made as salmon redds tend to be larger in size and trout tend to spawn earlier than salmon within the Foyle system. Research within the Foyle system using extensive annual redd count data has highlighted a good relationship between the number of redds and the total annual catch of salmon.
Table 2.1 shows redd count data for the Foyle system. Water flow is of significance when monitoring redds as in high water conditions the ability to see and count redds in rivers is impaired. Figure 2.1 outlines redd counts within the Foyle area.
Redd counting is not regularly conducted within the Fairywater catchment due to the small Atlantic salmon population present within this catchment.
Table 2.1 Redd counts for Foyle system 2004/05 – 2010/11. *Note 2006/07 had extremely poor water conditions for redd counting.
FAIRYWATER AND TRIBUTARIES CATCHMENT STATUS REPORT Page 13 of 74
Year 2005/06 2006/07 2007/08 2008/09 2009/10 2010/11 Foyle System 5354 1338 3039 5507 4000 3382
Foyle Area Redd Count 1952/53‐2010/11
STATUS REPORT Page
74
14 of
0 5000 10000 15000 20000 25000 Number of Redds Year
Fig 2.12 Redd counts for Foyle system 1952/53 – 2010/11.
2.2
Juvenile Abundance
Within the Loughs Agency jurisdiction trends in abundance of juvenile salmonids are monitored by annual semi-quantitative electrofishing surveys. The numbers, age and species of fish captured during five minute timed electrofishing surveys are compared with previous year’s data allowing for change to be monitored, facilitating suitable fishery management practices to be implemented.
In 2010 a total of 473 sites were semi-quantitatively electrofished within the Foyle system. The results for each site for salmon and trout are classified as excellent (>25 fish), good (15-24 fish), fair (5-15 fish), poor (1-4 fish) and absent (0 fish), Table 2.2. Figures 2.2 - 2.22 outline the salmon 0+ electrofishing results and site classifications for the Fairywater catchment in 2010. Please consult previous status reports for site classifications in other years.
Semi-quantitative electrofishing was developed to monitor 0+ salmonids (fry/young of the year). In order to quantify the abundance of 1+ salmonids (parr and older) fully quantitative electrofishing surveys are required which can be used to calculate fish densities within a defined area. Rivers and tributaries with good environmental quality are more likely to support good populations of each year class.
Fish populations can vary considerably over time and location, it is therefore necessary to monitor the populations over a period of years to highlight meaningful trends before considering remedial activities such as habitat improvement works. These trends are being continually monitored by the Loughs Agency and the most appropriate management options considered.
There are a variety of reasons why electrofishing sites may be perceived to be under producing, these can include, lack of suitable juvenile habitat, the presence of impassable obstacles to migratory fish species on lower sections of a tributary, pollution, inconsiderate channel maintenance, tunnelling by bank side vegetation, stream gradient and poor forestry practices etc. The critical point is to recognise the major factors at play and to investigate all possible reasons for underproduction accepting that there may be inherent reasons as to why production may not be improved upon in certain areas. When the same areas are surveyed for other non salmonid species it may be discovered that they provide habitat more suited to these species. Habitat improvement works and the rationale behind them are discussed in greater detail later.
Obligations under the Water Framework Directive are driving quantitative surveys of both salmonid and non salmonid species under proposed Surveillance, Operational, Investigative and Protected Area monitoring programmes.
STATUS REPORT Page 15 of 74
Table 2.2 Loughs Agency semi-quantitative electrofishing classification system for 0+ salmon and trout
Fairywater Average Salmon Fry (2005‐2010)

Fig 2.2 Fairywater catchment salmon fry index 2000-2010, based on
at 9 standard sites surveyed annually
16 of 74
FAIRYWATER AND TRIBUTARIES CATCHMENT STATUS REPORT
Symbol Grade Number of 0+ Salmonids Excellent >25 Good 15-24 Fair 5-14 Poor 1-4 Absent 0
Page
mean
numbers
00 1 00 1 0 0.2 0.4 0.6 0.8 1 1.2 200520062007200820092010 Average Fry/5 Minute Fishing Year
salmon fry
Salmon 0+
Summary of Salmon Fry Semi Quantitative Electrofishing Results 2010

STATUS REPORT Page 17 of 74
2010
semi quantitative
61 47 44 3838 29 23 9 7 555 22 1 0 0 10 20 30 40 50 60 70 Owenreagh East Faughan Roe Owenkillew Burn Dennet Derg Glenelly Camowen Drumagh Finn Strule Deele Owenreagh S Glenmornan Fairywater Foyle South Average Fry/5 Minute Fishing Catchment
Fig
2.22. The mean abundance of salmon fry in 16 catchments in
from
electrofishing.

FAIRYWATER AND TRIBUTARIES CATCHMENT STATUS REPORT Page 18 of 74
Fig 2.23 Salmon 0+ electrofishing site classification 2010
3.0 TROUT STOCKS
Annual trends in the populations of juvenile trout are also monitored within the Loughs Agency jurisdiction using the same methodology and classification system as those employed for salmon. The semi quantitative electrofishing results for trout fry in the Fairywater catchment and site classifications are displayed in Figs 3.1, 3.11 & 3.12.


STATUS REPORT Page 19 of 74
Fig 3 Electrofishing survey and trout parr
based on mean salmon fry numbers at 9 standard sites surveyed annually. 11 3 1 33 0 0.5 1 1.5 2 2.5 3 3.5 200520062007200820092010 Average Fry/5 Minute Fishing Year
Fig 3.1 Fairywater catchment trout fry index
2005-2010,
Fairywater Average Trout Fry (2005‐2010)
Trout 0+
Summary of Trout Fry Semi Quantitative Electrofishing Results 2010

STATUS REPORT Page 20 of 74
16
2010
semi quantitative electrofishing. 51 13 11 99 7 6666 5 4 33 1 0 0 10 20 30 40 50 60 Foyle South Glenmornan Faughan Roe Burn Dennet Camowen Strule Glenelly Owenreagh S Owenreagh East Drumagh Deele Fairywater Derg Finn Owenkillew Average Fry/5 Minute Fishing Catchment
Fig
3.11. The mean abundance of trout fry in
catchments in
from

FAIRYWATER AND TRIBUTARIES CATCHMENT STATUS REPORT Page 21 of 74
Fig 3.12 Trout 0+ electrofishing site classification 2010

STATUS REPORT Page 22 of 74
Fig 3.13 Salmon and Trout fry distribution 2010

FAIRYWATER AND TRIBUTARIES CATCHMENT STATUS REPORT Page 23 of 74
Fig 3.15 Total salmonid (salmon/trout fry and parr) distribution 2010

3.16 Eel presence as recorded during semi quantitative electrofishing surveys 2010. *Note technique used is designed specifically for salmonids.
FAIRYWATER AND TRIBUTARIES CATCHMENT STATUS REPORT Page
74
24 of
Fig

Fig 3.17 Lamprey presence as recorded during semi quantitative electrofishing surveys 2010. *Note technique used is designed specifically for salmonids. Further surveys will be required to accurately monitor lamprey populations.
FAIRYWATER AND TRIBUTARIES CATCHMENT STATUS REPORT Page
74
25 of

3.18 Stickleback presence as recorded during semi quantitative electrofishing surveys 2010. *Note technique used is designed specifically for salmonids.
FAIRYWATER AND TRIBUTARIES CATCHMENT STATUS REPORT Page 26 of 74
Fig

presence as recorded during semi quantitative electrofishing surveys 2010. *Note technique used is designed specifically for salmonids.
FAIRYWATER AND TRIBUTARIES CATCHMENT STATUS REPORT Page
74
27 of
Fig 3.18 Stoneloach

3.19
presence as recorded during semi quantitative electrofishing surveys 2010. *Note technique used is designed specifically for salmonids.
FAIRYWATER AND TRIBUTARIES CATCHMENT STATUS REPORT Page 28 of 74
Fig
Minnow
4.0 MARINE SURVIVAL
The numbers of salmon that survive to return to the freshwater environment are greatly influenced by conditions in the marine environment. Climate change leading to changes in sea surface temperatures, prey abundance, high seas fishing, marine pollution, sub lethal levels of pollution and predation all have an effect on the Atlantic salmon and indeed other migratory fish species chances of survival.
Marine survival trends are monitored on a number of index rivers in the North East Atlantic where total trapping facilities are available for both migrating juvenile and adult populations. Total trapping allows for an accurate count of all migrant smolts (total freshwater production) and returning adults to be made and therefore an accurate estimate of marine survival. These projects are facilitated by the use of Coded Wire Tags (CWT). Coded wire tags are small (2-3mm long) micro tags that are injected automatically by a CWT device into the snout cartilage of anaesthetised fish remaining there for the duration of the life of the fish. CWT fish also have their adipose fin (small fin between the dorsal fin and caudal fin (tail fin)) removed so that they can be identified in the various fisheries that may intercept them. In Ireland a comprehensive screening programme is conducted at all major landing ports and markets. This programme is important in monitoring the effect of the remaining salmon fisheries on salmon stocks from rivers both within and outside of the island of Ireland.
Trends in marine survival for the River Bush (nearest index river to the Foyle system) confirm patterns observed elsewhere on the southern stocks of North Eastern Atlantic salmon, which indicate that marine survival can be variable between stocks and years. In the River Bush marine survival has decreased considerably over recent years as outlined in Table 4.
Table 4 Marine survival rates for the River Bush of 1SW grilse (after exploitation at sea) pre 1996 and 2002-2009 smolt cohort. Data supplied by Agri Food and Bioscience Institute, River Bush Salmon Research Station
STATUS REPORT Page 29 of 74
Year of Smolt Cohort Year of Returning 1SW Grilse Marine Survival % Pre 1996 Pre 1998 Circa 30% 2002 2003 5.9 2003 2004 4.3 2004 2005 4.6 2005 2006 4.2 2006 2007 13.0 2007 2008 7.5 2008 2009 3.3 2009 2010 4.9
The figures outlined in table 4 are mirrored by those for other index rivers monitoring the southern stocks of North Eastern Atlantic salmon populations. These figures suggest that salmon are facing increased pressure for survival at sea. A major new international research project called SALSEA - Merge has been developed by scientists from the North Atlantic Salmon Conservation Organisation (NASCO) parties and its research wing the International Atlantic Salmon Research Board (IASRB). There are twenty consortium members in total including the Loughs Agency. SALSEA aims to monitor how Atlantic salmon use the ocean; where they go; how they use ocean currents, and the ocean’s food resources, and what factors influence migration and distribution at sea. Research cruises commenced in 2008 and continued in 2009 to collect the necessary data to answer the questions listed above. In 2008 426 post smolts were caught by the two Irish cruises and 363 post smolts caught by the Faroese in the areas highlighted below. In 2009 464 post smolts were captured during the two Irish Research cruises which concentrated on the continental shelf edge to the north west of Ireland and on the North Norwegian sea. Further information and project details can be found at: http://www.nasco.int/sas/salsea.htm


FAIRYWATER AND TRIBUTARIES CATCHMENT STATUS REPORT Page 30 of 74
Fig 4 Marine survey areas for salmon in 2008

FAIRYWATER AND TRIBUTARIES CATCHMENT STATUS REPORT
74
Page 31 of
Fig 4.1 Marine survey areas for salmon in 2009

FAIRYWATER AND TRIBUTARIES CATCHMENT STATUS REPORT Page
74
32 of
Fig 4a RV Celtic Explorer SALSEA research cruise
Figure 4b Picture from the Irish Research Vessel Celtic Explorer taken during the second SALSEA research cruise 16-24th May 2008
Since 2003 partial smolt trapping including CWT tagging has been conducted in the Faughan catchment using a rotary screw trap, Fig 4c.

4c Rotary screw trap in position on the River Faughan directly below the fish pass at Campsie barrage.
Smolt trapping can have a number of objectives including the monitoring of both salmonid and non salmonid species. Sampling of the age composition, obtaining information on run timing and recording length/weight data is conducted in tandem with the tagging programme. As mentioned above total counts of migrating smolts can be made on rivers. Where this is unfeasible due to the absence of total trapping facilities, total smolt migration can be estimated by means of a mark-recapture experiment.
In 2004 an estimate of total smolt production for the Faughan catchment was made by a mark-recapture study resulting in a minimum run size estimate of 33,854 migrating salmon smolts. The estimate was a minimum due to a number of high water events that prevented the smolt trap from fishing for a period of time during the peak smolt migration period. Tables 4.1 and 4.12 outline numbers of salmon smolts tagged from 2003-2008 and recapture data for 2003 and 2004.
Table 4.1 Numbers and average weight and length of salmon smolts tagged on the River Faughan 2003-2009. Coded Wire Tagging equipment was purchased by the Loughs Agency in 2005 with funding secured from the European Regional Development Fund through the INTERREG IIIA Programme, administered by the Environment and Heritage Service, on behalf of the Department of Environment.
FAIRYWATER AND TRIBUTARIES CATCHMENT STATUS REPORT Page
74
33 of
Figure
Year No of Salmon Smolts Tagged Average Length (mm) Average Weight (g) 2003 2113 149 33.45 2004 2500 134 24.6 2005 2210 133 23.6 2006 1025 133 25.36 2007 2062 135 27.1 2008 1865 130 22.1 2009 561 134 24.4
Greencastle, Burtonport, Malin Head, Belmullet and Torr Head
Greencastle, Malin Head, Donegal and Galway Bay
Greencastle and Ballycastle
Table 4.12 Recapture data from River Faughan CWT programme. No recaptures of fish tagged in 2008 were made in 2009. Data for fish tagged in 2009 and recovered in 2010 will not be available until 2011. It should also be noted that no commercial fishery has operated in the Foyle area since 2009. Screening of the commercial fishery produced the majority of tag recoveries in the Foyle area.
River Faughan Salmon Smolt Run Timing and
Figure 4d Salmon smolt run timing and abundance from rotary screw trap sub sample, River Faughan 2004-2009. Breaks in data are due to closure of trap during high water conditions.
FAIRYWATER AND TRIBUTARIES CATCHMENT STATUS REPORT Page 34 of 74 Year
2003 2004
Tagged Year Recaptured Numbers Recaptured Recapture Location
12
2004
2005 16
2005 2006 3
2006 2007 2
2007 2008 2009 2 1
Greencastle
Greencastle Greencastle
0 100 200 300 400 500 600 03 ‐Apr 05 ‐Apr 07 ‐Apr 09 ‐Apr 11 ‐Apr 13 ‐Apr 15 ‐Apr 17 ‐Apr 19 ‐Apr 21 ‐Apr 23 ‐Apr 25 ‐Apr 27 ‐Apr 29 ‐Apr 01 ‐May 03 ‐May 05 ‐May 07 ‐May 09 ‐May 11 ‐May 13 ‐May 15 ‐May 17 ‐May 19 ‐May 21 ‐May 23 ‐May Number of Salmon Smolts Trapped Date
2004 ‐ 2009 2004 2005 2006 2007 2008 2009
Abundance
In 2004 a detailed examination was carried out on the age class of migrating salmon smolts in the Faughan catchment, Table 4.13.
Age


FAIRYWATER AND TRIBUTARIES CATCHMENT STATUS REPORT Page
35 of 74
Age at Smolting % 1 13 2 83 3 4
Table 4.13
class of salmon smolts migrating from the Faughan catchment in 2004
Fig 4.14. From top to bottom, Atlantic salmon smolts from the Faughan Catchment, brook lamprey, river lamprey and sea lamprey also caught in the River Faughan smolt trap
5.0
ADULT ABUNDANCE
Adult Atlantic salmon abundance is assessed in three ways: directly by using commercial netting/recreational rod catches and fish counters and indirectly by reference to conservation limits/spawning targets.
Using catch data as a measure of population status is a well established and extensively used technique. In the Foyle system annual commercial and recreational catch data has been recorded since the establishment of the Foyle Fisheries Commission in 1952, with some data available before this period. The relationship between catch and stock is complex and care should be applied in interpretation. A more precise measure of catch incorporates fishing effort (number of licences issued or the amount of time fished) and is referred to as catch per unit effort (CPUE).
5.1 Recreational Fisheries
One problem encountered when analysing catch data is unreported catch. All recreational fishers are required by law to make catch returns. This information facilitates management decision making and therefore it is vitally important that all catch returns are accurate and made promptly at the seasons end.
Table 5 Declared rod catch returns for salmon and trout in the Foyle and Carlingford areas. Note figures include the Clanrye and Whitewater in the Carlingford area from 2001 onwards. Carcass tagging was introduced in 2001.*Denotes all trout.
FAIRYWATER AND TRIBUTARIES CATCHMENT STATUS REPORT Page 36 of 74
Year Declared Rod Catch Salmon Declared Rod Catch Sea Trout Returns as a % of Licences Issued 1999 1022 679 3.74 2000 723 417 2.55 2001 3188 450 17.68 2002 5117 1010 27.93 2003 1844 361 15.5 2004 2285 75 13.99 2005 4084 413 25.77 2006 3476 469 37 2007 4929 379 22.11 2008 4060 815 54.94 2009 2923 *550 43.88 2010 4234 329 55.75
of Salmon
Number
Table 5.1 Salmon rod catch
Reported Rod Catch
Corrected Rod Catch
Salmon Rod Catch 1952 ‐ 2010
STATUS REPORT Page 37 of 74
0 2000 4000 6000 8000 10000 12000 14000 16000 18000 1952 1954 1956 1958 1960 1962 1964 1966 1968 1970 1972 1974 1976 1978 1980 1982 1984 1986 1988 1990 1992 1994 1996 1998 2000 2002 2004 2006 2008 2010
Year

5.2 Commercial Fisheries
Commercial fisheries have traditionally operated within the Foyle sea area, Lough Foyle and tidal River Foyle. The drift net and draft net fisheries as well as the rod fisheries have been closely regulated with a real time management regime in place to monitor the numbers of fish migrating up key rivers. If predetermined numbers of fish have not been counted by the strategically placed electronic fish counters at Sion Mills weir (River Mourne), Campsie Barrage (River Faughan) and the Plumb Hole (River Roe) then specified closures of the commercial and/or recreational fisheries are enforced.
In 2007 new regulations were introduced to reduce the number of commercial nets operating within the Foyle area and all mixed stock interceptory drift nets seaward of Lough Foyle were curtailed. This decision was made to comply with the EU Habitats Directive, similar curtailment of mixed stock fisheries were introduced in the Republic of Ireland. Within the Foyle area this was achieved through a voluntary hardship scheme. Regulations were also introduced to limit the numbers of fish which could be retained by the recreational rod fishery throughout the Foyle and Carlingford areas. In 2010 The Foyle Area (Control of Fishing) Regulations 2010 were introduced which prescribes conditions for the suspension of the remaining commercial fisheries and the enforcement of catch and release on the recreational fisheries if pre determined numbers of fish are not recorded at key fish counting sites and attainment of prescribed management targets are not met against listed criteria.
STATUS REPORT Page 38 of 74
Fig 5.1 Recreational fishers
Table 5.2 Declared catch from the commercial salmon fisheries 1998-2009. Note 100% rate of catch returns. * Reduced numbers of commercial nets operating in the Foyle area from 2007. No commercial Atlantic salmon fisheries have been pursued in the Foyle area since 2009 as a result of the enforcement of The Foyle Area (Control of Fishing) Regulations 2010; this does not prevent the reinstatement of commercial fisheries if prescribed conditions are met in the future.

5.3 Counters
Within the Foyle system a number of river catchments have electronic fish counting facilities that provide estimates on the run timing and abundance of fish >45cm. A new weir incorporating fish counting facilities has been constructed on the River Strule downstream of the confluence with the Camowen River in Omagh.
Commissioned in 2007 the River Strule fish counter will provide a partial count of fish ascending the upper Strule before continuing their migration into the rivers of the Camowen, Drumragh and Owenreagh catchments. The upper Strule counter became operational in September 2007 recording 126 fish > 45cm to the end of the year. The counting channel forms part of the weir but in high water events fish can pass over the weir undetected. A time series of counts for the River Strule fish counter in Omagh and the Sion Mills fish counting station on the River Mourne downstream are outlined in tables 5.3 and 5.31. The Fairywater is located
FAIRYWATER AND TRIBUTARIES CATCHMENT STATUS REPORT Page 39 of 74 Year Drift Catch Draft Catch Total Drift and Draft 1998 31296 11141 42437 1999 15397 7893 23290 2000 22333 10339 32672 2001 13500 9476 22976 2002 28851 11917 40768 2003 15741 16991 32732 2004 12800 9490 22290 2005 13391 12143 25534 2006 6160 6031 12191 *2007 2598 2774 5372 2008 1248 2924 4172 2009 611 1326 1937
Fig 5.21 Commercial Fishing. Draft netting on the tidal River Foyle and drift netting in Lough Foyle
downstream of the main River Strule counter and upstream of the River Mourne counter.
5.3 New weir constructed on the River Strule in Omagh. Note central fish pass, location for electronic fish counter
5.31 Fish counting facilities at Sion Mills, River Mourne
Table 5.3 River Strule fish counter figures 2007-2010. *Note 2007 figure is a partial count, also note the River Strule fish counter is a partial counting station. Fish may bypass the counting channel in high water conditions
FAIRYWATER AND TRIBUTARIES CATCHMENT STATUS REPORT Page 40 of 74
Fig
Year Number of fish >45cm 2007 126 2008 207 2009 252 2010 164
Fig
Number of Fish > 45cm
River Strule Fish Counter Figures 2007 ‐ 2010
Fig 5.32 Monthly fish counts on the River Strule September 2007-2010 as recorded at Omagh Year Number of fish >45cm
Table 5.31 Sion Mills fish counter figures 2002-2010. *Note low counts in 2007 and 2008 were influenced by high water levels during peak run timing during June and July. Sion Mills is a partial counter and does not cover the entire length of the weir. In high water levels as experienced in 2007 and 2008 significant numbers of fish can bypass the counting channels. Methods to reduce this are being investigated as part of the Fish Counter Programme Review, commissioned in 2008. 2010 result affected by flooding and freezing conditions.
FAIRYWATER AND TRIBUTARIES CATCHMENT STATUS REPORT Page 41 of 74
2002 12991 2003 12129 2004 10270 2005 9397 2006 9926 *2007 *3714 *2008 *3452 2009 8410 *2010 *2360
‐20 0 20 40 60 80 100 120 JANFEBMARAPRMAYJUNJULYAUGSEPTOCTNOVDEC
Month
2007 2008 2009 2010
STATUS REPORT Page 42 of 74
‐500 0 500 1000 1500 2000 2500 3000 3500 4000 4500 JAN FEB MAR APR MAY JUN JULY AUG SEPT OCT NOV DEC Number of fish >45cm Month
Fig 5.33 Monthly fish counts on the River Mourne 2004-2010 as recorded at Sion Mills
‐2010 2004 2005 2006 2007 2008 2009 2010
River Mourne Fish Counter Figures
2004
Number of Fish > 45cm
River Mourne Electronic Fish Counters Figures 1957‐2010
FAIRYWATER AND TRIBUTARIES CATCHMENT STATUS REPORT Page 43 of 74
0 5000 10000 15000 20000 25000 *1957 1962 1967 1972 1977 1982 1987 1992 1997 2002 2007
Fig 5.34 Annual fish counts on the River Mourne 1957-2010
Year
5.4 Conservation Limits/Spawning targets
Another way to assess adult salmon stock status is to monitor run sizes on rivers and to compare them with predefined reference points called conservation limits. In the Foyle system the conservation limits define a level of spawning that optimises the sustainable catch by commercial and recreational fisheries. If exploitation rates increase above the sustainable catch levels the catch may increase in the short-term but the stock will eventually reduce. Conservation limits demarcate the spawning stock level at which recruitment would begin to decline significantly (NASCO). The real time management regime incorporating the setting of management targets and spawning targets implemented in the Foyle aims to manage the fisheries and spawning populations in a sustainable manner. The management and spawning targets are set for the various river catchments based on the amount and quality of nursery habitat present. River habitat surveys are carried out along each stretch of river and graded according to the type and quality. Egg deposition levels are set according to the quality grading of each section of nursery habitat.
There are four grades of nursery habitat, however for the purpose of setting egg deposition levels only grades 1-3 are utilised. Grade 1 denotes the best quality habitat. The egg deposition rate/carrying capacity is set as follows. Grade 1 = 10 eggs per m², grade 2 = 5 eggs per m² and grade 3 = 2.5 eggs per m². The total number of eggs is calculated by multiplying the area of each grade of nursery habitat by the appropriate density of eggs per m². 25% is deducted from the management target allowing for loss of salmon by angling (15%) and poaching and predation (10%). The remaining figure is referred to as the conservation limit/spawning target.
Once the number of eggs required for each river has been established this can be converted to a total number of fish required to achieve the management targets and conservation limit/spawning targets. The average fecundity (number of eggs produced per female) of Foyle salmon has been estimated at 2500 and the ratio of female to male salmon estimated at 60:40. When combined with the amount of nursery habitat of the various grades this equates to the conservation limit/spawning target. A management target of 8000 adult Atlantic salmon has been set for above Sion Mills, this equates to a conservation limit/spawning target of over 6000 salmon.
Table 5.41 Upstream of Sion Mills estimated egg deposition 2005-2010. *Note 2007, 2008 AND 2010 figures are minimum estimates of escapement due to high water levels resulting in the bypassing of the Sion Mills counting channels as well as damage caused to the counter in 2010 by the freezing winter conditions.
STATUS REPORT Page 44 of 74
Year No of Fish Across Counter Estimated Egg Deposition 2005 9397 10,571,625 2006 9926 11,166,750 *2007 *3714 *4,178,250 *2008 *3452 *3,883,500 2009 8410 9,461,250 *2010 *2360 2,655,000
6.0
HABITAT MONITORING
The Loughs Agency has carried out extensive habitat surveys on all the major rivers and tributaries within the Foyle and Carlingford catchments. Habitat surveys are carried out on foot. Although time consuming this is at present the best method for classifying the various grades of habitat. Habitat is classified into one of three life cycle units Fig 6.0, the presence and order of which is essential to the productive capacity of a salmonid river. Other non salmonid species also benefit from diverse in-channel habitat. The life cycle unit categories include spawning, nursery and holding habitat. Each category is then graded on a scale of 1-4, 1 representing the best quality attainable and 4 the worst. Other data collected during these surveys include channel width and impassable barriers to migratory fish species.


FAIRYWATER AND TRIBUTARIES CATCHMENT STATUS REPORT Page 45 of 74
Fig 6.0 Life cycle unit depicting the type of habitat found in spawning, nursery and holding zones
Fig 6.01 Examples of spawning, nursery and holding habitat


FAIRYWATER AND TRIBUTARIES CATCHMENT STATUS REPORT Page 46 of 74
Fairywater
00.250.50.751 Kilometers Ungraded 1 Nursery 2 Nursery 3 Nursery 4 Nursery 1 Holding 2 Holding 3 Holding 4 Holding 1 Spawning 2 Spawning 3 Spawning 4
© Crown Copyright and database rights OSNI EMOU 205.1 ±
Fig
6.02 Habitat overview key for Fairywater Catchment
Habitat Survey
Spawning Foyle Catchments
7.0 LAND USE
Land use classification is an important tool when assessing the potential impacts within a particular river catchment or indeed when looking at specific land use and land management practices. Land use impacts could have either a positive or negative impact on rivers and tributaries. A good understanding of the land use within a catchment is therefore imperative in managing at a catchment scale.
Land use in Northern Ireland has been captured using satellite imaging technology and classified to type. The following figures outline the broad land use classification within the Fairywater Catchment.

Land Use in the Fairywater Catchment
Pastures
Agriculture/Natural vegetation
Coniferous Forests

Natural Grassland
Moors and Heathland
Transitional Woodland
Scrub
Peatbogs
FAIRYWATER AND TRIBUTARIES CATCHMENT STATUS REPORT Page 47 of 74
55% 5% 5% 16% 8% 1% 10%
Fig 7.0 Fairywater catchment land use classification
Legend
231 - pastures
243 - agric. & nat. veg.
311 - broad-leaved forest
312 - coniferous forest
321 - natural grasslands
322 - moors and heath
324 - trans. wood.
412 - peatbogs
512 - water bodies

© Crown Copyright and database rights OSNI EMOU 205.1 © Copyright NERC, Acknowledgements CEH, Monks Wood
FAIRYWATER AND TRIBUTARIES CATCHMENT STATUS REPORT Page 48 of 74
Fairy
2000
Survey 00.511.52 Kilometers 231 412 312 322 321 243 321 243 412 243 322 324 324 311 512
Fig 7.01 Fairywater catchment land use classification map
Water Corine
Landuse
±
8.0 WATER QUALITY
The Northern Ireland Environment Agency (NIEA) in Northern Ireland and the Environmental Protection Agency in the Republic of Ireland are the designated competent authorities for implementation of the Water Framework Directive (WFD).
The WFD is a pan European directive designed to ensure that all waters reach good ecological status by 2015. Extensive monitoring is conducted on all water bodies to facilitate this aim.
In addition to the routine river monitoring carried out by the NIEA and the County Councils for WFD monitoring the Loughs Agency conducts proactive and reactive pollution investigations to investigate or highlight problems or potential problems which may have an effect on the aquatic environment and ultimately on the fish species and aquatic habitats.
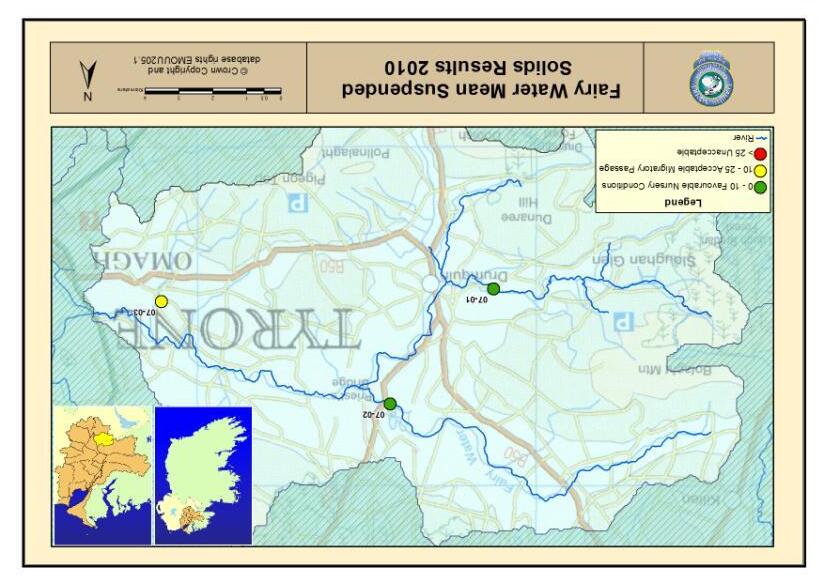
In 2007 the Loughs Agency instigated a programme of monitoring at the tributary level for assessments of chemical and biological water quality. Three stations on tributaries of the Fairywater are monitored for chemical water quality parameters including Biological Oxygen Demand (BOD), Suspended Solids, Ammonia and Phosphorous. Biological water quality was assessed using the Biological Monitoring Working Party (BMWP) a biotic scoring index.
STATUS REPORT Page 49 of 74
Fig 8.0 Loughs Agency chemical water quality testing in the laboratory
The Loughs Agency also maintains a mobile pollution response unit containing aerating equipment and absorbent and non absorbent booms for oil and chemical spills. The unit can be rapidly deployed to the site of a pollution incident.
Water Quality Parameters
The following water quality parameters are monitored through the Loughs Agency monitoring programme and determined from water samples in the laboratory:
• Biochemical Oxygen Demand (BOD)
• Ammonia
• Phosphorus
• Suspended Solids
BOD
Any organic matter discharged into a river provides an immediate source of food for bacteria. These bacteria will break down the organic matter eventually into simple compounds such as carbon dioxide and water. Biochemical Oxygen Demand or Biological Oxygen Demand (BOD) is a chemical procedure for determining how fast biological organisms use up oxygen in a body of water. It is considered as an indication of the quality of a watercourse
Ammonia (NH3)
Ammonia is generally found in small amounts in rivers and streams. This is due to microbiological activity and the resultant reduction of compounds containing nitrogen. High levels of ammonia can occur as a result from sewage pollution and have detrimental impacts on fish species.
Phosphorus (PO4)
The over-loading of nutrients such as phosphorus in watercourses often leads to a process known as eutrophication. Eutrophication is a major environmental issue in Irish rivers and lakes. Sources of phosphorus include agricultural fertilizers and household detergents.
Suspended Solids
Particulate matter may be organic or inorganic in nature. Organic solids may consist of algal growths, indicative of eutrophic conditions. Inorganic solids generally are the result of discharge washings from sand and gravel extraction activities or quarries. Suspended solids can affect plant growth and fish habitats.
The following parameters are also recorded at each sample station by means of an electronic measuring probe:
FAIRYWATER AND TRIBUTARIES CATCHMENT STATUS REPORT Page 50 of 74
• pH
• Temperature
• Dissolved Oxygen
• Conductivity
pH
This is a measure of the hydrogen ion concentration of a solution and therefore an indication of whether a liquid is acid or alkaline. The pH scale ranges from 0 (very acid) to 14 (very alkaline), with results generally influenced by geological conditions. Fish can be susceptible to changes in pH. Low pH levels are generally found in catchments with high forestry operation impacts.
Temperature
The effect of changes in temperature on living organisms, such as fish, can be critical. Thermal discharges from urban and industrial sources can lead to temperature increases in watercourses and increased stress on aquatic habitats and associated species.
Dissolved Oxygen
Sufficient levels of oxygen saturation in fresh waters are generally an indication of good ecological status and ideal for fish life. The main point to remember about oxygen solubility is that it has an inverse relationship with temperature. This helps explain why DO levels are generally lowest during summer low flow conditions, increasing the risk of pollution from discharges at this time.
Conductivity
The conductivity or electrical conductivity of a watercourse is a measure of its ability to conduct an electric current. Electrical conductivity estimates the amount of total dissolved salts, or the total amount of dissolved ions in the water. Electrical Conductivity is controlled by geology and any variations may be sourced to increased ions from wastewater from sewage treatment plants or urban run-off from roads.
FAIRYWATER AND TRIBUTARIES CATCHMENT STATUS REPORT Page 51 of 74
STATUS REPORT Page 52 of 74
Fig 8.01 Fairywater catchment average suspended solids results 2010. Values are in mg/l

FAIRYWATER AND TRIBUTARIES CATCHMENT STATUS REPORT Page 53 of 74
Fig 8.02 Fairywater catchment Ammonia results 2010. Values are in mg/l

FAIRYWATER AND TRIBUTARIES CATCHMENT STATUS REPORT Page 54 of 74
Fig 8.03 Fairywater catchment phosphorous results 2010. Values are in mg/l

FAIRYWATER AND TRIBUTARIES CATCHMENT STATUS REPORT Page 55 of 74
Fig 8.04 Fairywater catchment Biological Oxygen Demand (BOD) results 2010. Values are in mg/l

FAIRYWATER AND TRIBUTARIES CATCHMENT STATUS REPORT Page 56 of 74
Fig 8.05 Fairywater catchment Biological Monitoring Working Party results 2010
Prior to 2008 NIEA employed the General Quality Assessment (GQA) system to classify and monitor the chemical and biological water quality of the rivers of Northern Ireland. With the implementation of the Water Framework Directive a new approach to freshwater classification has been adopted following the United Kingdom Technical Advisory Group (UKTAG) guidelines developed for WFD implementation.
An overall classification status for a water body is obtained by the amalgamation of biological, chemical and physical elements. Fig. 8.06 details how these elements combine to create ecological and chemical statuses which are then combined to create the overall surface water status.
Water Status
Fig. 8.06: How the different water quality element results are combined to classify ecological status, chemical status and the overall surface water status: Adapted from the ‘Recommendations on Surface Water Classifications Schemes for the purposes of the Water Framework Directive’ UKTAG 2006.
The ecological status is determined primarily by the lowest class of the biological component. The general and physiochemical element can lower the status to moderate only. If both these elements are classified as high the hydromorphological element can only lower the
status to good. Whilst the ecological Surface
STATUS REPORT Page 57 of 74
overall ecological
Ecological Status Chemical Status Biological quality elements H H H H G G G G M M M M P P P P B B B B General chemical & physio chemical quality elements H H H H G G G G M M M M Specific Pollutants gH gH gH gH gH gH M M M M M M Hydromorphological quality elements H H H H G G G G Lowest class element Lowest class element Lowest class element Priority substances & other EULevel dangerous substances G G G G G G G F F F F F F F G F Lowest class substance H G M P B H G M P B Lowest of chemical and ecological status G M H High G Good M Moderate P Poor B Bad gH Good or better F Failing to achieve good water chemical status
status has five classes (High, Good, Moderate, Poor and Bad), the chemical status has two (High and Moderate). The lowest status of the two determines the overall surface water status. This is termed the ‘one out – all out’ principle.
Ecological Status: Classification of Quality Elements
The various elements monitored for ecological classification are listed in table 1.
Biological General/PhysiochemicalHydromorphological
1. Macroinvertebrates
2. Macrophytes
3. Phytobenthos
4. Fish
1. Dissolved Oxygen (% Saturated)
2. Soluble Reactive Phosphorus (SRP)
3. pH
4. Specific Pollutants (includes ammonia)
1. Quantity & dynamics of water flow
2. Connection to groundwater
3. River continuity
4. River depth & width variation
5. Structure & substrate of the river bed.
6. Structure of the riparian zone
Table 8.07. Quality elements which are monitored for the ecological status.
Biological Quality Elements
Macro-invertebrates
Different species of macro invertebrates are more sensitive to specific forms of pollution and therefore environmental quality ratios (EQRs) based on biological results may be used to assess water quality. Macro invertebrates are also the dominant prey of both salmonid and some non salmonid fish species. The measure of diversity of a macro invertebrate community can be a more reliable indicator of the pollution pressures within a catchment than relying solely on an assessment of chemical water quality. The impacts of pollution on a macro invertebrate community are longer lasting and can highlight intermittent pollution impacts that may be missed through chemical water quality monitoring.
RIVPACS had been previously used to classify the biological quality of a site in terms of Macroinvertebrates. This has since been updated to meet WFD requirements and is called the Rivers Invertebrate Classification Tool (RICT). RICT utilises the same principle of a biotic scoring system to produce the EQRs on which the classes are based:
EQR Taxa = BMWP Observed number of Taxa
BMWP Predicted number of Taxa (As derived from RICT)
EQR ASPT = BMWP Observed ASPT (Average Score Per Taxon)
BMWP Predicted ASPT (As derived from RICT
FAIRYWATER AND TRIBUTARIES CATCHMENT STATUS REPORT Page 58 of 74
Table 8.08. Environmental Quality Ratio classifications for ASPT and NTaxa.
Macrophytes
Macrophytes (aquatic vegetation) have been included in the classification as a measure of the effects of nutrient enrichment. The tool employed is Leafpacs which assesses species composition, diversity and abundance.
Diatoms
Diatom (microscopic organisms) species presence and relative abundance are also indicative of nutrient enrichment in both rivers and lakes. To assess the effect of these on the ecological status the Diatoms Assessment for Rivers and Lakes Ecological Quality (DARLEQ) tool has been developed which classifies on levels of nutrient sensitivity and tolerance. The higher the EQR the more sensitive diatom species present. A minimum of three samples over several years is necessary for this classification resulting in few water bodies being classified at present.
Table 8.09. Environmental Quality Ration Classifications for Diatoms and Macrophytes.
Fish
At present there is no tool available for the classification of fish. It has been determined by expert judgement based on the quantitative electrofishing surveys undertaken by the Loughs’ Agency (Foyle and Carlingford Areas) and AFBI (for other rivers in Northern Ireland).
General Chemical and Physiochemical Quality Elements
The general chemical elements required for WFD purposes are Dissolved Oxygen (% saturated), pH, and Soluble Reactive Phosphorus (SRP). Notably BOD is no longer used to classify a water body. It is still being monitored for investigative purposes where DO standards are not being met. In addition to these elements a number of ‘specific pollutants’ were also to be identified from a WFD list. These are pollutants which are being discharged in significant quantities. Of particular importance from a fishery aspect is Ammonia. There are 18 other pollutants listed
FAIRYWATER AND TRIBUTARIES CATCHMENT STATUS REPORT Page 59 of 74 Class ASPT EQR NTAXA EQR High 0.97 0.85 Good 0.86 0.71 Moderate 0.75 0.57 Poor 0.63 0.47
Class Diatoms EQR Macrophytes EQR High 0.93 0.8 Good 0.78 0.6 Moderate 0.52 0.4 Poor 0.26 0.2 Bad 0 0
(Full list detailed in NIEA’s Rationale for Water Framework Directive Freshwater Classification).
Table 8.010. Classification for General Chemical & Physiochemical Quality Elements.
Hydromorphological Elements
Hydromorphological elements have been incorporated into the classification system to assess the impact that morphological alterations (e.g. sediment removal and channelisation) have on the ecological status of a river. The procedure employed to classify these elements is based on the previous NS Share method, Rapid Assessment Technique (RAT). The new method is the River Hydromorphological Assessment Technique (RHAT) and has been developed to be fully compliant with the WFD.
Chemical Status: Classification of Quality Elements.
Although chemical elements are already being assessed for the ecological status, the Chemical Status refers solely to those chemicals which have been defined as priority substances which are ‘those which present a significant risk to or via the aquatic environment’. These include Pentachlorophenol, Carbon Tetrachloride, Aldrin, Isodrin and Napthalene. The full list and their Environmental Quality Standards (EQS) are detailed in the framework’s ‘daughter’ Directive 2008/105/EC.
The principal objective of the Water Framework Directive is to achieve good surface water status in all water bodies by 2015. The classification of the water bodies are to be published in the River Basin Management Plans, the first of which was published in Dec 2009.
The directive has separate classification schemes for heavily modified water bodies, and protected areas. Heavily modified water bodies have been classified on their ecological potential, details of which are available on the NIEA website (www.nienvironment.gov.uk/wfd). For protected areas (e.g. River Foyle and its tributaries) maps are to be included in the River Basin Management Plans to indicate whether the objectives, established through legislation to define these areas, have been achieved.
FAIRYWATER AND TRIBUTARIES CATCHMENT STATUS REPORT Page 60 of 74
Class DO (% saturation) (10 – percentile) pH SRP (µg/l) (annual mean) Ammonia (mg/l) High 80 (5 & 95 percentile) >=6 to <=9 20 0.2 Good 75 40 0.3 Moderate 64 4.7 (10 percentile) 150 0.75 Poor 50 4.2 (10 percentile) 500 1.1
The Habitat’s Directive (92/43/EEC) indicates that the water quality in these protected areas should achieve targets that are necessary for the designated species. The favourable conditions specific for salmonid rivers have been based on publications from Conserving Natura 2000 Rivers, the European Life Series, Ecology Series; No 7 Ecology of the Atlantic Salmon, Salmo Salar L (Table 9.11).
Table 8.011. Favourable condition targets for Atlantic salmon

8.012. Flattened mayfly nymph from the order ephemeroptera high scoring macro invertebrate indicative of good water quality
FAIRYWATER AND TRIBUTARIES CATCHMENT STATUS REPORT Page 61 of 74
Parameter Level Percentile Reason BOD (mg/l) 2.5 90 High Status Ammonia (mg/l) 0.25 90 High Status Dissolved Oxygen % Saturation 80 10 High Status Unionised Ammonia (mg/l) 0.025 95 Favourable Conditions Habitat Forming Suspended Solids (mg/l) Nursery Grounds Migratory Passage 10 25Specific for Atlantic Salmon
Soluble Reactive Phosphorus (mg/l) Background - Specific for Atlantic Salmon
Figure

8.013. Overall WFD surface water status for the Fairywater catchment 2009, at the time of writing no updated classification was available for 2010.
STATUS REPORT Page 62 of 74
Figure
8.1 WFD Fish Classifications 2010
The Loughs Agency is monitoring freshwater fish within the Foyle and Carlingford areas for reporting under the WFD. Working under the direction of the Northern Ireland WFD Fish Group (composed of NIEA, Loughs Agency, AFBI and DCAL personnel) surveillance monitoring stations are surveyed for fish populations once during each WFD reporting cycle.
Eight Water Framework Directive fish surveillance monitoring stations were surveyed within the Loughs Agency jurisdiction in 2010, Five in NI and three in ROI. 100% were classified as good status
Loughs Agency/Foyle and Carlingford Area WFD Fish
Classification 2010 (N = 5)
In the absence of a finalised fish in rivers classification tool (currently under development) professional judgement has been used to classify selected river sites for fish. These have then been incorporated into ecological status classifications and final surface water classifications.
Data collection was conducted in the field during the summer of 2010 and involved the use of a quantitative electrofishing methodology commonly used for wadable rivers. This technique requires the netting off of a small section of river approximately 100m² using stop nets.
Removal sampling is then conducted utilising electrofishing equipment with the numbers, age class and species of each fish being recorded for each pass. After an appropriate depletion has been achieved, which facilitates a density estimation to be made all fish are returned alive to the river. If the river is too large for this technique then a multi method survey approach is conducted incorporating the use of electrofishing, seine netting and fyke netting.
STATUS REPORT Page 63 of 74
Figure 9.11. LA fish classification 2010 based on five sites surveyed within the Foyle area.
100%
High Good Moderate Poor Bad

STATUS REPORT Page 64 of 74
Figure 8.12. WFD fish surveillance monitoring stations in the Foyle system

FAIRYWATER AND TRIBUTARIES CATCHMENT STATUS REPORT Page 65 of 74
Figure 8.13. WFD fish classifications in the Foyle system
In addition to directed WFD fish surveillance monitoring the Loughs Agency has collated other suitable fishery data collected from 2005-2010 and derived WFD fish classifications from this. An example of this data is outlined below.
Table 8.14 Depletion sampling results from WFD quantitative electrofishing survey on the Cappagh Burn 2009 (Strule Catchment)
Total Number of Fish Caught (Cappagh

Table 8.15 Species and numbers caught
Density
Estimate of Fish Species (Cappagh Burn 2009)

Table 8.16 Density of
STATUS REPORT Page 66 of 74
species by age class per 100m2 3 16 17 5 98 10 0 20 40 60 80 100 120 Salmon 0+Salmon 1+Trout 0+Trout 1+StoneloachEel Number of Fish Fish Species
21 258 6 34 40 47 10 55 92 0 50 100 150 200 250 300 Eel Stoneloach Salmon 0+ Salmon 1+ Salmon Total Trout 0+ Trout 1+ Trout Total Total Salmonids Numbers of Fish/100m² Fish Species
Burn 2009)
Fishing Salmon 0+ Salmon 1+ Trout 0+ Trout 1+ Stone loach Eel Total 1st 3 11 8 4 50 1 77 2nd 0 4 6 0 30 5 45 3rd 0 1 3 1 18 4 27 Total 3 16 17 5 98 10 149
Length Frequency Salmon 0+ and 1+ Cappagh Burn 2009 (N=19)
Figure 8.17 Length frequency distribution of juvenile salmon
Length Weight Relationship of Trout 0+ and Trout 1+ Cappagh Burn 2009 (N=22)
Figure 8.18 Length weight relationship of juvenile trout. *Note approximately 3 distinct age groups/cohorts
FAIRYWATER AND TRIBUTARIES CATCHMENT STATUS REPORT Page 67 of 74
0 1 2 3 4
Length (mm)
5962656871747780838689929598101104107110113116119122125128 Frequency
y = 2E‐05x2.9513 R² = 0.991 0 20 40 60 80 100 120 0 50 100 150 200 250 Weight (g) Length (mm)
9.0 CONSERVATION AND PROTECTION
The Loughs Agency continues to carry out an active fishery protection role throughout the catchments of the Foyle and Carlingford areas including the sea area, River Foyle and on all tributaries. Tables 9.0, 9.01 and 9.02 outline the number of patrols and some duties carried out by the Loughs Agency staff in the Fairywater catchment and seizures for the Foyle area.
A team of Fishery Officers are responsible for the Fairywater catchment splitting their time between the Drumragh catchment, Camowen catchment, Strule catchment, Owenreagh South catchment and the standing waters within the Loughs Agency southern zone. This is in addition to regular fishery protection patrols on the River Foyle.
Table 9.0. Breakdown of conservation and protection duties in the Fairywater catchment 2002-2010.
Table 9.01 Seized nets, salmon, rod/reels and vehicles in the Foyle system 2003-2010
Table 9.02 Seizures in the Fairywater catchment 2006-2010.
FAIRYWATER AND TRIBUTARIES CATCHMENT STATUS REPORT Page 68 of 74
Year No of Patrols No of Licence Checks Joint Patrols On-site Inspections 2002 8 21 3 69 2003 12 17 5 78 2004 10 15 7 68 2005 14 35 6 60 2006 4 26 0 122 2007 18 24 0 82 2008 13 33 2 38 2009 37 47 0 22 2010 59 45 0 30
Year 2010 2009 2008 2007 2006 2005 2004 2003 Nets 136 128 111 100 97 114 181 198 Salmon 104 6 46 56 91 118 130 155 Rod & Reel 66 96 139 85 26 10 16 12 Vehicles 0 0 1 0 2 1 1 0
Year Nets Salmon/Trout Rod/Reel Vehicles Boats 2006 0 0 0 0 0 2007 0 0 0 0 0 2008 0 13 (Trout) 20 0 0 2009 0 0 7 0 0 2010 0 0 1 0 0
9.1 Habitat Improvement Works
In addition to the traditional protection duties carried out by the Loughs Agency staff conservation and improvement of habitat has been increasing over recent years.
Over time man has imposed significant changes on the natural courses of many rivers and flood plains. The driving forces behind these changes have included amongst others; arterial drainage schemes to provide more suitable land for agricultural purposes, urban sprawl, infrastructure expansion (roads etc.), flood defences, water abstraction and hydro power generation. All have had a significant impact on the natural meanderings and discharges of rivers and tributaries resulting in faster runoff of floodwaters ultimately leading to a change in the morphology and flow regime of rivers and resultant impacts on fisheries.
While all these processes have had some impact within the Foyle system, it is considered to be a relatively natural system with natural river structure present in the catchments headwaters. In areas that have been altered methods for reinstating lost habitat are investigated and where appropriate action taken.
No habitat improvement works were conducted within the Fairywater catchment in 2010.
10.0 ENVIRONMENTAL ISSUES
Some environmental issues affecting water quality have already been outlined previously. The following list presents some of the main habitat pressures to salmonids within the Foyle system:
• Agricultural activities – enrichment from natural and artificial fertilisers often make their way into watercourses, enhancing problems with eutrophication.
• Forestry activities – planting and felling operations can lead to increased loading of suspended solids in watercourses. Established forestry as a major upland land use has been attributed to increased acidification.
• Barriers to migration – a range of natural and anthropogenic features on rivers can lead to barriers for migrating salmonids and other fish species. These can include weirs and hydro-electric schemes.
• Gravel removal – gravel is extremely important for the creation of redds for spawning fish. Removal of gravel from the river bed in sensitive areas can destroy potential spawning and nursery habitat.
• Quarrying activities – the extraction of aggregates such as rock, sand and gravel has the potential to cause increased levels of suspended solids in nearby watercourses. Sufficient mitigation measures should be in place at such sites to trap increased sediment loads entering rivers and streams.
• Abstraction – water abstraction from watercourses for a range of uses is increasing throughout the Foyle and Carlingford catchments. Unless appropriately assessed and licenced, these activities have the potential to
FAIRYWATER AND TRIBUTARIES CATCHMENT STATUS REPORT Page 69 of 74
reduce residual flow levels and alter the ecological status of our rivers. This is even more concerning in the light of climate change.
• Peat harvesting – Peat harvesting still occurs in small upland pockets throughout the Foyle system. It has the potential to increase sediment loading in receiving waters.
• Sewage treatment – sewage and waste water treatment works are under considerable pressure with the increase in urban development in our towns and villages. Several inadequate systems throughout the Foyle system continue to pollute rivers.
• Hydropower – small-scale hydropower schemes are beginning to appear on rivers throughout the Foyle and Carlingford catchments. Baseline fishery data must be provided to allow for sufficient assessment of any proposed scheme, unless located above an impassable fish barrier.
• Urban development – the expansion of large-scale housing developments and the associated pressures on waste water and sewage treatment works are a potential source of water pollution in the event of overflows.
• Drainage and canalisation – these have direct impacts on the quality of available fishery habitat within the catchments. Canalisation in particular can lead to the removal of important spawning, nursery or holding areas of rivers.
• Industrial discharges – larger urban areas with industrial discharges have the potential to cause pollution through toxic discharges and can alter the temperature of the watercourse.
• Septic tanks – a proliferation of single dwellings and their septic tanks is an ongoing area of concern. Initial research from parts of the Foyle system indicate that this is major contributor to decreased water quality and local increases in suspended solids.
11.0 DESIGNATED AREAS
The European Commission Directive on the Conservation of Natural Habitats and of Wild Fauna and Flora (EU Habitats Directive 92/43/EEC) requires that all member states designate Special Areas of Conservation (SACs) in order to protect threatened habitats and species. The European Commission Directive on the Conservation of Wild Birds (Birds Directive 79/409/EEC) also requires the designation of Special Protected Areas (SPA’s). Together the designated SAC’s and SPA’s create the NATURA 2000 network of protected sites. A number of rivers have been designated as SAC’s both in Northern Ireland and in the Republic of Ireland.
The River Foyle and selected tributaries have been designated as a Special Area of Conservation (SAC’s). The Fairywater River is not included in this designation. The River Foyle and its tributaries have been designated to protect its Atlantic salmon populations in freshwater, Otter populations and its floating vegetation habitat dominated by water crowfoot.
FAIRYWATER AND TRIBUTARIES CATCHMENT STATUS REPORT Page 70 of 74
The Fairy Water Bogs and Tully Bog have both been designated as SAC’s and are within the Fairywater catchment. They are examples of lowland raised bog, an important habitat type with species of community interest present. The Fairywater Bogs has also been designated as a RAMSAR site designated for the protection of birds.
At the national level Claraghmore has been designated as a National Nature Reserve (NNR) for its peatland habitat.
12.0 GENETIC STUDY
A baseline genetic survey was carried out in the Foyle system in 2003 and a resurvey conducted between 2006 and 2008 to analyse the populations of Atlantic salmon present within the Foyle catchment. Results confirmed the existence of genetically distinct populations between and within the rivers and tributaries of the Foyle area. An understanding of these genetically differentiated populations is required to facilitate appropriate management of conservation measures and the commercial/recreational fisheries.
The report concluded that genetic diversity is high between and within the various salmon populations present in the Foyle system. Each population has evolved over time creating distinct populations (with some gene flow from straying fish) that are best suited to the conditions present in a particular river or tributary. The non-uniform nature of the populations adds to the diversity of life history strategies exercised by Foyle salmon. Distinct differences such as run-timing and age at smolting can act as nature’s insurance policy to any catastrophic events which would threaten a homogenous population.
The report stated that the current genetic structure and diversity of Foyle salmon is representative of what might be regarded as the native structure of wild salmon populations. The maintenance of genetic diversity is a core requirement for the longterm sustainability of wild populations, preserving the biodiversity of the wild salmonids of the Foyle system is therefore a primary objective of the Loughs Agency.
13.0 POLLUTION MONITORING
The Loughs Agency has a statutory obligation to monitor the pollution of watercourses. In conjunction with the Northern Ireland Environment Agency all reported pollution incidents are investigated.
FAIRYWATER AND TRIBUTARIES CATCHMENT STATUS REPORT Page 71 of 74
14.0 FISHERY OFFICERS FAIRYWATER AREA REPORT 2010
In 2010 Fishery Officers continued to work within the Fairywater catchment. No report was submitted for 2010.
15.0 ACTIONS FOR 2011
In order to fully utilise the extensive data resources collected and held by the Loughs Agency on the fish populations and habitats of the Fairywater catchment it is necessary to focus attention on specific management objectives.
The Loughs Agency has stated in its corporate plan 2011-2013 that it will conserve, protect, manage and improve the fisheries of the Foyle and Carlingford areas. By way of fulfilling these objectives a targeted series of actions utilising data collected over recent years will be implemented. Fishery owners and angling associations will continue to be consulted regarding any proposed works and stakeholder input sought.
Good water quality is essential for the conservation of productive aquatic ecosystems. Fish populations rely on unpolluted water for survival and feeding. The Loughs Agency is committed to ensuring deleterious matter does not enter any watercourse. Routine monitoring is conducted throughout the Foyle and Carlingford areas. Proactive pollution visits and water quality monitoring will continue in 2011.
Water quantity is becoming an increasingly important issue from a fisheries management perspective with continuing demand from a variety of sources including industry, hydro power generation and abstraction for meeting the ever growing needs of industry and the wider population. The Loughs Agency are aware of the conflicting needs of aquatic environments and water resource users and comment on development issues which may have an impact on the important aquatic resources of the Foyle and Carlingford areas with reference to national and international obligations.
In-channel and riparian habitat improvement projects provide an important mechanism by which to improve and protect valuable fishery resources. Over recent years the Loughs Agency has developed a number of projects designed to improve the survival and production of robust populations of juvenile salmonid and other native fish species. These programmes will continue where funding is available, The Loughs Agency also encourages local stakeholder groups to source appropriate funding to develop collaborative habitat improvement projects. The Loughs Agency can provide advice and recommendations for in-channel and riparian improvements and are eager to facilitate the development of such programmes.
FAIRYWATER AND TRIBUTARIES CATCHMENT STATUS REPORT Page 72 of 74
Work is continuing to assess and record all Barriers to Migration within the catchments of the Foyle and Carlingford areas and these will be incorporated into the Loughs Agency Geographical Information System (GIS). Where finances are available the removal of artificial barriers will be investigated.
Predation by cormorants and seals of economically important fish species continues to be a contentious issue. The Loughs Agency will continue to promote the development of a management strategy incorporating economic, social and environmental factors.
The Loughs Agency will continue to monitor the salmon and inland fishery resources of the Foyle and Carlingford areas, utilising best practice methods including fish counters, juvenile population surveys and catch returns. The importance of the Atlantic salmon resource has been further highlighted by recent genetic studies which have identified the presence of genetically distinct populations of salmon between and within main river catchments. This information will be utilised when developing habitat improvement programmes to ensure the presence of a diverse resource capable of withstanding change.
Invasive species in both aquatic and riparian habitats have become an important issue in fisheries management and in wider environmental management. Invasive species have the potential to significantly alter ecosystems and their function. The Loughs Agency is contributing towards the development and implementation of invasive species codes of practice.
15.2 Fairywater Catchment Potential Habitat Improvement Schemes for 2011
• There is significant potential for developing habitat improvement programmes within the Fairy Water catchment these will be investigated further in 2011
• Bankside fencing is required upstream of Mullinatoomog Bridge to restrict cattle access to the watercourse and to prevent further extensive trampling.
15.3 Fairywater Catchment Specific Actions for 2011
• Continue to maintain the high standards of conservation and protection within the Fairywater catchment
• Target all areas/individuals brought to Loughs Agency attention
FAIRYWATER AND TRIBUTARIES CATCHMENT STATUS REPORT Page 73 of 74
• Implement habitat improvement schemes as dictated by business plan/corporate plan
• Conduct annual fish population surveys and spawning surveys
• Conduct ongoing water quality monitoring and investigate areas highlighted as being of concern
• Develop potential habitat improvement projects including riparian buffer zone creation, fencing, native species planting and in-channel habitat improvements including spawning bed and nursery habitat improvement
• Monitor forestry operations adjacent to watercourses or areas likely to impact on watercourses
• Assist with Water Framework Directive fish monitoring programme
• Monitor all sand and gravel extraction sites and onsite water management practices
• Ensure all fish passes, dams and mill races meet required standards
FAIRYWATER AND TRIBUTARIES CATCHMENT STATUS REPORT Page 74 of 74
