Luxury Report
Colorado’s Luxury Markets | Q3 2025
$1,733,333
Colorado’s Luxury Markets
Colorado’s luxury real estate market is undergoing a shift, as evolving regional growth patterns continue to shape demand and fuel the market. As the landscape evolves, expert insight defines success. LIV Sotheby’s International Realty’s quarterly Luxury Report provides the perspective and precision you need to navigate Colorado’s premier property markets, from the Front Range to our worldrenowned resort destinations.
This report focuses on luxury residential properties—single-family homes and condos priced over $1 million in key markets like Denver Metro, South Metro, West Metro & Foothills, Boulder, Northern Colorado, Colorado Springs, and Grand County; over $2 million in Summit County and Crested Butte; and above $3 million in Vail Valley and Telluride.
2025 has experienced steady luxury market activity. The number of properties sold in the Front Range rose 8.5% to 5,899, while Denver Metro saw a 6.2% increase. Resort areas continued to see variance with Summit County leading the way with a 6.6% increase
in properties sold from the same time period in 2024. These consistent gains illustrate the depth and resilience of Colorado’s luxury market, where lifestyle appeal and long-term value continue to drive demand.
Median price remained strong, with Boulder reporting a slight decrease at $1,425,000 from $1,439,000 in 2024, while South Metro stayed flat at $1,300,000. Crested Butte showed an impressive 8.4% rise, underscoring continued interest for elevated mountain living, while Summit County saw a 6.7% decrease with a median price of $2,706,500.
At LIV Sotheby’s International Realty, we recognize that Colorado is in a league of its own. The vibrant culture, year-round outdoor adventure, and deep-rooted passion for openair living continue to draw residents to our state. Whether you’re seeking the pulse of the city, the serenity of the mountains, or the seclusion of an acreage, our expert advisors bring a global outlook and local insight to help you navigate the market and find your one-ofa-kind home.
Median Sold Price
October 2024 - September 2025
$2,061,500
At a Glance
Colorado’s Front Range
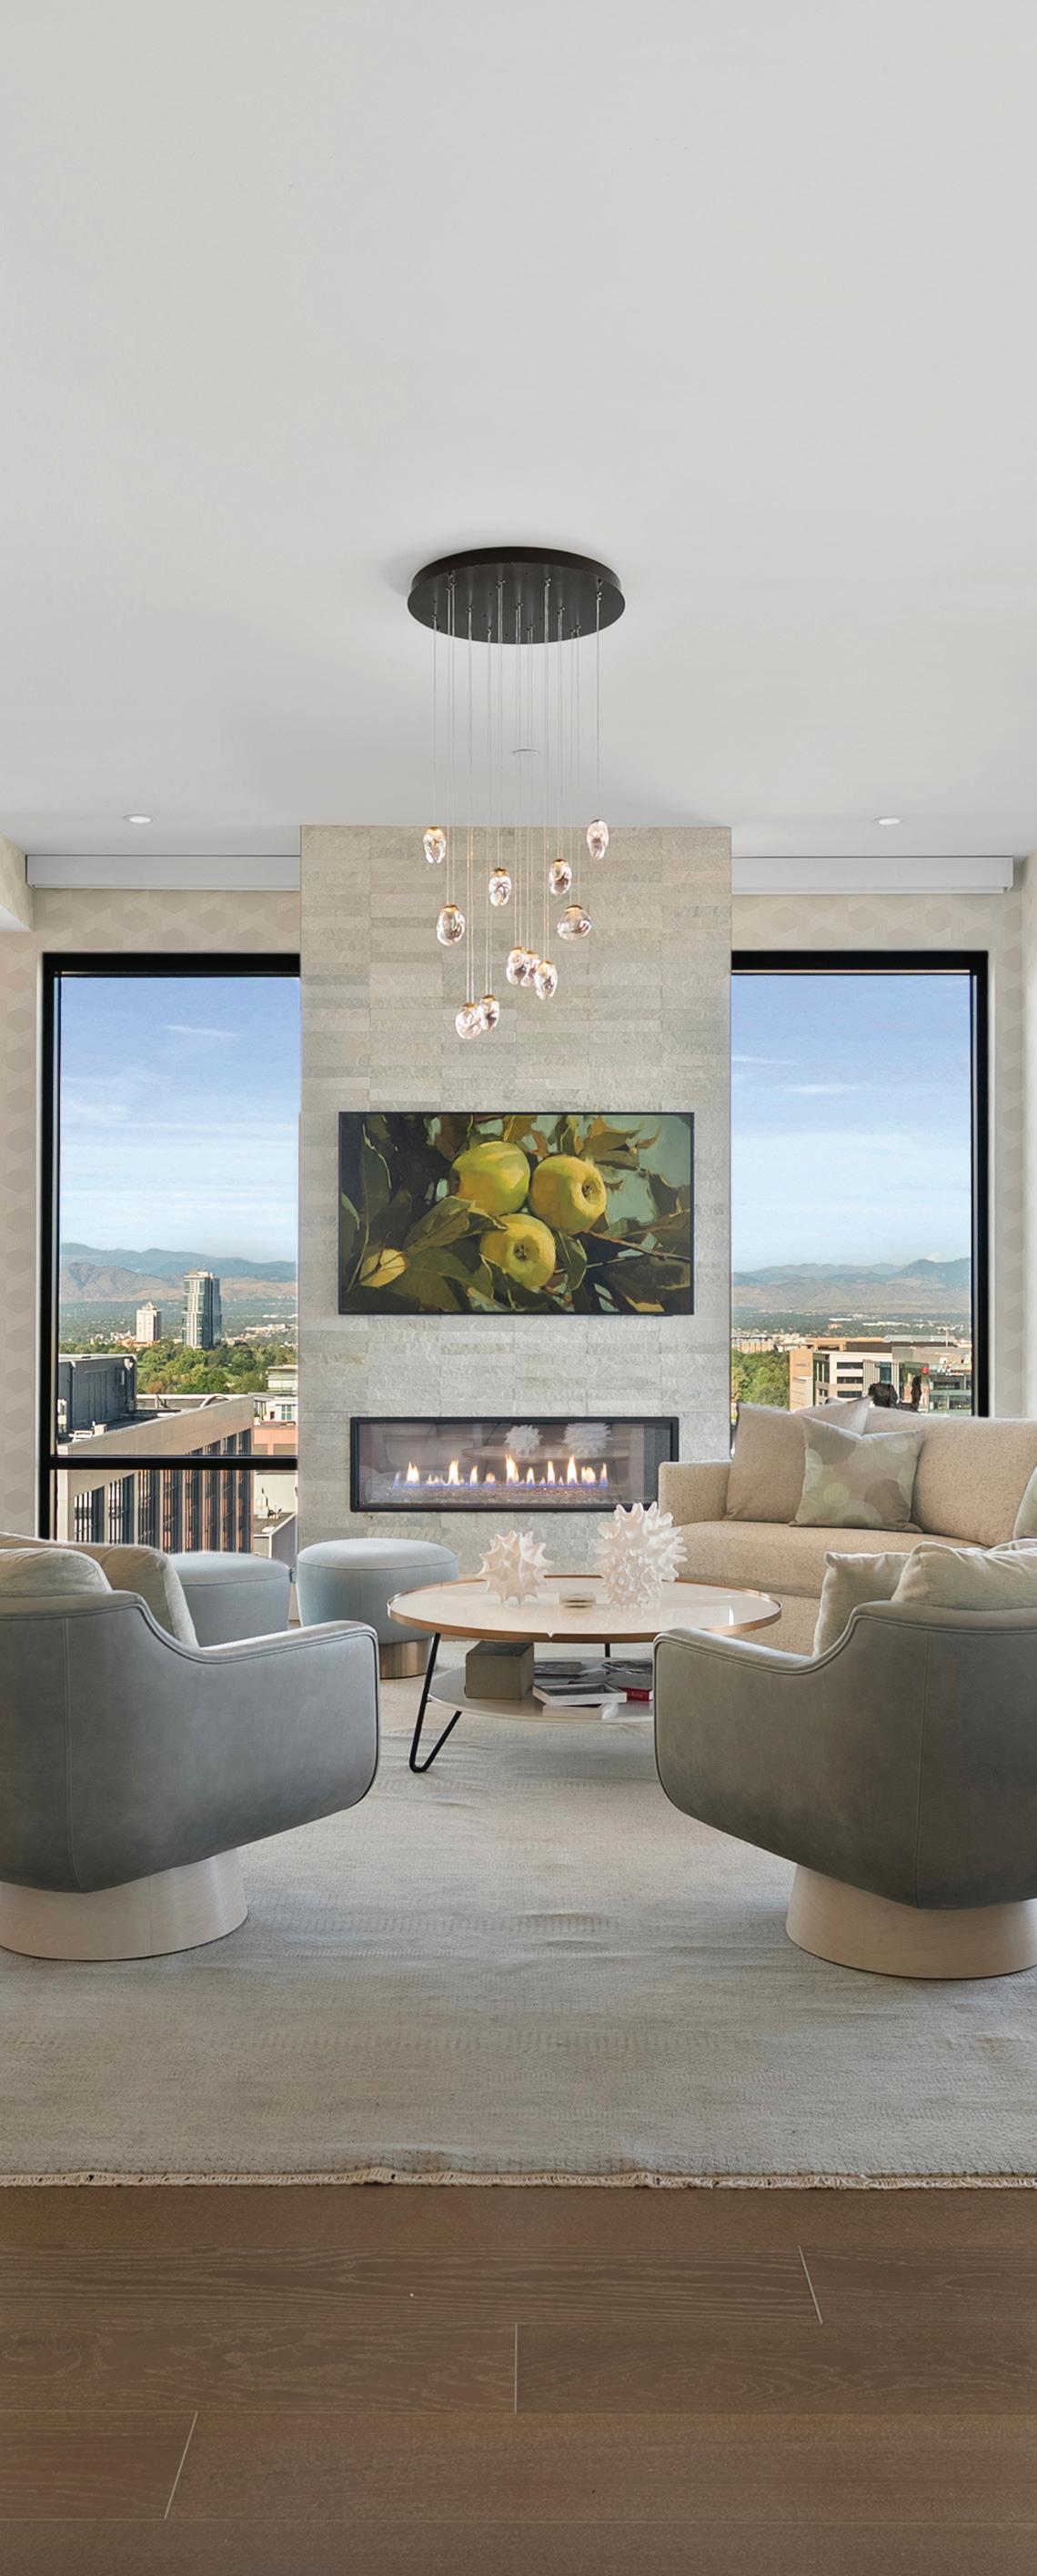
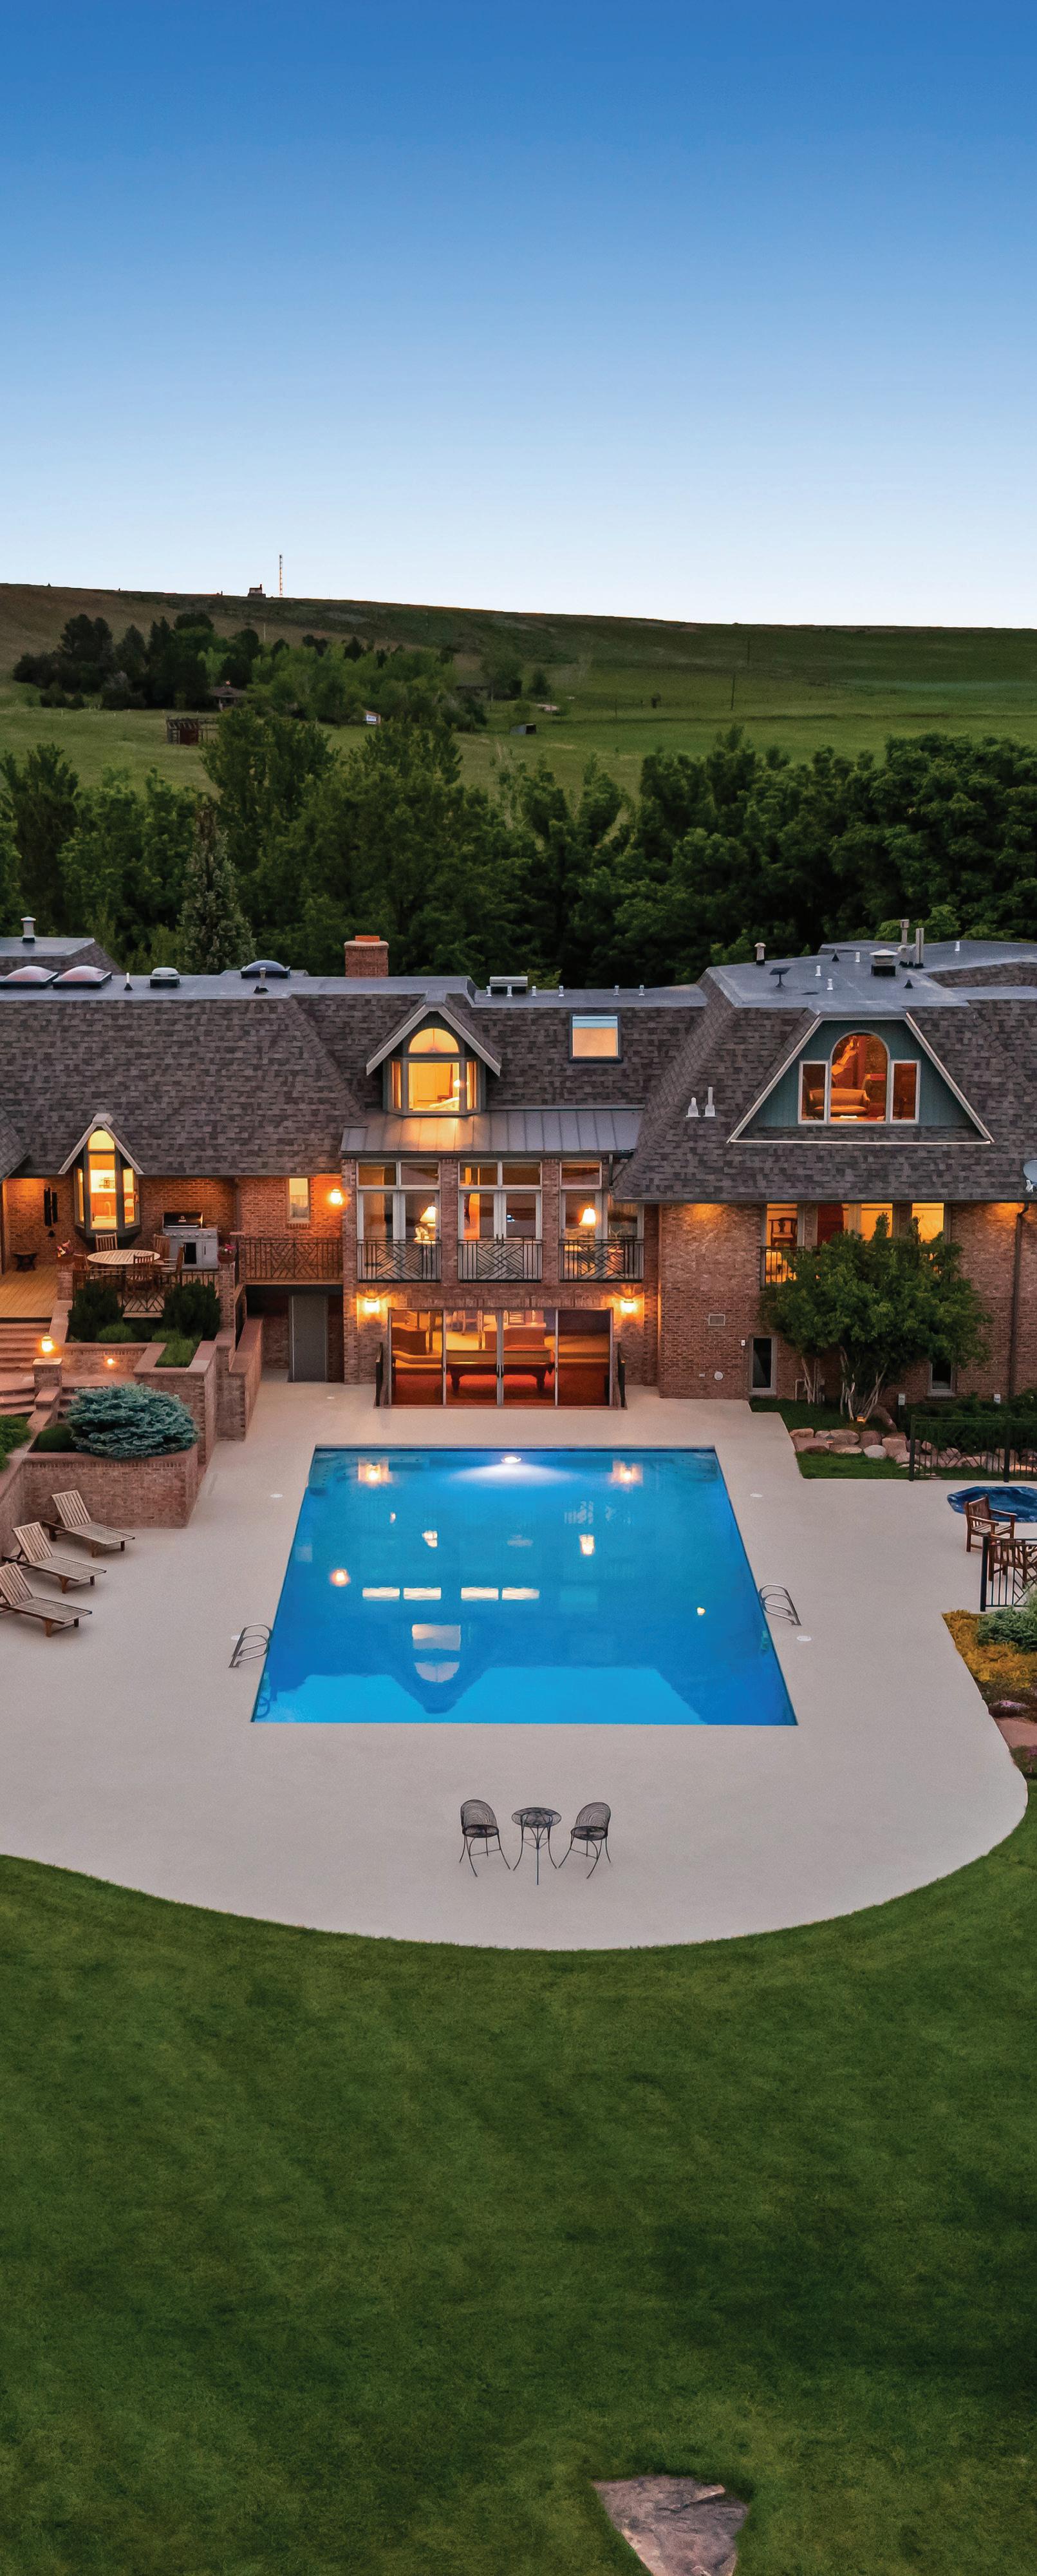
Throughout 2025, luxury home sales along the Front Range have remained consistent, creating a balanced market with myriad options for buyers. This balance highlights a market defined by stability, one that rewards strategic timing and informed decision-making.
Colorado Springs led the Front Range with a 1.7% increase in median sold price, while Denver Metro and West Metro & Foothills both saw a 0.9% increase. Northern Colorado experienced the greatest reduction compared to 2024 at a 1.5% decrease.
Colorado’s solid economy and stable job market continue to attract both new residents and thriving businesses, reinforcing long-term housing demand. In Colorado Springs, the luxury home market saw strong growth with 350 residences sold during the first three quarters of 2025, a 30.6% increase. South Metro accounted for 1,018 luxury home purchases, up 16.9% from last year.
As the market enters the winter season, activity is expected to slow. A natural decrease in a year that has otherwise reaffirmed the consistency of Colorado’s Front Range luxury segment.
Median Sold Price
$1,315,583
Average Days on Market + 0.1%
5,899 Properties Sold + 8.5%
62
$393
Median Price per Finished Sq. Ft. + 0.1% 98.0% List Price to Sold Price - 0.5%
Colorado’s Resorts
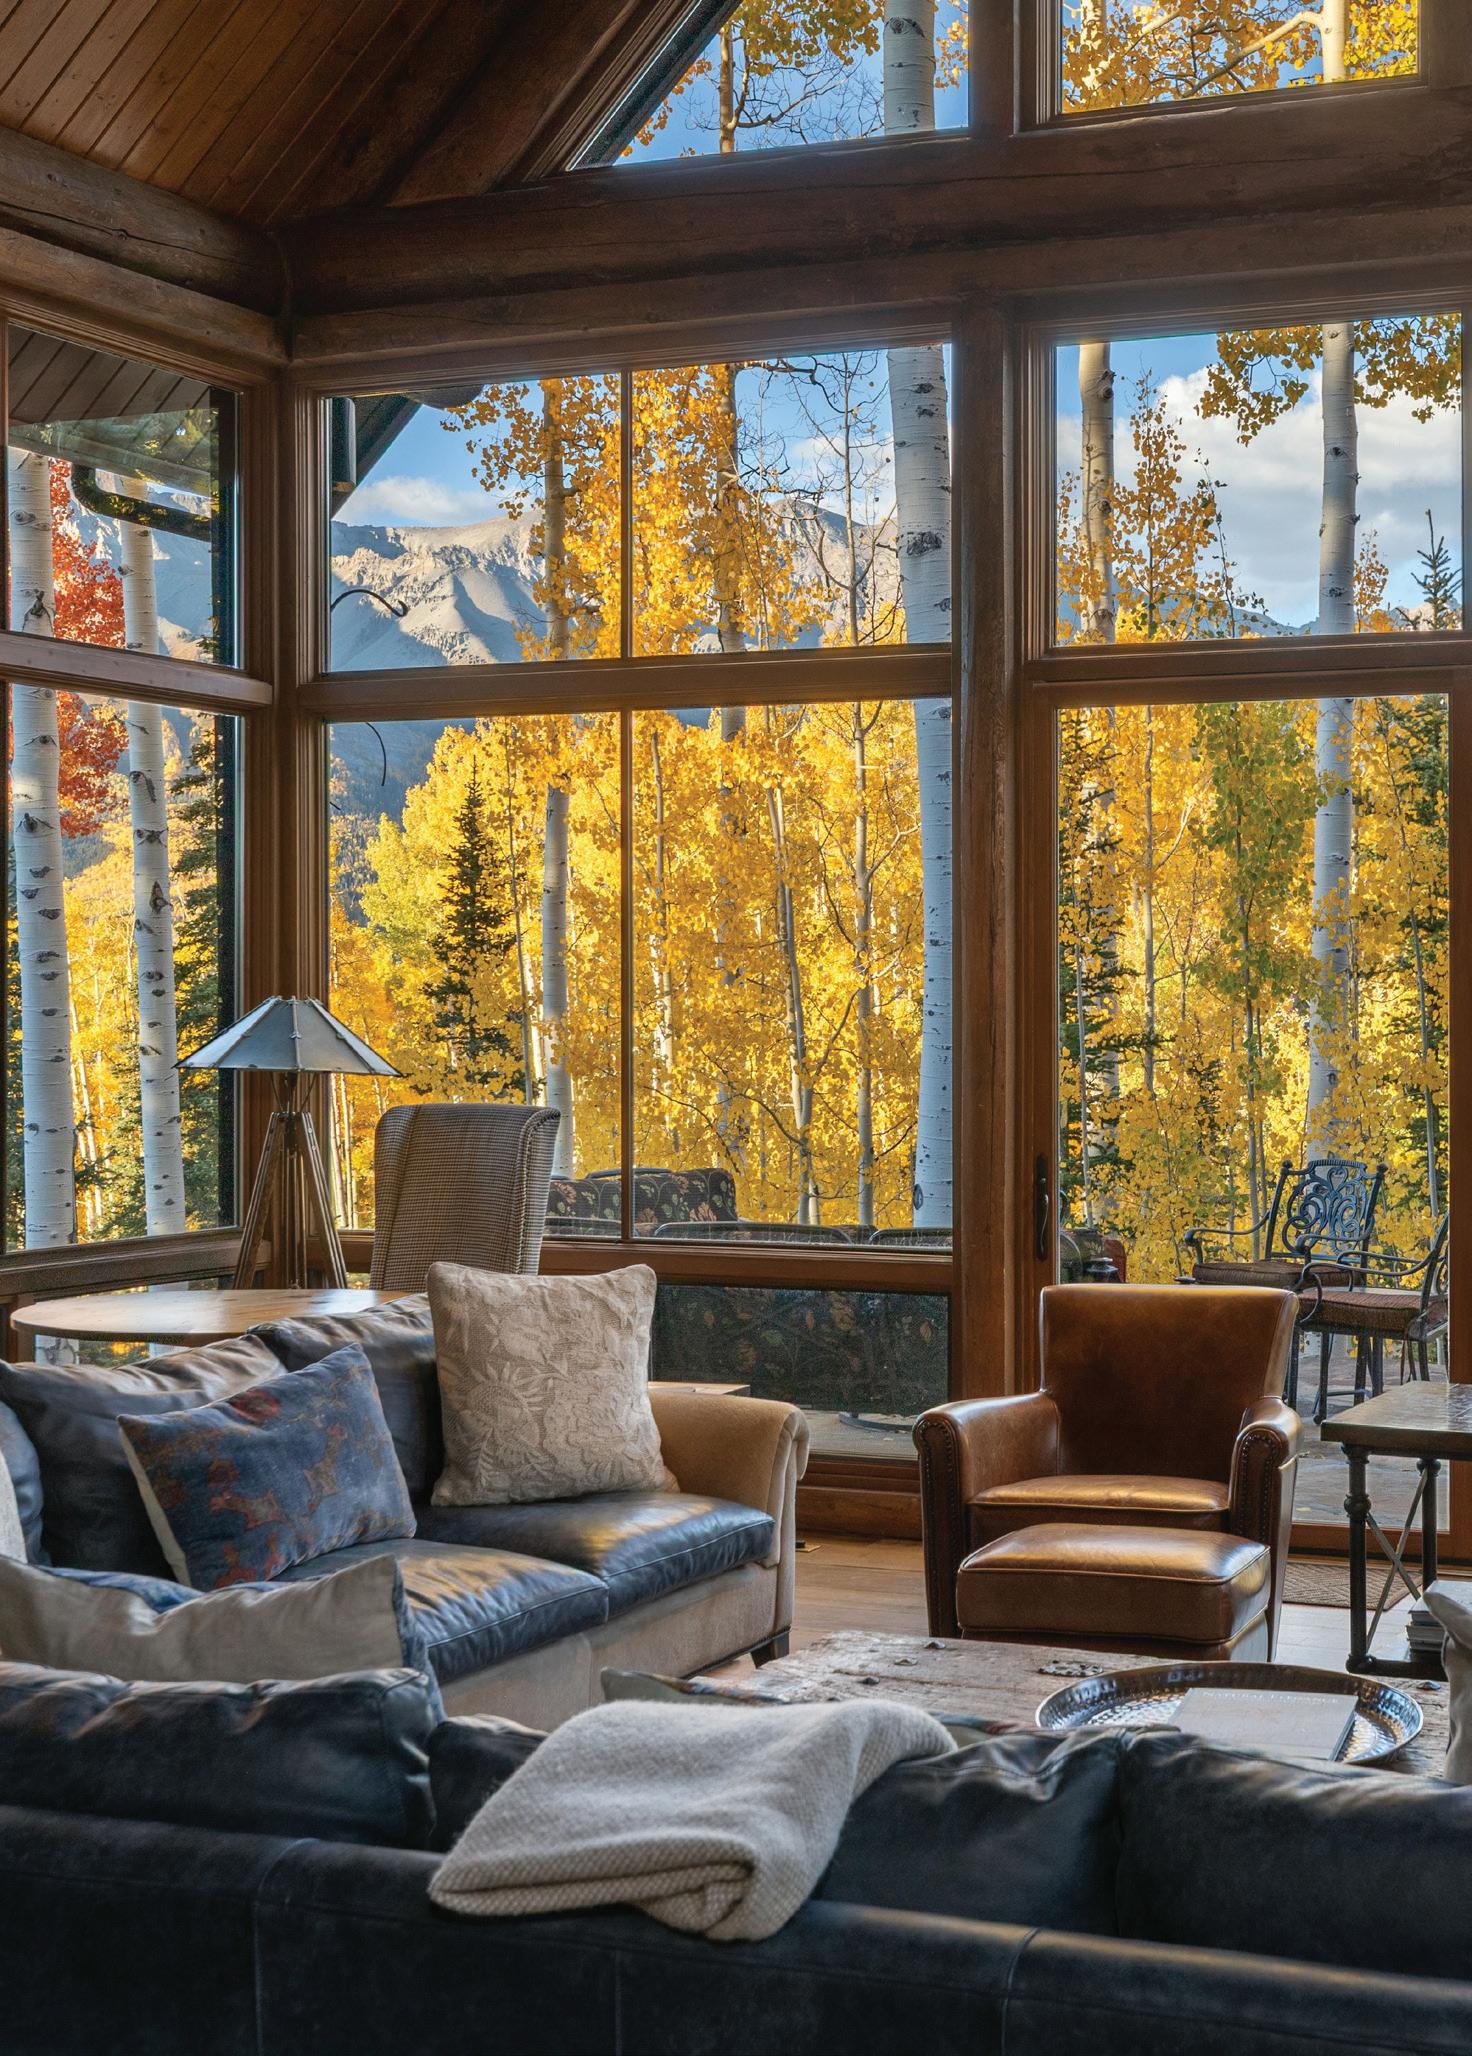
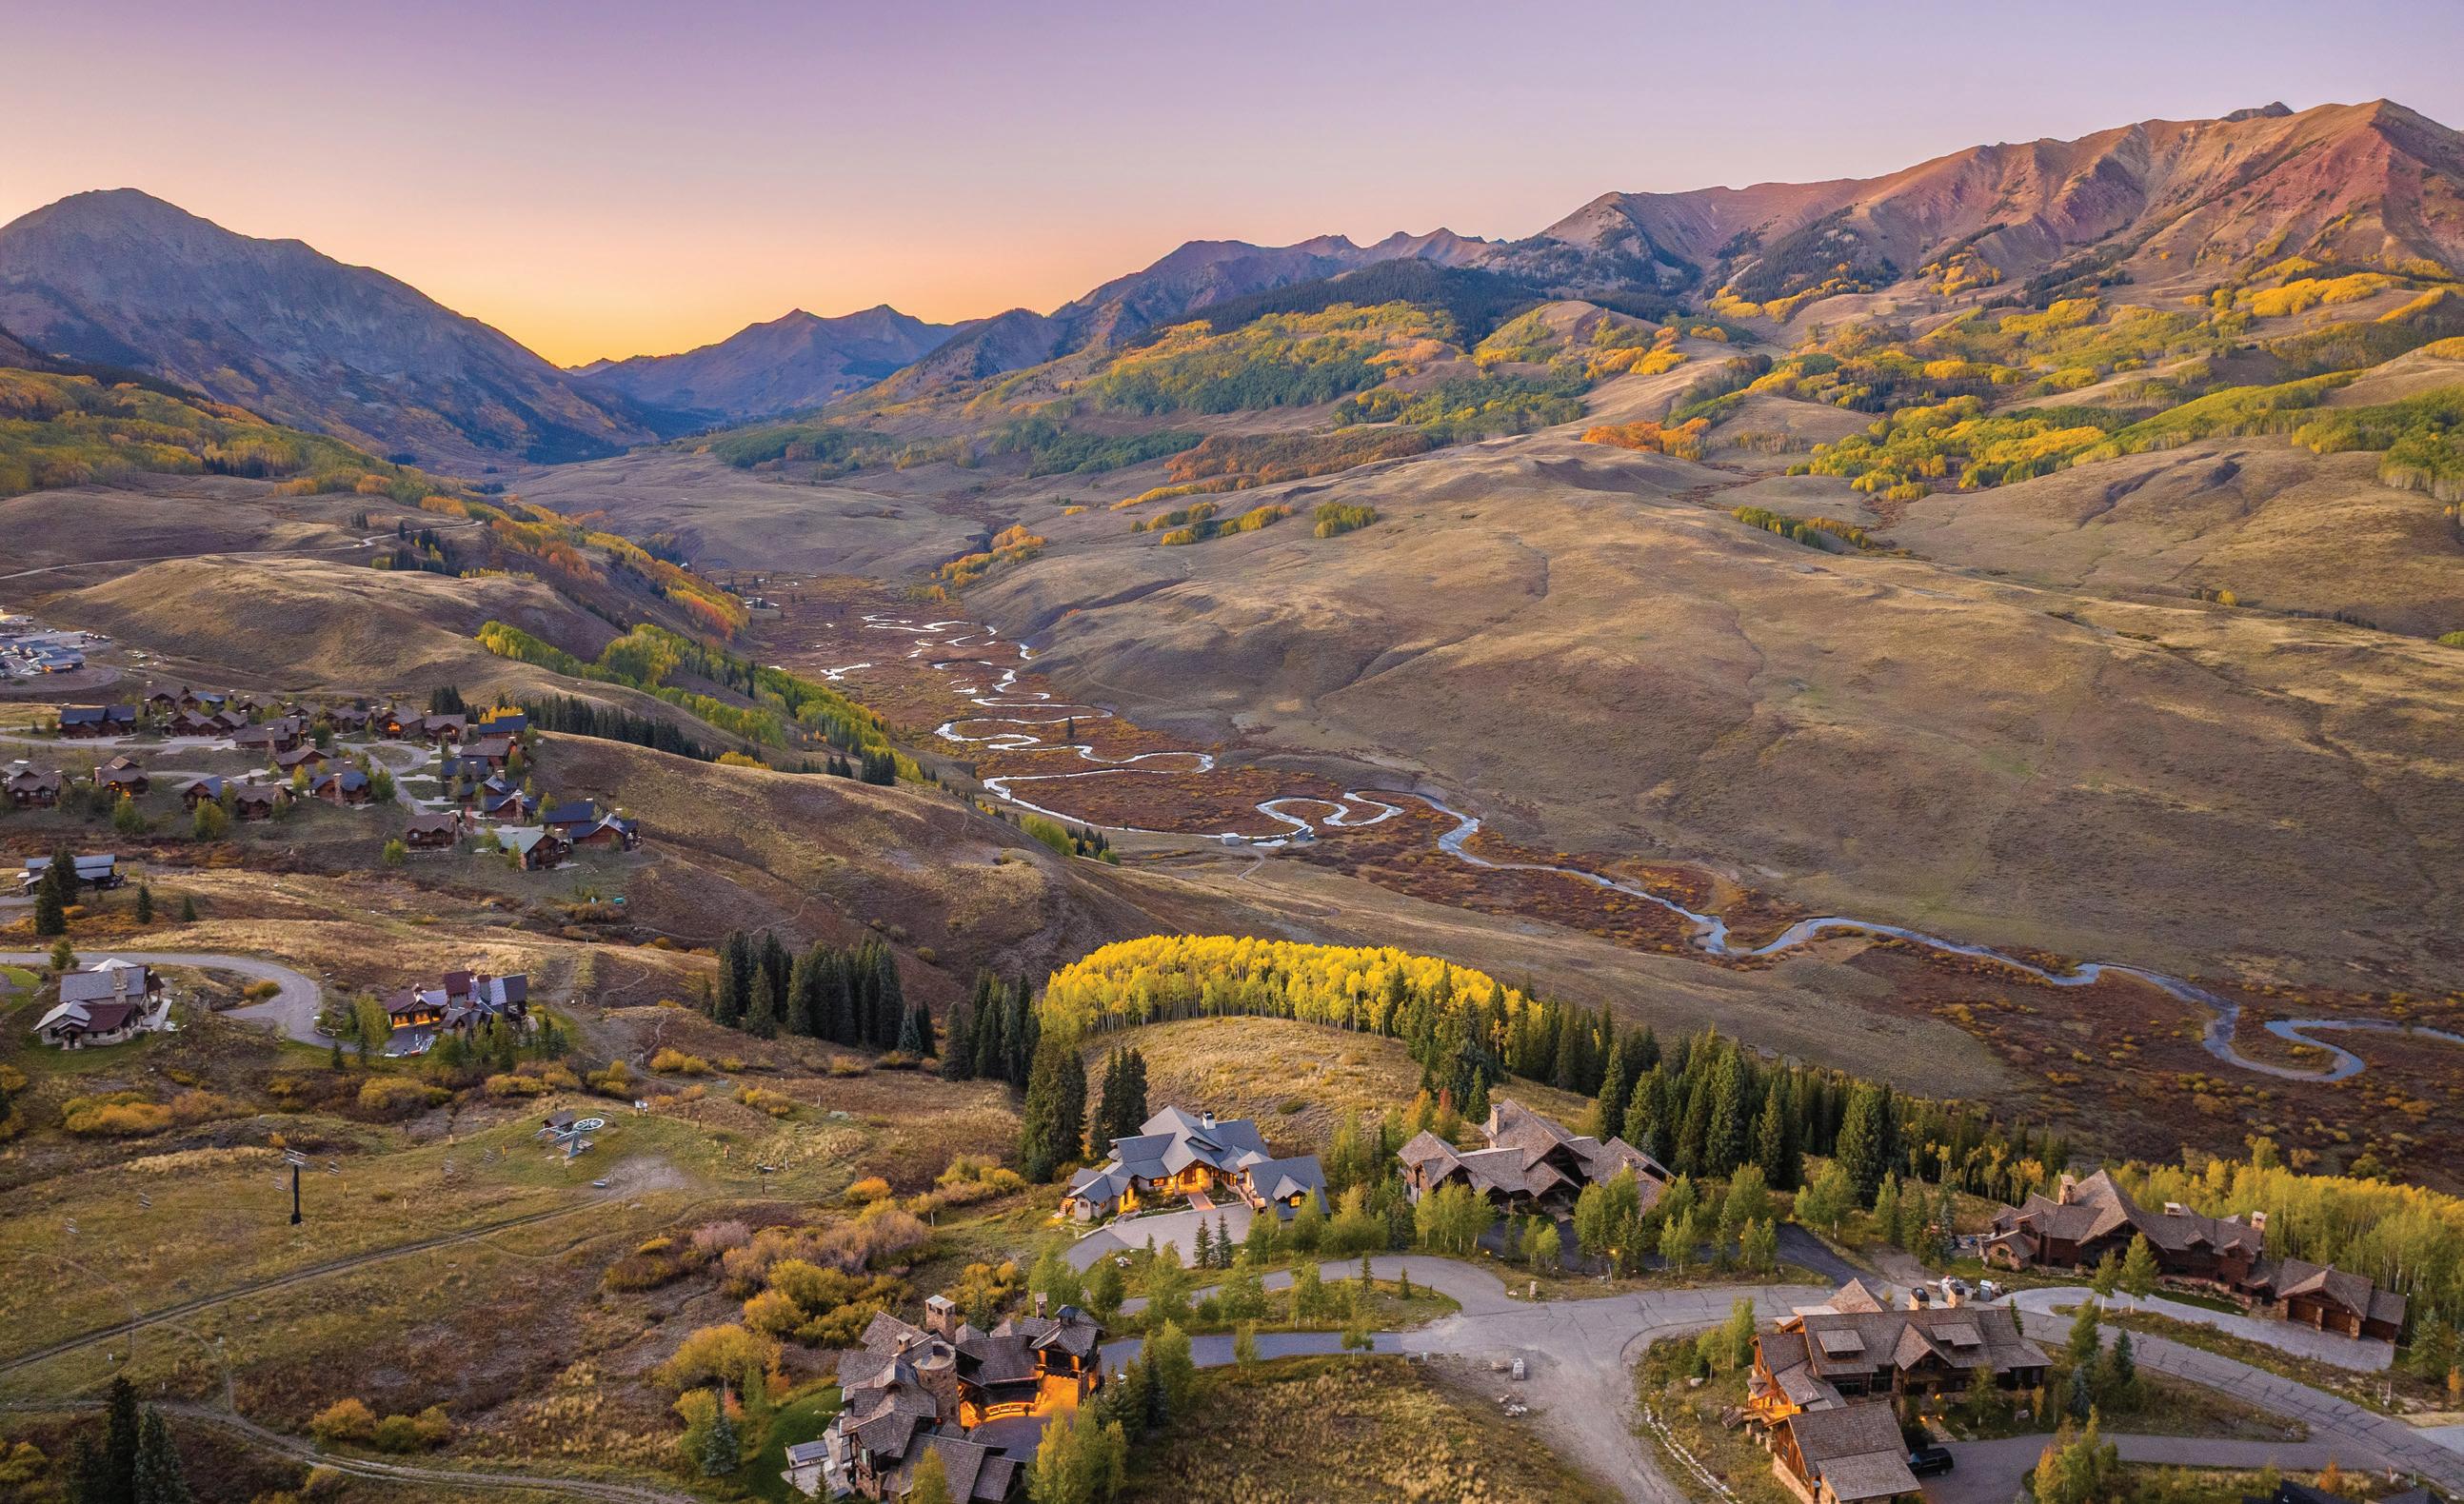
Colorado’s premier resort towns continue to enchant discerning buyers, offering an unparalleled fusion of outdoor exhilaration and serene mountain living. Whether it’s an elegant slope-side residence for winter getaways or a secluded estate nestled in nature, these coveted communities promise not only exceptional lifestyle experiences but also enduring investment value. With their refined charm and year-round appeal, Colorado’s high-altitude havens remain a top choice for those seeking both adventure and tranquility in one exquisite package.
Crested Butte’s luxury market demonstrated strong performance with a 29% increase in the highest sold price at $8,100,000. Vail Valley’s median sales price surged 9%, demonstrating its strength in attracting luxury buyers. Summit County recorded 209 luxury home sales, reflecting a 6.6% increase over 2024. Grand County saw a 13.4% increase in total sales volume so far in 2025, while Telluride’s top sales price was an impressive $33,000,000.
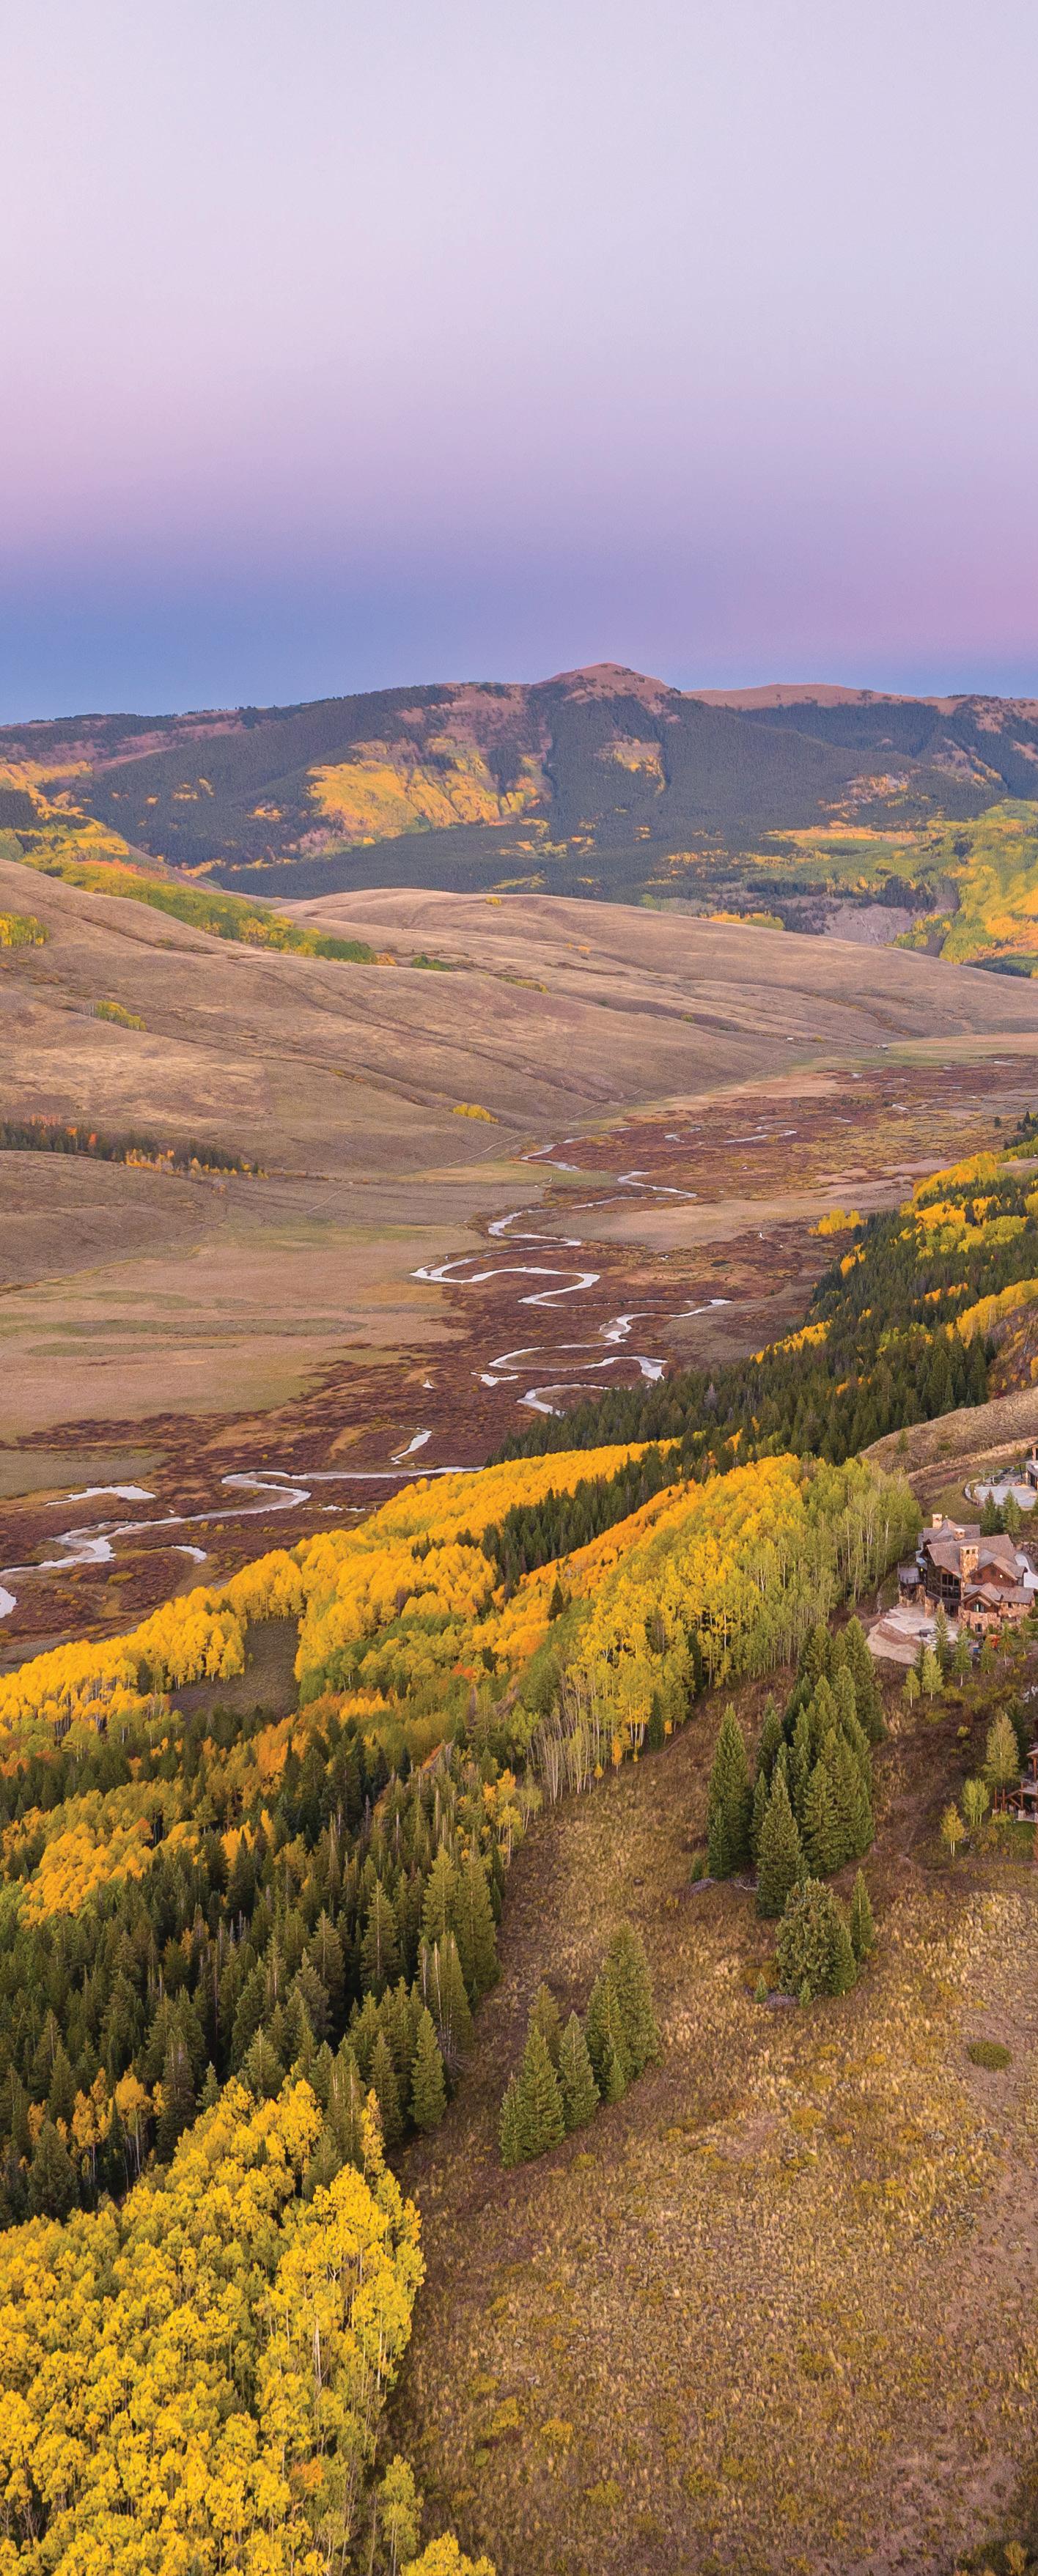
Colorado’s resort markets continue to be a cornerstone for ultra-luxury buyers, showcasing rare and remarkable properties set against some of the world’s most breathtaking alpine landscapes. As the fall season unfolds, sustained price resilience and unwavering buyer demand highlight the enduring allure and long-term value of owning in these coveted mountain enclaves.
$2,061,500
Average Days on Market - 2.9%
1,321 Properties Sold + 0.7%
Median Sold Price 106
Median Price per Finished Sq. Ft. +
$717
