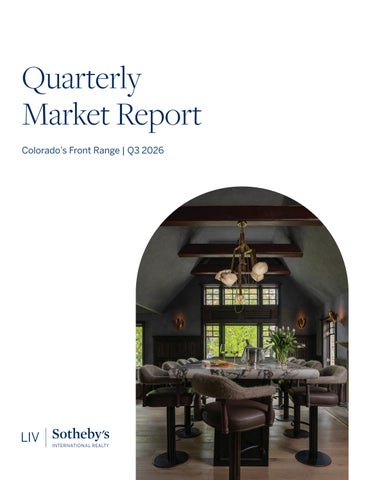
Quarterly Market Report Colorado’s Front Range | Q3 2026
Welcome Front Range Real Estate Market
This fall, Colorado real estate unfolded against
rose 9.6% year over year, and homes spent
a wider backdrop. In September, central
an average of 56 days on market, compared
banks from Washington, D.C. to Frankfurt
to year-end 2025. The median sales price
each raised rates by a quarter point, and
adjusted down 2% to $750,000. Denver
borrowing costs climbed across the world’s
Metro’s median sales price was unchanged
major economies. The 30-year mortgage rate
year over year at $590,000.
crossed 7%. Front Range buyers took more time to decide, and homes spent an average
In Colorado’s high country, discerning buyers
of 50 days on market. The median sales price
turned toward what is rare and tangible.
adjusted down 1.1% to $613,000. The number
The resort median sales price rose 14.6% to
of properties sold and total sales volume held
$1,143,500, from year-end 2025. Summit
steady at just over 47,000 and $32.2 billion,
County led median sales, followed by Telluride
respectively.
(+8.3%), Vail (+6.4%), and Crested Butte (+6.3%). Resort homes spent an average of
The most telling figure sits between two
149 days on market, compared with 127 days
others. Price per square foot adjusted down
by year-end 2025, as buyers took the time
2% from roughly the same time last year, yet
significant purchases deserve. Vail claimed
homes continued to sell at over 98% of list
the quarter’s highest sale at $36 million, up
price, unchanged from year-end 2025. While
9.1% from its top sale one year earlier.
global markets shifted, Colorado homes held their value.
At LIV Sotheby’s International Realty, we celebrate what makes Colorado undeniably
Northern Colorado continues to be a hot spot
unique. From PGA-level golf to the
for growth across the Front Range. Properties
approaching ski season, year-round arts,
sold rose 15.5% and total sales volume grew
culture, and award-winning dining – our
13.9% to $4.41 billion, both compared to
vibrant neighborhoods offer serene mountain
year-end 2025. At a median sales price of
retreats and luxury outdoor living. Our real
$530,000, the region offers comfortable
estate advisors pair local market intelligence
space, stable value, and exceptional mountain
with the reach of a well-connected global
views.
network.
Boulder was the only Front Range market
Discover the full picture in our newest
where homes sold both more often and more
Quarterly Market Report.
quickly than a year earlier. Properties sold
2 | livsothebysrealty.com
Q3 Colorado’s Front Range
Total Sales Volume
2025 vs 2026 % Change
$32,244,471,794
+ 0.2%
Properties Sold
47,007
- 0.3%
Average Days on Market
50
+ 3.1%
Median Price
Properties Sold
Avg. Days on Market
Price per Fin Sq. Ft.
Highest Sale
List Price to Sold Price
Denver Metro
$590,000
29,885
47
$293
$10,311,500
99.0%
South Metro
$710,000
4,948
50
$280
$7,400,000
99.0%
West Metro & Foothills
$648,000
6,093
41
$316
$6,950,000
99.0%
Boulder
$750,000
2,991
56
$366
$14,100,000
98.0%
Northern Colorado
$530,000
7,156
58
$265
$4,488,865
99.0%
Colorado Springs
$450,000
6,975
51
$222
$4,000,000
99.0%
Data based on sales in Adams, Arapahoe, Boulder, Broomfield, Denver, Douglas, El Paso, Jefferson, Larimer, Teller, and Weld Counties. All residential properties. Based on information from REColorado, IRES, and Pikes Peak MLS (PPMLS) for the period January 1, 2026 - September 30, 2026. This representation is based in whole or in part on data supplied by REColorado, IRES, and PPMLS. REColorado, IRES, and PPMLS do not guarantee nor are in any way responsible for its accuracy. Data maintained by REColorado, IRES, and PPMLS may not reflect all real estate activity in the Market.
January - September 2026 | 3
At a Glance
Denver Metro As the heartbeat of the Front Range, Denver Metro draws industry leaders and creative minds with its career opportunities, cultural depth, and a wellness-minded pace that residents protect fiercely. Mornings might begin with a run around Smith Lake or a ride along the city’s bike paths. Weekends are a short drive “up the hill” to alpine trails and world-class ski slopes. Few cities offer this kind of balance: room to grow, professionally and personally, with the Rockies always in view.
January - September
2026
% Change 2025 vs 2026
Median Sold Price
$590,000
0.0%
Properties Sold
29,885
- 3.8%
Average Days on Market
47
3.6%
Median Price per Finished Sq. Ft.
$293
- 3.1%
% List Price, to Sold Price
99.0%
0.0%
Data based on sales in Adams, Arapahoe, Broomfield, Denver, Douglas, and Jefferson Counties. All residential properties.
4 | livsothebysrealty.com
Median Sold Price October 2025 - September 2026
Total Sales Volume
$21,360,794,700
$625K $600K $575K $550K
2025 vs 2026 % Change
$525K
- 2.5%
Oct Nov Dec Jan
Feb Mar Apr May Jun
Jul
Aug Sept
Average Days on Market October 2025 - September 2026
52
Oct
58
Nov
65
Dec
75 61
Jan
Feb
50
Mar
40
38
39
41
Apr
May
Jun
Jul
46
Aug
51
Sept
Total Sales Volume October 2025 - September 2026 $3.0B $2.5B $2.0B $1.5B
$2.59B
$2.96B
$2.64B
$2.23B
Jan
Feb
Mar Apr May Jun
Jul
Aug Sept
$1.99B
$1.83B
Nov Dec
$2.95B
$1.30B
Oct
$2.86B
$2.02B
$10,311,500
$1.90B
Highest Sold Price
$2.43B
$1.0B
Based on information from REColorado, Pikes Peak MLS (PPMLS) and Colorado Real Estate Network MLS (CREN MLS) for the period January 1, 2026 - September 30, 2026 (Powered by LiveBy). This representation is based in whole or in part on data supplied by REColorado, PPMLS and CREN MLS. REColorado, PPMLS and CREN MLS do not guarantee nor are in any way responsible for its accuracy. Data maintained by REColorado, PPMLS and CREN MLS may not reflect all real estate activity in the Market.
January - September 2026 | 5
Denver Metro Median Sold Price
Properties Sold
$590,000
29,885
0.0% Change | Jan - Sept 2025 vs 2026
- 3.8% Change | Jan - Sept 2025 vs 2026
Average Days on Market
Median Price per Finished Sq. Ft.
47
$293
+ 3.6% Change | Jan - Sept 2025 vs 2026
- 3.1% Change | Jan - Sept 2025 vs 2026
6 | livsothebysrealty.com
Properties Sold
Median Sold Price
Average Days on Market
Aurora
3,860
$459,000
54
Live Data
Broomfield
768
$649,745
46
Live Data
Centennial
1,161
$651,850
35
Live Data
Cherry Hills Village
102
$3,337,500
58
Live Data
Commerce City
844
$495,000
53
Live Data
City of Denver
6,670
$615,000
48
Live Data
Englewood
279
$565,200
39
Live Data
Greenwood Village
158
$1,591,750
51
Live Data
Littleton
459
$623,500
36
Live Data
Thornton
1,339
$521,000
41
Live Data
Westminster
1,041
$537,000
38
Live Data
Live Data
Click for Live Data
Click for Community Data
January - September 2026 | 7
At a Glance
South Metro South Metro pairs refined suburban comfort with easy access to adventure. Centennial, Lone Tree, Highlands Ranch, and Castle Rock offer master-planned communities, expansive green belts, and extensive trail systems, all close to some of the region’s largest employment hubs. Families value the amenities and close-knit community feel, while the nearby foothills invite mountain biking, hiking, rock climbing, paddleboarding, and fishing. Between rounds at its many golf courses, residents enjoy shopping at Park Meadows and summer concerts under the stars at Fiddler’s Green Amphitheatre.
January - September
2026
% Change 2025 vs 2026
Median Sold Price
$710,000
- 1.4%
Properties Sold
4,948
- 7.0%
Average Days on Market
50
3.3%
Median Price per Finished Sq. Ft.
$280
- 2.2%
% List Price, to Sold Price
99.0%
0.0%
Data based on sales in Douglas County. All residential properties.
8 | livsothebysrealty.com
Median Sold Price October 2025 - September 2026
Total Sales Volume
$4,152,942,565
$800K $750K $700K $650K
2025 vs 2026 % Change
$600K
- 7.8%
Oct Nov Dec Jan
Feb Mar Apr May Jun
Jul
Aug Sept
Average Days on Market October 2025 - September 2026
84 60
Oct
59
Nov
67
67 51
Dec
Jan
Feb
Mar
47
42
38
Apr
May
41
Jun
Jul
49
Aug
56
Sept
Total Sales Volume October 2025 - September 2026 $625M $500M $375M
$449.5M
$601.5M
$560.6M
$462.6M
Nov Dec
Jan
Feb
Mar Apr May Jun
Jul
Aug Sept
$385.2M
$389.7M
Oct
$530.8M
$244.3M
$530.3M
$382.4M
$7,400,000
$323.3M
Highest Sold Price
$475.0M
$250M
Based on information from REColorado, Pikes Peak MLS (PPMLS) and Colorado Real Estate Network MLS (CREN MLS) for the period January 1, 2026 - September 30, 2026 (Powered by LiveBy). This representation is based in whole or in part on data supplied by REColorado, PPMLS and CREN MLS. REColorado, PPMLS and CREN MLS do not guarantee nor are in any way responsible for its accuracy. Data maintained by REColorado, PPMLS and CREN MLS may not reflect all real estate activity in the Market.
January - September 2026 | 9
South Metro Median Sold Price
Properties Sold
$710,000
4,948
- 1.4% Change | Jan - Sept 2025 vs 2026
- 7.0% Change | Jan - Sept 2025 vs 2026
Average Days on Market
Median Price per Finished Sq. Ft.
50
$280
+ 3.3% Change | Jan - Sept 2025 vs 2026
- 2.2% Change | Jan - Sept 2025 vs 2026
10 | livsothebysrealty.com
Properties Sold
Median Sold Price
Average Days on Market
Castle Pines
224
$990,000
54
Live Data
Castle Rock
1,148
$640,000
55
Live Data
Franktown
14
$1,825,000
54
Live Data
Highlands Ranch
1,108
$705,000
37
Live Data
Larkspur
91
$900,000
65
Live Data
Lone Tree
165
$860,000
47
Live Data
Parker
794
$644,350
39
Live Data
Live Data
Click for Live Data
Click for Community Data
January - September 2026 | 11
At a Glance
West Metro & Foothills In the West Metro Foothills, Colorado adventures aren’t reserved for the weekends. Arvada, Lakewood, and Morrison sit where the city meets the mountains, close enough to Denver for an easy work commute and close enough to the trailhead for an evening trail run. Walkable districts blend retail, dining, and arts and culture. Residents dine in Olde Town Arvada, shop at Belmar, and catch shows at Red Rocks Amphitheatre, one of the most celebrated venues in the world. Wellness is woven into daily life, from summer mornings at Yoga on the Rocks to running clubs and paddleboarding on Evergreen Lake.
January - September
2026
% Change 2025 vs 2026
Median Sold Price
$648,000
0.5%
Properties Sold
6,093
- 2.4%
Average Days on Market
41
10.1%
Median Price per Finished Sq. Ft.
$316
- 3.7%
% List Price, to Sold Price
99.0%
0.0%
Data based on sales in Jefferson County. All residential properties.
12 | livsothebysrealty.com
Median Sold Price October 2025 - September 2026
Total Sales Volume
$4,509,690,916
$800K $725K $650K $575K
2025 vs 2026 % Change
$500K
- 1.6%
Oct Nov Dec Jan
Feb Mar Apr May Jun
Jul
Aug Sept
Average Days on Market October 2025 - September 2026
76 49
Oct
58
56
56 40
Nov
Dec
Jan
Feb
Mar
32
35
33
36
40
Apr
May
Jun
Jul
Aug
48
Sept
Total Sales Volume October 2025 - September 2026 $750M $625M $500M $375M $509.0M
$628.8M
$551.9M
$495.3M
Jan
Feb
Mar Apr May Jun
Jul
Aug Sept
$442.8M
$369.2M
Nov Dec
$615.4M
$265.8M
Oct
$631.6M
$413.9M
$6,950,000
$426.6M
Highest Sold Price
$487.3M
$250M
Based on information from REColorado, Pikes Peak MLS (PPMLS) and Colorado Real Estate Network MLS (CREN MLS) for the period January 1, 2026 - September 30, 2026 (Powered by LiveBy). This representation is based in whole or in part on data supplied by REColorado, PPMLS and CREN MLS. REColorado, PPMLS and CREN MLS do not guarantee nor are in any way responsible for its accuracy. Data maintained by REColorado, PPMLS and CREN MLS may not reflect all real estate activity in the Market.
January - September 2026 | 13
West Metro & Foothills Median Sold Price
Properties Sold
$648,000
6,093
+ 0.5% Change | Jan - Sept 2025 vs 2026
- 2.4% Change | Jan - Sept 2025 vs 2026
Average Days on Market
Median Price per Finished Sq. Ft.
41
$316
+ 10.1% Change | Jan - Sept 2025 vs 2026
- 3.7% Change | Jan - Sept 2025 vs 2026
14 | livsothebysrealty.com
Properties Sold
Median Sold Price
Average Days on Market
Arvada
1,423
$627,000
42
Live Data
Conifer
138
$775,000
64
Live Data
Evergreen
372
$931,500
57
Live Data
Golden
143
$850,000
35
Live Data
Lakewood
1,371
$575,000
39
Live Data
Morrison
2
$835,000
14
Live Data
Wheat Ridge
320
$638,750
39
Live Data
Live Data
Click for Live Data
Click for Community Data
January - September 2026 | 15
At a Glance
Boulder More than 45,000 acres of open space and mountain parks bring hiking, trail running, and cycling to the back door of any Boulder residence. Downtown, the Pearl Street Mall offers independent boutiques, farmfresh restaurants, and street performers. The cultural calendar is just as rich: the Boulder Theater and Chautauqua Auditorium host celebrated musicians and speakers, and the Boulder Museum of Contemporary Art and a thriving gallery scene line the city’s creative core. In January 2027, the Sundance Film Festival will make Boulder its new home, confirming the city’s place among the country’s cultural destinations.
January - September
2026
% Change 2025 vs 2026
Median Sold Price
$750,000
- 2.0%
Properties Sold
2,991
9.6%
Average Days on Market
56
- 2.9%
Median Price per Finished Sq. Ft.
$366
- 0.2%
% List Price, to Sold Price
98.0%
0.0%
Data based on sales in Boulder County. All residential properties.
16 | livsothebysrealty.com
Median Sold Price October 2025 - September 2026
Total Sales Volume
$2,861,484,658
$850K $800K $750K $700K
2025 vs 2026 % Change
$650K
+ 9.1%
Oct Nov Dec Jan
Feb Mar Apr May Jun
Jul
Aug Sept
Average Days on Market October 2025 - September 2026
83
90
104 81
67
Oct
Nov
Dec
Jan
Feb
65
Mar
54
56
Apr
May
43
41
44
Jun
Jul
Aug
55
Sept
Total Sales Volume October 2025 - September 2026 $500M $400M $300M
$338.5M
$442.6M
$380.9M
$271.6M
Jan
Feb
Mar Apr May Jun
Jul
Aug Sept
$269.3M
$228.9M
Nov Dec
$398.1M
$161.4M
Oct
$370.2M
$246.5M
$14,100,000
$223.1M
Highest Sold Price
$334.4M
$200M
Based on information from REColorado, IRES MLS, Pikes Peak MLS (PPMLS) and Colorado Real Estate Network MLS (CREN MLS) for the period January 1, 2026 - September 30, 2026 (Powered by LiveBy). This representation is based in whole or in part on data supplied by REColorado, IRES MLS, PPMLS and CREN MLS. REColorado, IRES MLS, PPMLS and CREN MLS do not guarantee nor are in any way responsible for its accuracy. Data maintained by REColorado, IRES MLS, PPMLS and CREN MLS may not reflect all real estate activity in the Market.
January - September 2026 | 17
Boulder Median Sold Price
Properties Sold
$750,000
2,991
- 2.0% Change | Jan - Sept 2025 vs 2026
+ 9.6% Change | Jan - Sept 2025 vs 2026
Average Days on Market
Median Price per Finished Sq. Ft.
56
$366
- 2.9% Change | Jan - Sept 2025 vs 2026
- 0.2% Change | Jan - Sept 2025 vs 2026
18 | livsothebysrealty.com
Properties Sold
Median Sold Price
Average Days on Market
City of Boulder
725
$995,000
60
Live Data
Erie
566
$760,000
58
Live Data
Lafayette
308
$690,000
40
Live Data
Longmont
912
$551,250
51
Live Data
Louisville
195
$900,000
47
Live Data
Niwot
48
$1,412,500
39
Live Data
Superior
146
$895,000
64
Live Data
Live Data
Click for Live Data
Click for Community Data
January - September 2026 | 19
At a Glance
Northern Colorado Northern Colorado combines the personality of America’s western frontier with top-voted breweries and agricultural roots that still shape its creativity today. Beyond Fort Collins, the region’s smaller towns are writing their own stories. Windsor centers its lively events calendar on its lake and Boardwalk Community Park. Timnath’s town center is growing quickly, and Berthoud’s historic Fourth Street keeps its small-town character close. Here, an outdoor-first lifestyle comes with a little more room to breathe. Residents enjoy hiking, boating, and rock climbing, along with a connected network of trails and greenways linking Fort Collins, Loveland, Windsor, and Timnath for cyclists and runners.
January - September
2026
% Change 2025 vs 2026
Median Sold Price
$530,000
- 1.8%
Properties Sold
7,156
15.5%
Average Days on Market
58
2.1%
Median Price per Finished Sq. Ft.
$265
- 1.0%
% List Price, to Sold Price
99.0%
0.0%
Data based on sales in Larimer and Weld Counties. All residential properties.
20 | livsothebysrealty.com
Median Sold Price October 2025 - September 2026
Total Sales Volume
$4,405,264,458
$550K $540K $530K $520K
2025 vs 2026 % Change
$510K
+ 13.9%
Oct Nov Dec Jan
Feb Mar Apr May Jun
Jul
Aug Sept
Average Days on Market October 2025 - September 2026
67
Oct
80
75
Nov
Dec
85
Jan
80
Feb
76
Mar
66
Apr
58
May
44
45
41
Jun
Jul
Aug
52
Sept
Total Sales Volume October 2025 - September 2026 $750M $625M $500M $375M
$488.2M
$655.6M
$583.1M
$463.5M
Jan
Feb
Mar Apr May Jun
Jul
Aug Sept
$425.1M
$354.5M
Nov Dec
$599.5M
$285.4M
Oct
$551.5M
$410.6M
$4,488,865
$351.8M
Highest Sold Price
$454.4M
$250M
Based on information from REColorado, Pikes Peak MLS (PPMLS) and Colorado Real Estate Network MLS (CREN MLS) for the period January 1, 2026 - September 30, 2026 (Powered by LiveBy). This representation is based in whole or in part on data supplied by REColorado, PPMLS and CREN MLS. REColorado, PPMLS and CREN MLS do not guarantee nor are in any way responsible for its accuracy. Data maintained by REColorado, PPMLS and CREN MLS may not reflect all real estate activity in the Market.
January - September 2026 | 21
Northern Colorado Median Sold Price
Properties Sold
$530,000
7,156
- 1.8% Change | Jan - Sept 2025 vs 2026
+ 15.5% Change | Jan - Sept 2025 vs 2026
Average Days on Market
Median Price per Finished Sq. Ft.
58
$265
+ 2.1% Change | Jan - Sept 2025 vs 2026
- 1.0% Change | Jan - Sept 2025 vs 2026
22 | livsothebysrealty.com
Properties Sold
Median Sold Price
Average Days on Market
Berthoud
254
$585,000
65
Live Data
Fort Collins
1,654
$553,250
46
Live Data
Greeley
826
$419,995
57
Live Data
Johnstown
480
$489,970
71
Live Data
Loveland
954
$495,000
57
Live Data
Timnath
194
$725,000
68
Live Data
Windsor
666
$596,000
76
Live Data
Live Data
Click for Live Data
Click for Community Data
January - September 2026 | 23
At a Glance
Colorado Springs Framed by the towering 15,115-foot Pikes Peak and the red sandstone of Garden of the Gods, Colorado Springs offers a sense of scale and natural drama few markets can match. Downtown’s walkable core of restaurants, breweries, and public spaces is anchored by the United States Olympic & Paralympic Museum, a fitting landmark for a city built around an active life. Just north of downtown, The Fine Arts Center houses a strong regional collection and a performance space, while neighboring Manitou Springs adds an eclectic, artistic spirit with its mineral springs, galleries, and vibrant community attractions. Buyers come for the dramatic beauty and stay for the strong sense of place.
January - September
2026
% Change 2025 vs 2026
Median Sold Price
$450,000
- 2.2%
Properties Sold
6,975
- 2.5%
Average Days on Market
51
5.3%
Median Price per Finished Sq. Ft.
$222
- 3.7%
% List Price, to Sold Price
99.0%
0.0%
Data based on sales in El Paso and Teller Counties. All residential properties.
24 | livsothebysrealty.com
Median Sold Price October 2025 - September 2026
Total Sales Volume
$3,616,927,978
$500K $475K $450K $425K
2025 vs 2026 % Change
$400K
- 4.4%
Oct Nov Dec Jan
Feb Mar Apr May Jun
Jul
Aug Sept
Average Days on Market October 2025 - September 2026
66 53
Oct
75
67
54
Nov
Dec
Jan
Feb
61
Mar
48
45
43
Apr
May
Jun
39
Jul
47
Aug
52
Sept
Total Sales Volume October 2025 - September 2026 $600M $500M $400M $300M
$431.0M
$537.3M
$456.6M
$364.3M
Jan
Feb
Mar Apr May Jun
Jul
Aug Sept
$339.9M
$296.9M
Nov Dec
$519.5M
$216.4M
Oct
$456.1M
$347.7M
$4,000,000
$307.7M
Highest Sold Price
$327.2M
$200M
Based on information from REColorado, Pikes Peak MLS (PPMLS) and Colorado Real Estate Network MLS (CREN MLS) for the period January 1, 2026 - September 30, 2026 (Powered by LiveBy). This representation is based in whole or in part on data supplied by REColorado, PPMLS and CREN MLS. REColorado, PPMLS and CREN MLS do not guarantee nor are in any way responsible for its accuracy. Data maintained by REColorado, PPMLS and CREN MLS may not reflect all real estate activity in the Market.
January - September 2026 | 25
Colorado Springs Median Sold Price
Properties Sold
$450,000
6,975
- 2.2% Change | Jan - Sept 2025 vs 2026
- 2.5% Change | Jan - Sept 2025 vs 2026
Average Days on Market
Median Price per Finished Sq. Ft.
51
$222
+ 5.3% Change | Jan - Sept 2025 vs 2026
- 3.7% Change | Jan - Sept 2025 vs 2026
26 | livsothebysrealty.com
Properties Sold
Median Sold Price
Average Days on Market
Air Force Academy
342
$589,500
39
Live Data
Banning Lewis Ranch
327
$464,000
52
Live Data
Black Forest
192
$997,000
67
Live Data
Broadmoor
67
$935,000
62
Live Data
Flying Horse
79
$855,000
66
Live Data
Garden of the Gods
233
$529,000
48
Live Data
Monument
543
$750,000
57
Live Data
Live Data
Click for Live Data
Click for Community Data
January - September 2026 | 27
Well-connected to the market. ColoradoMarketReports.com
© 2026 LIV Sotheby’s International Realty. All Rights Reserved. LIV Sotheby’s International Realty® is a registered trademark and used with permission. Each Sotheby’s International Realty office is independently owned and operated, except those operated by Sotheby’s International Realty, Inc. This material is based upon information which we consider reliable but because it has been supplied by third parties, we cannot represent that it is accurate or complete and it should not be relied upon as such. If your property is listed with a real estate broker, please disregard. It is not our intention to solicit the offerings of other real estate brokers. We are happy to work with them and cooperate fully. Equal Housing Opportunity.