Luxury Report


1 YEAR-END 2022
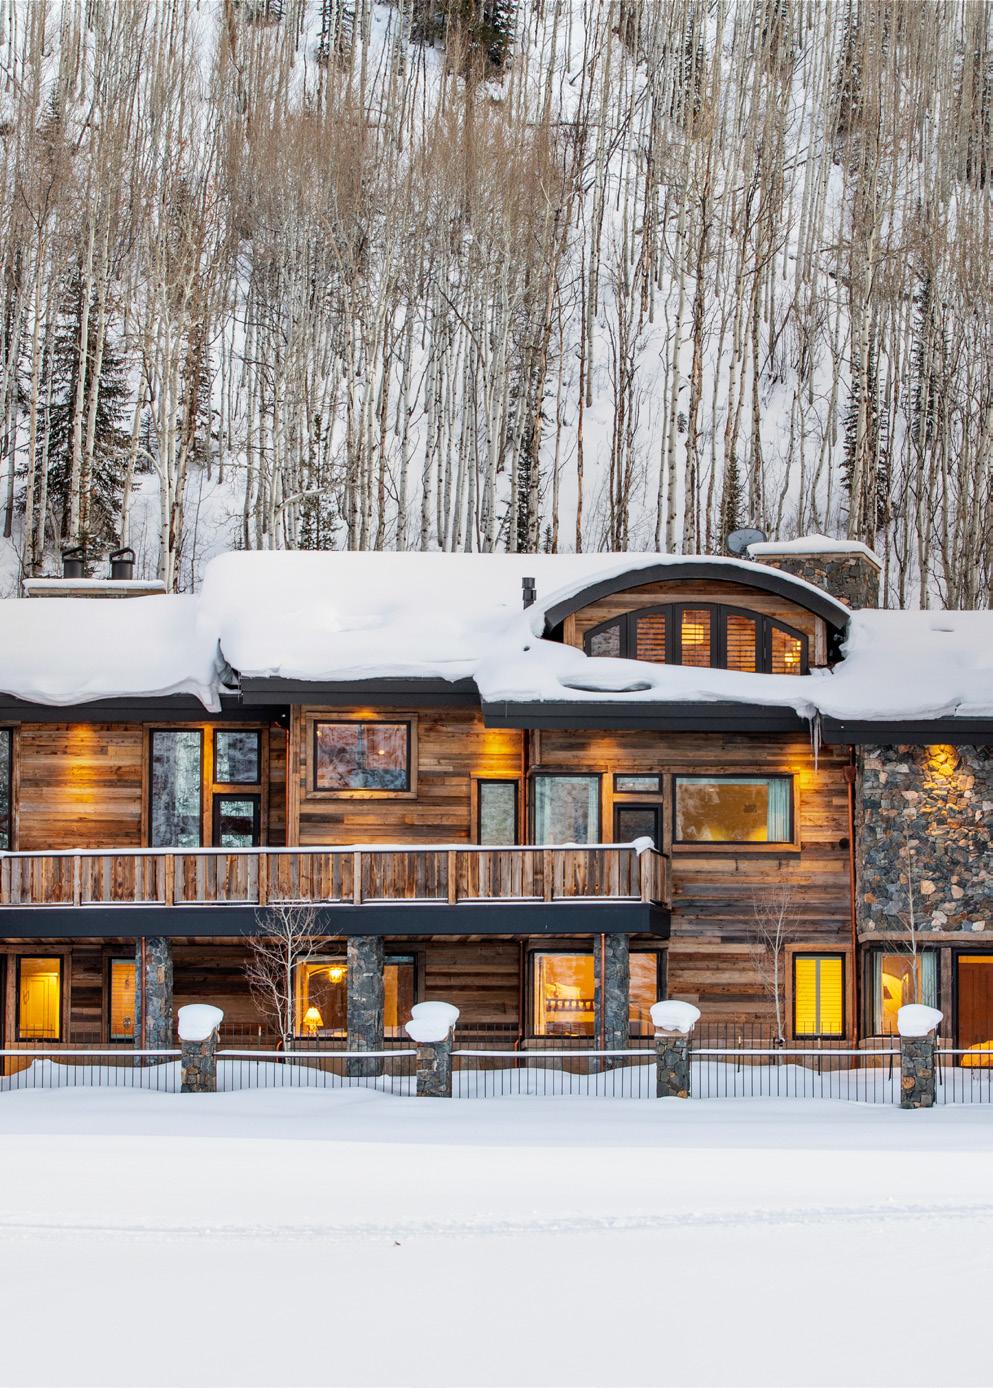
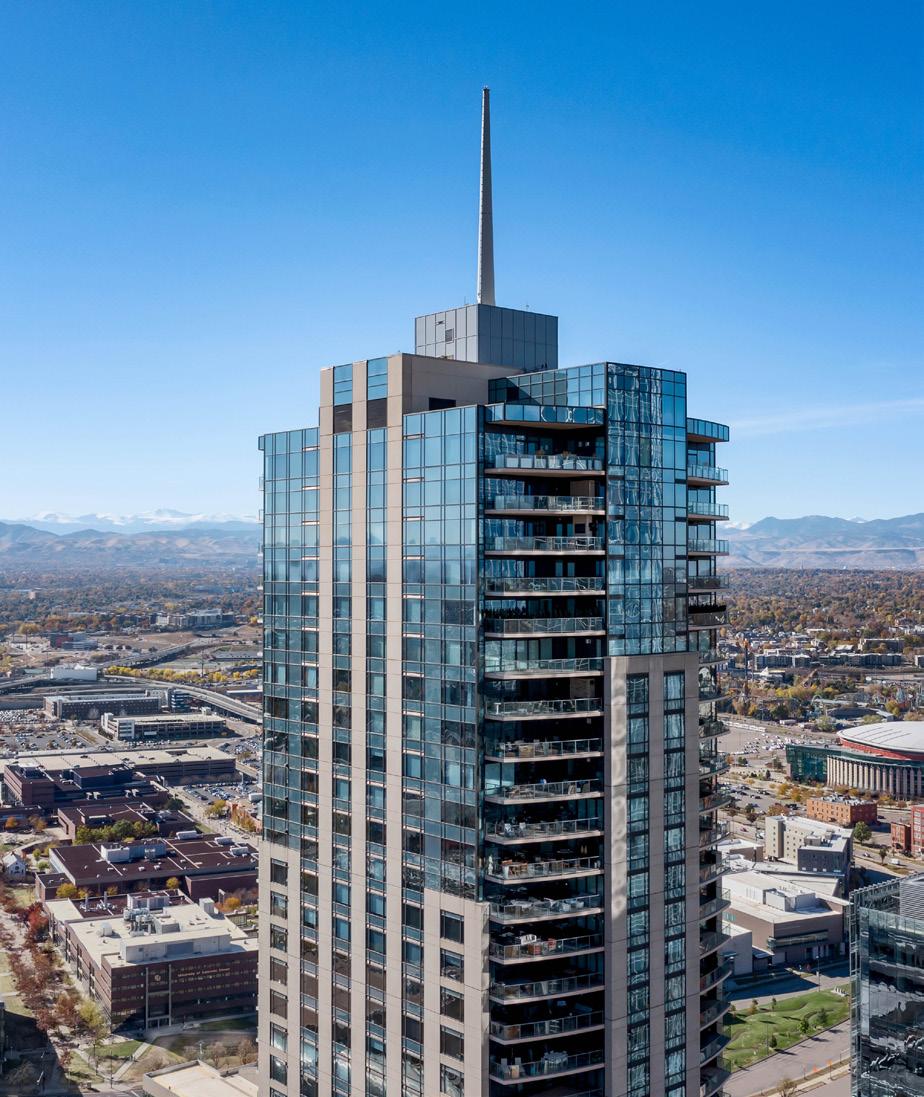
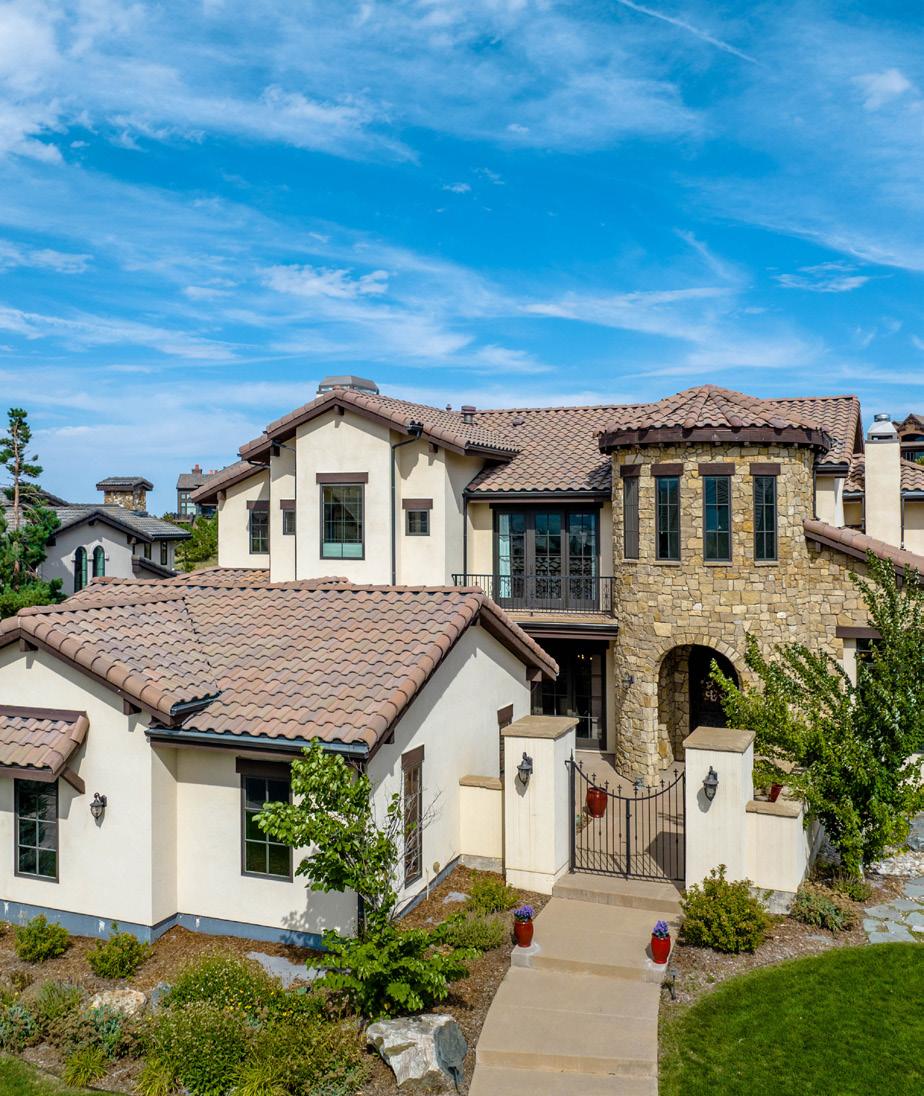
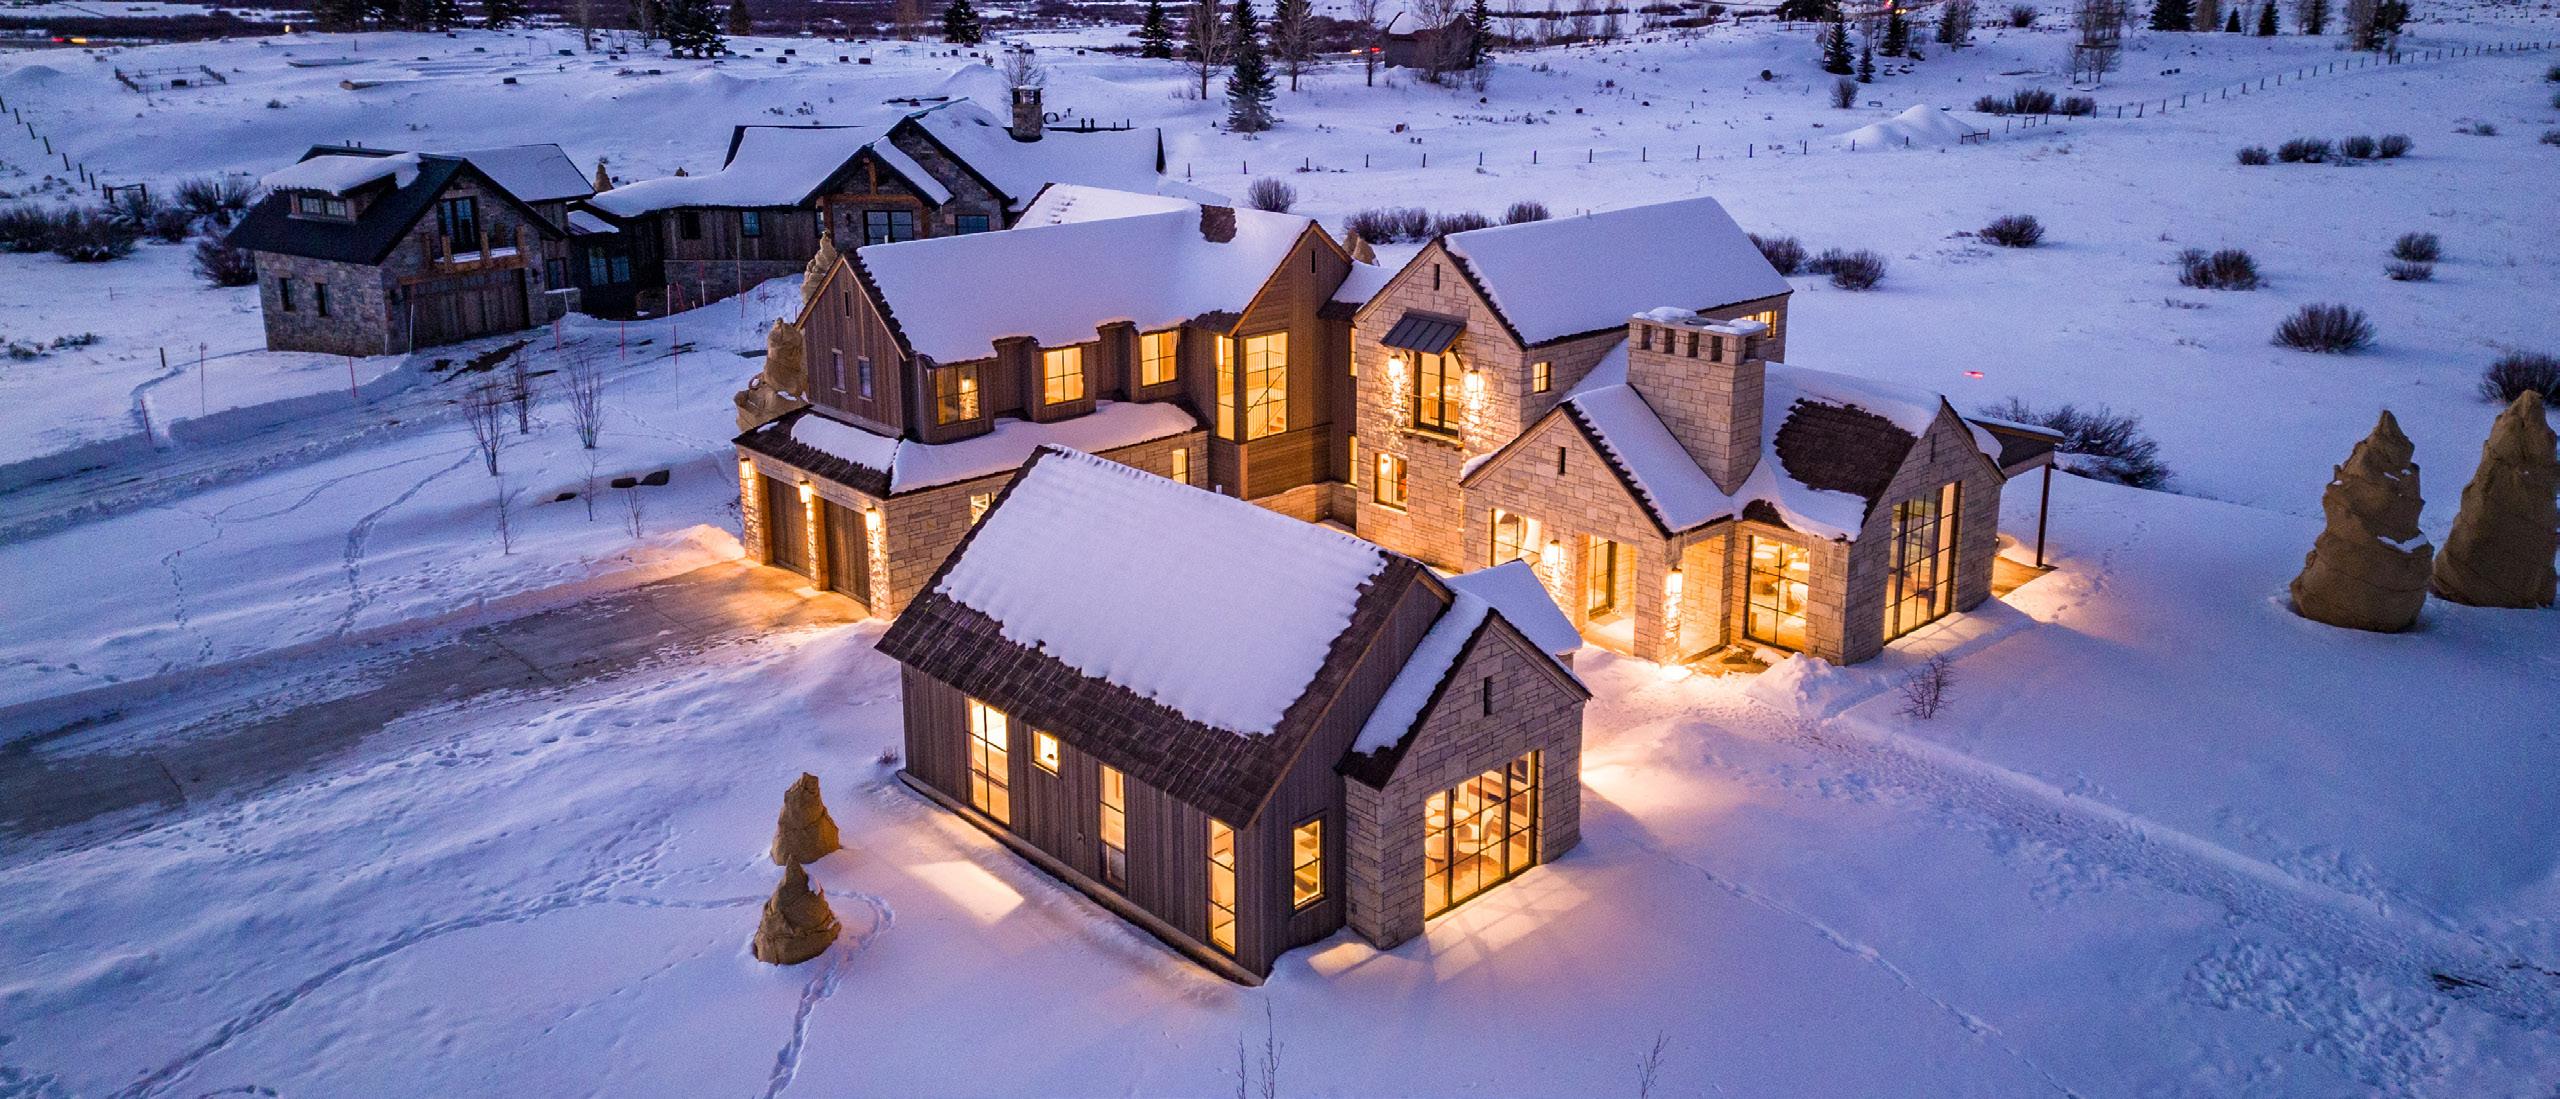
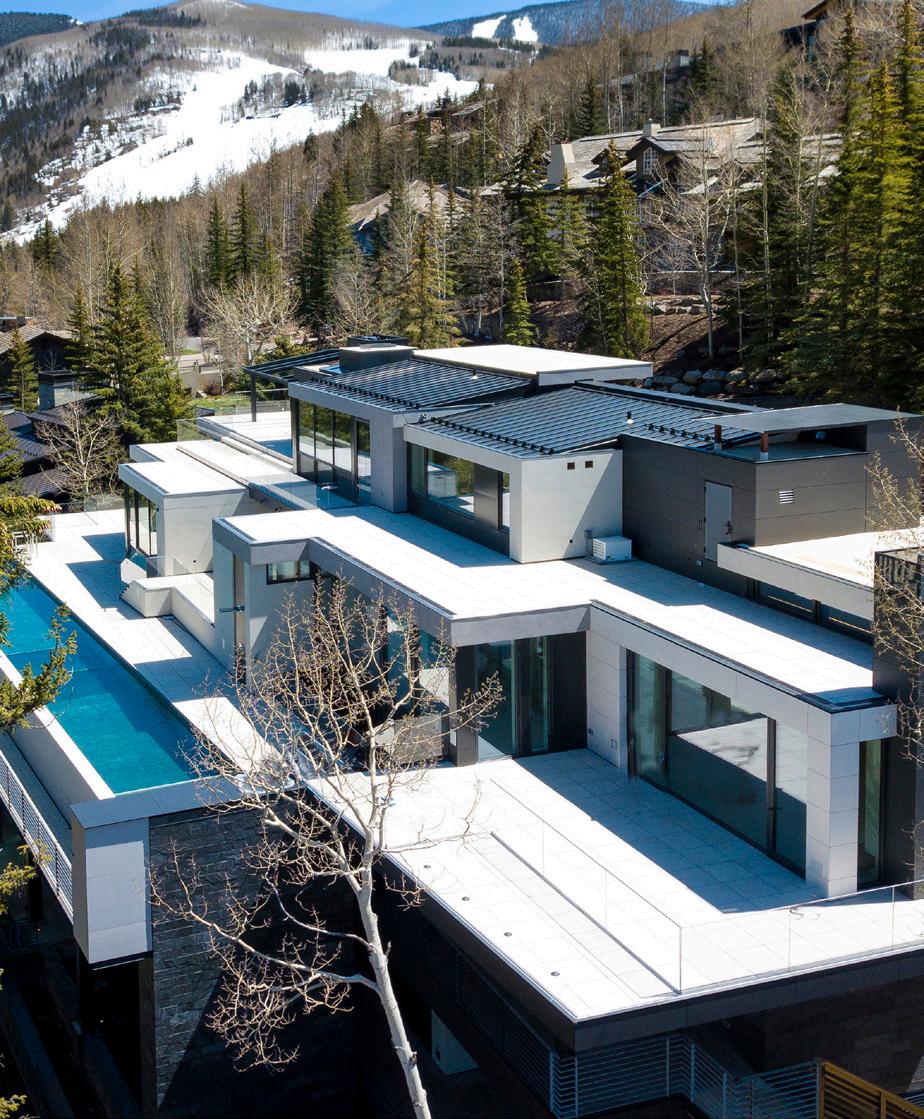
1119 Ptarmigan Road, Vail
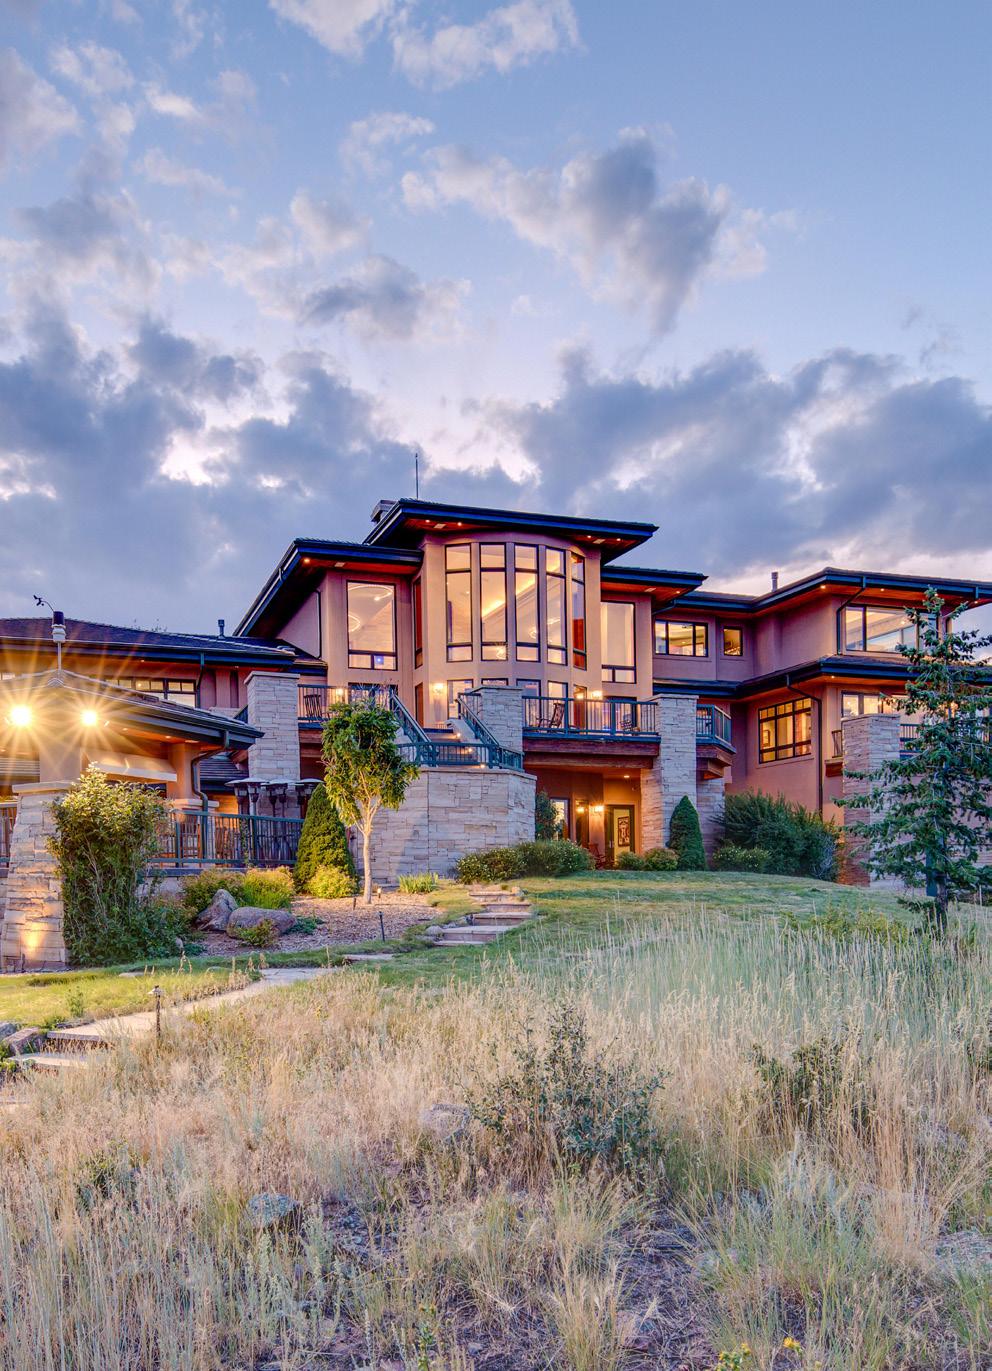
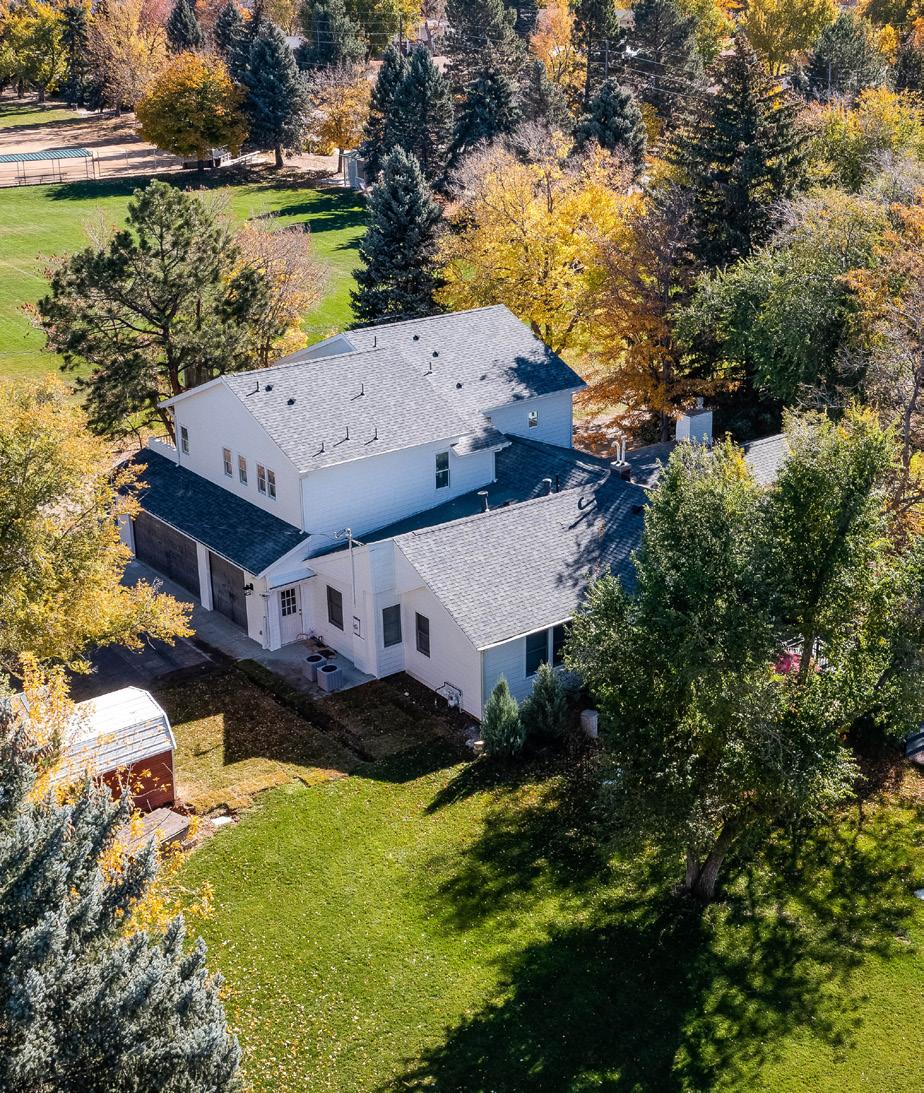
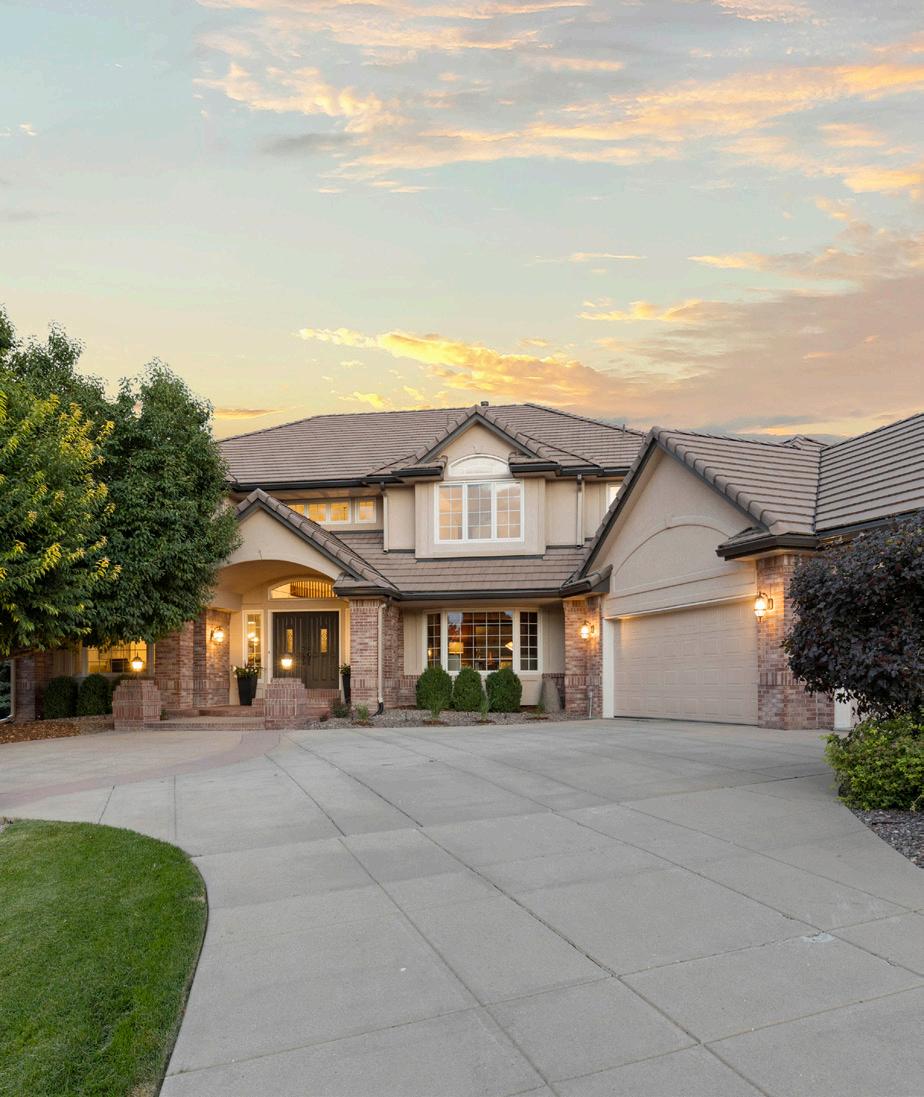
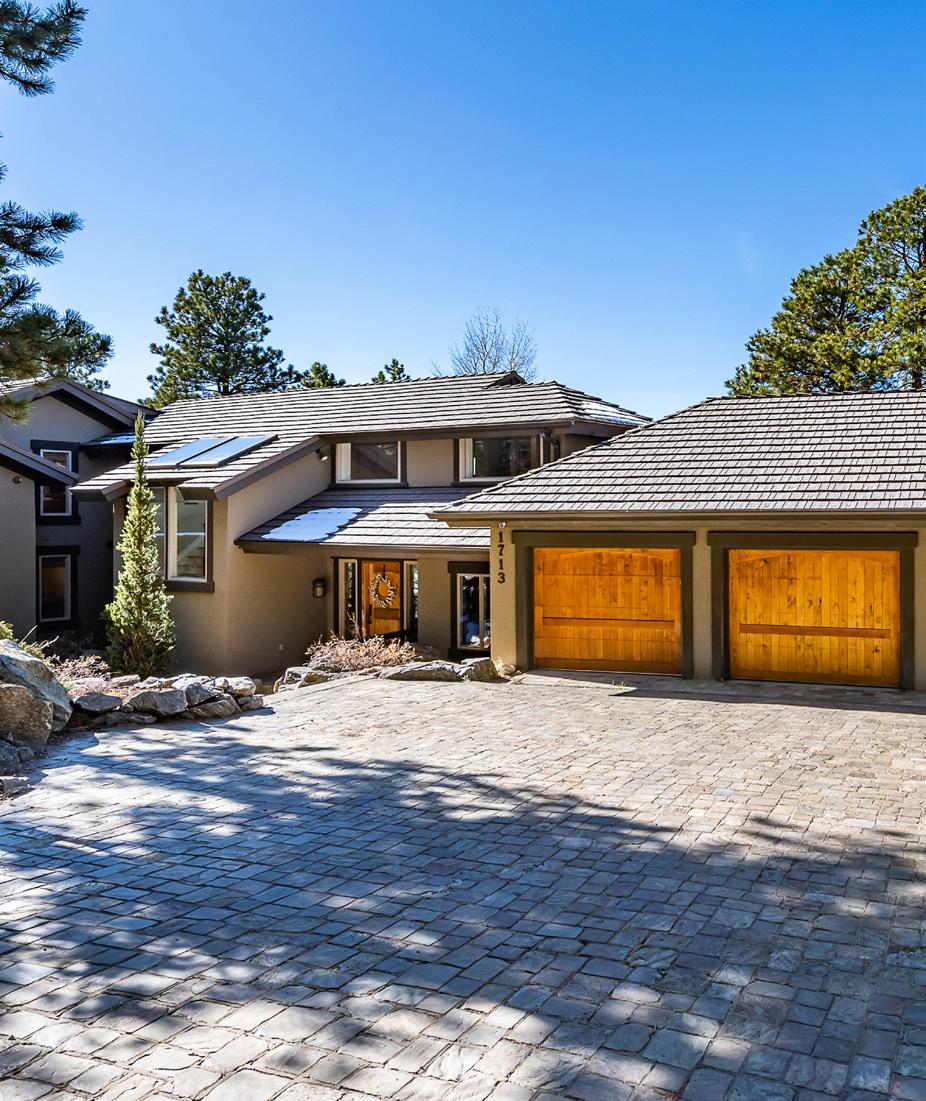
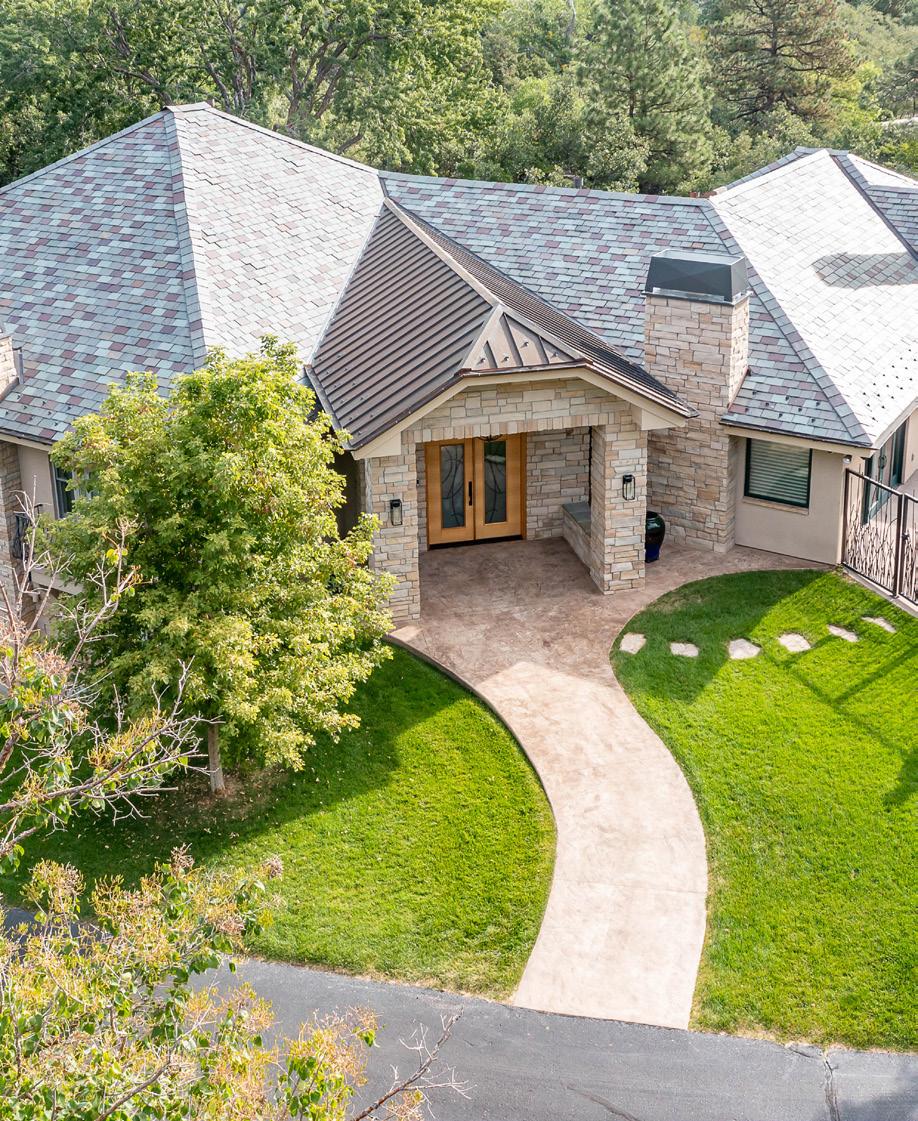
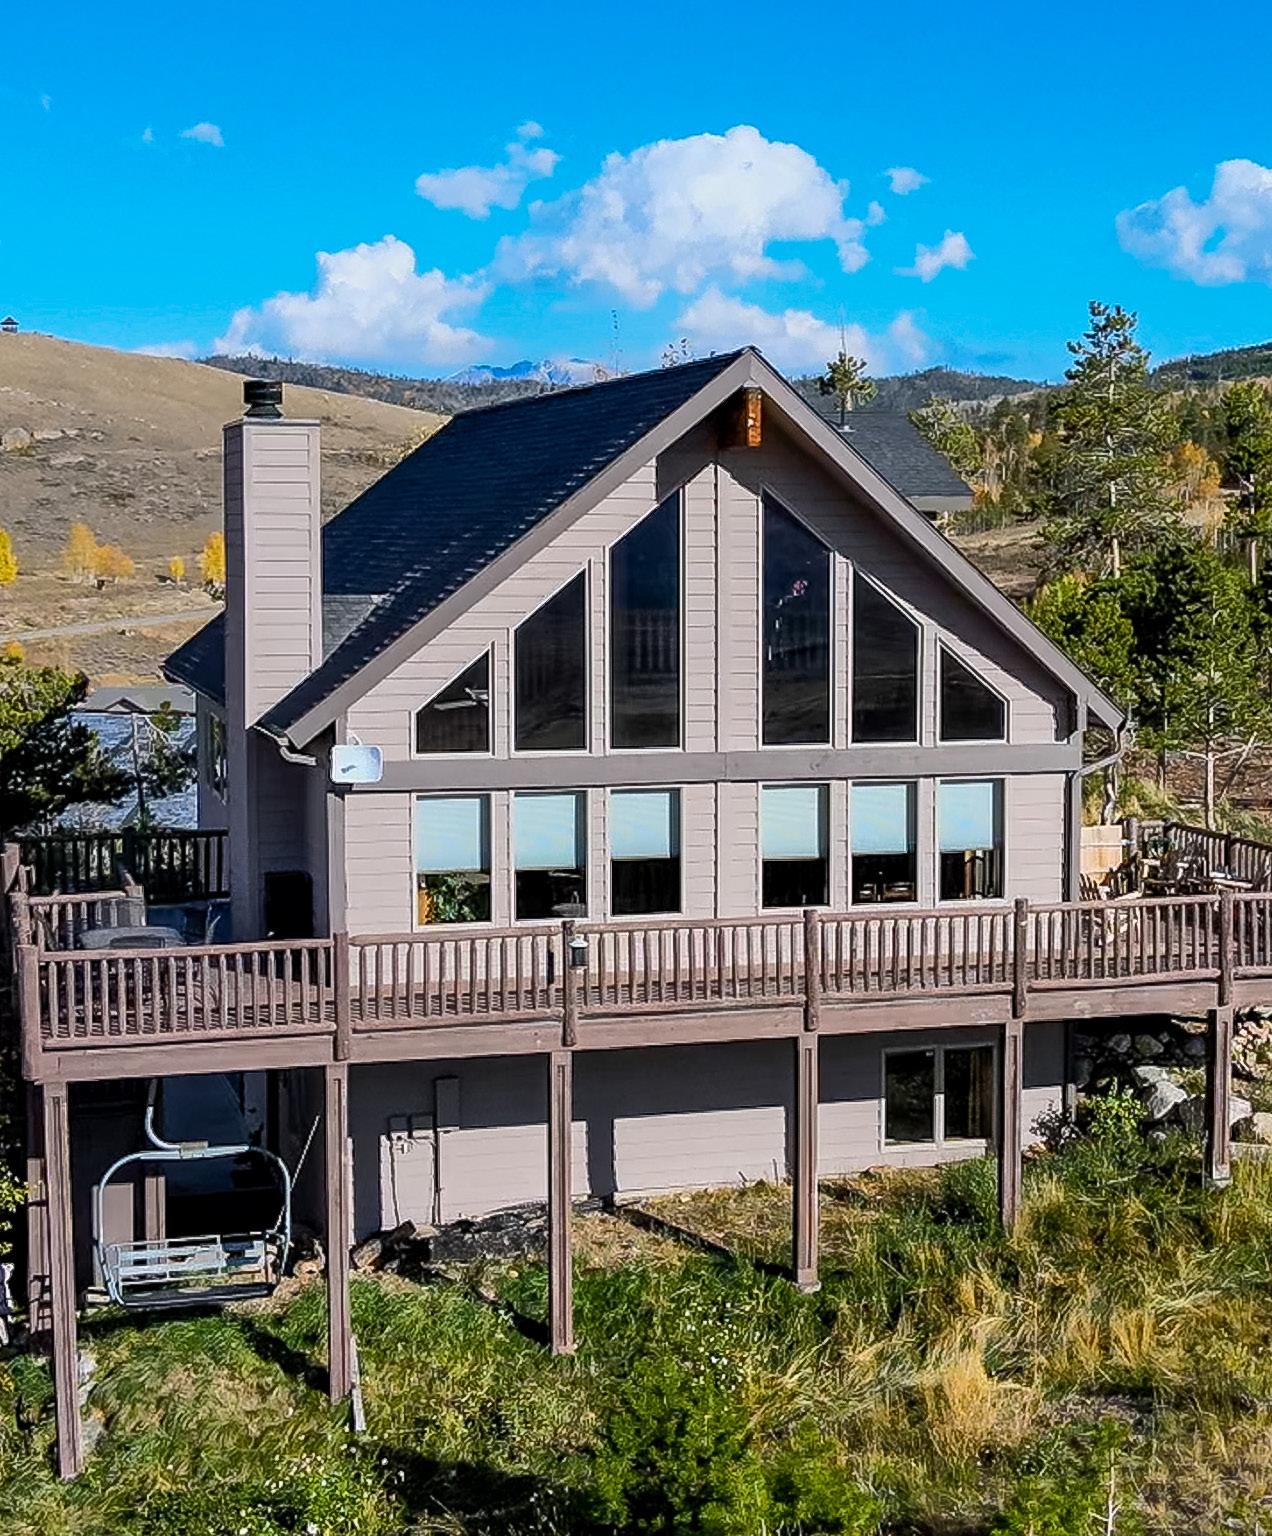
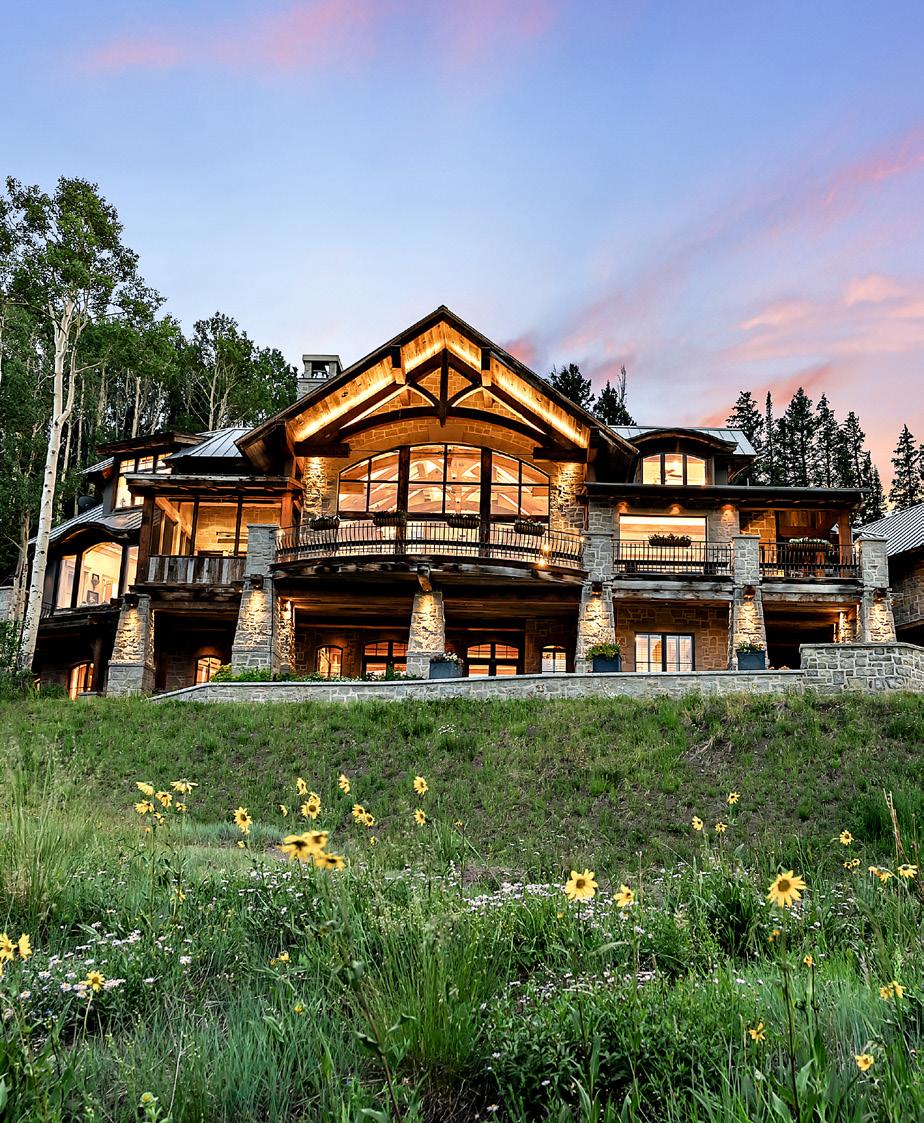
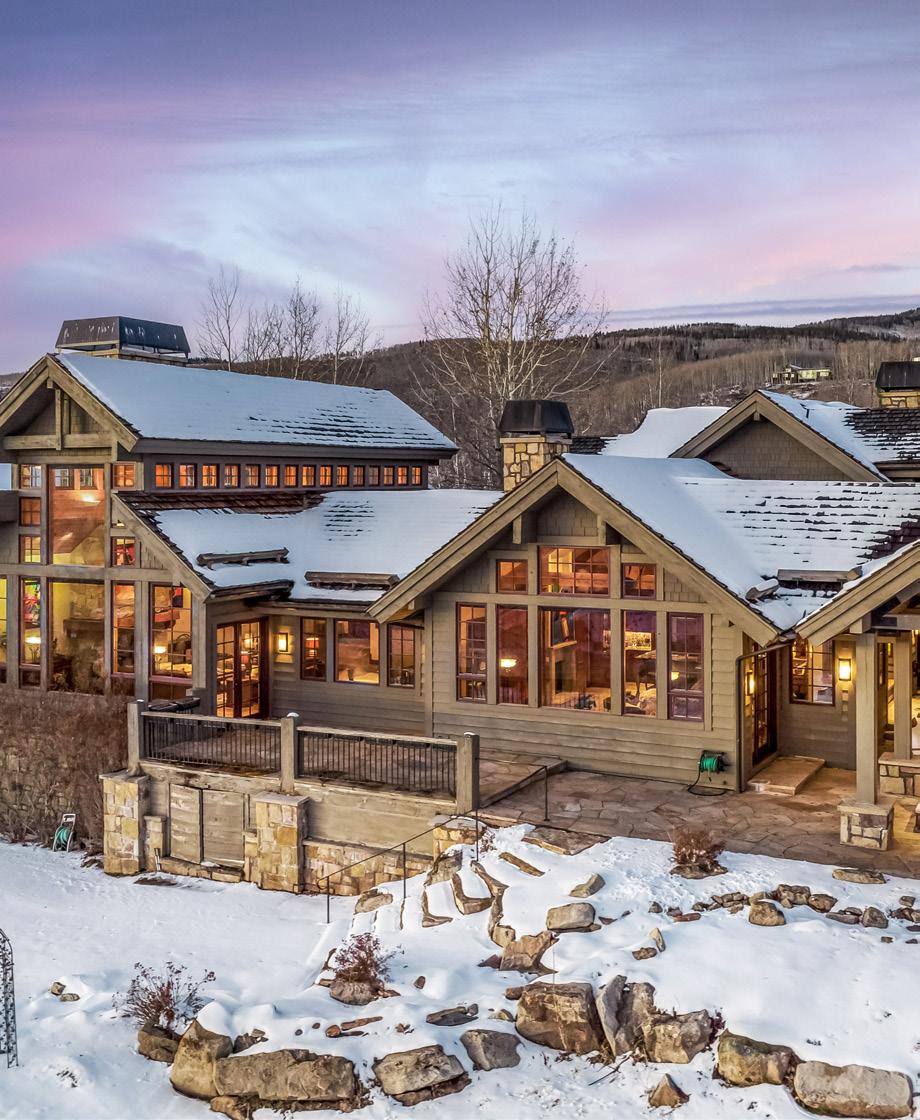
24503 Chris Drive, Evergreen
RESIDENTIAL LUXURY REPORT INTRODUCTION
Following two years of residential real estate frenzy and historically low interest rates as a result of the COVID-19 pandemic, many luxury agents are continuing to see demand for high-end properties, despite record interest rate hikes. While conventional wisdom about supply and demand and interest-rate fluctuation would suggest luxury home prices should be falling, we simply did not see that in 2022. Prices, for the most part, remained steady in 2022. There is a lifestyle change resulting from COVID-19 that we believe is here to stay: people are spending more of their time at home and putting a larger emphasis on their home lives, even as the world has opened up. The luxury real estate market in Colorado is still ripe with opportunities to create your dream life in your dream home.
LIV Sotheby’s International Realty, Colorado’s leading luxury real estate brokerage, produces a quarterly Residential Luxury Report, comparing January through December of this year to the previous year, measuring the performance of luxury real estate markets in some of Colorado’s most popular communities, the luxury market for Colorado’s diverse neighborhoods. The statistics in this report show performance for single-family homes and condos for Denver Metro ($1 million+), Colorado Springs ($1 million+), the Foothills ($1 million+), Boulder ($1 million+), the Vail Valley ($3 million+), Summit County ($2 million+), Grand County ($1 million+) Crested Butte ($2 million+), and Telluride ($3 million+).
2
DENVER METRO $1 Million + P.
BOULDER $1 Million + P.
CRESTED BUTTE $2 Million + P.
SOUTH METRO $1 Million + P.
COLORADO SPRINGS $1 Million + P. 31 VAIL VALLEY $3 Million + P.
FOOTHILLS $1 Million + P.
SUMMIT COUNTY $2 Million + P.
TELLURIDE $3 Million + P.
GRAND COUNTY $1 Million + P.
03
18
29
11
21
15
27
35
24
DENVER METRO LUXURY MARKET
Luxury homes in the Denver Metro offer an upscale Colorado living experience near the excitement of the city while positioning residents just a short drive from some of the state’s most amazing outdoor spaces. Overall, the six counties across Denver Metro have experienced a 7.7% increase in the number of luxury homes sold through December of 2022 compared to 2021, with 5,317 luxury homes sold. The average sale price of those luxury homes decreased by 0.9%, bringing the average price for luxury homes in the community to $1,587,639. The increase in number of properties sold resulted in a 6.8% rise in the total dollar volume sold, totaling $8,441,474,147.
The strength of the market was seen throughout the individual neighborhoods within Denver Metro as well. In Bow Mar/Bow Mar South, there was a 187.5% increase in the number of luxury homes sold, growing from eight homes sold in 2021 to 23 homes sold in 2022. Greenwood Village East also saw rises in luxury home sales, increasing by 11.1%.
As homebuyers compete for luxury real estate in Denver Metro, an upward trend in home prices has been observed. The Washington Park East/Central neighborhood is popular due to its access to the park and the activities and amenities that come with it, saw an 10.5% increase in sale prices for luxury homes. From January to December of this year, the average sold price for luxury homes in this neighborhood was $2,132,638. Cherry Creek North also saw home values appreciate, rising by 14.5% to reach an average sale price of $2,251,398.
Denver Metro’s limited inventory of available luxury homes has motivated buyers to purchase homes in several individual communities more quickly than last year. For example, luxury homes in the Country Club neighborhood spent an average of 24 days on the market in 2022—63.1% less time than the same time period last year.
+ $1,000,000 Sales
3
Based
is based in whole or in part on data supplied from REColorado on
5, 2022. REColorado does not guarantee nor is in any way responsible for its accuracy. Data maintained by REColorado may not reflect all real estate activity in the market.
on $1,000,000+ sales in Adams, Arapahoe, Broomfield, Denver, Douglas, and Jefferson Counties. This representation
January
January through December 2021 2022 % Change # of Properties Sold 4,936 5,317 7.7% Average Price Per Square Foot $519 $568 9.5% Average Days on Market 29 21 -27.6% Highest Price $15,725,000 $13,000,000 -17.3% Average List Price $1,551,506 $1,516,635 -2.2% Average Sale Price $1,601,870 $1,587,639 -0.9% % Sold Price to List Price 100.0% 100.0% — Total Dollar Volume $7,906,827,895 $8,441,474,147 6.8% Counties: Adams, Arapahoe, Broomfield, Denver, Douglas, Jefferson DENVER METRO
18.5%
The average price per square foot in Bonnie
increased by 18.5% in 2022 compared to that of 2021.
196.7%
The total dollar volume in Bow Mar/ Bow Mar South increased by 196.7% in 2022 compared to that of 2021.
4 DENVER ( CITY ) Boundaries: City of Denver BONNIE BRAE/BELCARO January through December 2021 2022 % Change # of Properties Sold 2,051 2,069 0.9% Average Price Per Square Foot $604 $675 11.8% Average Days on Market 29 19 -34.5% Highest Price $9,000,000 $9,000,000 — Average List Price $1,589,278 $1,622,585 2.1% Average Sale Price $1,617,294 $1,657,865 2.5% % Sold Price to List Price 101.1% 102.5% 1.4% Total Dollar Volume $3,317,070,105 $3,430,122,518 3.4% Boundaries: Mississippi to Cherry Creek Drive South; University to Colorado January through December 2021 2022 % Change # of Properties Sold 62 50 -19.4% Average Price Per Square Foot $717 $849 18.5% Average Days on Market 15 13 -13.3% Highest Price $5,000,000 $7,000,000 40.0% Average List Price $2,003,950 $2,337,394 16.6% Average Sale Price $2,053,317 $2,364,662 15.2% % Sold Price to List Price 102.7% 102.7% — Total Dollar Volume $127,305,670 $118,233,115 -7.1% Boundaries: West Quincy Avenue to West Bowles Avenue January through December 2021 2022 % Change # of Properties Sold 8 23 187.5% Average Price Per Square Foot $687 $757 10.1% Average Days on Market 19 27 42.1% Highest Price $5,400,000 $5,350,000 -0.9% Average List Price $2,323,125 $2,406,065 3.6% Average Sale Price $2,317,125 $2,391,065 3.2% % Sold Price to List Price 99.7% 97.3% -2.3% Total Dollar Volume $18,537,000 $54,994,500 196.7%
BOW MAR/BOW MAR SOUTH
Brae/Belcaro
18.9%
The average price per square foot in Cherry Creek North increased by 18.9% in 2022 compared to that of 2021.
The average number of days on market in Cherry Hills Village (over 1 acre) decreased by 66.7% in 2022 compared to that of 2021.
5 CHERRY HILLS VILLAGE CHERRY HILLS VILLAGE CHERRY CREEK NORTH Boundaries: York to Colorado; 1st Avenue to 6th Avenue January through December 2021 2022 % Change # of Properties Sold 126 116 -7.9% Average Price Per Square Foot $732 $870 18.9% Average Days on Market 40 19 -52.5% Highest Price $7,625,000 $9,000,000 18.0% Average List Price $1,944,976 $2,279,111 17.2% Average Sale Price $1,967,103 $2,251,398 14.5% % Sold Price to List Price 97.0% 99.9% 2.9% Total Dollar Volume $245,855,011 $261,162,152 6.2% (Over 1 Acre, $2M+) Boundaries: Hampden to Belleview; Clarkson to Happy Canyon Road and Charlou January through December 2021 2022 % Change # of Properties Sold 59 29 -50.8% Average Price Per Square Foot $722 $876 21.3% Average Days on Market 72 24 -66.7% Highest Price $15,725,000 $13,000,000 -17.3% Average List Price $4,397,965 $4,325,741 -1.6% Average Sale Price $4,305,805 $4,324,897 0.4% % Sold Price to List Price 98.3% 99.6% 1.3% Total Dollar Volume $254,042,485 $125,422,000 -50.6% (Under 1 Acre, $2M+) Boundaries: Hampden to Belleview; Clarkson to Happy Canyon Road and Charlou January through December 2021 2022 % Change # of Properties Sold 51 34 -33.3% Average Price Per Square Foot $624 $758 21.5% Average Days on Market 29 18 -37.9% Highest Price $5,000,000 $7,100,000 42.0% Average List Price $3,047,570 $3,239,147 6.3% Average Sale Price $3,059,763 $3,442,609 12.5% % Sold Price to List Price 99.2% 104.4% 5.2% Total Dollar Volume $156,047,890 $117,048,705 -25.0%
66.7%
14.5%
The average sale price in Columbine Valley increased by 14.5% in 2022 compared to that of 2021.
56.3%
The average number of days on market in Crestmoor decreased by 56.3% in 2022 compared to that of 2021.
6 January through December 2021 2022 % Change # of Properties Sold 24 16 -33.3% Average Price Per Square Foot $759 $817 7.7% Average Days on Market 65 24 -63.1% Highest Price $6,075,000 $5,100,000 -16.0% Average List Price $3,222,667 $2,738,125 -15.0% Average Sale Price $3,199,401 $2,654,936 -17.0% % Sold Price to List Price 97.9% 95.3% -2.7% Total Dollar Volume $76,785,633 $42,478,975 -44.7% COLUMBINE VALLEY Boundaries: South Polo Ridge Drive to West Bowles; Platte Canyon Road to South Platte River COUNTRY CLUB January through December 2021 2022 % Change # of Properties Sold 34 26 -23.5% Average Price Per Square Foot $514 $563 9.7% Average Days on Market 13 12 -7.7% Highest Price $3,500,000 $3,200,000 -8.6% Average List Price $1,799,989 $2,041,082 13.4% Average Sale Price $1,804,669 $2,065,814 14.5% % Sold Price to List Price 100.5% 99.5% -1.0% Total Dollar Volume $61,358,752 $53,711,155 -12.5% Boundaries: University to Downing 1st - 4th; Race to University 4th - 6th Boundaries: Holly to Monaco; Bayaud to 6th Avenue January through December 2021 2022 % Change # of Properties Sold 23 19 -17.4% Average Price Per Square Foot $588 $706 20.1% Average Days on Market 16 7 -56.3% Highest Price $3,500,000 $4,250,000 21.4% Average List Price $1,747,304 $2,001,556 14.6% Average Sale Price $1,837,436 $2,042,132 11.1% % Sold Price to List Price 104.5% 106.8% 2.2% Total Dollar Volume $42,261,018 $38,800,500 -8.2% CRESTMOOR
17.3%
The average price per square foot in Greenwood Village West (over 1 acre) increased by
compared to that
in
42.1%
The average number of days on market in Greenwood Village West (under 1 acre) decreased by 42.1% in 2022 compared to that of 2021.
7 GREENWOOD VILLAGE WEST GREENWOOD VILLAGE WEST GREENWOOD VILLAGE EAST Boundaries: I-25 to Havana; Belleview to Orchard January through December 2021 2022 % Change # of Properties Sold 36 40 11.1% Average Price Per Square Foot $476 $567 19.2% Average Days on Market 20 15 -25.0% Highest Price $2,310,000 $2,575,296 11.5% Average List Price $1,587,042 $1,672,470 5.4% Average Sale Price $1,602,380 $1,745,221 8.9% % Sold Price to List Price 100.3% 103.3% 3.0% Total Dollar Volume $57,685,667 $69,808,836 21.0% (Over 1 Acre) Boundaries: Orchard to Belleview; Clarkson to I-25 January through December 2021 2022 % Change # of Properties Sold 18 14 -22.2% Average Price Per Square Foot $609 $714 17.3% Average Days on Market 30 51 70.0% Highest Price $7,428,000 $5,998,000 -19.3% Average List Price $3,555,722 $3,632,714 2.2% Average Sale Price $3,413,539 $3,584,321 5.0% % Sold Price to List Price 96.9% 94.2% -2.8% Total Dollar Volume $61,443,700 $50,180,500 -18.3% (Under 1 Acre) Boundaries: Orchard to Belleview; Clarkson to I-25 January through December 2021 2022 % Change # of Properties Sold 59 54 -8.5% Average Price Per Square Foot $593 $640 7.9% Average Days on Market 19 11 -42.1% Highest Price $4,500,000 $6,725,000 49.4% Average List Price $2,335,112 $2,441,096 4.5% Average Sale Price $2,355,648 $2,472,011 4.9% % Sold Price to List Price 102.0% 102.1% 0.2% Total Dollar Volume $138,983,220 $133,488,588 -4.0%
17.3%
of 2021.
2022
43.4%
The average price per square foot in Huntington Trails/Lexington increased by 43.4% in 2022 compared to that of 2021.
57.1%
The average number of days on market in Ken Caryl North Ranch decreased by 57.1% in 2022 compared to that of 2021.
8 HILLTOP Boundaries: Alameda to 6th; Colorado to Holly HUNTINGTON TRAILS/LEXINGTON January through December 2021 2022 % Change # of Properties Sold 96 74 -22.9% Average Price Per Square Foot $601 $735 22.3% Average Days on Market 21 10 -52.4% Highest Price $4,500,000 $8,000,000 77.8% Average List Price $1,952,114 $2,285,375 17.1% Average Sale Price $1,969,865 $2,320,501 17.8% % Sold Price to List Price 100.2% 101.1% 0.9% Total Dollar Volume $189,107,035 $171,717,058 -9.2% Boundaries: Lexington Place to 144th Avenue; McKay Lake to Huron Street January through December 2021 2022 % Change # of Properties Sold 13 8 -38.5% Average Price Per Square Foot $372 $534 43.4% Average Days on Market 72 5 -93.1% Highest Price $1,807,500 $3,000,000 66.0% Average List Price $1,464,531 $1,838,500 25.5% Average Sale Price $1,454,577 $1,970,250 35.5% % Sold Price to List Price 99.4% 107.5% 8.1% Total Dollar Volume $18,909,500 $16,762,000 -11.4% Boundaries: Red
to
Ranch
Golden Eagle Road to Blue Grouse Ridge Road January through December 2021 2022 % Change # of Properties Sold 21 6 -71.4% Average Price Per Square Foot $420 $447 6.4% Average Days on Market 7 3 -57.1% Highest Price $2,225,000 $2,127,500 -4.4% Average List Price $1,550,619 $1,670,833 7.8% Average Sale Price $1,585,238 $1,772,250 11.8% % Sold Price to List Price 102.0% 107.0% 4.9% Total Dollar Volume $33,290,000 $10,633,500 -68.1%
Fox Lane
North
Road;
KEN
CARYL NORTH RANCH
23.5%
The highest sale price in Mayfair/
increased by 23.5% in 2022 compared to that of 2021.
84.9%
The average number of days on market in Polo Reserve decreased by 84.9% in 2022 compared to that of 2021.
9 POLO RESERVE OBSERVATORY PARK MAYFAIR/MONTCLAIR Boundaries: Colorado to Quebec; 6th to Colfax January through December 2021 2022 % Change # of Properties Sold 56 50 -10.7% Average Price Per Square Foot $504 $596 18.3% Average Days on Market 12 14 16.7% Highest Price $1,967,500 $2,430,000 23.5% Average List Price $1,315,389 $1,499,978 14.0% Average Sale Price $1,352,158 $1,547,994 14.5% % Sold Price to List Price 101.4% 102.6% 1.2% Total Dollar Volume $75,720,828 $77,399,680 2.2% Boundaries: University to Colorado; Evans to Yale January through December 2021 2022 % Change # of Properties Sold 79 53 -32.9% Average Price Per Square Foot $611 $702 14.8% Average Days on Market 33 24 -27.3% Highest Price $3,870,000 $5,396,000 39.4% Average List Price $2,170,166 $2,660,576 22.6% Average Sale Price $2,150,785 $2,650,201 23.2% % Sold Price to List Price 98.4% 98.3% -0.1% Total Dollar Volume $169,912,042 $137,810,440 -18.9% Boundaries: North of Mineral; South of Arabian Place; West of the S Platte River; East of S. Platte Canyon Road January through December 2021 2022 % Change # of Properties Sold 8 2 -75.0% Average Price Per Square Foot $526 $654 24.2% Average Days on Market 53 8 -84.9% Highest Price $3,925,000 $3,200,000 -18.5% Average List Price $3,072,500 $2,850,000 -7.2% Average Sale Price $2,899,375 $2,757,500 -4.9% % Sold Price to List Price 96.4% 97.4% 1.0% Total Dollar Volume $23,195,000 $5,315,000 -77.1%
Montclair
The average home sale price in Spruce Meadows increased by 52.4% in 2022 compared to that of 2021.
10 SPRUCE MEADOWS Boundaries: Federal Blvd to Zuni Street; High Prairie Way to 156th Avenue WASHINGTON PARK EAST/CENTRAL January through December 2021 2022 % Change # of Properties Sold 6 3 -50.0% Average Price Per Square Foot $559 $643 15.1% Average Days on Market 12 26 116.7% Highest Price $2,720,000 $3,925,000 44.3% Average List Price $2,047,500 $3,133,000 53.0% Average Sale Price $2,060,833 $3,141,667 52.4% % Sold Price to List Price 100.94% 97.7% -3.2% Total Dollar Volume $12,365,000 $9,425,000 -23.8% Boundaries: Louisiana to Ellsworth, Ogden to University January through December 2021 2022 % Change # of Properties Sold 146 136 -6.8% Average Price Per Square Foot $776 $886 14.2% Average Days on Market 20 19 -5.0% Highest Price $4,450,000 $5,450,000 22.5% Average List Price $1,864,699 $2,076,841 11.4% Average Sale Price $1,930,690 $2,132,638 10.5% % Sold Price to List Price 102.7% 101.7% -1.0% Total Dollar Volume $281,880,711 $290,038,724 2.9%
52.4%
SOUTH METRO LUXURY MARKET
The South Metro luxury home market offers consumers more space than can typically be found near the city with just as many entertainment, outdoor activity, and shopping options. For this reason, the collection of neighborhoods that make up South Metro has become a popular place to invest in luxury properties.
Douglas County, which makes up much of the South Metro community, saw a 9.2% increase in the number of luxury properties sold and a 1.2% increase in the average sold price in 2022 compared to last year. The combination of these increases resulted in a 10.4% increase in the total dollar volume sold within the luxury sector of the market.
Out of the eight luxury neighborhoods within the South Metro community, The Village at Castle Pines saw the most luxury home sales. Here, there were 98 homes sold.
Luxury homes within the Heritage Estates neighborhood appreciated in price the most this year. Here, luxury homes sold for an average price of $2,305,689, a 31.1% increase from January through December of last year when the average price was $1,759,000. This drastic price increase is influenced by an impressive sale that closed for $3,094,824 earlier this year.
Heritage Hills proved to be a very popular community in the eyes of consumers. Homes in this neighborhood saw a 46.9% decrease in average days on market, with most homes staying on the market for an average of just 17 days.
11
in whole or in part on data supplied from REColorado on January 5, 2023. REColorado does not guarantee nor is in any way responsible for its accuracy. Data maintained by REColorado may not reflect all real estate activity in the market.
Based
on $1,000,000+ sales in Douglas County. Based on information from REColorado. This representation is based
January through December 2021 2022 % Change # of Properties Sold 1,070 1,168 9.2% Average Price Per Square Foot $437 $477 8.9% Average Days on Market 33 26 -21.2% Highest Price $12,500,000 $8,040,000 -35.7% Average List Price $1,508,724 $1,485,442 -1.5% Average Sale Price $1,533,840 $1,551,781 1.2% % Sold Price to List Price 100.0% 100.0% — Total Dollar Volume $1,641,209,027 $1,812,479,647 10.4% Douglas County SOUTH METRO + $1,000,000 Sales
16.0%
The average sales price in Falcon Hills increased by 16.0% in 2022 compared to that of 2021.
HERITAGE ESTATES
62.7% The average number of days on market in Heritage Estates decreased by 62.7% in 2022 compared to that of 2021.
12 BACKCOUNTRY Boundaries: South of Wildcat Reserve Pkwy; East of Weathersfield Way, West of Red Sun Ct FALCON HILLS January through December 2021 2022 % Change # of Properties Sold 88 67 -23.9% Average Price Per Square Foot $447 $507 13.4% Average Days on Market 8 18 125.0% Highest Price $2,725,000 $4,400,000 61.5% Average List Price $1,480,139 $1,707,210 15.3% Average Sale Price $1,493,357 $1,710,889 14.6% % Sold Price to List Price 100.2% 97.7% -2.6% Total Dollar Volume $131,415,450 $114,629,540 -12.8% January through December 2021 2022 % Change # of Properties Sold 5 7 40.0% Average Price Per Square Foot $372 $441 18.6% Average Days on Market 23 18 -21.7% Highest Price $1,650,000 $2,605,000 57.9% Average List Price $1,366,900 $1,686,857 23.4% Average Sale Price $1,433,000 $1,662,143 16.0% % Sold Price to List Price 103.5% 93.5% -9.6% Total Dollar Volume $7,165,000 $11,635,000 62.4% January through December 2021 2022 % Change # of Properties Sold 11 7 -36.4% Average Price Per Square Foot $450 $520 15.6% Average Days on Market 67 25 -62.7% Highest Price $2,500,000 $3,094,824 23.8% Average List Price $1,742,909 $2,395,714 37.5% Average Sale Price $1,759,000 $2,305,689 31.1% % Sold Price to List Price 100.1% 96.0% -4.1% Total Dollar Volume $19,349,000 $16,139,824 -16.6%
12.8%
The total dollar volume in Keene Ranch increased by 12.8% in 2022 compared to that of 2021.
25.6%
The average price per square foot in Ravenna increased by 25.6% in 2022 compared to that of 2021.
13 RAVENNA KEENE RANCH HERITAGE HILLS January through December 2021 2022 % Change # of Properties Sold 52 34 -34.6% Average Price Per Square Foot $414 $464 12.0% Average Days on Market 32 17 -46.9% Highest Price $2,925,000 $2,500,025 -14.5% Average List Price $1,525,743 $1,584,024 3.8% Average Sale Price $1,532,709 $1,604,423 4.7% % Sold Price to List Price 99.5% 98.1% -1.4% Total Dollar Volume $79,700,889 $54,550,389 -31.6% Boundaries: South Butte Circle to Castle Butte Drive; South Peak View Drive to West Tomah Road January through December 2021 2022 % Change # of Properties Sold 18 19 5.6% Average Price Per Square Foot $466 $464 -0.4% Average Days on Market 15 28 86.7% Highest Price $3,270,000 $2,892,000 -11.6% Average List Price $1,573,461 $1,695,387 7.7% Average Sale Price $1,576,111 $1,684,401 6.9% % Sold Price to List Price 99.2% 95.4% -3.7% Total Dollar Volume $28,370,000 $32,003,624 12.8% January through December 2021 2022 % Change # of Properties Sold 17 19 11.8% Average Price Per Square Foot $749 $940 25.6% Average Days on Market 112 68 -39.3% Highest Price $4,100,000 $4,250,000 3.7% Average List Price $2,692,300 $2,738,842 1.7% Average Sale Price $2,613,835 $2,734,209 4.6% % Sold Price to List Price 96.7% 99.6% 3.0% Total Dollar Volume $44,435,200 $51,949,970 16.9%
The average number of days on market in Spirit Ridge decreased by 95.0% in 2022 compared to that of 2021.
14
THE VILLAGE
January through December 2021 2022 % Change # of Properties Sold 6 3 -50.0% Average Price Per Square Foot $388 $352 -9.3% Average Days on Market 179 9 -95.0% Highest Price $2,265,000 $1,500,000 -33.8% Average List Price $1,592,915 $1,486,666 -6.7% Average Sale Price $1,606,667 $1,470,000 -8.5% % Sold Price to List Price 95.6% 98.4% 2.9% Total Dollar Volume $9,640,000 $4,410,000 -54.3% Boundaries: US 85 & Copper Blush to Northwood; Daniels Park to Gate 5, Country Club to I-25 January through December 2021 2022 % Change # of Properties Sold 98 98 — Average Price Per Square Foot $522 $583 11.7% Average Days on Market 42 31 -26.2% Highest Price $4,295,000 $6,340,000 47.6% Average List Price $1,869,971 $1,970,910 5.4% Average Sale Price $1,869,588 $1,976,010 5.7% % Sold Price to List Price 100.1% 98.9% -1.2% Total Dollar Volume $183,219,626 $193,648,980 5.7%
SPIRIT RIDGE
AT CASTLE PINES
95.0%
FOOTHILLS LUXURY MARKET
The Foothills, a community beloved for its nearness to nature and captivating views of the Front Range, saw an influx of luxury real estate activity. As a whole, the number of luxury listings sold through December 2022, compared to the same time period in 2021, grew by an impressive 17.4%, totaling 1,109 luxury homes sold. Increased demand for high-end homes in this area decreased the average days on market from 26 days in 2021 to 23 days in 2022—an 11.5% decrease. This community has seen total dollar volume sold in the luxury sector of the market rise by 16.6% through December, thanks to consumers’ need for lifestyle-focused, luxury homes in the Foothills.
Genesee saw the most luxury properties sold through December of 2022, totaling 26 homes sold—a 25.7% decrease. This community also saw home prices increase. Through December, the average sale price for local luxury homes reached $1,672,561, which is 13.5% higher than last year.
Hangen Ranch saw one of the most notable appreciations in the average sale price for luxury homes in the Foothills. Luxury single-family homes in this community increased in average sold price by 34.9%, bringing the average sold price to $2,031,250.
Riva Chase proved to be a very popular community in the eyes of consumers. Homes in this neighborhood saw a 85.6% decrease in average days on market, with most homes staying on the market for an average of just 13 days.
15
Based on $1,000,000+ sales in Jefferson County. Based on information from REColorado. This representation is based in whole or in part on data supplied from REColorado on January 5, 2023. REColorado does not guarantee nor is in any way responsible for its accuracy. Data maintained by REColorado may not reflect all real estate activity in the market.
January through December 2021 2022 % Change # of Properties Sold 945 1,109 17.4% Average Price Per Square Foot $465 $520 12.0% Average Days on Market 26 23 -11.5% Highest Price $9,500,000 $6,400,000 -32.6% Average List Price $1,419,546 $1,398,002 -1.5% Average Sale Price $1,464,331 $1,455,481 -0.6% % Sold Price to List Price 100.0% 100.0% — Total Dollar Volume $1,383,792,331 $1,614,128,170 16.6% FOOTHILLS Jefferson County + $1,000,000 Sales
34.9%
The total dollar volume in Hangen Ranch increased by 34.9% in 2022 compared to that of 2021.
18.9%
The average price per square foot in Ridge at Hiwan increased by 18.9% in 2022 compared to that of 2021.
16 GENESEE HANGEN RANCH January through December 2021 2022 % Change # of Properties Sold 35 26 -25.7% Average Price Per Square Foot $487 $560 14.9% Average Days on Market 20 25 25.0% Highest Price $2,384,000 $2,655,000 11.4% Average List Price $1,454,600 $1,703,015 17.1% Average Sale Price $1,473,284 $1,672,561 13.5% % Sold Price to List Price 101.2% 96.5% -4.7% Total Dollar Volume $51,564,950 $43,486,580 -15.7% January through December 2021 2022 % Change # of Properties Sold 4 4 — Average Price Per Square Foot $679 $681 0.3% Average Days on Market 11 19 72.7% Highest Price $1,922,222 $2,350,000 22.3% Average List Price $1,477,500 $1,900,000 28.6% Average Sale Price $1,506,181 $2,031,250 34.9% % Sold Price to List Price 103.3% 111.4% 7.8% Total Dollar Volume $6,024,722 $8,125,000 34.9% January through December 2021 2022 % Change # of Properties Sold 25 22 -12.0% Average Price Per Square Foot $424 $504 18.9% Average Days on Market 8 16 100.0% Highest Price $2,600,000 $2,050,000 -21.2% Average List Price $1,446,488 $1,677,909 16.0% Average Sale Price $1,477,514 $1,672,329 13.2% % Sold Price to List Price 102.3% 99.0% -3.2% Total Dollar Volume $36,937,850 $36,791,241 -0.4% RIDGE AT HIWAN
85.6%
The average number of days on market in Riva Chase decreased by 85.6% in 2022 compared to that of 2021.
17 RIVA CHASE January through December 2021 2022 % Change # of Properties Sold 8 4 -50.0% Average Price Per Square Foot $441 $500 13.4% Average Days on Market 90 13 -85.6% Highest Price $1,850,000 $2,095,000 13.2% Average List Price $1,378,500 $1,513,750 9.8% Average Sale Price $1,346,324 $1,541,400 14.5% % Sold Price to List Price 96.5% 102.5% 6.2% Total Dollar Volume $10,770,591 $6,165,600 -42.8% SODA CREEK January through December 2021 2022 % Change # of Properties Sold 19 11 -42.1% Average Price Per Square Foot $466 $506 8.6% Average Days on Market 33 37 12.1% Highest Price $4,775,150 $4,598,500 -3.7% Average List Price $2,138,684 $2,570,912 20.2% Average Sale Price $2,049,829 $2,581,682 25.9% % Sold Price to List Price 95.1% 97.4% 2.4% Total Dollar Volume $38,946,750 $28,398,500 -27.1% January through December 2021 2022 % Change # of Properties Sold 5 2 -60.0% Average Price Per Square Foot $527 $642 22.0% Average Days on Market 21 111 428.6% Highest Price $2,495,000 $2,200,000 -11.8% Average List Price $2,146,980 $2,247,500 4.7% Average Sale Price $2,084,000 $2,125,000 2.0% % Sold Price to List Price 95.1% 85.4% -10.2% Total Dollar Volume $10,420,000 $4,250,000 -59.2% SPRING RANCH
BOULDER LUXURY MARKET
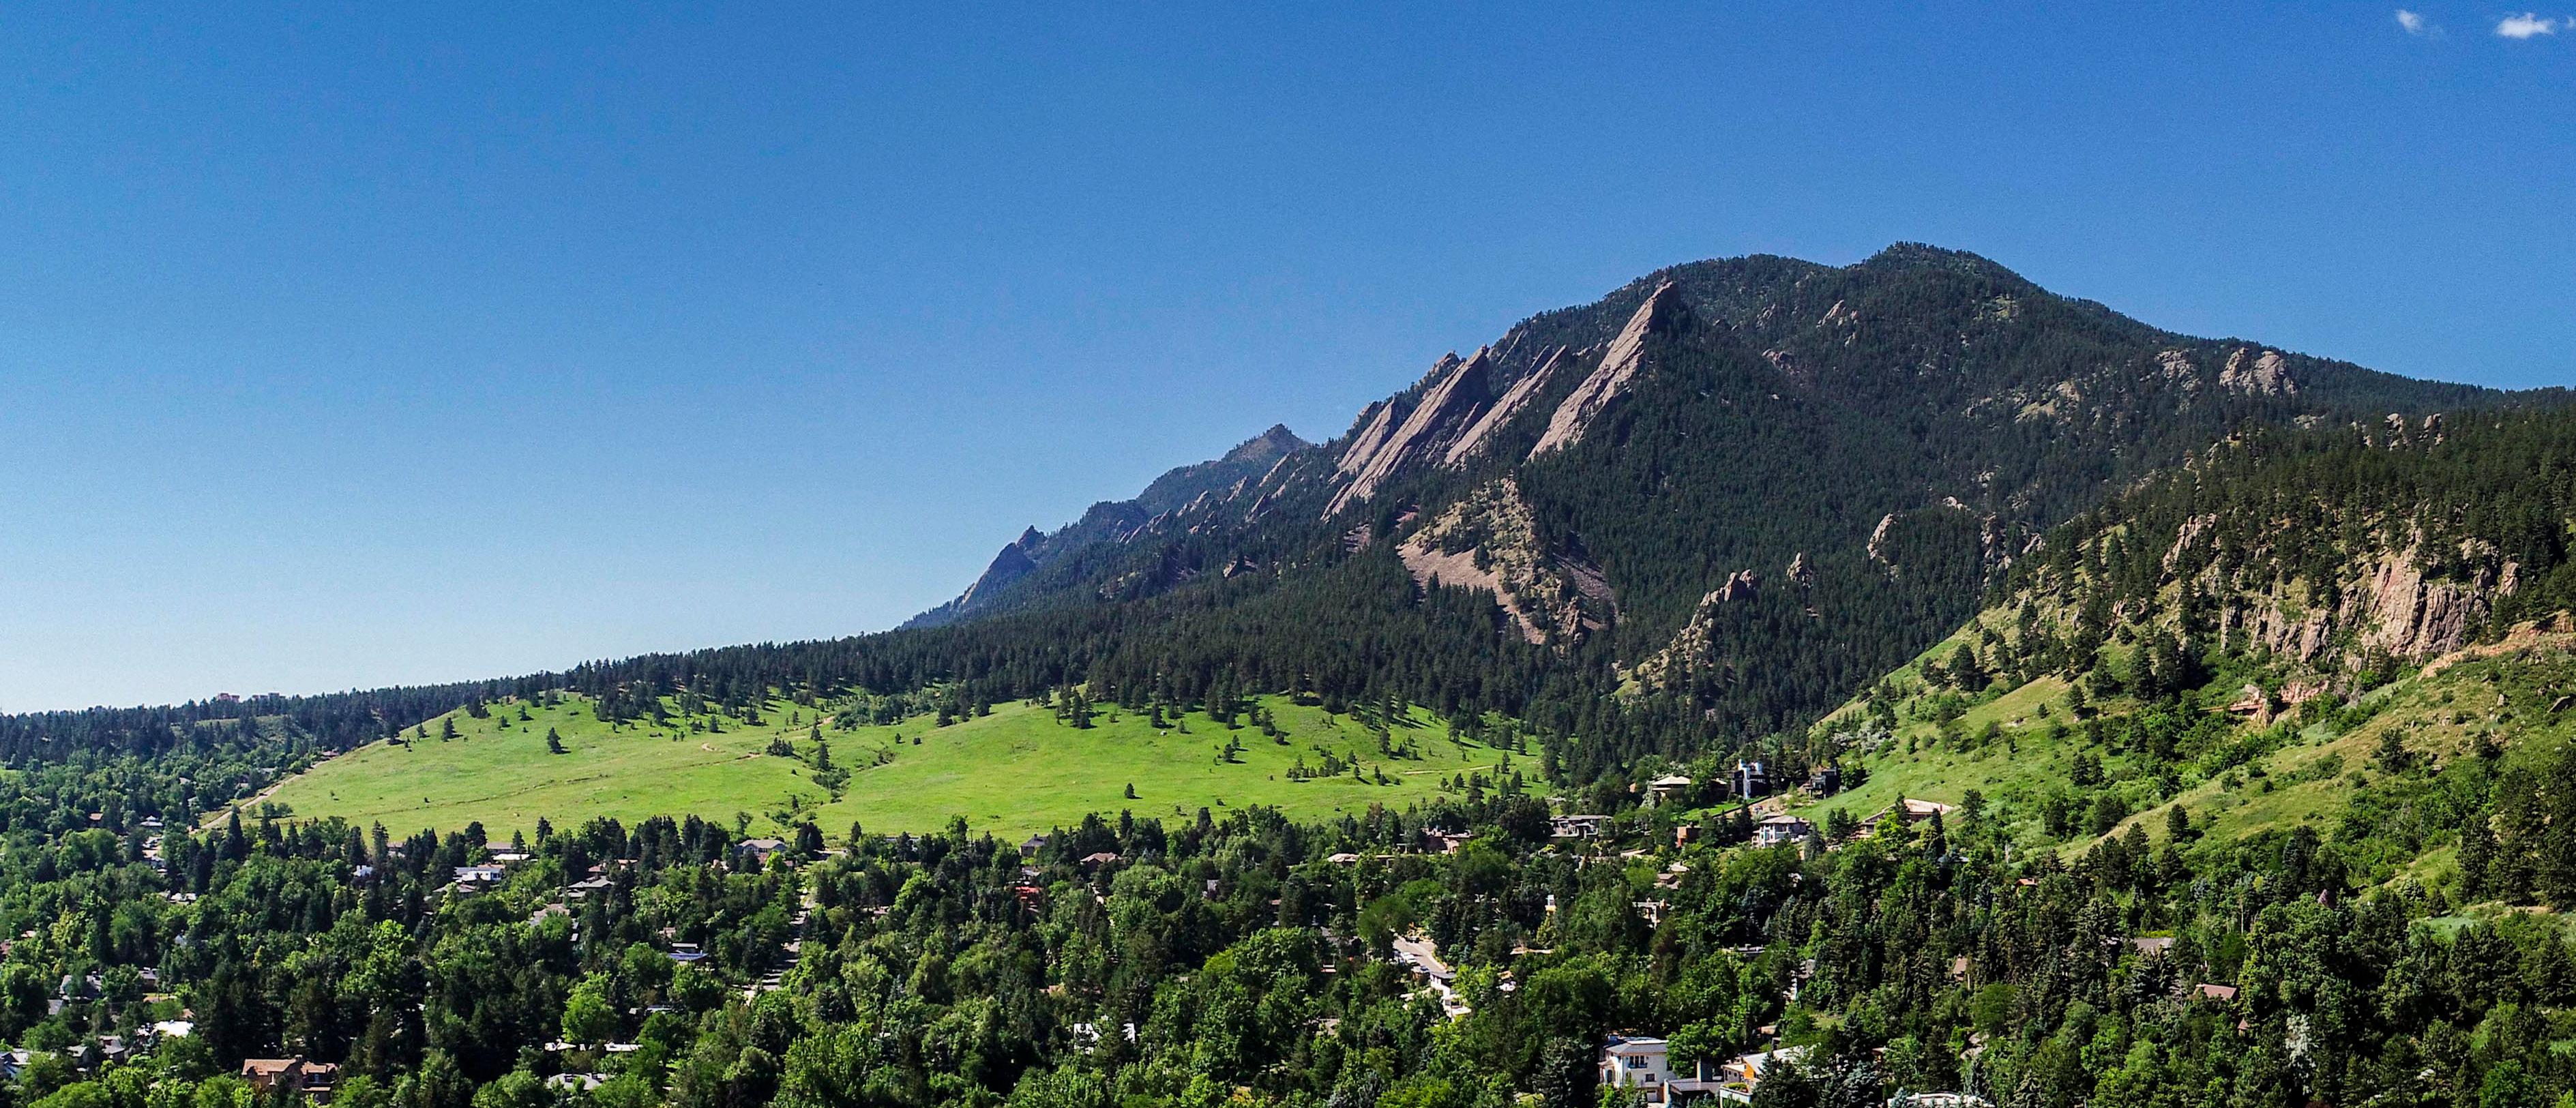
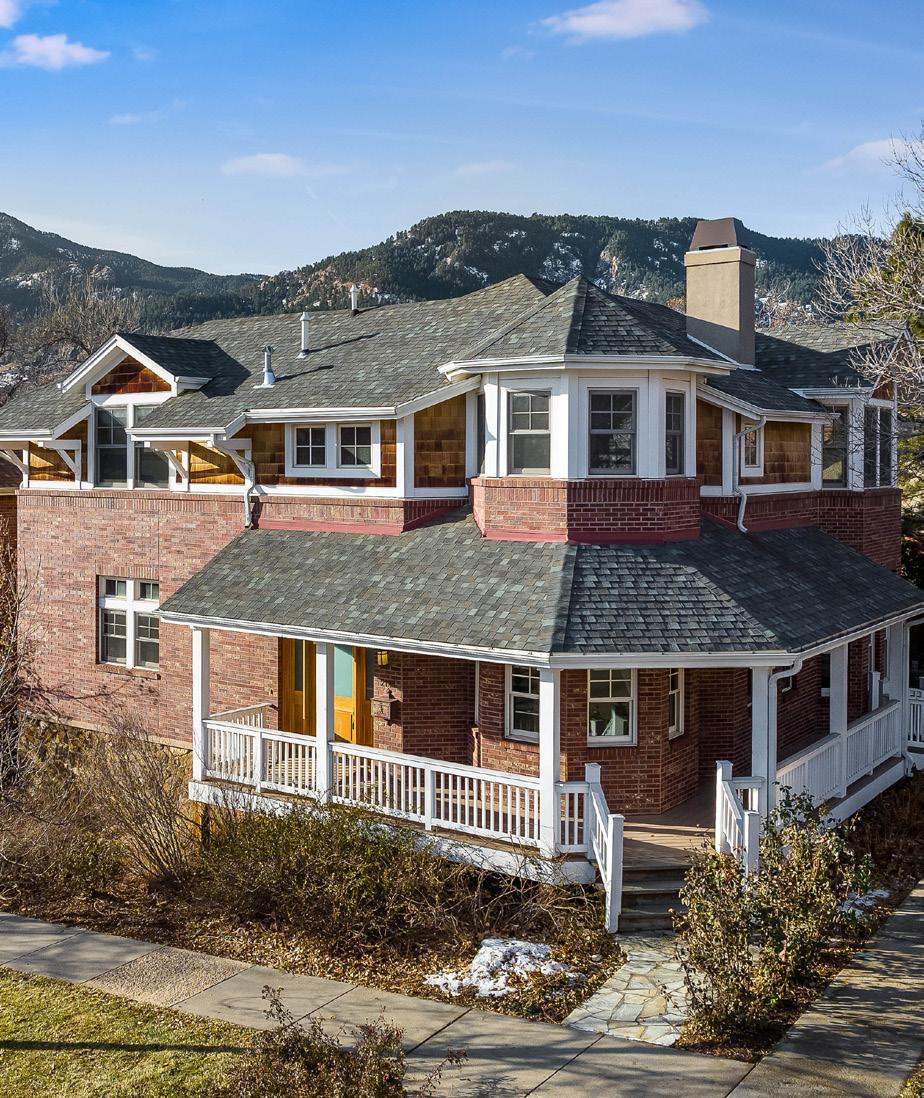
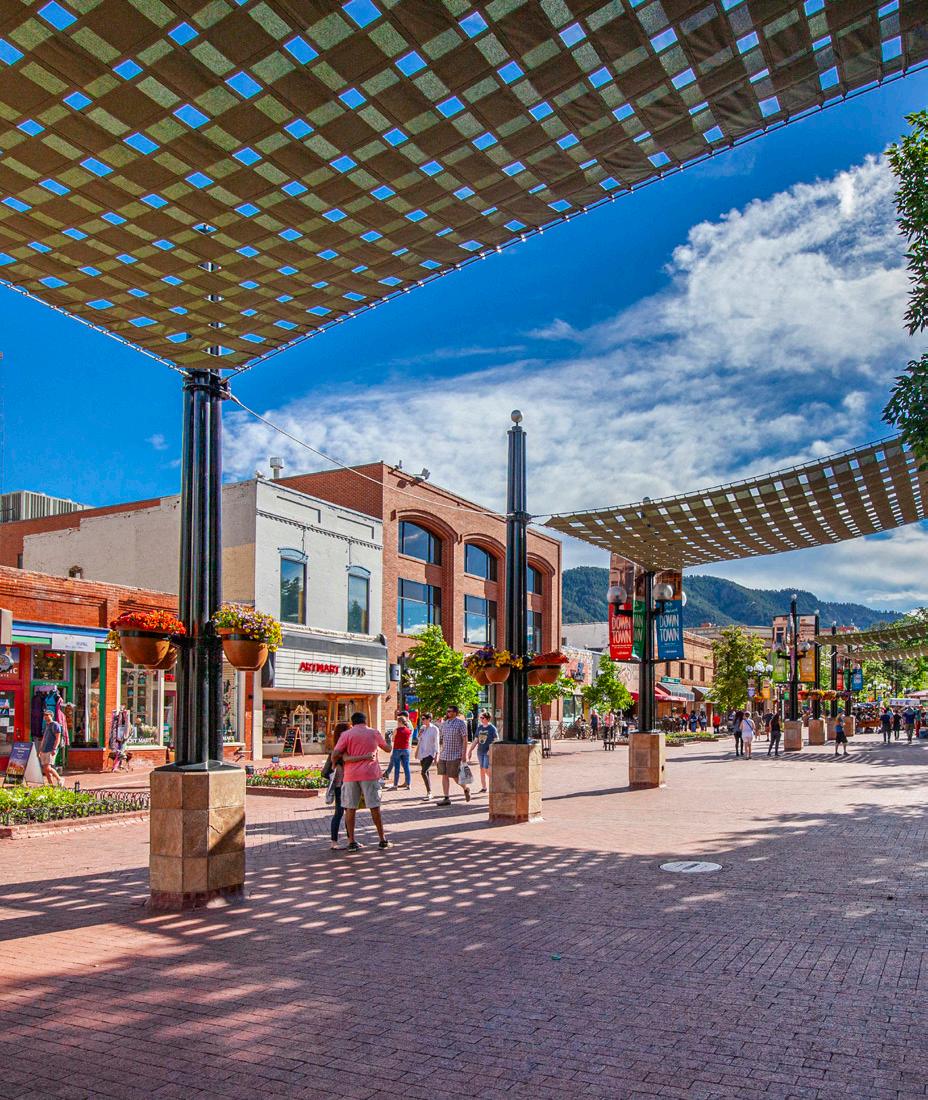
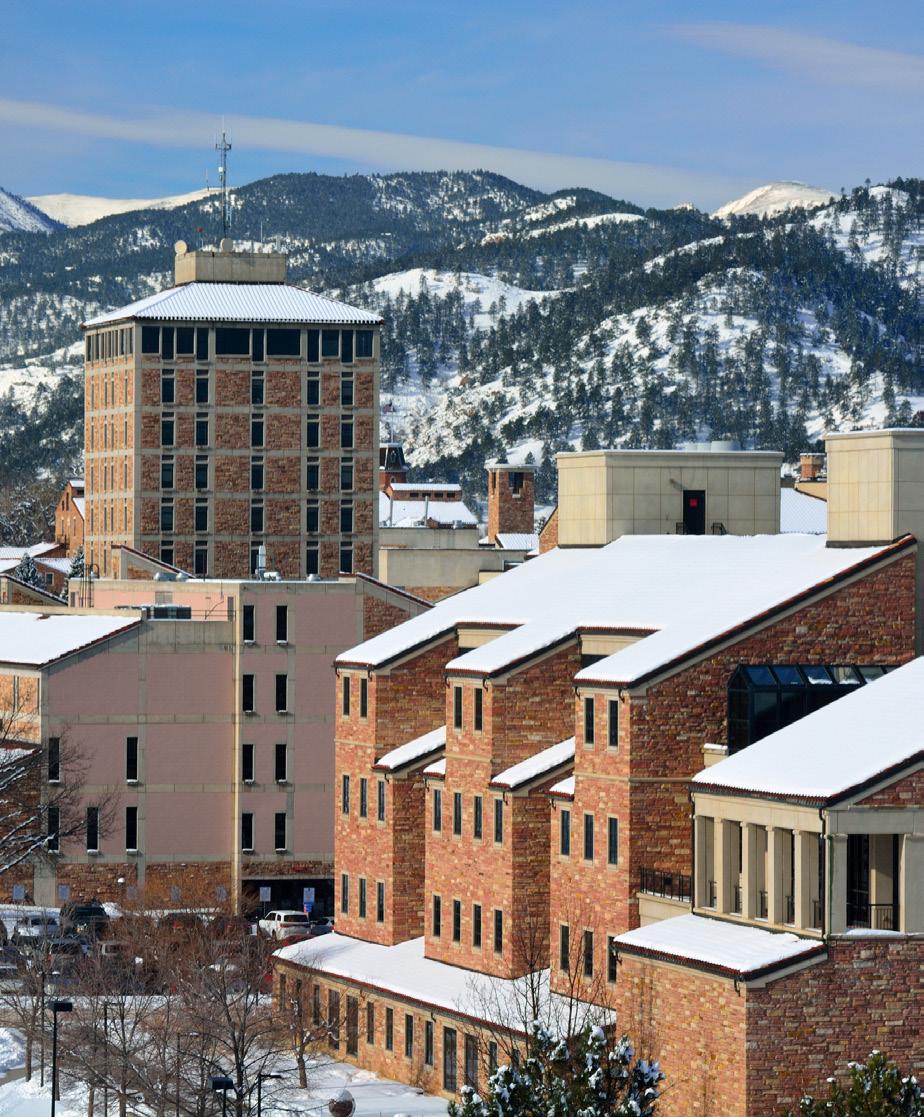
Boulder County is an eclectic community filled with plenty of natural spaces, a lively restaurant and entertainment scene, and one of the most desirable lifestyles in the country. Recently ranked as the No. 1 city in the nation to live in by U.S. News & World Report, Boulder is a popular destination for buying and selling luxury real estate.
Overall, Boulder County has seen a 13.0% increase in the number of luxury properties sold in 2022 compared to 2021. The average sale price for luxury homes in this area decreased slightly by 2.5%, bringing the average price for local luxury properties to $1,753,231. The increase in the number of properties sold boosted the total dollar volume sold by 10.2%, which brings the total to $2,309,005,093.
Looking at individual neighborhoods, Downtown Boulder had the most impressive increase in luxury listings sold. In 2022, there were 33 luxury homes sold, which is 22.2% more than during 2021. This community also saw the most appreciation 2022, with average sale prices for luxury homes rising by 44.1% to reach an average price of $2,465,328.
The speed of the luxury real estate market in Boulder County decreased over the course of the last 12 months. University Hill and Chautauqua had the quickest pace of sale out of the local luxury markets with homes in the area remaining on the market for an average of just 52 days. Other neighborhoods saw slightly longer average days on market for luxury homes, such as Boulder County Plains where homes spent 62 days on the market.
18
January 5, 2023.
Based on $1,000,000+ sales in Boulder County. Based on information from IRES, LLC. This representation is based in whole or in part on data supplied by IRES, LLC on
IRES, LLC does not guarantee nor is in any way responsible for its accuracy. Data maintained by IRES,LLC may not reflect all real estate activity in the market.
+ $1,000,000 Sales January through December 2021 2022 % Change # of Properties Sold 1,166 1,317 13.0% Average Days on Market 66 59 -10.6% Highest Price $8,150,000 $10,000,000 23% Average Sale Price $1,797,761 $1,753,231 -2.5% % Sold Price to List Price 100.3% 101.1% 0.8% Total Dollar Volume $2,096,189,362 $2,309,005,093 10.2% BOULDER Boulder County
22.7%
The highest sale price in Boulder County Plains increased by 22.7% January through December 2022 compared to that of 2021.
19 DOWNTOWN BOULDER BOULDER COUNTY PLAINS BOULDER (CITY) January through December 2021 2022 % Change # of Properties Sold 830 817 -1.6% Average Days on Market 65 65 — Highest Price $7,900,000 $10,000,000 26.6% Average Sale Price $1,878,316 $1,909,672 1.7% % Sold Price to List Price 100.2% 100.9% 0.7% Total Dollar Volume $1,559,001,905 $1,560,201,779 0.1% Niwot, Somerset Meadows, White Hawk Ranch, Fairview Estates, Paragon Estates, Spanish Hills
January through December 2021 2022 % Change # of Properties Sold 260 271 4.2% Average Days on Market 71 62 -12.7% Highest Price $8,150,000 $10,000,000 22.7% Average Sale Price $1,803,883 $1,775,624 -1.6% % Sold Price to List Price 99.9% 100.5% 0.6% Total Dollar Volume $469,009,666 $481,194,177 2.6% January through December 2021 2022 % Change # of Properties Sold 27 33 22.2% Average Days on Market 90 239 165.6% Highest Price $4,000,000 $4,100,000 2.5% Average Sale Price $1,710,907 $2,465,328 44.1% % Sold Price to List Price 96.4% 99.5% 3.2% Total Dollar Volume $46,194,500 $81,355,813 76.1%
The highest sale price in the Foothills Communities increased by 26.6% in 2022 compared to that of 2021.
20 FOOTHILLS COMMUNITIES Pinebrook Hills, Boulder Heights, Lake of the Pines, Jamestown, Eldorado Springs UNIVERSITY HILL & CHAUTAUQUA January through December 2021 2022 % Change # of Properties Sold 750 715 -4.7% Average Days on Market 67 68 1.5% Highest Price $7,900,000 $10,000,000 26.6% Average Sale Price $1,907,757 $1,915,706 0.4% % Sold Price to List Price 99.9% 100.5% 0.6% Total Dollar Volume $1,430,818,036 $1,369,729,858 -4.3% January through December 2021 2022 % Change # of Properties Sold 94 72 -23.4% Average Days on Market 68 52 -23.5% Highest Price $4,400,000 $6,875,000 56.3% Average Sale Price $1,954,290 $2,450,571 25.4% % Sold Price to List Price 99.1% 98.4% -0.7% Total Dollar Volume $183,703,246 $176,441,090 -4.0%
26.6%
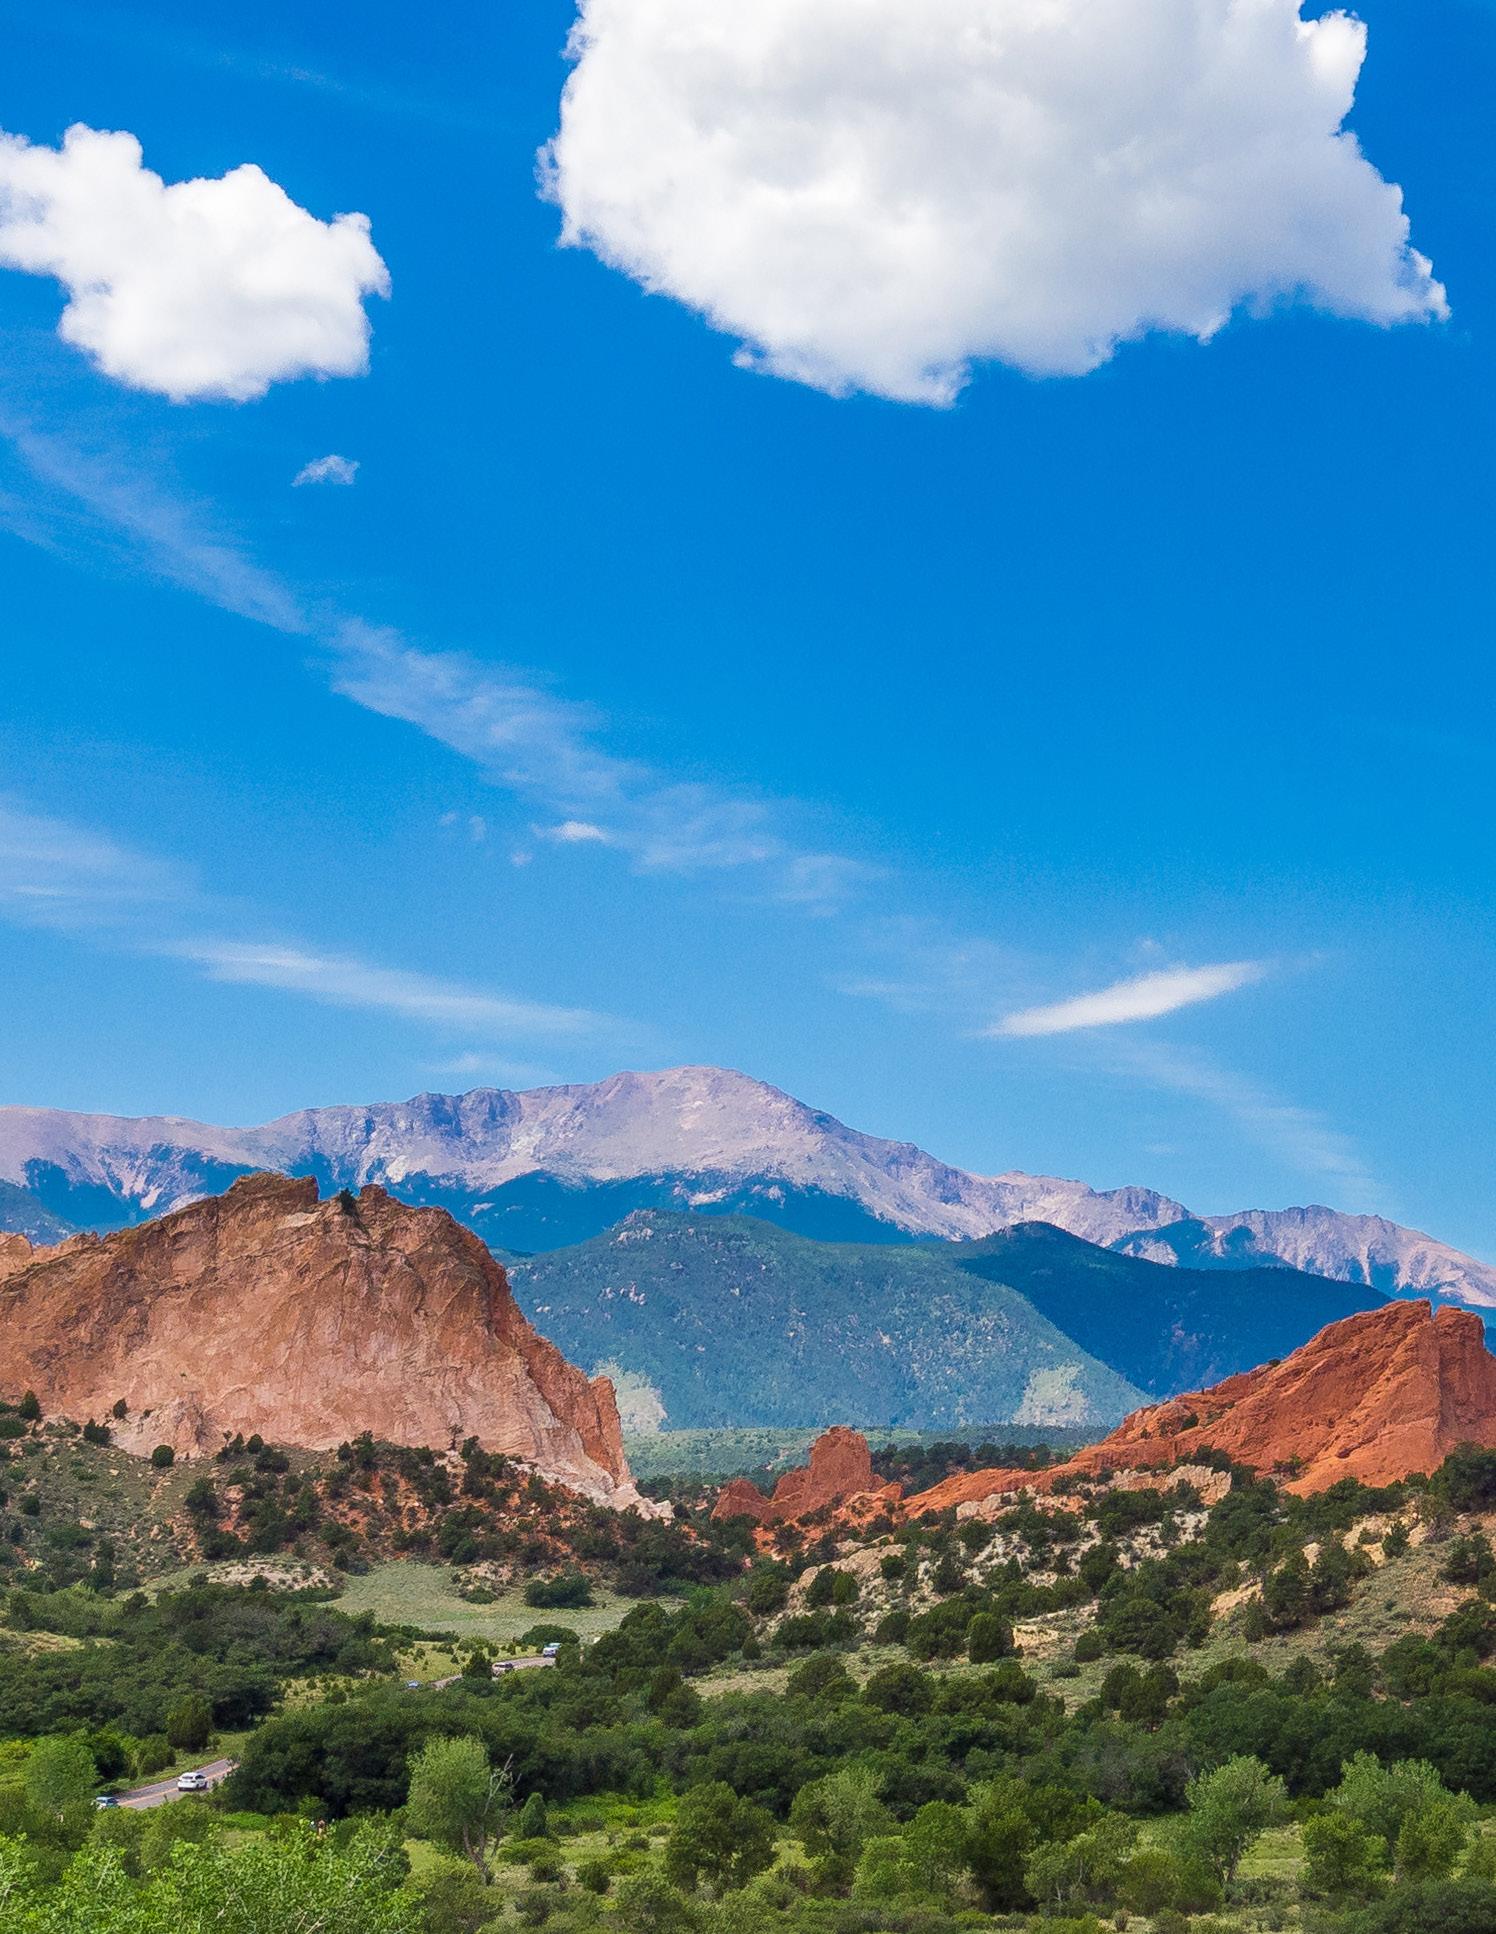
COLORADO SPRINGS LUXURY MARKET
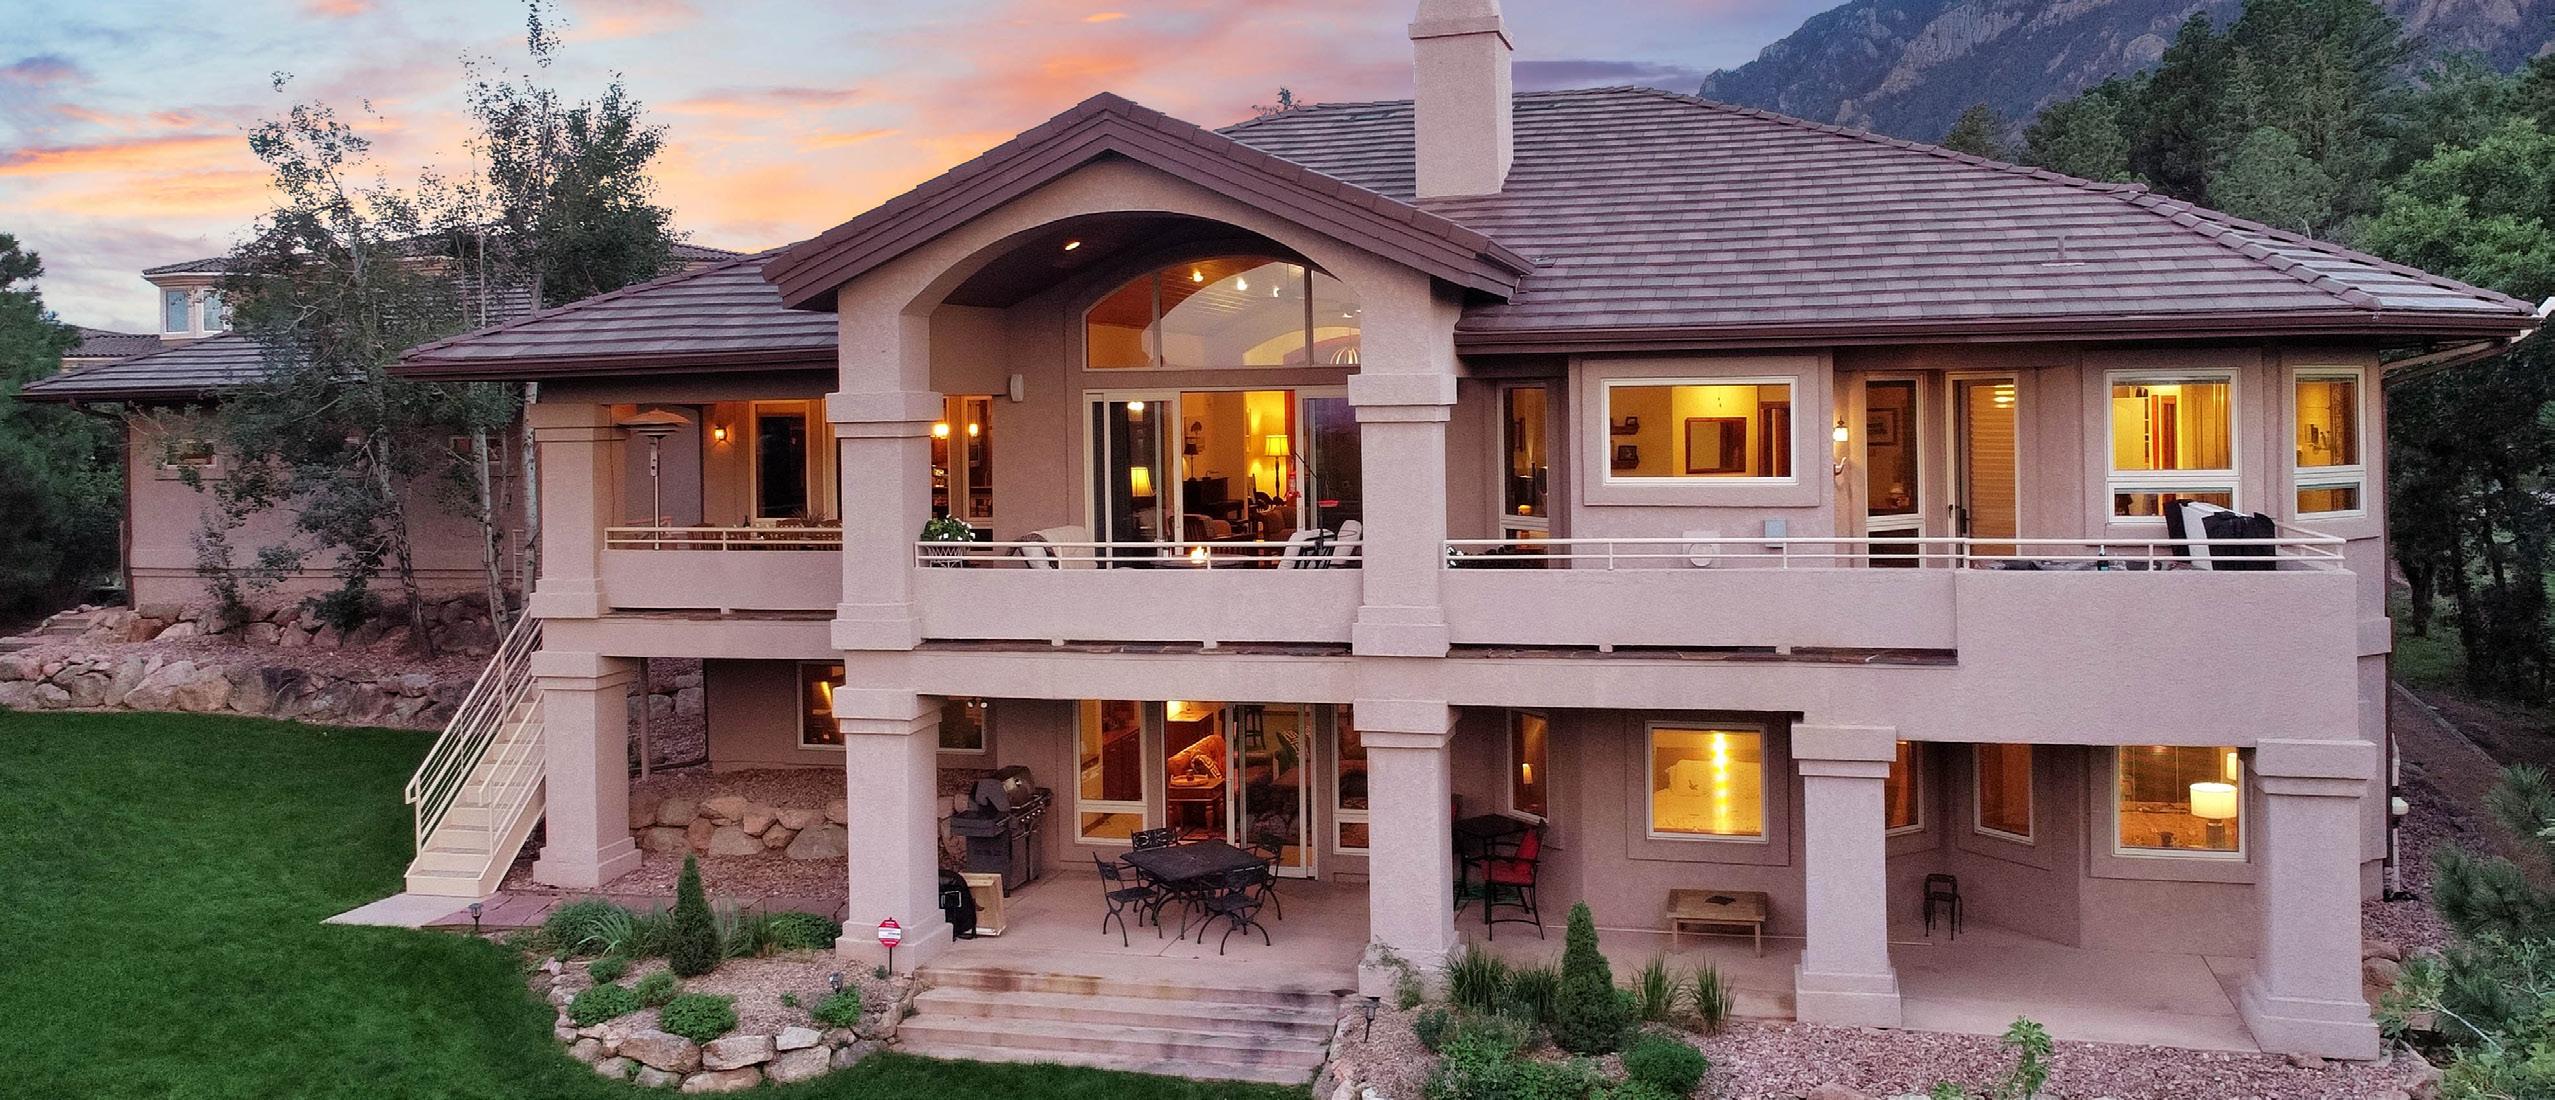
Located just an hour south of Denver, Colorado Springs is a city that combined the very best of natural beauty and an exciting urban lifestyle. LIV Sotheby’s International Realty reports that there was a 21.9% increase in the number of luxury homes sold within El Paso and Teller County in 2022 compared to 2021. There were 523 high-end homes sold in these counties. The average sale price of those homes decreased by 3.6% which brought the average sale price to $1,379,473 for the area.
Looking at the quantity of luxury real estate sales within the various communities that make up Colorado Springs, the most dramatic increase was seen in Kissing Camels where luxury home sales rose from 19 sales through 2021 to 27 sales this year—a 42.1% increase. The Black Forest neighborhood had the second-highest number of luxury home sales with a total of 115 homes sold for more than $1,000,000.
In some areas, the average sale price for luxury homes rose as well. High-end homes in the Monument community sold for a 5.8% higher price during January through December of 2022 compared to 2021. Homes here sold for an average price of $1,350,402.
While the average days on market for both El Paso and Teller County was 41 days on market in 2022, some individual neighborhoods experienced even faster market speeds. For example, luxury homes in Monument remained on the market for an average of just 30 days through December–18.9% decrease.
21
Based on information from the Pikes Peak REALTOR® Services Corp. (“RSC”), for the period January 1, 2022 through January 5, 2023. RSC does not guarantee or is in any way responsible for its accuracy. Data maintained by RSC may not reflect all real estate activity in the market.
+ $1,000,000 Sales January through December 2021 2022 % Change Properties Sold 429 523 21.9% Average Price Per Square Foot $266 $282 6.0% Average Days on Market 49 41 -16.3% Highest Price $8,000,000 $7,000,000 -12.5% Average List Price $1,477,820 $1,459,927 -1.2% Average Sales Price $1,431,399 $1,379,473 -3.6% % Sold Price to List Price 99.0% 99.7% 0.7% Total Dollar Volume $614,070,171 $721,464,379 17.5%
El Paso County & Teller County
COLORADO SPRINGS
30.9%
The total dollar volume in Black Forest increased by 30.9% in 2022 compared to that of 2021.
38.2%
The number of properties sold in Flying Horse increased by 38.2% in 2022 compared to that of 2021.
22 BLACK FOREST BROADMOOR January through December 2021 2022 % Change Properties Sold 34 47 38.2% Average Price Per Square Foot $267 $255 -4.5% Average Days on Market 26 38 46.2% Highest Price $3,800,000 $3,500,000 -7.9% Average List Price $1,383,743 $1,320,690 -4.6% Average Sales Price $1,385,343 $1,271,695 -8.2% % Sold Price to List Price 100.0% 99.6% -0.4% Total Dollar Volume $47,101,662 $59,769,665 26.9% January through December 2021 2022 % Change Properties Sold 101 87 -13.9% Average Price Per Square Foot $274 $265 -3.3% Average Days on Market 53 54 1.9% Highest Price $8,000,000 $7,000,000 -12.5% Average List Price $1,760,753 $1,718,544 -2.4% Average Sales Price $1,676,267 $1,553,500 -7.3% % Sold Price to List Price 98.5% 97.2% -1.3% Total Dollar Volume $169,302,967 $135,154,500 -20.2% January through December 2021 2022 % Change Properties Sold 87 115 32.2% Average Price Per Square Foot $273 $283 3.7% Average Days on Market 40 54 35.0% Highest Price $2,850,000 $3,200,000 12.3% Average List Price $1,454,379 $1,527,951 5.1% Average Sales Price $1,419,935 $1,405,859 -1.0% % Sold Price to List Price 99.4% 99.4% — Total Dollar Volume $123,534,345 $161,673,785 30.9%
FLYING HORSE
47.0%
The total dollar volume in Monument increased by 47.0% in the first half of 2022 compared to that of 2021.
23 January through December 2021 2022 % Change Properties Sold 126 175 38.9% Average Price Per Square Foot $242 $271 12.0% Average Days on Market 37 30 -18.9% Highest Price $2,500,000 $7,000,000 180.0% Average List Price $1,291,981 $1,403,568 8.6% Average Sales Price $1,275,988 $1,350,402 5.8% % Sold Price to List Price 100.0% 100.6% 0.6% Total Dollar Volume $160,774,488 $236,320,350 47.0% MONUMENT KISSING CAMELS
January through December 2021 2022 % Change Properties Sold 19 27 42.1% Average Price Per Square Foot $331 $331 — Average Days on Market 52 52 — Highest Price $3,800,000 $3,800,000 — Average List Price $1,547,632 1437250 -3.7% Average Sales Price $1,510,366 $1,491,084 -1.3% % Sold Price to List Price 100.2% 100.2% — Total Dollar Volume $28,696,954 $40,259,268 40.3%
GRAND COUNTY LUXURY MARKET
With access to year-round outdoor recreation and home to Colorado’s deepest natural lake, Grand County offers mountain wilderness and a quick commute to the Front Range. The luxury real estate market in the communities of Grand County was strong in 2022, with a 31.2% increase in the number of properties sold compared to 2021. The average price per square foot increased just over 17% from $521 to $610, making this area the most affordable in Colorado’s resort markets. Total sales volume for the county rose 30.6% from $294,954,724 in 2021 to $385,112,285 in 2022, as the appeal for these communities continues to grow.
Winter Park noted a 23.8% increase in the price per square foot at $639 compared to $516 in 2021. The ski town also saw a 31% increase in the highest sale, with the top property ringing in at $3,800,000 in 2022. Fraser had a 13.4% jump in price per square foot, from $545 in 2021 to $618 in 2022. Here, the highest priced property was down 3.2%, from $4,100,000 to $3,970,000.
In the town of Granby, 47 luxury properties sold, compared to 26 sold in 2021. The total sales volume had a substantial 63% increase, from $39,232,250 in 2021 to $64,177,668 in 2022. The number of luxury properties sold in Tabernash was 25, up 19% from 21 properties in 2021. Tabernash also had a 25% increase in price per square foot, from $444 in 2021 to $557 in 2022.
24
January through December 2021 2022 % Change # of Properties Sold 186 244 31.2% Average Price Per Square Foot $521 $610 17.1% Average Days on Market 130 156 20.0% Highest Price $4,600,000 $8,370,000 82.0% Average List Price $1,589,278 $1,584,839 -0.3% Average Sale Price $1,585,778 $1,578,329 -0.5% % Sold Price to List Price 100.8% 100.5% -0.3% Total Dollar Volume $294,954,724 $385,112,285 30.6%
+ $1,000,000 Sales
GRAND COUNTY
Based on $1,000,000+ sales for Grand County. Based on Information from Grand County’s Board of Realtors. This representation is based in whole or in part on data supplied by the Grand County Board of Realtors on January 5, 2023. The Grand County Board of Realtors does not guarantee nor is in any way responsible for its accuracy. Data maintained by the Grand County Board of Realtors may not reflect all real estate activity in the market.
27.3%
The average number of days on market in Fraser increased by 27.3% in 2022 compared to that of 2021.
80.8%
The numbers of properties sold in Granby increased by 80.8% in 2022 compared to that of 2021.
25 GRAND LAKE GRANBY FRASER January through December 2021 2022 % Change # of Properties Sold 48 46 -4.2% Average Price Per Square Foot $545 $618 13.4% Average Days on Market 176 224 27.3% Highest Price $4,100,000 $3,970,000 -3.2% Average List Price $1,744,586 $1,686,857 -3.3% Average Sale Price $1,757,226 $1,708,998 -2.7% % Sold Price to List Price 102.0% 102.3% 0.3% Total Dollar Volume $84,346,854 $78,613,919 -6.8% Single Family Homes
Single Family Homes January through December 2021 2022 % Change # of Properties Sold 26 47 80.8% Average Price Per Square Foot $444 $478 7.7% Average Days on Market 82 87 6.1% Highest Price $4,430,000 $2,050,000 -53.7% Average List Price $1,506,612 $1,363,572 -9.5% Average Sale Price $1,508,932 $1,365,482 -9.5% % Sold Price to List Price 100.1% 100.4% 0.3% Total Dollar Volume $39,232,250 $64,177,668 63.6% Single Family Homes January through December 2021 2022 % Change # of Properties Sold 28 27 -3.6% Average Price Per Square Foot $521 $541 3.8% Average Days on Market 79 90 13.9% Highest Price $4,600,000 $3,400,000 -26.1% Average List Price $1,652,357 $1,644,139 -0.5% Average Sale Price $1,633,098 $1,582,891 -3.1% % Sold Price to List Price 99.4% 96.3% -3.1% Total Dollar Volume $45,726,750 $42,738,062 -6.5%
231.7%
The total dollar volume in Kremmling increased by 231.7% in 2022 compared to that of 2021.
19.5%
The total dollar volume in Winter Park increased by 19.5% in 2022 compared to that of 2021.
26 KREMMLING TABERNASH WINTER PARK
Single Family Homes January through December 2021 2022 % Change # of Properties Sold 3 3 — Average Price Per Square Foot $515 $954 85.2% Average Days on Market 449 123 -72.6% Highest Price $1,225,000 $8,370,000 583.3% Average List Price $1,276,667 $4,469,667 250.1% Average Sale Price $1,150,000 $3,814,166 231.7% % Sold Price to List Price 90.9% 87.3% -4.0% Total Dollar Volume $3,450,000 $11,442,500 231.7% Single Family Homes January through December 2021 2022 % Change # of Properties Sold 21 25 19.0% Average Price Per Square Foot $444 $557 25.5% Average Days on Market 110 77 -30.0% Highest Price $3,500,000 $5,850,000 67.1% Average List Price $1,636,229 $2,140,220 30.8% Average Sale Price $1,634,119 $2,118,343 29.6% % Sold Price to List Price 101.8% 100.5% -1.2% Total Dollar Volume $34,316,500 $52,958,589 54.3% Single Family Homes January through December 2021 2022 % Change # of Properties Sold 14 16 14.3% Average Price Per Square Foot $516 $639 23.8% Average Days on Market 71 321 352.1% Highest Price $2,899,000 $3,800,000 31.1% Average List Price $2,099,429 $2,064,938 -1.6% Average Sale Price $2,000,830 $2,092,227 4.6% % Sold Price to List Price 96.4% 101.3% 5.1% Total Dollar Volume $28,011,625 $33,475,636 19.5%
SUMMIT COUNTY LUXURY MARKET
Boasting world-class skiing at Breckenridge, Keystone, and Copper Mountain resorts, Summit County is also renowned for hiking, mountain biking, and boating on Lake Dillon. These mountain communities continue to be a desirable real estate destination.
Summit County saw a slight decrease in the number of luxury properties sold after a stellar sales year in 2021. In 2022, 230 homes were sold, which was a 7.3% dip from the 248 homes sold in 2021. However, average price per square foot county-wide increased 6.7% from $790 to $843.
Breckenridge, known for its Victorian buildings lining the downtown streets and varied ski terrain on Peak 6 – Peak 10, had a 13.8% increase in the price per square foot of luxury properties, from $769 in 2021 to $875 in 2022. The average list price was down slightly, from $3,595,902 to $3,528,620 over the previous year.
In Copper Mountain, the price per square foot was $783, up 24% from $628 in 2021. This community also had a 41% uptick in the highest priced property sold, with the top home at $5,431,074. By comparison, the highest priced home in 2021 was $3,850,000.
The number of luxury homes sold in Keystone was 13 in 2022, down just slightly from 14 homes sold in 2021. The price per square foot was $709, up 25% from $567 in 2021. Keystone’s highest priced home sold for $4,375,000, up from $4,025,000 in 2021.
27
January through December 2021 2022 % Change # of Properties Sold 248 230 -7.3% Average Price Per Square Foot $790 $843 6.7% Average Days on Market 53 38 -28.3% Highest Price $17,000,000 $12,200,000 -28.2% Average List Price $3,192,838 $3,086,354 -3.3% Average Sale Price $3,117,096 $3,005,350 -3.6% % Sold Price to List Price 98.0% 98.4% 0.5% Total Dollar Volume $807,584,705 $717,755,427 -11.1% SUMMIT COUNTY + $2,000,000 Sales
Based on $2,000,000+ sales in Summit County. Based on information from Summit Association of Realtors®. This representation is based in whole or in part on data supplied by Summit Association of Realtors® on January 5, 2023. Summit Association of Realtors® does not guarantee nor is in any way responsible for its accuracy. Data maintained by Summit Association of Realtors® may not reflect all real estate activity in the market.
394.5%
The total dollar volume in Copper Mountain increased by 394.5% in 2022 compared to that of 2021.
28 January through December 2021 2022 % Change # of Properties Sold 142 100 -29.6% Average Price Per Square Foot $769 $875 13.8% Average Days on Market 60 45 -25.0% Highest Price $17,000,000 $12,200,000 -28.2% Average List Price $3,595,902 $3,528,620 -1.9% Average Sale Price $3,498,005 $3,384,876 -3.2% % Sold Price to List Price 97.5% 96.8% -0.8% Total Dollar Volume $496,716,775 $338,487,565 -31.9%
January through December 2021 2022 % Change # of Properties Sold 1 5 400.0% Average Price Per Square Foot $628 $783 24.6% Average Days on Market 4 13 225.0% Highest Price $3,850,000 $5,431,074 41.1% Average List Price $3,995,000 $3,896,215 -2.5% Average Sale Price $3,850,000 $3,807,515 -1.1% % Sold Price to List Price 96.4% 97.5% 1.1% Total Dollar Volume $3,850,000 $19,037,574 394.5% January through December 2021 2022 % Change # of Properties Sold 14 13 -7.1% Average Price Per Square Foot $567 $709 25.0% Average Days on Market 50 17 -66.0% Highest Price $4,025,000 $4,375,000 8.7% Average List Price $2,843,857 $3,153,692 10.9% Average Sale Price $2,790,607 $3,037,692 8.9% % Sold Price to List Price 98.2% 96.9% -1.3% Total Dollar Volume $39,068,501 $39,490,000 1.1% Single Family Homes Single Family Homes Single Family Homes BRECKENRIDGE COPPER MOUNTAIN KEYSTONE
CRESTED BUTTE LUXURY MARKET
Crested Butte offers world-class mountain biking, downhill skiing, and Nordic skiing just minutes from its charming town center. Kebler Pass, which is located seven miles from the Town of Crested Butte, is home to the world’s largest Aspen grove which offers stunning colors for photographers during the fall foliage season. Homebuyers in this area enjoy a variety of styles of luxury homes, many of which have million-dollar mountain views and access to wilderness. The communities within Gunnison County saw a 37.6% decrease in the number of luxury properties sold in 2022, when compared to 2021. The average sale price of luxury homes in the area increased 2% to $3,634,637 while the average price per square foot throughout the county notched up 2.3% to $962.
CRESTED BUTTE
Rural Crested Butte had a 31.6% increase in the highest priced property, from $5,600,000 to $7,400,000 million. The average sale price in this area increased by 8.4% from $2.9 million to $3,200,000, and the average days on market was 126, down from 177 days in 2021.
The Town of Crested Butte, known for its pedestrianfriendly downtown and local shops and restaurants, saw the price per square foot increase 33% from $1,114 to $1,485. The highest priced property was $5,100,000, compared to $4,600,000 in 2021.
Mt. Crested Butte had a 27.7% increase in average price per square foot, from $687 to $877. The average days on market was 134, down slightly from 138 in 2021.
29
Based on $2,000,000+ residential sales in Gunnison County. Based on data from the Gunnison County Association of Realtors® MLS, Colorado Real Estate Network (CREN) on January 5, 2023. Verify with a local Realtor®. All information is deemed reliable but not guaranteed. Data maintained by CREN MLS may not reflect all real estate activity in the market.
January through December 2021 2022 % Change # of Properties Sold 85 53 -37.6% Average Price Per Square Foot $940 $962 2.3% Average Days on Market $169 $166 -1.8% Highest Price $27,000,000 $11,550,000 -57.2% Average List Price $3,738,563 $3,777,584 1.0% Average Sale Price $3,563,745 $3,634,637 2.0% % Sold Price to List Price 95.0% 96.0% 0.9% Total Dollar Volume $302,918,400 $192,635,800 -36.4%
+ $2,000,000 Sales Gunnison County
23.3%
The average sale price in the Town of Crested Butte increased by 23.3% in 2022 compared to that of 2021.
The average number of days on market in Rural Crested Butte decreased by 28.8% in 2022 compared to that of 2021.
30 January through December 2021 2022 % Change # of Properties Sold 16 8 -50.0% Average Price Per Square Foot $1,114 $1,485 33.3% Average Days on Market 148 260 75.7% Highest Price $4,606,000 $5,100,000 10.7% Average List Price $3,316,812 $4,324,375 30.4% Average Sale Price $3,234,062 $3,987,500 23.3% % Sold Price to List Price 97.5% 92.2% -5.4% Total Dollar Volume $51,745,000 $31,900,000 -38.4% January through December 2021 2022 % Change # of Properties Sold 20 10 -50.0% Average Price Per Square Foot $687 $877 27.7% Average Days on Market $138 $134 -2.9% Highest Price $5,700,000 $3,700,000 -35.1% Average List Price $3,163,200 $3,005,000 -5.0% Average Sale Price $3,041,300 $2,942,260 -3.3% % Sold Price to List Price 96.0% 98.0% 1.8% Total Dollar Volume $60,826,000 $29,422,600 -51.6% January through December 2021 2022 % Change # of Properties Sold 30 24 -20.0% Average Price Per Square Foot $844 $797 -5.6% Average Days on Market 177 126 -28.8% Highest Price $5,625,000 $7,400,000 31.6% Average List Price $3,021,433 $3,306,958 9.4% Average Sale Price $2,948,518 $3,196,383 8.4% % Sold Price to List Price 97.6% 96.7% -1.0% Total Dollar Volume $88,455,540 $76,713,200 -13.3% Single Family Homes Single Family Homes Single Family Homes TOWN OF
CRESTED
RURAL
CRESTED BUTTE MT.
BUTTE
CRESTED BUTTE 28.8%
VAIL VALLEY LUXURY MARKET
Known for its stunning views of the Gore Range, world-class ski resorts, and endless outdoor adventures, the Vail Valley is a favorite destination for luxury real estate consumers in Colorado. In 2022 compared to 2021, the number of luxury listings sold within Eagle County—home to the Vail Valley—decreased by 23.6%. However, the average list price rose by 3.9% to $6,221,708. The average price per square foot throughout the county rose 4.3% to $1,467 in 2022.
The Arrowhead community saw a 13.0% decrease in number of luxury properties sold, from 23 homes in 2021 to 20 homes in 2022. That neighborhood’s highest priced home was $15,500,000 compared to $10,600,000 during the previous year.
Luxury properties in the Town of Vail saw a small dip in the average price per square foot, down 1.7% to $2,076 for the year. The average list price was also down slightly from $7,085,731 to $7,058,500 compared to 2021.
Homes in the Vail Golf Course community had an average price per square foot of $1,620, which was a 6.0% increase over $1,528 in the previous year. That neighborhood had just a slight decrease in the average list price from $7,080,000 to $7,050,000.
31
Based on $3,000,000+
sales
in
Eagle County. Based on information from Vail Board of Realtors®. This representation is based in whole or in part on data supplied by Vail Board of Realtors® on January 5, 2023. Vail Board of Realtors® does not guarantee nor is in any way responsible for its accuracy. Data maintained by Vail Board of Realtors® may not reflect all real estate activity in the market.
+ $3,000,000 Sales January through December 2021 2022 % Change # of Properties Sold 296 226 -23.6% Average Price Per Square Foot $1,407 $1,467 4.3% Average Days on Market 153 80 -47.7% Highest Price $34,000,000 $40,000,000 17.6% Average List Price $5,990,360 $6,221,708 3.9% Average Sale Price $5,741,201 $5,983,963 4.2% % Sold Price to List Price 96.6% 97.0% 0.4% Total Dollar Volume $1,699,395,548 $1,352,375,689 -20.4%
Eagle County
VAIL VALLEY
30.4%
The average sale price in Arrowhead increased by 30.4% in the first half of 2022 compared to that of 2021.
CREEK 47.8% The average number of days on market in Beaver Creek decreased by 47.8% in 2022 compared to that of 2021.
32 January through December 2021 2022 % Change # of Properties Sold 23 20 -13.0% Average Price Per Square Foot $837 $1,008 20.4% Average Days on Market 78 67 -14.1% Highest Price $10,605,750 $15,500,000 46.1% Average List Price $4,509,130 $5,838,150 29.5% Average Sale Price $4,374,345 $5,704,225 30.4% % Sold Price to List Price 97.4% 98.6% 1.2% Total Dollar Volume $100,609,950 $114,084,500 13.4% January through December 2021 2022 % Change # of Properties Sold 34 21 -38.2% Average Price Per Square Foot $1,270 $1,456 14.6% Average Days on Market 119 29 -75.6% Highest Price $16,000,000 $11,750,000 -26.6% Average List Price $6,927,559 $6,399,476 -7.6% Average Sale Price $6,720,345 $6,247,404 -7.0% % Sold Price to List Price 97.5% 97.5% — Total Dollar Volume $228,491,750 $131,195,500 -42.6% January through December 2021 2022 % Change # of Properties Sold 42 35 -16.7% Average Price Per Square Foot $1,072 $1,318 22.9% Average Days on Market 209 109 -47.8% Highest Price $10,950,000 $10,200,000 -6.8% Average List Price $5,562,314 $5,027,029 -9.6% Average Sale Price $5,329,682 $4,860,957 -8.8% % Sold Price to List Price 96.3% 97.1% 0.9% Total Dollar Volume $223,846,676 $170,133,500 -24.0%
All Properties All Properties All Properties ARROWHEAD
BACHELOR GULCH BEAVER
57.7%
The average number of days on market in the Town of Vail decreased by 57.7% in 2022 compared to that of 2021.
33.2%
The average sale price in Lionshead increased by 33.2% in 2022 compared to that of 2021.
33 All Properties January through December 2021 2022 % Change # of Properties Sold 119 78 -34.5% Average Price Per Square Foot $2,112 $2,076 -1.7% Average Days on Market 175 74 -57.7% Highest Price $34,000,000 $30,875,000 -9.2% Average List Price $7,085,731 $7,058,500 -0.4% Average Sale Price $6,739,754 $6,748,833 0.1% % Sold Price to List Price 96.2% 97.0% 0.8% Total Dollar Volume $802,030,795 $526,409,000 -34.4% All Properties January through December 2021 2022 % Change # of Properties Sold 57 32 -43.9% Average Price Per Square Foot $2,685 $2,727 1.6% Average Days on Market 138 90 -34.8% Highest Price $34,000,000 $29,000,000 -14.7% Average List Price $8,237,614 $8,504,250 3.2% Average Sale Price $7,835,118 $8,123,656 3.7% % Sold Price to List Price 96.0% 97.2% 1.3% Total Dollar Volume $446,601,750 $259,957,000 -41.8% All Properties January through December 2021 2022 % Change # of Properties Sold 27 15 -44.4% Average Price Per Square Foot $2,088 $2,451 17.4% Average Days on Market 233 79 -66.1% Highest Price $12,450,000 $30,875,000 148.0% Average List Price $6,467,926 $8,569,333 32.5% Average Sale Price $6,174,444 $8,223,333 33.2% % Sold Price to List Price 95.8% 96.8% 1.1% Total Dollar Volume $166,710,000 $123,350,000 -26.0% LIONSHEAD VAIL VILLAGE TOWN OF VAIL
22.3%
The average sale price in Vail Golf Course increased by 22.3% in 2022 compared to that of 2021.
67.7%
The average number of days on market in Mountain Star decreased by 67.7% in 2022 compared to that of 2021.
34 January through December 2021 2022 % Change # of Properties Sold 11 7 -36.4% Average Price Per Square Foot $1,528 $1,620 6.0% Average Days on Market 102 100 -2.0% Highest Price $11,925,000 $15,500,000 30.0% Average List Price $6,178,636 $7,700,000 24.6% Average Sale Price $5,960,909 $7,289,285 22.3% % Sold Price to List Price 96.8% 97.1% 0.3% Total Dollar Volume $65,570,000 $51,025,000 -22.2% January through December 2021 2022 % Change # of Properties Sold 1 No Sales — Average Price Per Square Foot $1,078 — — Average Days on Market 650 — — Highest Price $8,100,000 — — Average List Price $9,999,000 — — Average Sale Price $8,100,000 — — % Sold Price to List Price 81.0% — — Total Dollar Volume $8,100,000 — — All Properties All Properties VAIL GOLF COURSE SPRADDLE CREEK January through December 2021 2022 % Change # of Properties Sold 10 6 -40.0% Average Price Per Square Foot $819 $1,315 60.6% Average Days on Market 470 152 -67.7% Highest Price $11,000,000 $20,250,000 84.1% Average List Price $7,358,500 $10,656,500 44.8% Average Sale Price $7,034,750 $10,100,000 43.6% % Sold Price to List Price 95.5% 94.4% -1.2% Total Dollar Volume $70,347,500 $60,600,000 -13.9% MOUNTAIN STAR
All Properties
TELLURIDE LUXURY MARKET
Telluride offers beautiful Victorian-era buildings, stunning views of the surrounding mountains, and gorgeous luxury homes that help residents create a life they truly love. San Miguel County, home to Telluride and its surrounding communities, saw a 9.7% decrease in the number of luxury homes sold, with 102 in 2022 compared to 113 in 2021. The price per square foot throughout the county was $1,709, up almost 18% from 2021.
The Town of Telluride had very little change in the number of luxury homes sold: 34 in 2021 and 32 in 2022. The price per square foot was $2,239 in 2022, a 4.2% increase from $2,148 the previous year. The average sale price of luxury homes was $5,736,494, a 12.3% decrease from $6,538,852 in 2021.
Mountain Village had an average price per square foot of $1,413 for its luxury homes in 2022, which was a 35% increase from $1,045 the previous year. That community also saw an uptick to $6,235,832 in the average sale price, a 15.7% increase from $5,390,191 in 2021.
In the Surrounding Mesas, including Deep Creek Mesa, Hastings Mesa, Iron Springs/Horsefly Mesa, Specie Mesa, Turkey Creek Mesa, and Wilson Mesa, the price per square foot increased 7.3% to $1,569. The average sale price was $7,225,834 in 2022, down 8.8% from $7,920,265 in 2021. The average list price saw little change from $8,184,882 in 2021 to $8,200,588 in 2022.
35
Based on sales $3,000,000+ and information from flexmls/Telluride Association of Realtors®. This representation is based in whole or in part on data supplied by Telluride Association of Realtors® on January 5, 2023. Telluride Association of Realtors® does not guarantee nor is in any way responsible for its accuracy. Data maintained by Telluride Association of Realtors® may not reflect all real estate activity in the market.does not guarantee nor is in any way responsible for its accuracy. Data maintained by REColorado may not reflect all real estate activity in the market.
+ $3,000,000 Sales January through December 2021 2022 % Change # of Properties Sold 113 102 -9.7% Average Price Per Square Foot $1,449 $1,709 17.9% Average Days on Market 294 157 -46.6% Highest Price $39,500,000 $17,100,000 -56.7% Average List Price $6,483,211 $6,575,466 1.4% Average Sale Price $6,283,953 $6,268,058 -0.3% % Sold Price to List Price 96.9% 95.3% -1.7% Total Dollar Volume $710,086,705 $639,697,500 -9.9% TELLURIDE San Miguel County
4.2%
The average price per square foot in the Town of Telluride increased by 4.2% in 2022 compared to that of 2021.
32.9%
The average number of days on market in the Surrounding Mesas decreased by 32.9% in 2022 compared to that of 2021.
36 January through December 2021 2022 % Change # of Properties Sold 34 32 -5.9% Average Price Per Square Foot $2,148 $2,239 4.2% Average Days on Market 146 158 8.2% Highest Price $28,000,000 $14,500,000 -48.2% Average List Price $6,750,559 $5,907,625 -12.5% Average Sale Price $6,538,852 $5,736,494 -12.3% % Sold Price to List Price 96.9% 97.1% 0.2% Total Dollar Volume $222,320,955 $183,567,808 -17.4% January through December 2021 2022 % Change # of Properties Sold 59 54 -8.5% Average Price Per Square Foot $1,045 $1,413 35.2% Average Days on Market 300 145 -51.7% Highest Price $17,000,000 $17,100,000 0.6% Average List Price $5,534,591 $6,413,769 15.9% Average Sale Price $5,390,191 $6,235,832 15.7% % Sold Price to List Price 97.4% 97.2% -0.2% Total Dollar Volume $318,021,250 $336,734,917 5.9% January through December 2021 2022 % Change # of Properties Sold 17 17 — Average Price Per Square Foot $1,462 $1,569 7.3% Average Days on Market 292 196 -32.9% Highest Price $39,500,000 $15,000,000 -62.0% Average List Price $8,184,882 $8,200,588 0.2% Average Sale Price $7,920,265 $7,225,834 -8.8% % Sold Price to List Price 96.8% 88.1% -8.9% Total Dollar Volume $134,644,500 $122,839,175 -8.8%
Deep Creek Mesa, Hastings Mea, Iron Springs/Horsefly Mesa, Specie Mesa, Sunshine Mesa, Turkey Creek Mesa, Wilson Mesa All Properties All Properties TOWN OF TELLURIDE MOUNTAIN VILLAGE SURROUNDING MESAS
in your happy place
The definition of paradise depends on your point of view. Find a home that makes each day more extraordinary than the last with LIV Sotheby’s International Realty.
livsothebysrealty.com
38
04 07 28 NATIONAL PARKS MOUNTAIN RANGES SKI AREAS & RESORTS
WHY COLORADO?
39 AVG DAYS OF SUNSHINE ANNUALY CRAFT BREWERIES 300 350+
