Luxury Report


1
QUARTER 1 2023
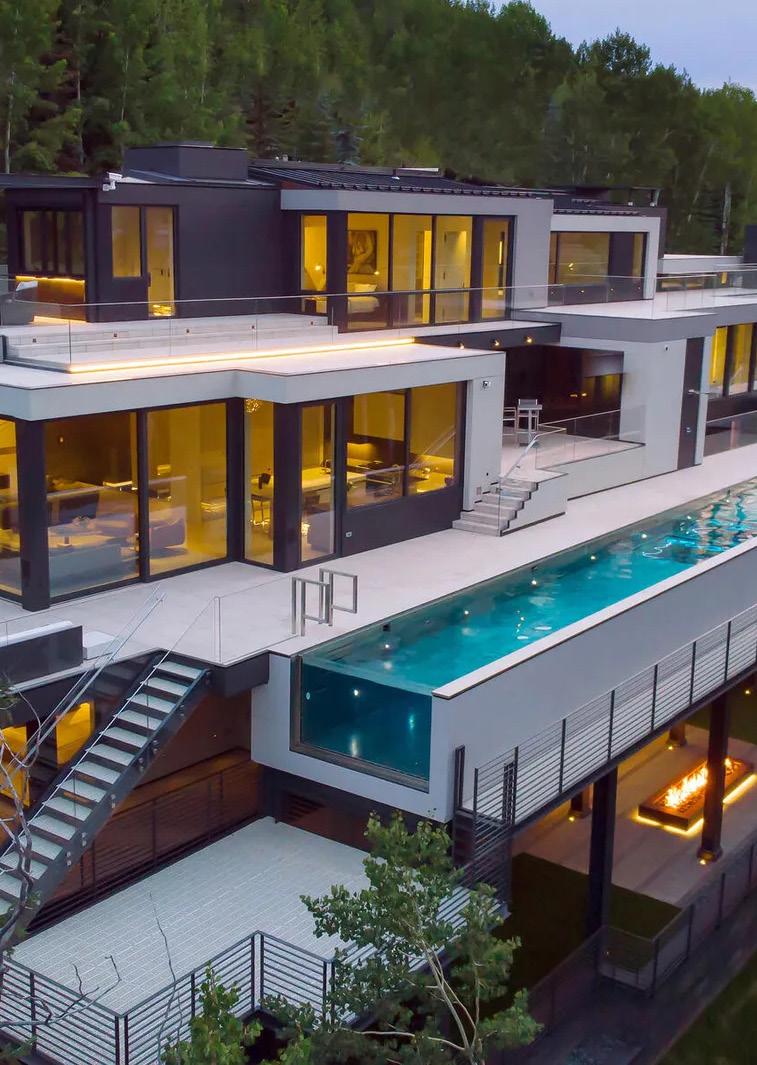
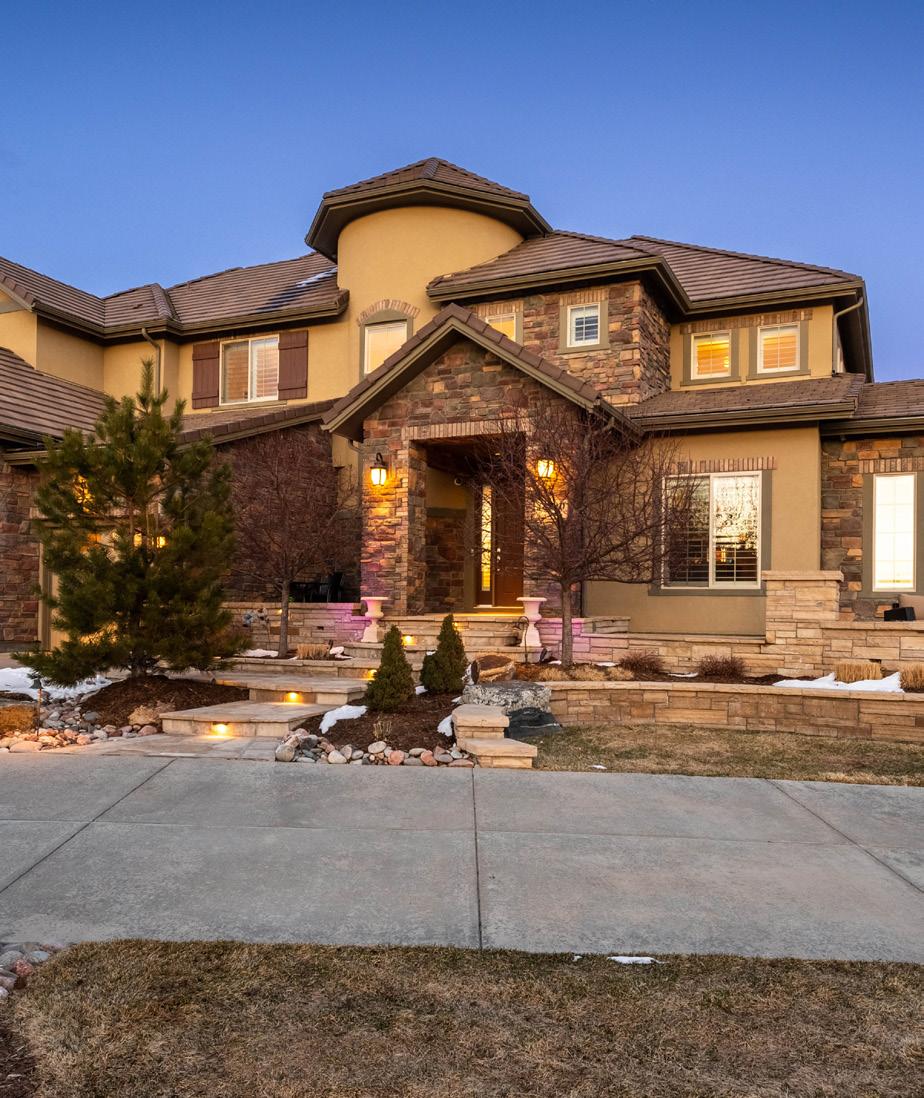
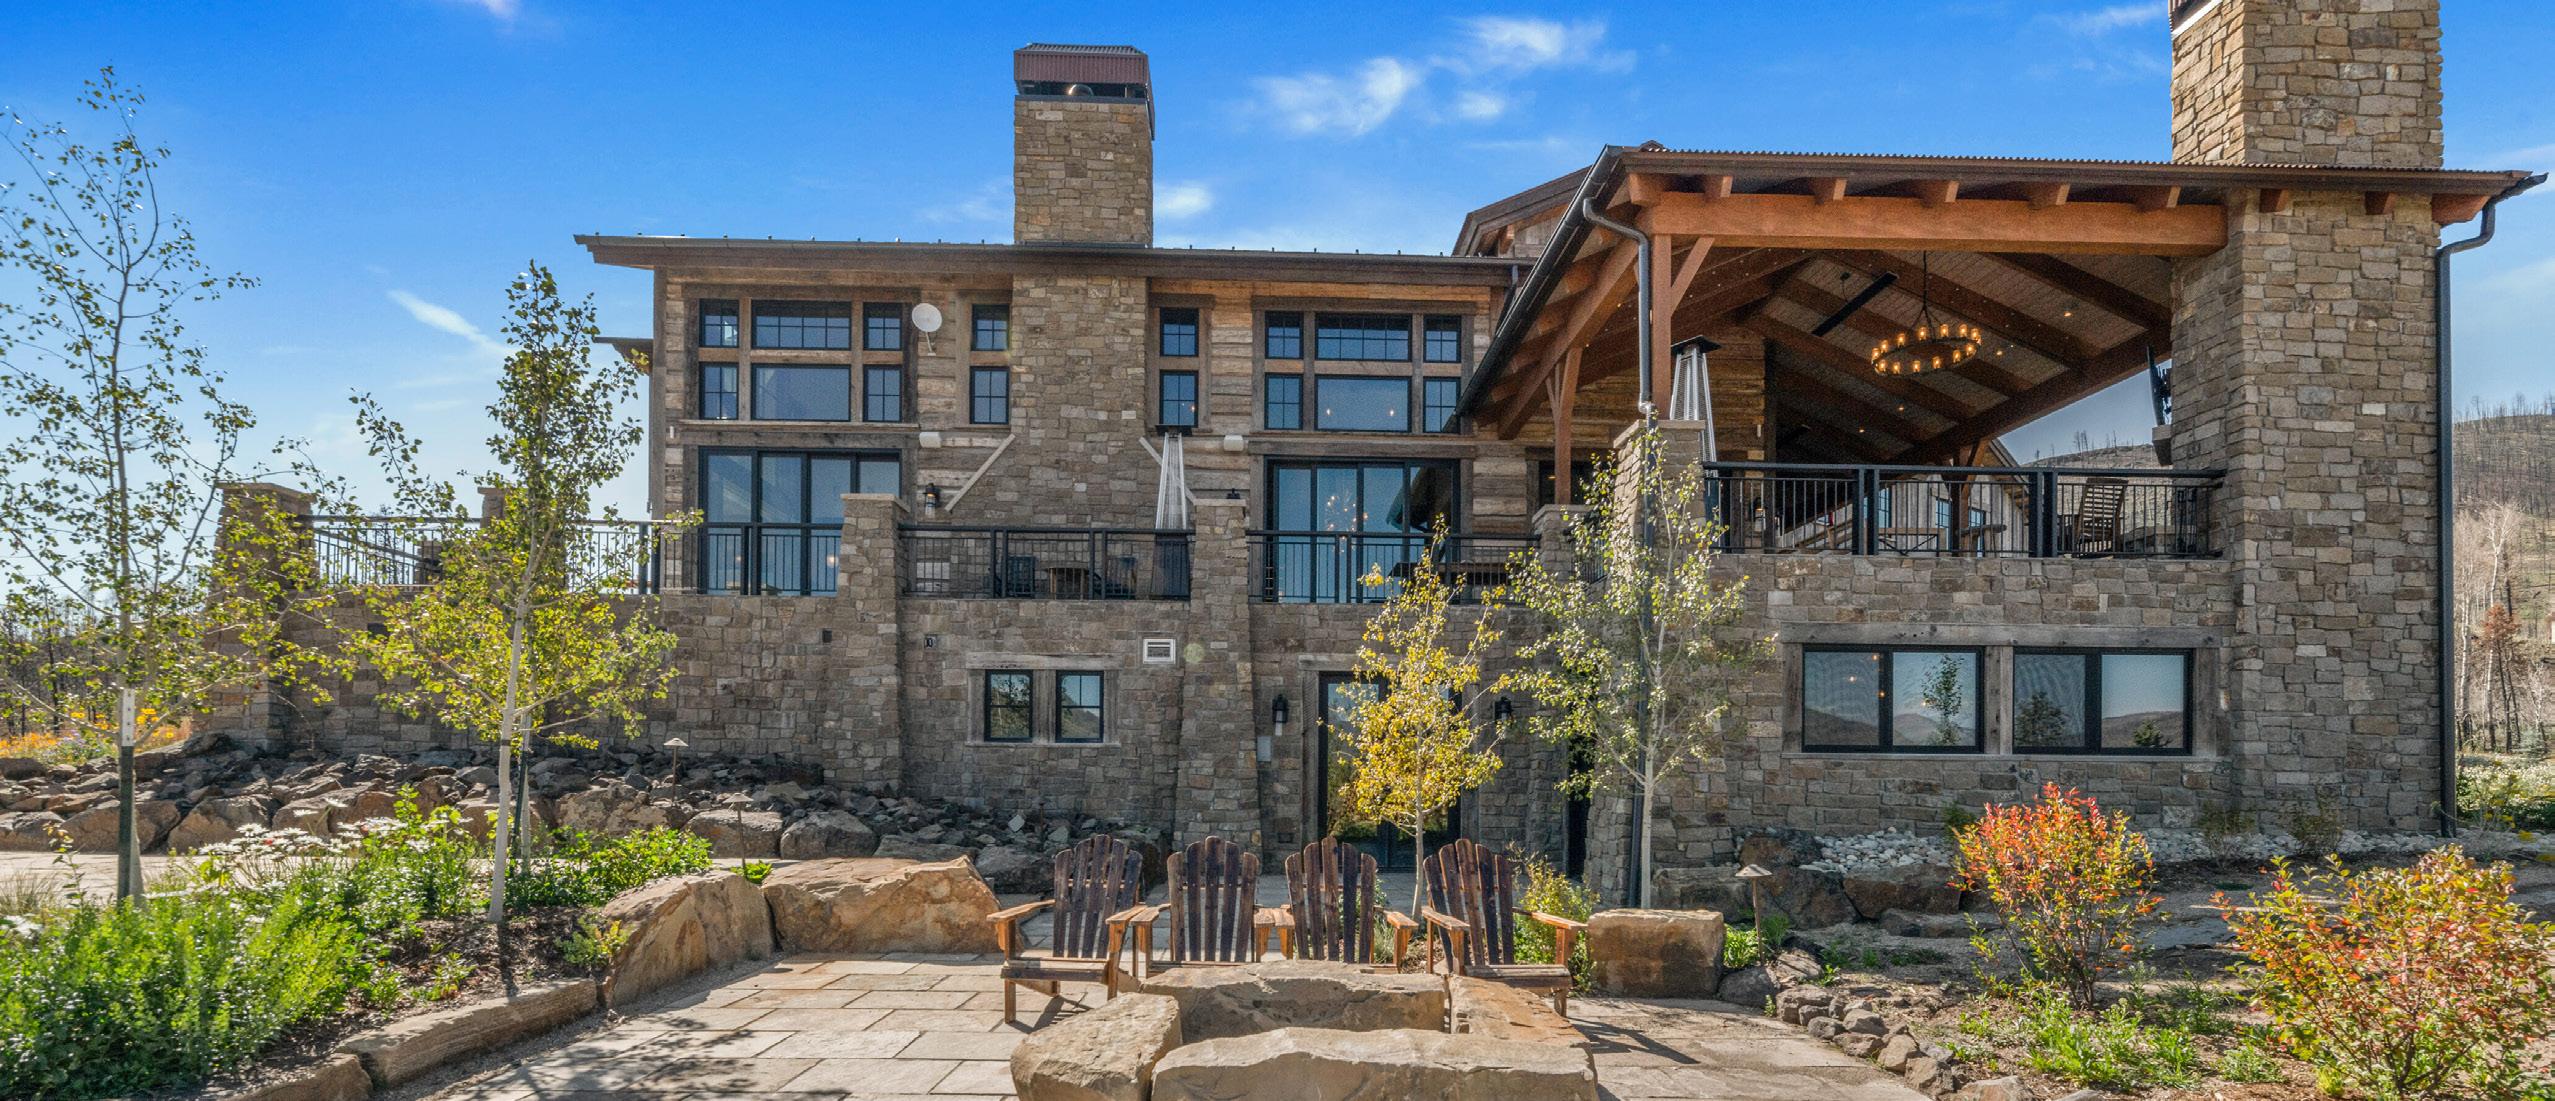
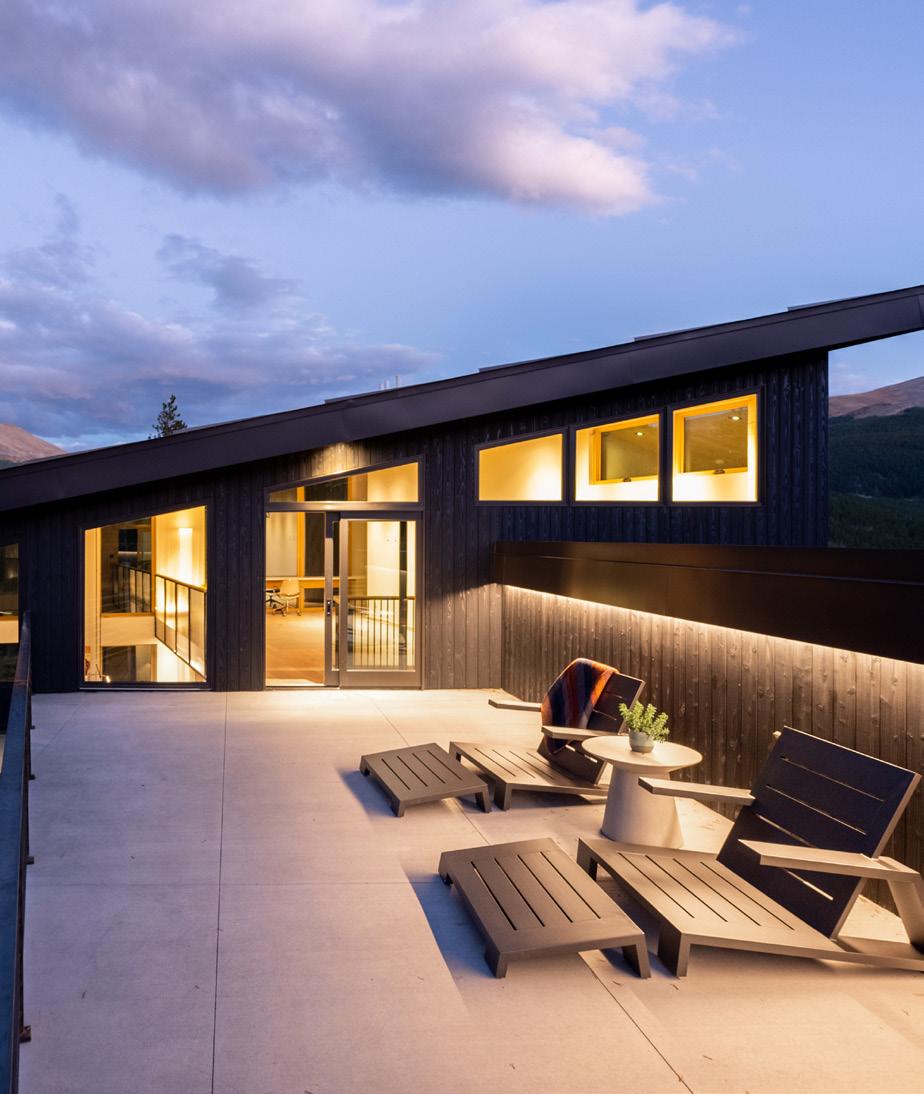
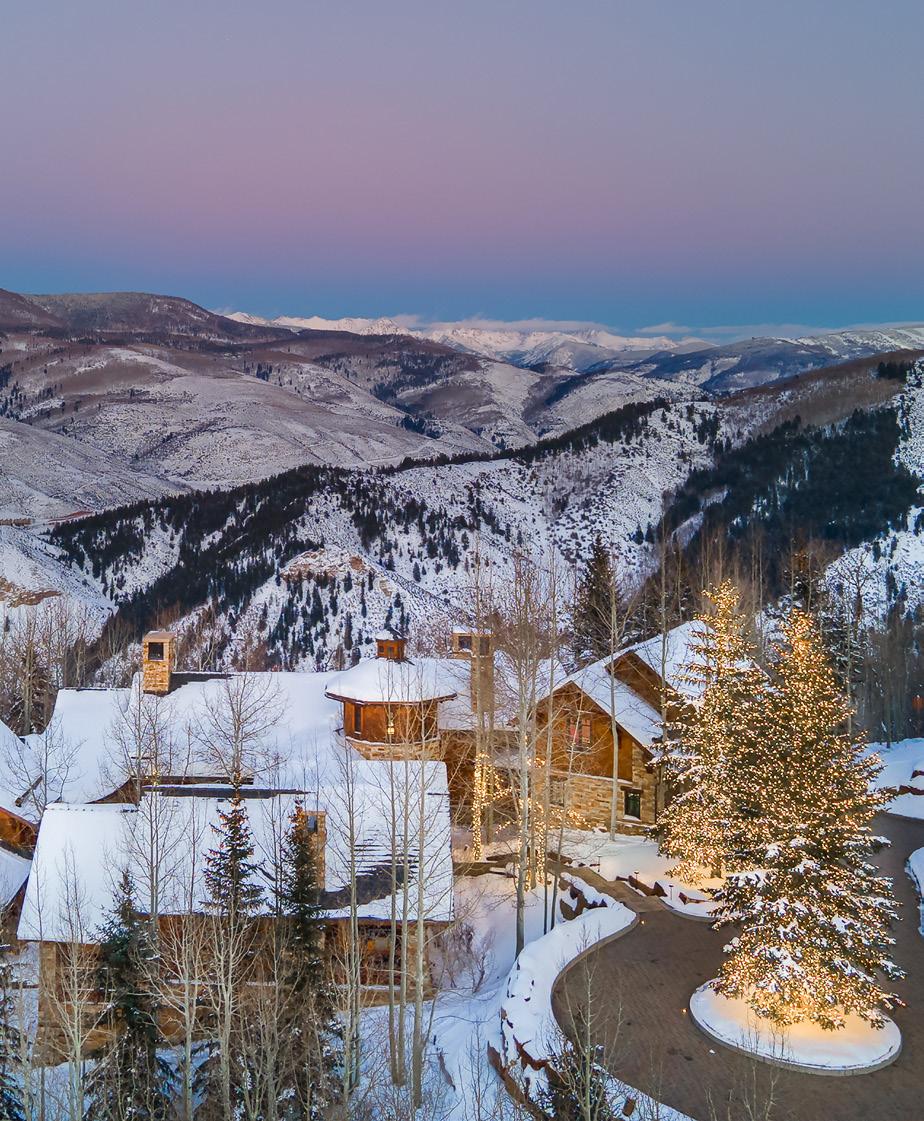
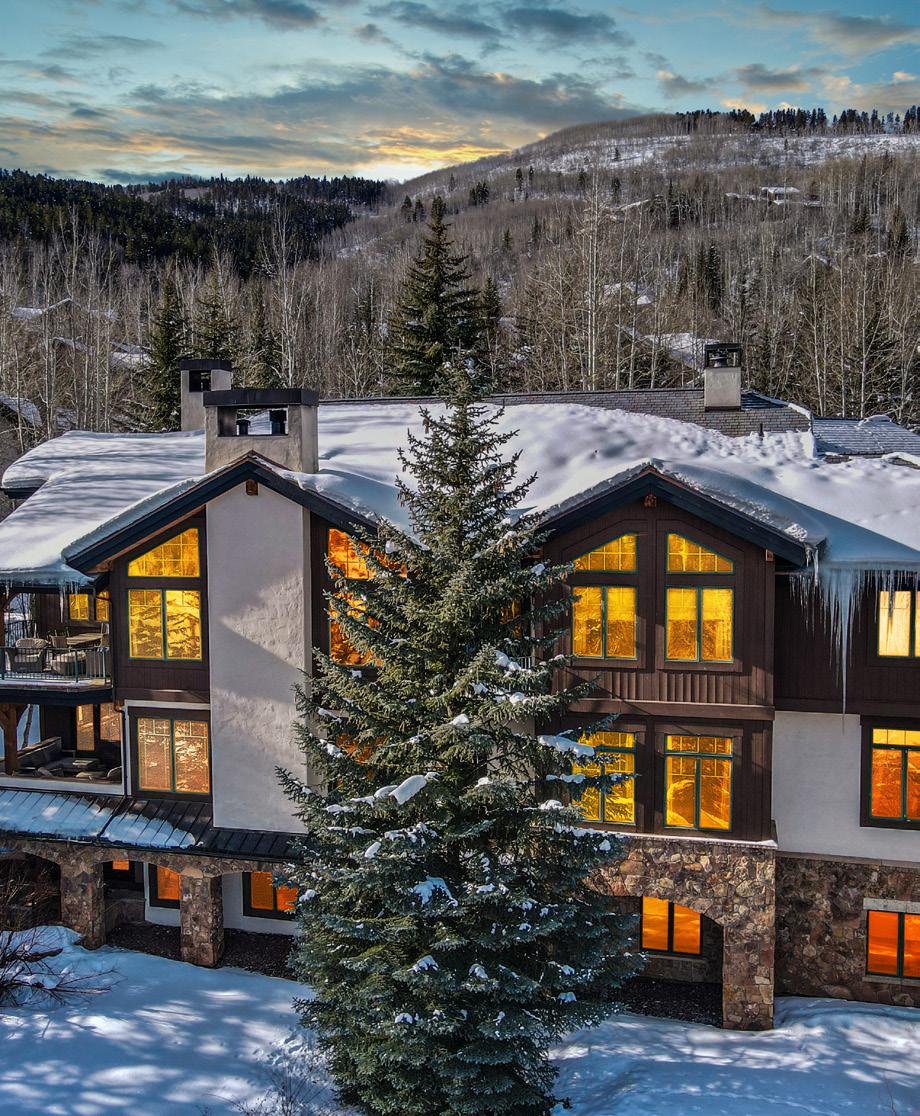
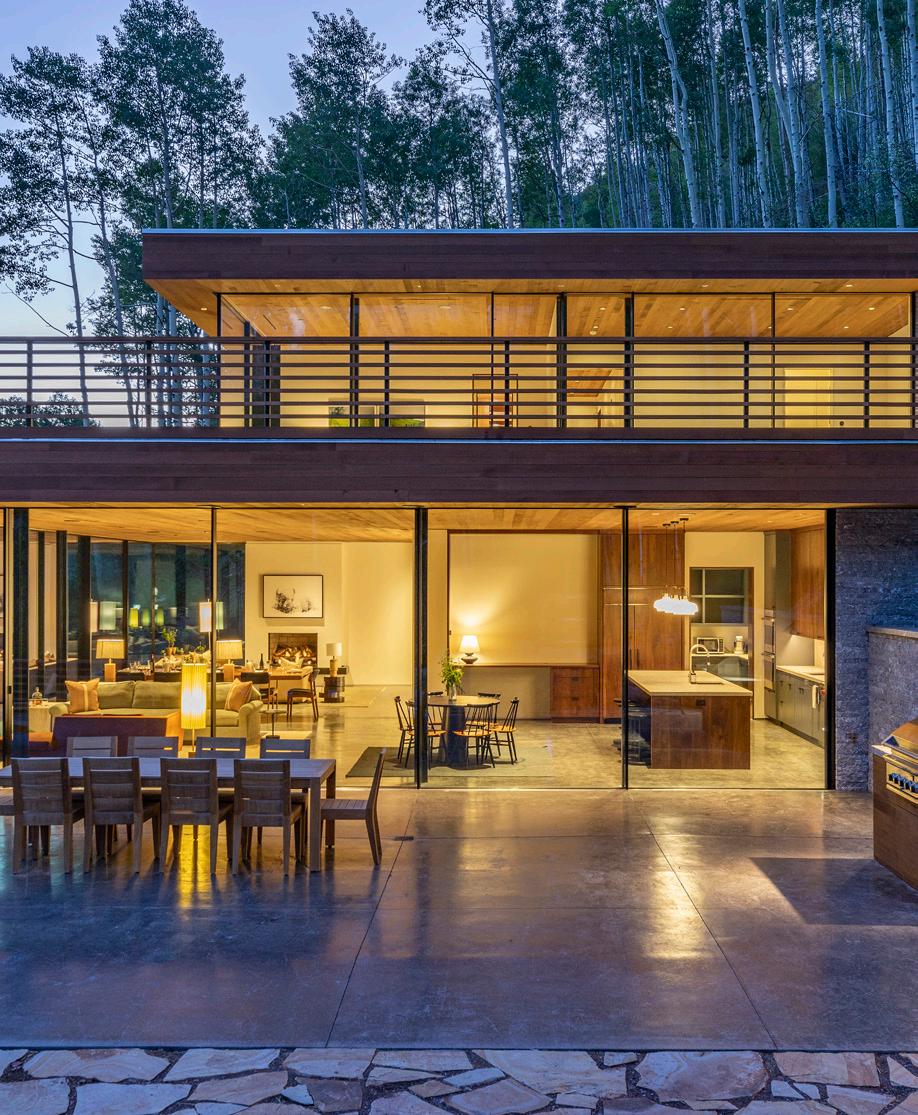
165 Forest Road
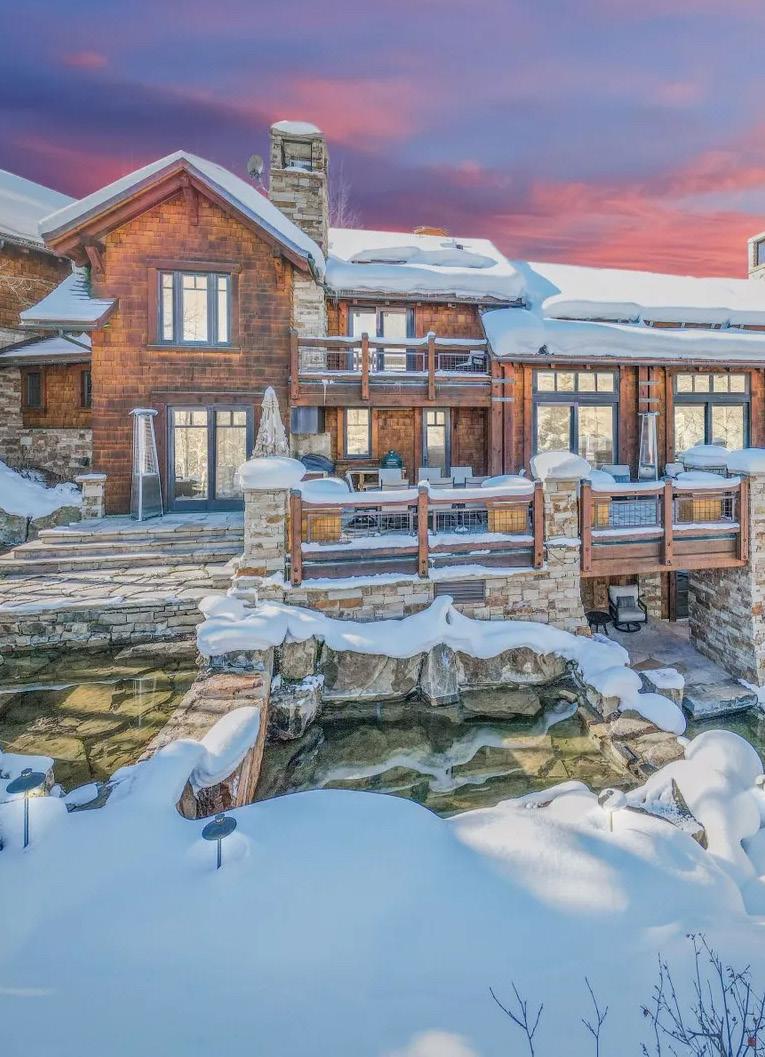
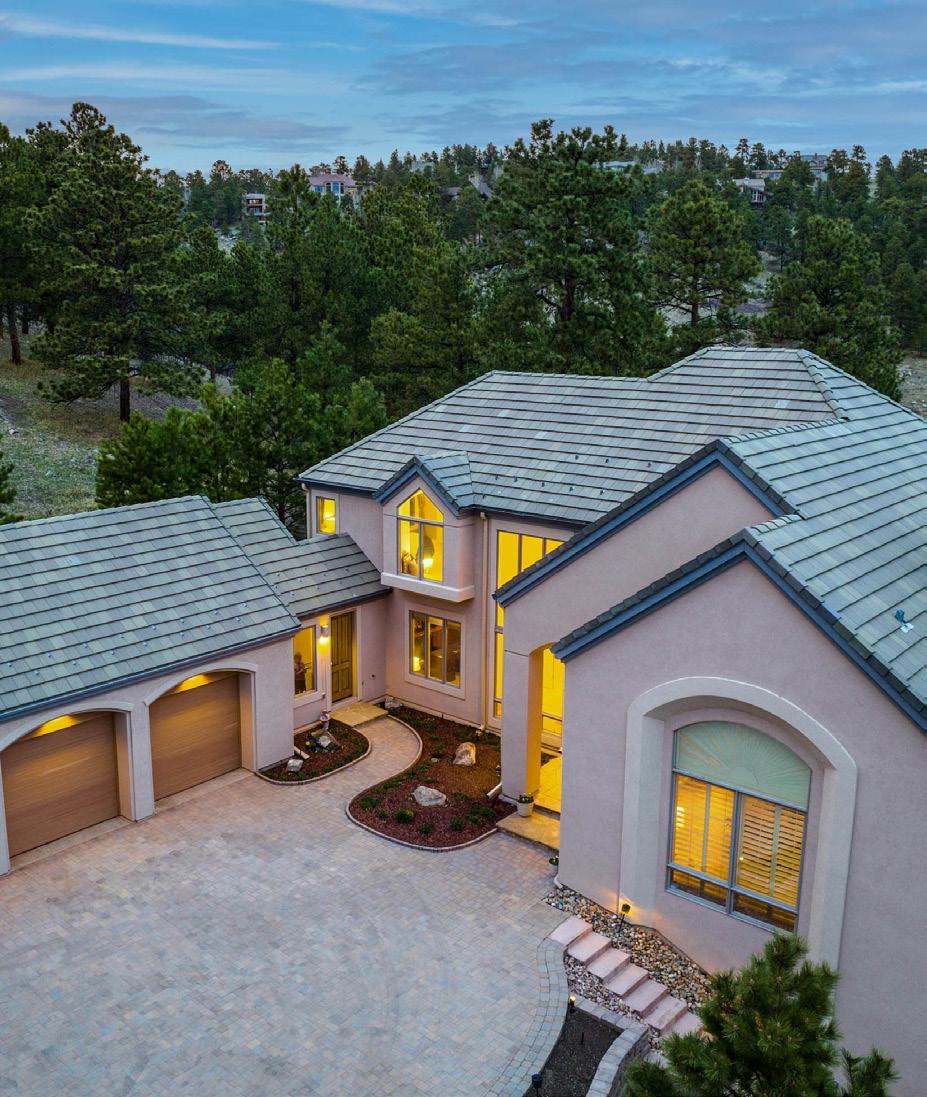
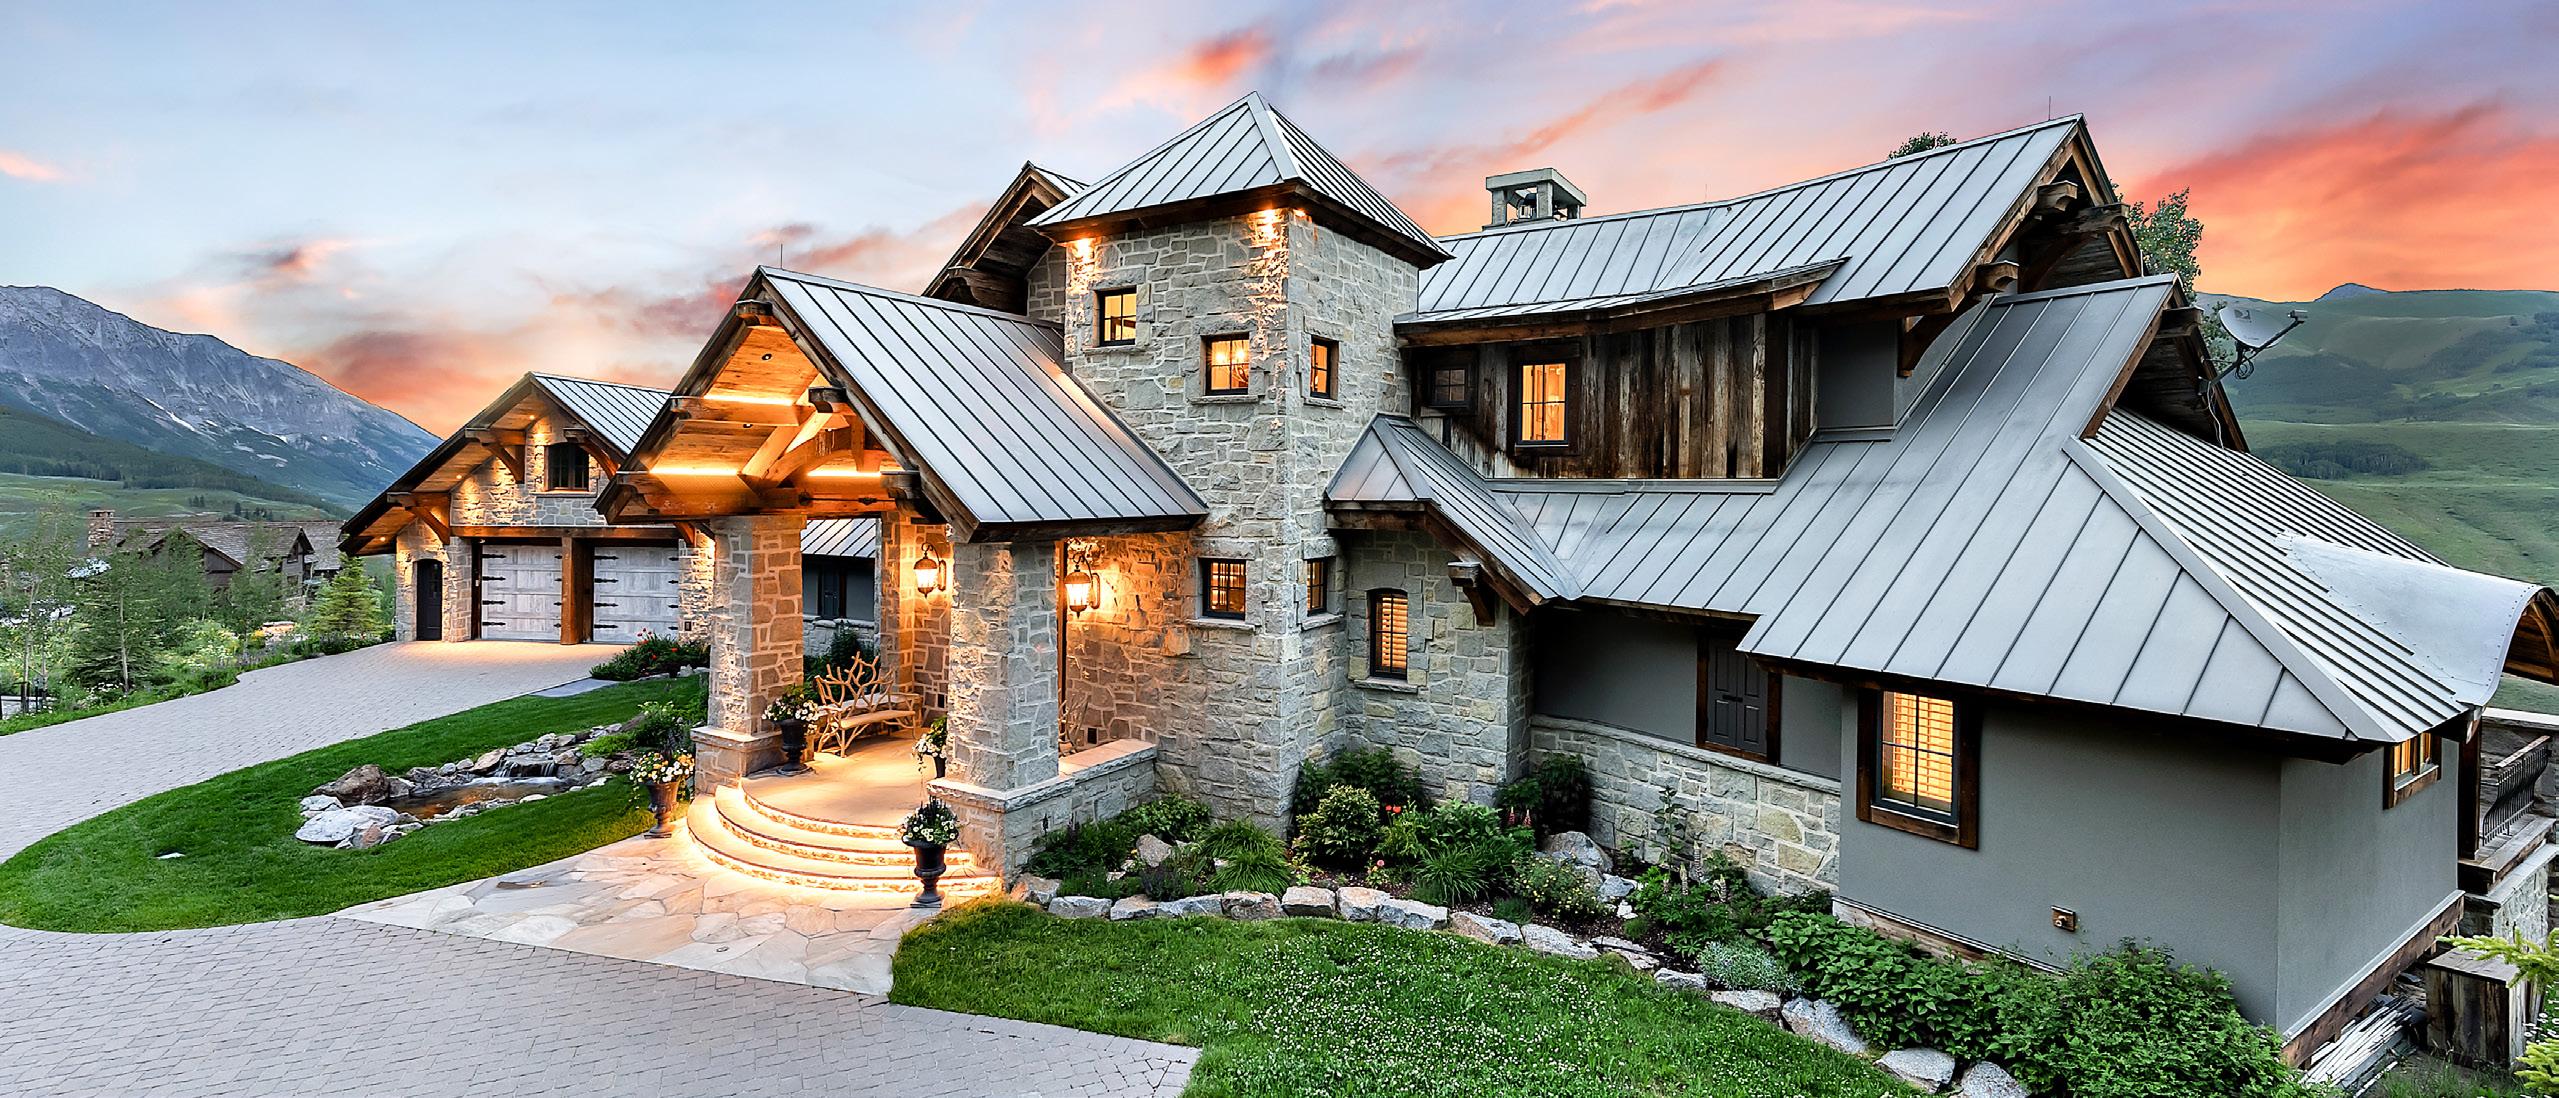
1481 Daybreak Ridge
RESIDENTIAL LUXURY REPORT INTRODUCTION
Despite rising interest rates that are impacting real estate markets across the country, Colorado’s luxury sector has remained strong due to unwavering buyer demand. Since luxury buyers often rely less on credit, their buying decisions may be less sensitive to spikes in interest rates and more influenced by the stock market or inflation. This portion of the market is seeing more cash buyers, private financing, and portfolio financing. While the most recent data paints a picture of a slowing pace of play, this deceleration is the breath of fresh air many consumers have been waiting for to finally reach their real estate goals. The luxury real estate market in Colorado is still ripe with opportunities to create your dream life in your dream home.
LIV Sotheby’s International Realty produces a quarterly Residential Luxury Report, comparing January through March of this year to the previous year, measuring the performance of luxury real estate markets in some of Colorado’s most popular communities for single-family homes and condos for Denver Metro ($1 million+), Colorado Springs ($1 million+), the Foothills ($1 million+), Boulder ($1 million+), the Vail Valley ($3 million+), Summit County ($2 million+), Grand County ($1 million+) Crested Butte ($2 million+), and Telluride ($3 million+).
03
11
21COLORADO SPRINGS $1 Million + P.
24
31 VAIL VALLEY $3 Million + P.
15FOOTHILLS $1 Million + P.
27
COUNTY $2 Million + P.
35 TELLURIDE $3 Million + P.
29 CRESTED BUTTE $2 Million + P.
2
DENVER
METRO $1 Million + P.
18 BOULDER $1 Million + P.
SOUTH
METRO $1 Million + P.
SUMMIT
GRAND COUNTY $1 Million + P.
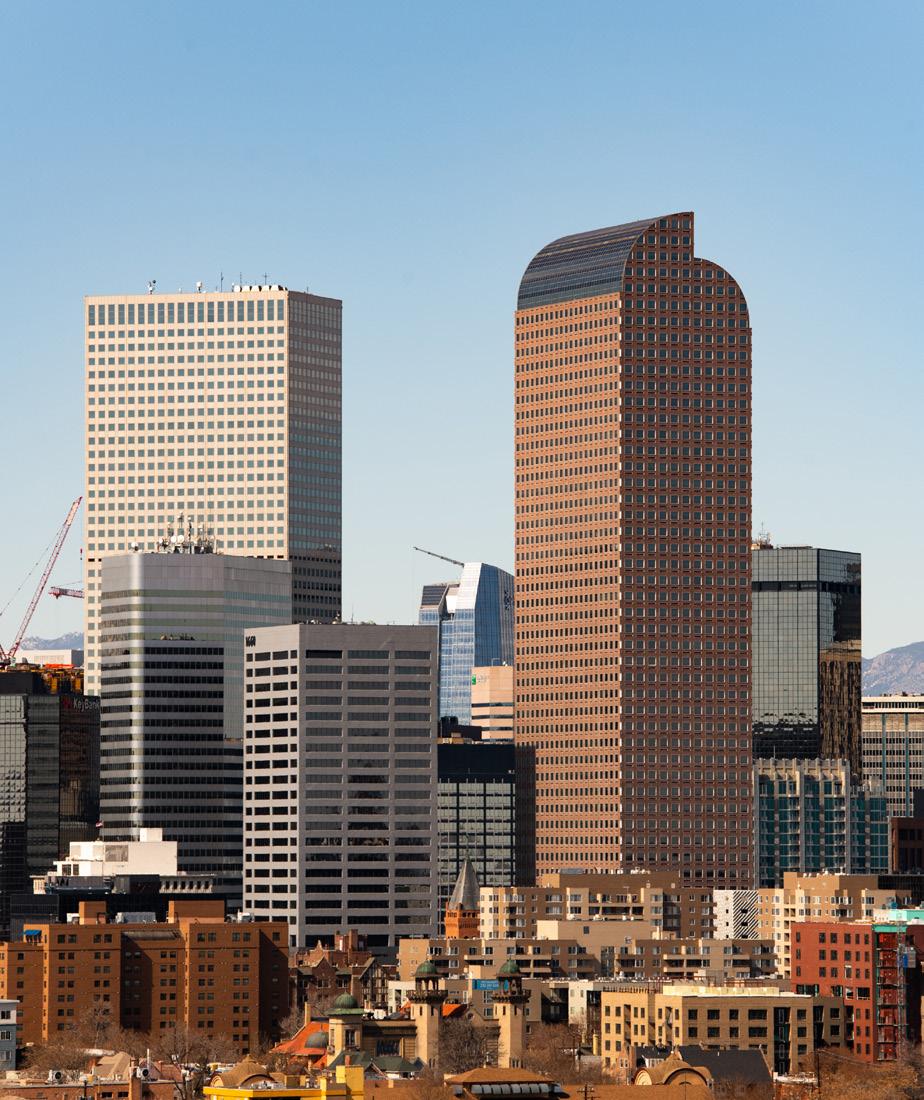
DENVER METRO LUXURY MARKET
Luxury homes in Denver Metro area offer an upscale Colorado living experience, positioning residents near the excitement of the city while remaining residents just a short drive from some of the state’s most amazing outdoor spaces. Overall, the six counties across Denver Metro have experienced a 24.8% decrease in the number of luxury homes sold through March of 2023 compared to 2022, with 803 luxury homes sold. The average sale price of those luxury homes increased by 3.8%, bringing the average price for luxury homes to $1,650,321. The decrease in number of properties sold resulted in a 22.0% decline in the total dollar volume sold, totaling $1,325,207,483.
The interest rate increase had less of an impact than in the other sectors due to cash buyers being more prevalent in the luxury market. Of the top five highest prices sales in Denver Metro in the first quarter of 2023, four were cash deals. Cherry Hills Village, home to many of these sales, helped contribute to an increase of average sale price compared to 2022—15.3% increase for homes with over one acre in lot size.
As homebuyers compete for luxury real estate in Denver Metro, an upward trend in home prices has been observed. The Washington Park East/Central neighborhood, which is popular due to its access to the park and the activities and amenities that come with it, saw an 3.3% increase in sale prices for luxury homes. From January to March of this year, the average sold price for luxury homes in this neighborhood was $2,176,345. Cherry Creek North also saw home values appreciate, rising by 16.1% to reach an average sale price of $2,681,171.
3
Based
This representation is based in whole or in part on data supplied from REColorado on
5,
REColorado does not guarantee nor is in any way responsible for its accuracy. Data maintained by REColorado may not reflect all real estate activity in the market.
on $1,000,000+ sales in Adams, Arapahoe, Broomfield, Denver, Douglas, and Jefferson
Counties.
March
2023.
January through March 2022 2023 % Change # of Properties Sold 1,068 803 -24.8% Average Price Per Square Foot $551 $555 0.7% Average Days on Market 21 43 104.8% Highest Price $9,000,000 $8,000,000 -11.1% Average List Price $1,488,815 $1,674,559 12.5% Average Sale Price $1,590,199 $1,650,321 3.8% % Sold Price to List Price 103.6% 95.8% -7.5% Total Dollar Volume $1,698,332,352 $1,325,207,483 -22.0% Counties: Adams, Arapahoe, Broomfield, Denver, Douglas, Jefferson DENVER METRO +
$1,000,000 Sales
14.7%
The average list price in Bonnie Brae/ Belcaro increased by 14.7% in the first quarter of 2023 compared to that of 2022.
11.3%
The average price per square foot in Bow Mar/Bow Mar South increased by 11.3% in the first quarter of 2023 compared to that of 2022.
4 DENVER ( CITY ) Boundaries: City of Denver BONNIE BRAE/BELCARO January through March 2022 2023 % Change # of Properties Sold 427 322 -24.6% Average Price Per Square Foot $683 $645 -5.6% Average Days on Market 23 39 69.6% Highest Price $9,000,000 $5,700,000 -36.7% Average List Price $1,524,907 $1,734,768 13.8% Average Sale Price $1,633,341 $1,700,218 4.1% % Sold Price to List Price 105.5% 95.9% -9.1% Total Dollar Volume $697,436,556 $547,470,091 -21.5% Boundaries: Mississippi to Cherry Creek Drive South; University to Colorado January through March 2022 2023 % Change # of Properties Sold 11 7 -36.4% Average Price Per Square Foot $923 $792 -14.1% Average Days on Market 11 34 209.1% Highest Price $5,500,000 $4,100,000 -25.5% Average List Price $2,407,400 $2,762,000 14.7% Average Sale Price $2,406,575 $2,439,286 1.4% % Sold Price to List Price 107.0% 93.6% -12.5% Total Dollar Volume $26,472,325 $17,075,000 -35.5% Boundaries: West Quincy Avenue to West Bowles Avenue January through March 2022 2023 % Change # of Properties Sold 3 3 0.0% Average Price Per Square Foot $705 $785 11.3% Average Days on Market 4 19 375.0% Highest Price $2,350,000 $2,050,000 -12.8% Average List Price $1,900,000 $2,023,333 6.5% Average Sale Price $2,033,333 $1,961,667 -3.5% % Sold Price to List Price 111.9% 96.1% -14.1% Total Dollar Volume $6,100,000 $5,885,000 -3.5%
BOW MAR/BOW MAR SOUTH
16.1%
The average home sale price in Cherry Creek North increased by 16.1% in the first quarter of 2023 compared to that of 2022.
24.8%
The average list price in Cherry Hills Village (over 1 acre) increased by 24.8% in the first quarter of 2023 compared to that of 2022.
5 CHERRY HILLS VILLAGE CHERRY HILLS VILLAGE CHERRY CREEK NORTH Boundaries: York to Colorado; 1st Avenue to 6th Avenue January through March 2022 2023 % Change # of Properties Sold 25 22 -12.0% Average Price Per Square Foot $822 $822 0.0% Average Days on Market 41 24 -41.5% Highest Price $9,000,000 $5,700,000 -36.7% Average List Price $2,522,104 $2,786,714 10.5% Average Sale Price $2,309,915 $2,681,171 16.1% % Sold Price to List Price 98.3% 96.9% -1.5% Total Dollar Volume $57,747,880 $58,985,761 2.1% (Over 1 Acre, $2M+) Boundaries: Hampden to Belleview; Clarkson to Happy Canyon Road and Charlou January through March 2022 2023 % Change # of Properties Sold 14 9 -35.7% Average Price Per Square Foot $782 $855 9.2% Average Days on Market 43 53 23.3% Highest Price $9,000,000 $8,000,000 -11.1% Average List Price $4,171,923 $5,206,250 24.8% Average Sale Price $4,217,429 $4,862,944 15.3% % Sold Price to List Price 97.5% 94.8% -2.8% Total Dollar Volume $59,044,000 $43,766,500 -25.9% (Under 1 Acre, $2M+) Boundaries: Hampden to Belleview; Clarkson to Happy Canyon Road and Charlou January through March 2022 2023 % Change # of Properties Sold 8 14 75.0% Average Price Per Square Foot $720 $723 0.4% Average Days on Market 4 35 775.0% Highest Price $7,100,000 $5,225,000 -26.4% Average List Price $2,555,000 $2,745,493 7.5% Average Sale Price $2,832,113 $2,915,357 2.9% % Sold Price to List Price 112.5% 103.4% -8.1% Total Dollar Volume $22,656,905 $40,815,000 80.1%
The number of properties sold in Columbine Valley increased by 350.0% in the first quarter of 2023 compared to that of 2022.
24.5%
The highest sale price in Crestmoor increased by 24.5% in the first quarter of 2023 compared to that of 2022.
6 January through March 2022 2023 % Change # of Properties Sold 4 2 -50.0% Average Price Per Square Foot $729 $741 1.7% Average Days on Market 19 7 -63.2% Highest Price $2,150,000 $2,350,000 9.3% Average List Price $1,881,250 $2,245,000 19.3% Average Sale Price $1,808,750 $2,124,144 17.4% % Sold Price to List Price 91.1% 90.6% -0.5% Total Dollar Volume $7,235,000 $4,248,287 -41.3% COLUMBINE VALLEY Boundaries: South Polo Ridge Drive to West Bowles; Platte Canyon Road to South Platte River COUNTRY CLUB January through March 2022 2023 % Change # of Properties Sold 2 9 350.0% Average Price Per Square Foot $555 $513 -7.7% Average Days on Market 3 33 1,000.0% Highest Price $2,925,000 $2,400,000 -17.9% Average List Price $2,525,000 $1,827,487 -27.6% Average Sale Price $2,672,500 $1,809,204 -32.3% % Sold Price to List Price 105.8% 95.9% -9.3% Total Dollar Volume $5,345,000 $16,282,835 204.6% Boundaries: University to Downing 1st - 4th; Race to University 4th - 6th Boundaries: Holly to Monaco; Bayaud to 6th Avenue January through March 2022 2023 % Change # of Properties Sold 5 2 -60.0% Average Price Per Square Foot $682 $742 8.8% Average Days on Market 7 10 42.9% Highest Price $3,895,000 $4,851,000 24.5% Average List Price $2,123,000 $2,937,500 38.4% Average Sale Price $2,263,100 $3,017,000 33.3% % Sold Price to List Price 109.8% 96.9% -11.7% Total Dollar Volume $11,315,500 $6,034,000 -46.7% CRESTMOOR 350%
97.9%
The highest sale price in Greenwood Village West (over
acre) increased by 97.9% in the first quarter of 2023 compared to that of 2022.
3.2%
The average price per square foot in Greenwood Village West (under 1 acre) increased by 3.2% in the first quarter of 2023 compared to that of 2022.
7 GREENWOOD VILLAGE WEST GREENWOOD VILLAGE WEST GREENWOOD VILLAGE EAST Boundaries: I-25 to Havana; Belleview to Orchard January through March 2022 2023 % Change # of Properties Sold 5 3 -40.0% Average Price Per Square Foot $548 $580 5.8% Average Days on Market 7 20 185.7% Highest Price $2,200,000 $2,025,000 -8.0% Average List Price $1,580,000 $1,481,333 -6.2% Average Sale Price $1,670,200 $1,496,666 -10.4% % Sold Price to List Price 106.2% 99.1% -6.6% Total Dollar Volume $8,351,000 $4,489,999 -46.2% (Over 1 Acre) Boundaries: Orchard to Belleview; Clarkson to I-25 January through March 2022 2023 % Change # of Properties Sold 1 3 200.0% Average Price Per Square Foot $697 $602 -13.5% Average Days on Market 2 39 1,850.0% Highest Price $2,400,000 $4,750,000 97.9% Average List Price $2,300,000 $1,850,000 -19.6% Average Sale Price $2,400,000 $2,800,000 16.7% % Sold Price to List Price 104.4% 92.1% -11.8% Total Dollar Volume $2,400,000 $8,400,000 250.0% (Under 1 Acre) Boundaries: Orchard to Belleview; Clarkson to I-25 January through March 2022 2023 % Change # of Properties Sold 12 11 -8.3% Average Price Per Square Foot $618 $637 3.2% Average Days on Market 17 17 0.0% Highest Price $6,725,000 $3,500,000 -48.0% Average List Price $2,684,500 $2,488,900 -7.3% Average Sale Price $2,746,992 $2,430,455 -11.5% % Sold Price to List Price 104.0% 99.2% -4.6% Total Dollar Volume $32,963,900 $26,735,000 -18.9%
1
5.0%
The highest sale price in Hilltop increased by 5.0% in the first quarter of 2023 compared to that of 2022.
11.8%
The average price per square foot in Ken Caryl North Ranch increased by 11.8% in the first quarter of 2023 compared to that of 2022.
8 HILLTOP Boundaries: Alameda to 6th; Colorado to Holly HUNTINGTON TRAILS/LEXINGTON January through March 2022 2023 % Change # of Properties Sold 13 8 -38.5% Average Price Per Square Foot $745 $594 -20.2% Average Days on Market 5 45 800.0% Highest Price $4,000,000 $4,200,000 5.0% Average List Price $2,296,154 $2,300,000 0.2% Average Sale Price $2,389,362 $2,181,531 -8.7% % Sold Price to List Price 105.1% 92.6% -12.0% Total Dollar Volume $31,061,700 $17,452,250 -43.8% Boundaries: Lexington Place to 144th Avenue; McKay Lake to Huron Street January through March 2022 2023 % Change # of Properties Sold 4 No SalesAverage Price Per Square Foot $546 -Average Days on Market 2 -Highest Price $3,000,000 -Average List Price $1,853,250 -Average Sale Price $2,115,000 -% Sold Price to List Price 114.1% -Total Dollar Volume $8,460,000 -Boundaries: Red Fox Lane to North Ranch Road; Golden Eagle Road to Blue Grouse Ridge Road January through March 2022 2023 % Change # of Properties Sold 2 2 0.0% Average Price Per Square Foot $423 $473 11.8% Average Days on Market 9 0 -100.0% Highest Price $2,127,500 $1,900,000 -10.7% Average List Price $1,925,000 $1,750,000 -9.1% Average Sale Price $1,938,750 $1,750,000 -9.7% % Sold Price to List Price 100.7% 100.0% -0.7% Total Dollar Volume $3,877,500 $3,500,000 -9.7%
KEN CARYL NORTH RANCH
14.2%
The average list price in Mayfair/ Montclair increased by 14.2% in the first quarter of 2023 compared to that of 2022.
Polo Reserve is located in Littleton Colorado. This community is located in a gated, secluded area, Cooley Lake and Columbine Polo Club. This is a great neighborhood for residents into equestrian riding, being around horses & polo.
9 POLO RESERVE OBSERVATORY PARK MAYFAIR/MONTCLAIR Boundaries: Colorado to Quebec; 6th to Colfax January through March 2022 2023 % Change # of Properties Sold 12 3 -75.0% Average Price Per Square Foot $562 $620 10.3% Average Days on Market 6 30 400.0% Highest Price $2,430,000 $2,000,000 -17.7% Average List Price $1,430,250 $1,633,333 14.2% Average Sale Price $1,470,080 $1,578,333 7.4% % Sold Price to List Price 104.4% 95.0% -9.0% Total Dollar Volume $17,640,960 $4,735,000 -73.2% Boundaries: University to Colorado; Evans to Yale January through March 2022 2023 % Change # of Properties Sold 11 9 -18.2% Average Price Per Square Foot $679 $657 -3.3% Average Days on Market 23 71 208.7% Highest Price $3,500,000 $3,931,934 12.3% Average List Price $2,411,273 $2,634,111 9.2% Average Sale Price $2,482,235 $2,559,175 3.1% % Sold Price to List Price 103.3% 89.2% -13.6% Total Dollar Volume $27,304,584 $23,032,574 -15.6% Boundaries: North of Mineral; South of Arabian Place; West of the S Platte River; East of S. Platte Canyon Road January through March 2022 2023 % Change # of Properties Sold No Sales No SalesAverage Price Per Square Foot - -Average Days on Market - -Highest Price - -Average List Price - -Average Sale Price - -% Sold Price to List Price - -Total Dollar Volume - - -
The total sales volume in Spruce Meadows increased by 45.5% in the first quarter of 2023 compared to that of 2022.
10 SPRUCE MEADOWS Boundaries: Federal Blvd to Zuni Street; High Prairie Way to 156th Avenue WASHINGTON PARK EAST/CENTRAL January through March 2022 2023 % Change # of Properties Sold 1 2 100.0% Average Price Per Square Foot $491 $530 7.8% Average Days on Market 8 74 825.0% Highest Price $2,750,000 $2,100,000 -23.6% Average List Price $2,850,000 $2,100,000 -26.3% Average Sale Price $2,750,000 $2,100,000 -23.6% % Sold Price to List Price 96.5% 90.9% -5.8% Total Dollar Volume $2,750,000 $4,000,000 45.5% Boundaries: Louisiana to Ellsworth, Ogden to University January through March 2022 2023 % Change # of Properties Sold 28 29 3.6% Average Price Per Square Foot $938 $834 -11.1% Average Days on Market 19 41 115.8% Highest Price $3,615,000 $5,150,000 42.5% Average List Price $2,002,214 $2,241,250 11.9% Average Sale Price $2,105,881 $2,176,345 3.3% % Sold Price to List Price 106.4% 96.4% -9.4% Total Dollar Volume $58,964,671 $63,114,000 7.0%
45.5%
SOUTH METRO LUXURY MARKET
The South Metro luxury home market offers consumers more space than can typically be found near the city with just as many entertainment, outdoor activity, and shopping options. For this reason, the collection of neighborhoods that make up South Metro has become a popular place to invest in luxury properties.
Douglas County, which makes up much of the South Metro community, saw a 27.0% decrease in the number of luxury properties sold, however the luxury properties sold on average 2.0% higher compared to last year.
Out of the eight luxury neighborhoods within the South Metro community, The Village at Castle Pines saw the most luxury home sales. Here, there were 28 homes sold.
Luxury homes within the Backcountry neighborhood appreciated in price the most this quarter. Here, luxury homes sold for an average price of $1,919,900, a 14.2% increase from the same time period last year. This price increase is influenced by an impressive sale that closed for $3,600,000.
11
Based
from REColorado on March 5, 2023. REColorado
not guarantee
is in any way
its
Data
by REColorado may not reflect all real estate activity in the market.
on $1,000,000+ sales in Douglas County. Based on information from REColorado. This representation is based in whole or in part on data supplied
does
nor
responsible for
accuracy.
maintained
January through March 2022 2023 % Change # of Properties Sold 248 181 -27.0% Average Price Per Square Foot $455 $479 5.2% Average Days on Market 24 55 129.2% Highest Price $8,040,000 $4,200,000 -47.8% Average List Price $1,465,491 $1,556,291 6.2% Average Sale Price $1,523,585 $1,554,808 2.0% % Sold Price to List Price 101.1% 96.2% -4.8% Total Dollar Volume $377,849,043 $281,420,261 -25.5% Douglas County SOUTH METRO + $1,000,000 Sales
ESTATES
3.8%
The average price per square foot in Falcon Hills decreased by 3.8% in the first quarter of 2023 compared to that of 2022.
Heritage Estates is a community located in Lone Tree Colorado. This community began development early to mid 1990’s and continued development over the next ten years or more. Heritage Estates is located on and is built around the fairways of the Lone Tree Golf Course.
12 BACKCOUNTRY Boundaries: South of Wildcat Reserve Pkwy; East of Weathersfield Way, West of Red Sun Ct FALCON
January through March 2022 2023 % Change # of Properties Sold 9 10 11.1% Average Price Per Square Foot $493 $519 5.3% Average Days on Market 10 48 380.0% Highest Price $2,360,000 $3,600,000 52.5% Average List Price $1,624,433 $1,987,290 22.3% Average Sale Price $1,681,100 $1,919,900 14.2% % Sold Price to List Price 103.7% 93.1% -10.3% Total Dollar Volume $15,129,900 $19,199,000 26.9% January through March 2022 2023 % Change # of Properties Sold 1 1 0.0% Average Price Per Square Foot $453 $436 -3.8% Average Days on Market 4 5 25.0% Highest Price $2,250,000 $1,469,000 -34.7% Average List Price $2,000,000 $1,469,000 -26.6% Average Sale Price $2,250,000 $1,469,000 -34.7% % Sold Price to List Price 112.5% 100.0% -11.1% Total Dollar Volume $2,250,000 $1,469,000 -34.7% January through March 2022 2023 % Change # of Properties Sold No Sales 4Average Price Per Square Foot - $431Average Days on Market - 222Highest Price - $1,940,000Average List Price - $1,852,000Average Sale Price - $1,722,500% Sold Price to List Price - 88.0%Total Dollar Volume - $6,890,000 - HERITAGE
HILLS
0.6%
The average price per square foot in Keene Ranch increased by 0.6% in the first quarter of
compared to that of
16.1%
increased by
13 RAVENNA KEENE RANCH HERITAGE HILLS January through March 2022 2023 % Change # of Properties Sold 5 4 -20.0% Average Price Per Square Foot $453 $394 -13.0% Average Days on Market 1 51 5,000.0% Highest Price $2,055,000 $1,525,039 -25.8% Average List Price $1,593,663 $1,250,028 -21.6% Average Sale Price $1,642,578 $1,228,135 -25.2% % Sold Price to List Price 102.8% 95.7% -6.9% Total Dollar Volume $8,212,890 $4,912,539 -40.2% Boundaries: South Butte Circle to Castle Butte Drive; South Peak View Drive to West Tomah Road January through March 2022 2023 % Change # of Properties Sold 4 2 -50.0% Average Price Per Square Foot $532 $535 0.6% Average Days on Market 26 28 7.7% Highest Price $2,892,000 $1,575,000 -45.5% Average List Price $1,783,975 $1,412,000 -20.9% Average Sale Price $1,775,500 $1,375,000 -22.6% % Sold Price to List Price 94.3% 97.8% 3.7% Total Dollar Volume $7,102,000 $2,750,000 -61.3% January through March 2022 2023 % Change # of Properties Sold 2 3 50.0% Average Price Per Square Foot $854 $904 5.8% Average Days on Market 90 150 66.7% Highest Price $1,925,000 $2,551,000 32.5% Average List Price $1,937,000 $2,248,000 16.1% Average Sale Price $1,912,500 $2,193,833 14.7% % Sold Price to List Price 102.1% 98.2% -3.7% Total Dollar Volume $3,825,000 $6,581,500 72.1%
2023
2022.
Ravenna
16.1%
2023
2022.
The average list price in
in the first quarter of
compared to that of
Spirit Ridge is a custom home community located south east of Main street in Parker, Colorado. Homes here range from the upper 700’s to multi-million dollar estates. Most of the homes here are situated on one or two acre parcels. There are a healthy mix of two story and ranch style homes here.

14
THE VILLAGE
CASTLE
January through March 2022 2023 % Change # of Properties Sold No Sales No SalesAverage Price Per Square Foot - -Average Days on Market - -Highest Price - -Average List Price - -Average Sale Price - -% Sold Price to List Price - -Total Dollar Volume - -Boundaries: US 85 & Copper Blush to Northwood; Daniels Park to Gate 5, Country Club to I-25 January through March 2022 2023 % Change # of Properties Sold 20 28 40.0% Average Price Per Square Foot $546 $579 6.1% Average Days on Market 19 71 273.7% Highest Price $3,800,000 $3,616,200 -4.8% Average List Price $1,859,500 $2,035,500 9.5% Average Sale Price $1,861,380 $1,959,648 5.3% % Sold Price to List Price 101.8% 92.3% -9.3% Total Dollar Volume $37,227,605 $54,870,150 47.4%
SPIRIT RIDGE
AT
PINES
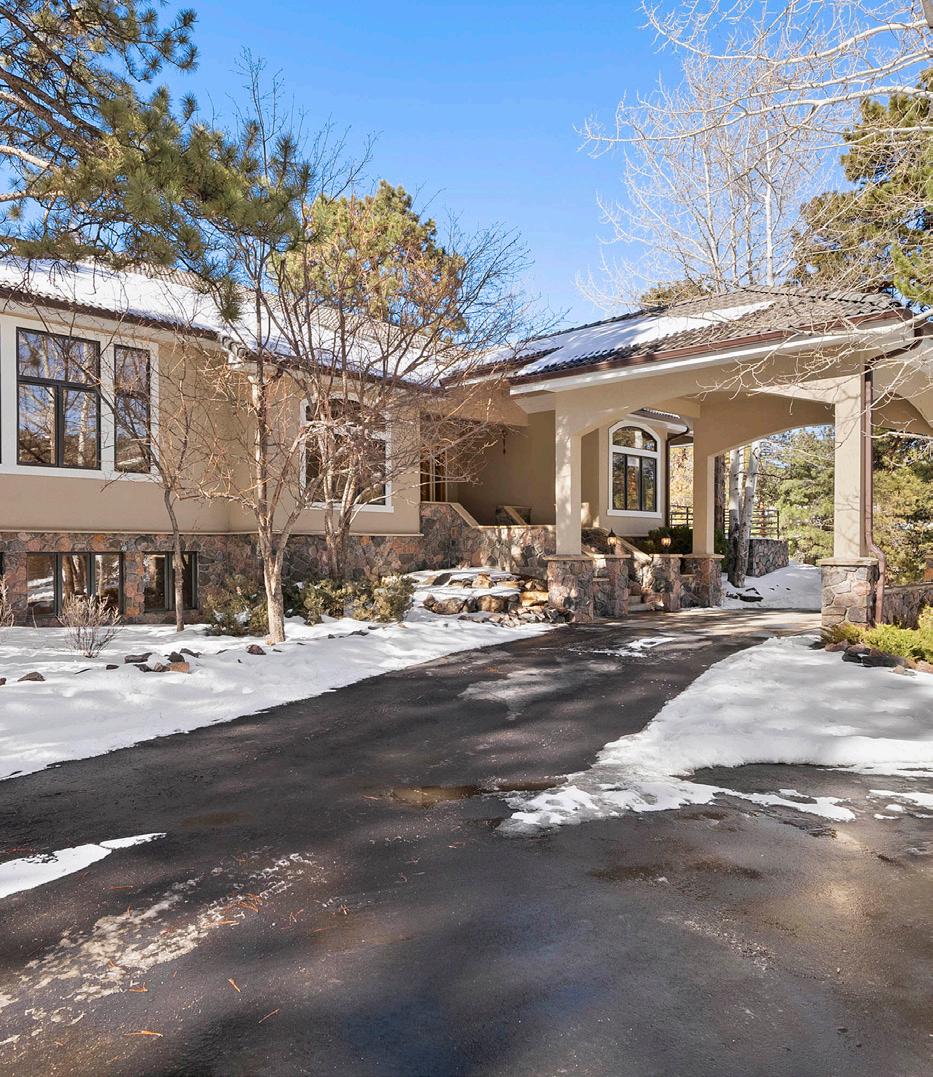
FOOTHILLS LUXURY MARKET
The Foothills is a community beloved for its nearness to nature and captivating views of the Front Range. As a whole, the number of luxury listings sold through March 2023, compared to the same time period in 2022, decreased 31.9%, totaling 141 luxury homes sold. While rising interest rates mean that buyers have less purchasing power and sellers have come down ever so slightly on pricing, limited inventory and high demand still give sellers a lot of control in this market. During the first quarter of the year, the average price for a single-family home in Jefferson County was $1,445,666—down 0.1% from 2022. This community has seen prices remain relatively flat through March, thanks to consumers’ need for lifestyle-focused, luxury homes in the Foothills.

Genesee saw the most luxury properties sold through December of this year, totaling 7 homes sold—a 75.0% decrease. This community also saw only a slight increase on days on market. Through March, the average days on market for local luxury homes reached 36 days, compared to 30 days last year.
Riva Chase saw one of the most notable appreciations in the average sale price for luxury homes in the Foothills. Luxury single-family homes in this community increased in average sold price by 16.2%, bringing the average sold price to $1,670,000.
15
Based on $1,000,000+ sales in Jefferson County. Based on information from REColorado. This representation is based in whole or in part on data supplied from REColorado on March 5, 2023. REColorado does not guarantee nor is in
any way responsible for its accuracy. Data maintained by REColorado may not reflect all real estate activity in the market.
January through March 2022 2023 % Change # of Properties Sold 207 141 -31.9% Average Price Per Square Foot $517 $493 -4.6% Average Days on Market 20 41 105.0% Highest Price $5,000,000 $3,875,000 -22.5% Average List Price $1,370,557 $1,363,261 -0.5% Average Sale Price $1,446,926 $1,445,666 -0.1% % Sold Price to List Price 104.2% 97.9% -6.0% Total Dollar Volume $299,513,630 $203,838,896 -31.9% FOOTHILLS Jefferson County
Sales
+ $1,000,000
Hangen Ranch primarily consists of horse properties with gentle pastures, Aspen trees, mountain views and sunshine abound this gorgeous neighborhood. Hangen Ranch is centrally located in between Evergreen and Conifer.
5.1% The average price per square foot in Ridge at Hiwan increased by 5.1% in the first quarter of 2023 compared to that of 2022.
16 GENESEE HANGEN RANCH January through March 2022 2023 % Change # of Properties Sold 4 7 75.0% Average Price Per Square Foot $568 $500 -12.0% Average Days on Market 30 36 20.0% Highest Price $2,369,080 $1,975,000 -16.6% Average List Price $1,772,475 $1,389,286 -21.6% Average Sale Price $1,706,020 $1,367,500 -19.8% % Sold Price to List Price 98.5% 96.4% -2.2% Total Dollar Volume $6,824,080 $9,572,500 40.3% January through March 2022 2023 % Change # of Properties Sold No Sales No SalesAverage Price Per Square Foot - -Average Days on Market - -Highest Price - -Average List Price - -Average Sale Price - -% Sold Price to List Price - -Total Dollar Volume - -January through March 2022 2023 % Change # of Properties Sold 3 3 0.0% Average Price Per Square Foot $468 $492 5.1% Average Days on Market 4 35 775.0% Highest Price $2,050,000 $1,725,000 -15.9% Average List Price $1,788,333 $1,507,500 -15.7% Average Sale Price $1,791,000 $1,564,000 -12.7% % Sold Price to List Price 100.7% 90.4% -10.3% Total Dollar Volume $5,373,000 $4,692,000 -12.7% RIDGE AT HIWAN
22.0%
The average list price in Riva Chase increased by 22.0% in the first quarter of 2023 compared to that of 2022.
17 RIVA CHASE January through March 2022 2023 % Change # of Properties Sold 2 2 0.0% Average Price Per Square Foot $370 $420 13.6% Average Days on Market 3 105 3,400.0% Highest Price $1,510,000 $1,950,000 29.1% Average List Price $1,362,500 $1,662,500 22.0% Average Sale Price $1,437,500 $1,670,000 16.2% % Sold Price to List Price 105.6% 88.4% -16.3% Total Dollar Volume $2,875,000 $3,340,000 16.2% SODA CREEK January through March 2022 2023 % Change # of Properties Sold 1 3 200.0% Average Price Per Square Foot $307 $478 55.6% Average Days on Market 116 0 -100.0% Highest Price $1,285,000 $2,345,000 82.5% Average List Price $1,395,000 $2,500,000 79.2% Average Sale Price $1,285,000 $2,044,692 59.1% % Sold Price to List Price 85.7% 82.8% -3.4% Total Dollar Volume $1,285,000 $6,134,076 377.4% January through March 2022 2023 % Change # of Properties Sold No Sales No SalesAverage Price Per Square Foot - -Average Days on Market - -Highest Price - -Average List Price - -Average Sale Price - -% Sold Price to List Price - -Total Dollar Volume - -SPRING RANCH
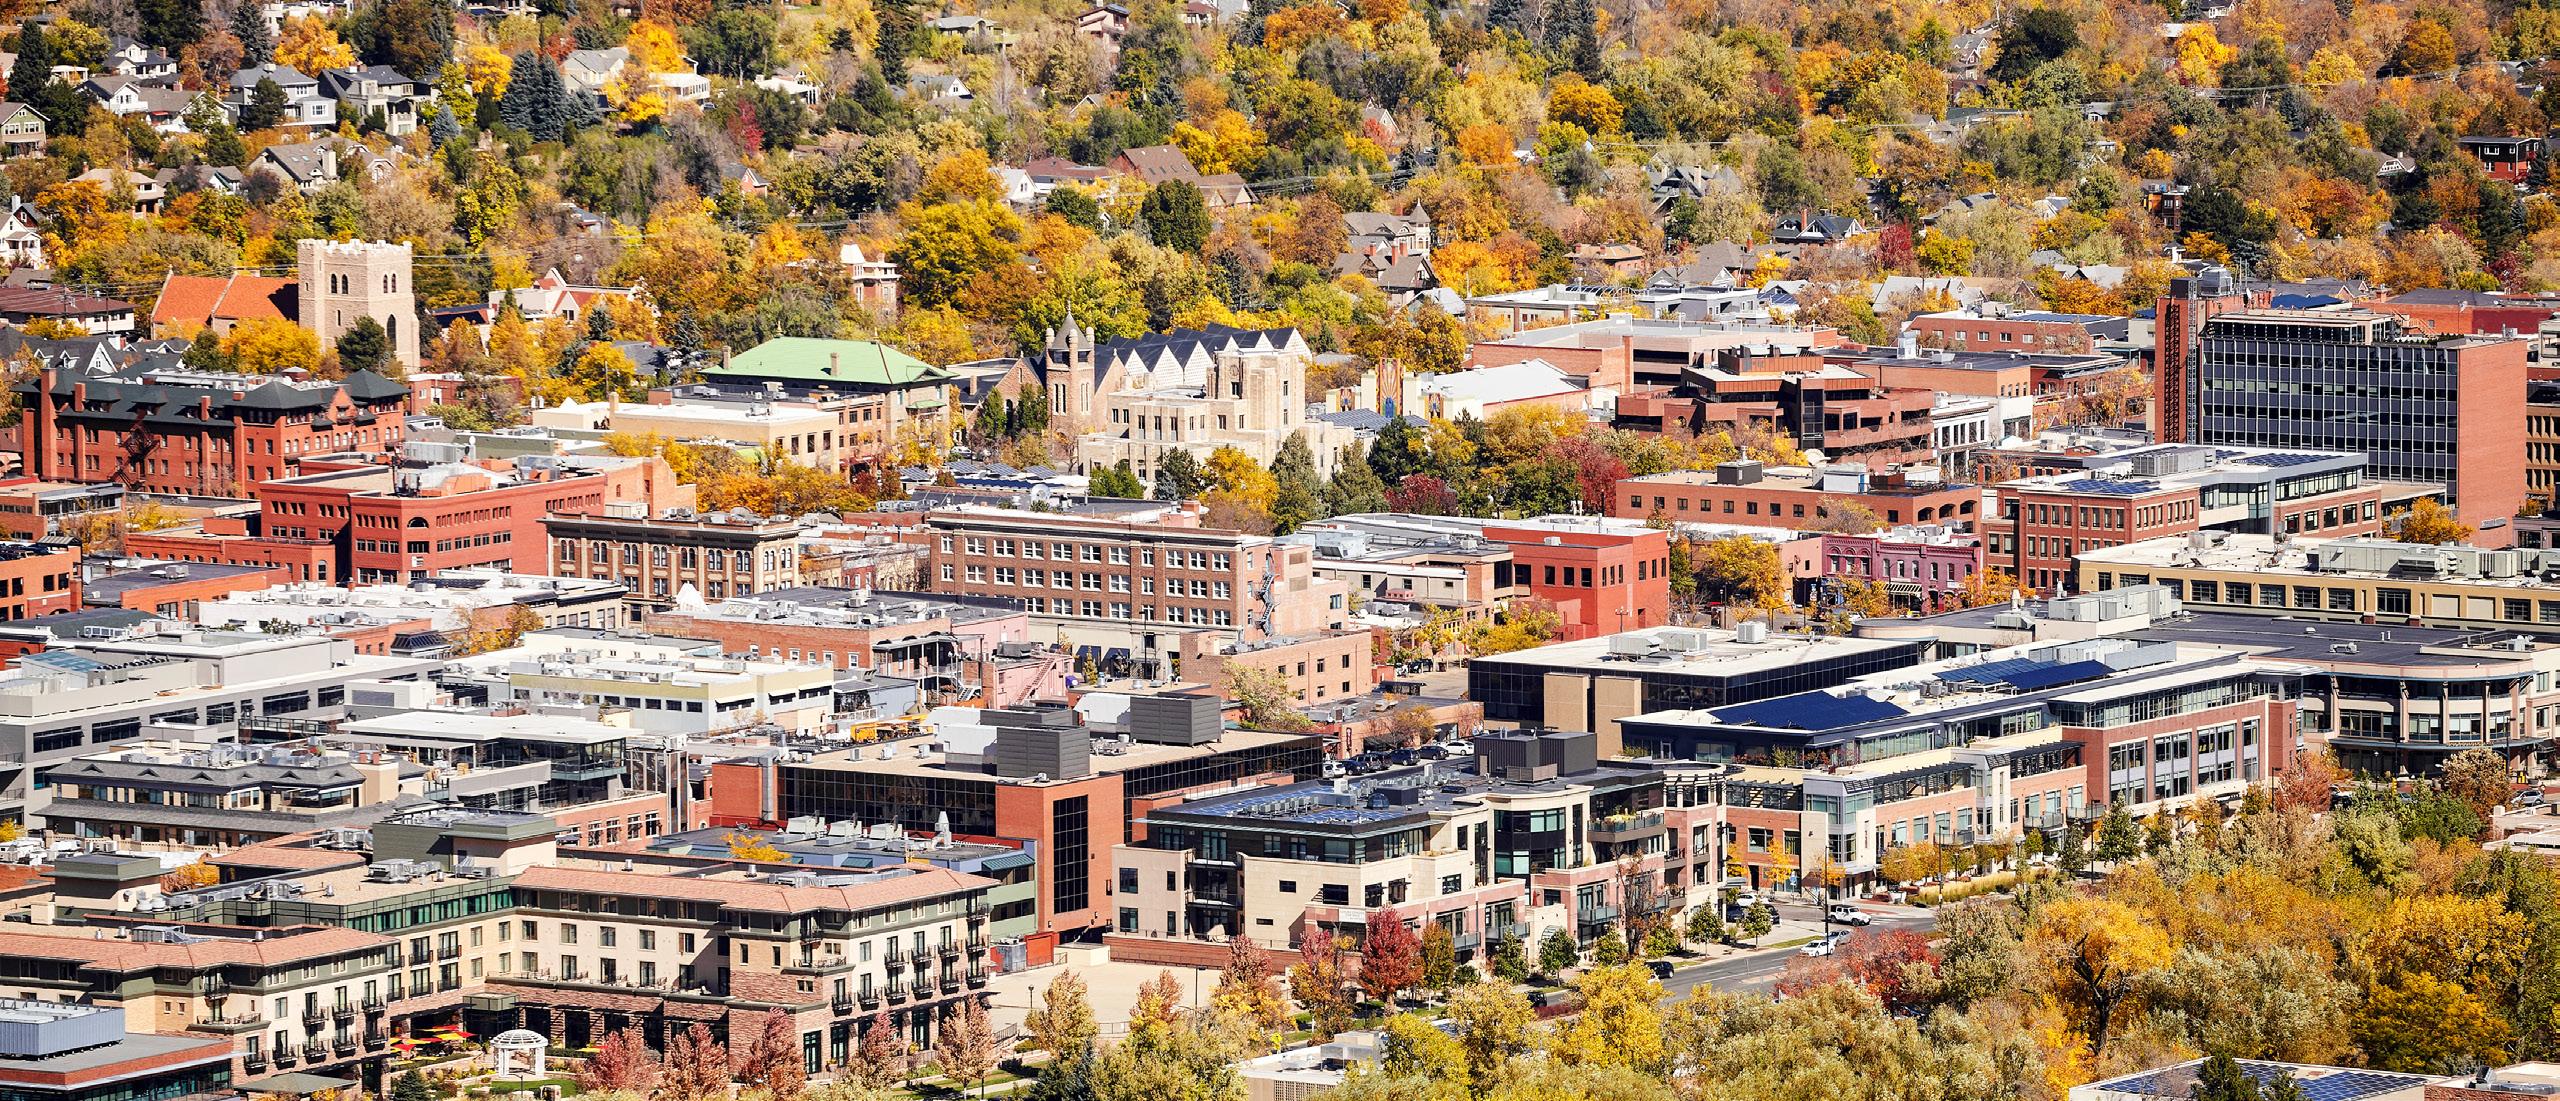
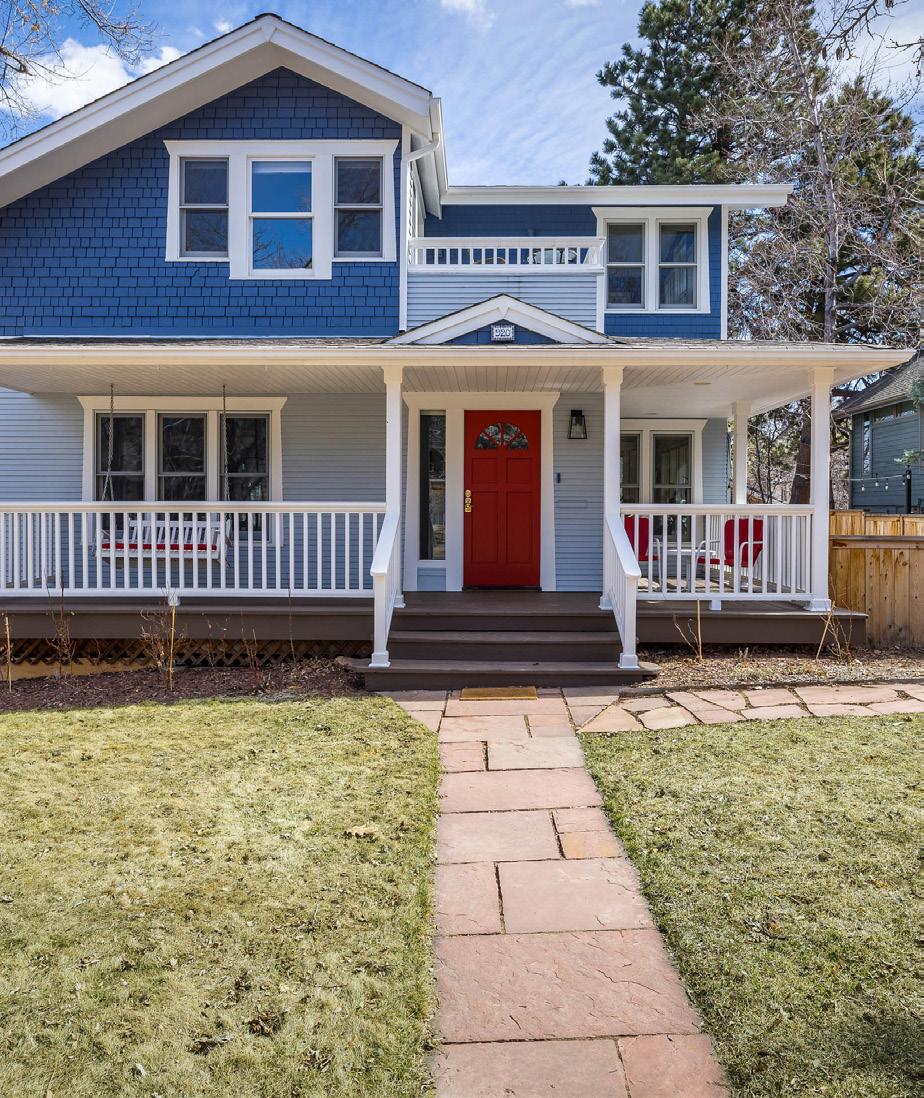
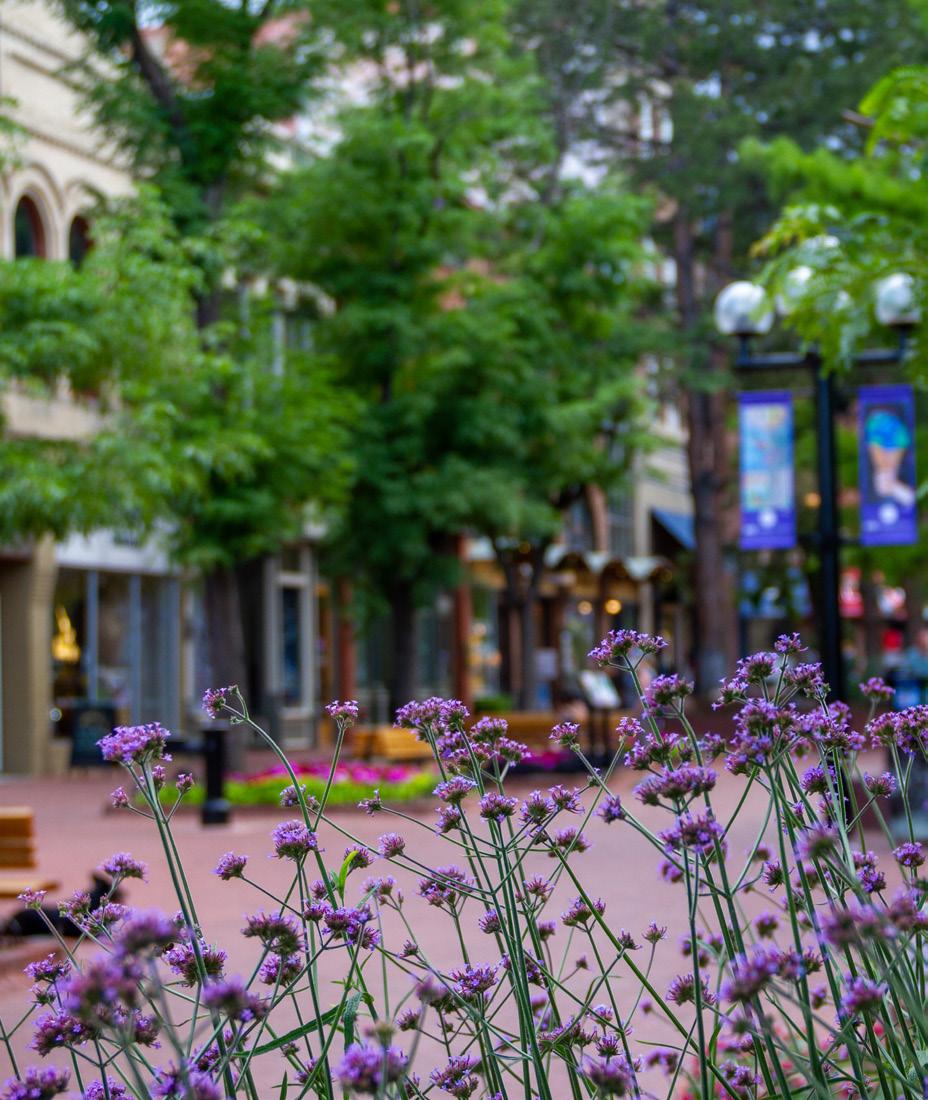
BOULDER LUXURY MARKET
Boulder County is an eclectic community filled with plenty of natural spaces, a lively restaurant and entertainment scene, and one of the most desirable lifestyles in the country. Recently ranked as the No. 1 city in the nation to live in by U.S. News & World Report, Boulder is a popular destination for buying and selling luxury real estate.
Overall, Boulder County has seen a 25.7% decrease in the number of luxury properties sold in the first quarter of 2023 compared to 2022. However, the average sale price for luxury homes in this area increased by 8.5%, bringing the average price for local luxury properties to $2,052,842.
Looking at individual neighborhoods, University Hill and Chautauqua had the most impressive increase in average sales price. The average sale price for luxury homes was $2,979,510, which is 34.5% more than the same time period of 2022. This community also saw an impressive sale of $9,810,000, which may have contributed to this impressive gain.
The speed of the luxury real estate market throughout Boulder County decreased compared to the first quarter of 2022. Downtown Boulder had the quickest pace of sale out of the local luxury markets with homes remaining on the market for an average of just 46 days. Other neighborhoods saw slightly longer average days on market for luxury homes, such as Boulder County Plains where homes spent 70 days on the market.
18
Based on $1,000,000+ sales in Boulder County. Based on information from IRES, LLC. This representation is based in whole or in part on data supplied by IRES, LLC on March 5, 2023. IRES, LLC does not guarantee nor is in any way responsible for its accuracy. Data maintained by IRES,LLC may not reflect all real estate activity in the market.
+ $1,000,000 Sales January through March 2022 2023 % Change # of Properties Sold 167 124 -25.7% Average Days on Market 64 76 18.8% Highest Price $10,000,000 $9,810,000 -2.0% Average Sale Price $1,891,816 $2,052,842 8.5% % Sold Price to List Price 102.8% 97.7% -4.9% Total Dollar Volume $315,933,193 $254,552,431 -19.4%
Boulder County
BOULDER
22.8%
The average number of days on market in Boulder County Plains increased by 22.8% January through March 2023 compared to that of 2022.
19 DOWNTOWN BOULDER BOULDER COUNTY PLAINS BOULDER (CITY) January through March 2022 2023 % Change # of Properties Sold 368 270 -26.6% Average Days on Market 64 76 18.8% Highest Price $5,590,000 $9,810,000 75.5% Average Sale Price $1,180,176 $1,273,814 7.9% % Sold Price to List Price 102.8% 97.9% -4.8% Total Dollar Volume $434,304,951 $343,929,796 -20.8% Niwot, Somerset Meadows, White Hawk Ranch, Fairview Estates, Paragon Estates, Spanish Hills
January through March 2022 2023 % Change # of Properties Sold 58 39 -32.8% Average Days on Market 57 70 22.8% Highest Price $10,000,000 $3,650,000 -63.5% Average Sale Price $1,951,318 $1,795,107 -8.0% % Sold Price to List Price 101.0% 96.4% -4.6% Total Dollar Volume $113,176,436 $70,009,181 -38.1% January through March 2022 2023 % Change # of Properties Sold 7 6 -14.3% Average Days on Market 116 46 -60.3% Highest Price $3,800,000 $5,000,000 31.6% Average Sale Price $1,967,143 $2,261,239 15.0% % Sold Price to List Price 97.0% 97.7% 0.7% Total Dollar Volume $13,770,000 $13,567,435 -1.5%
The highest sale price in the Foothills Communities increased by 75.5% in the first quarter of 2023 compared to that of 2022.
20 FOOTHILLS COMMUNITIES Pinebrook Hills, Boulder Heights, Lake of the Pines, Jamestown, Eldorado Springs UNIVERSITY HILL & CHAUTAUQUA January through March 2022 2023 % Change # of Properties Sold 146 109 -25.3% Average Days on Market 65 81 24.6% Highest Price $5,590,000 $9,810,000 75.5% Average Sale Price $1,902,131 $2,083,215 9.5% % Sold Price to List Price 102.1% 97.7% -4.3% Total Dollar Volume $277,711,072 $227,070,431 -18.2% January through March 2022 2023 % Change # of Properties Sold 15 17 13.3% Average Days on Market 50 67 34.0% Highest Price $3,960,000 $9,810,000 147.7% Average Sale Price $2,215,000 $2,979,510 34.5% % Sold Price to List Price 99.9% 99.0% -0.8% Total Dollar Volume $33,225,000 $50,651,666 52.5%
75.5%
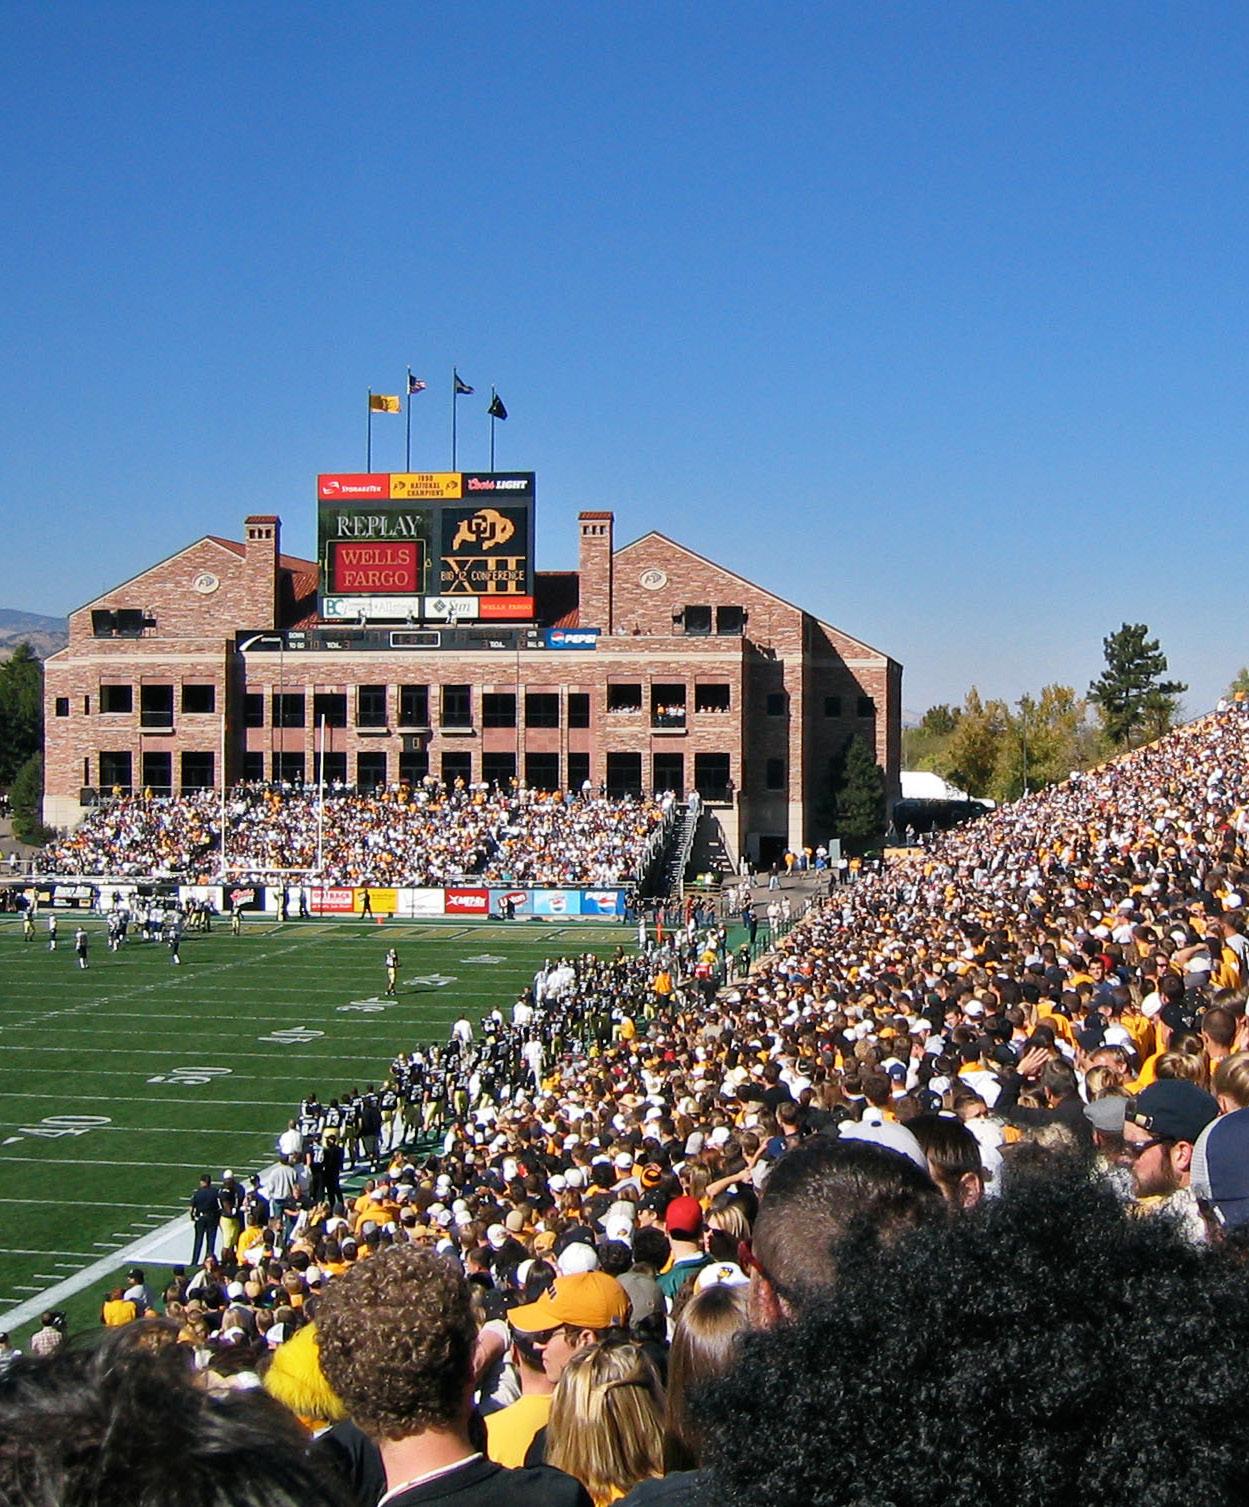
COLORADO SPRINGS LUXURY MARKET
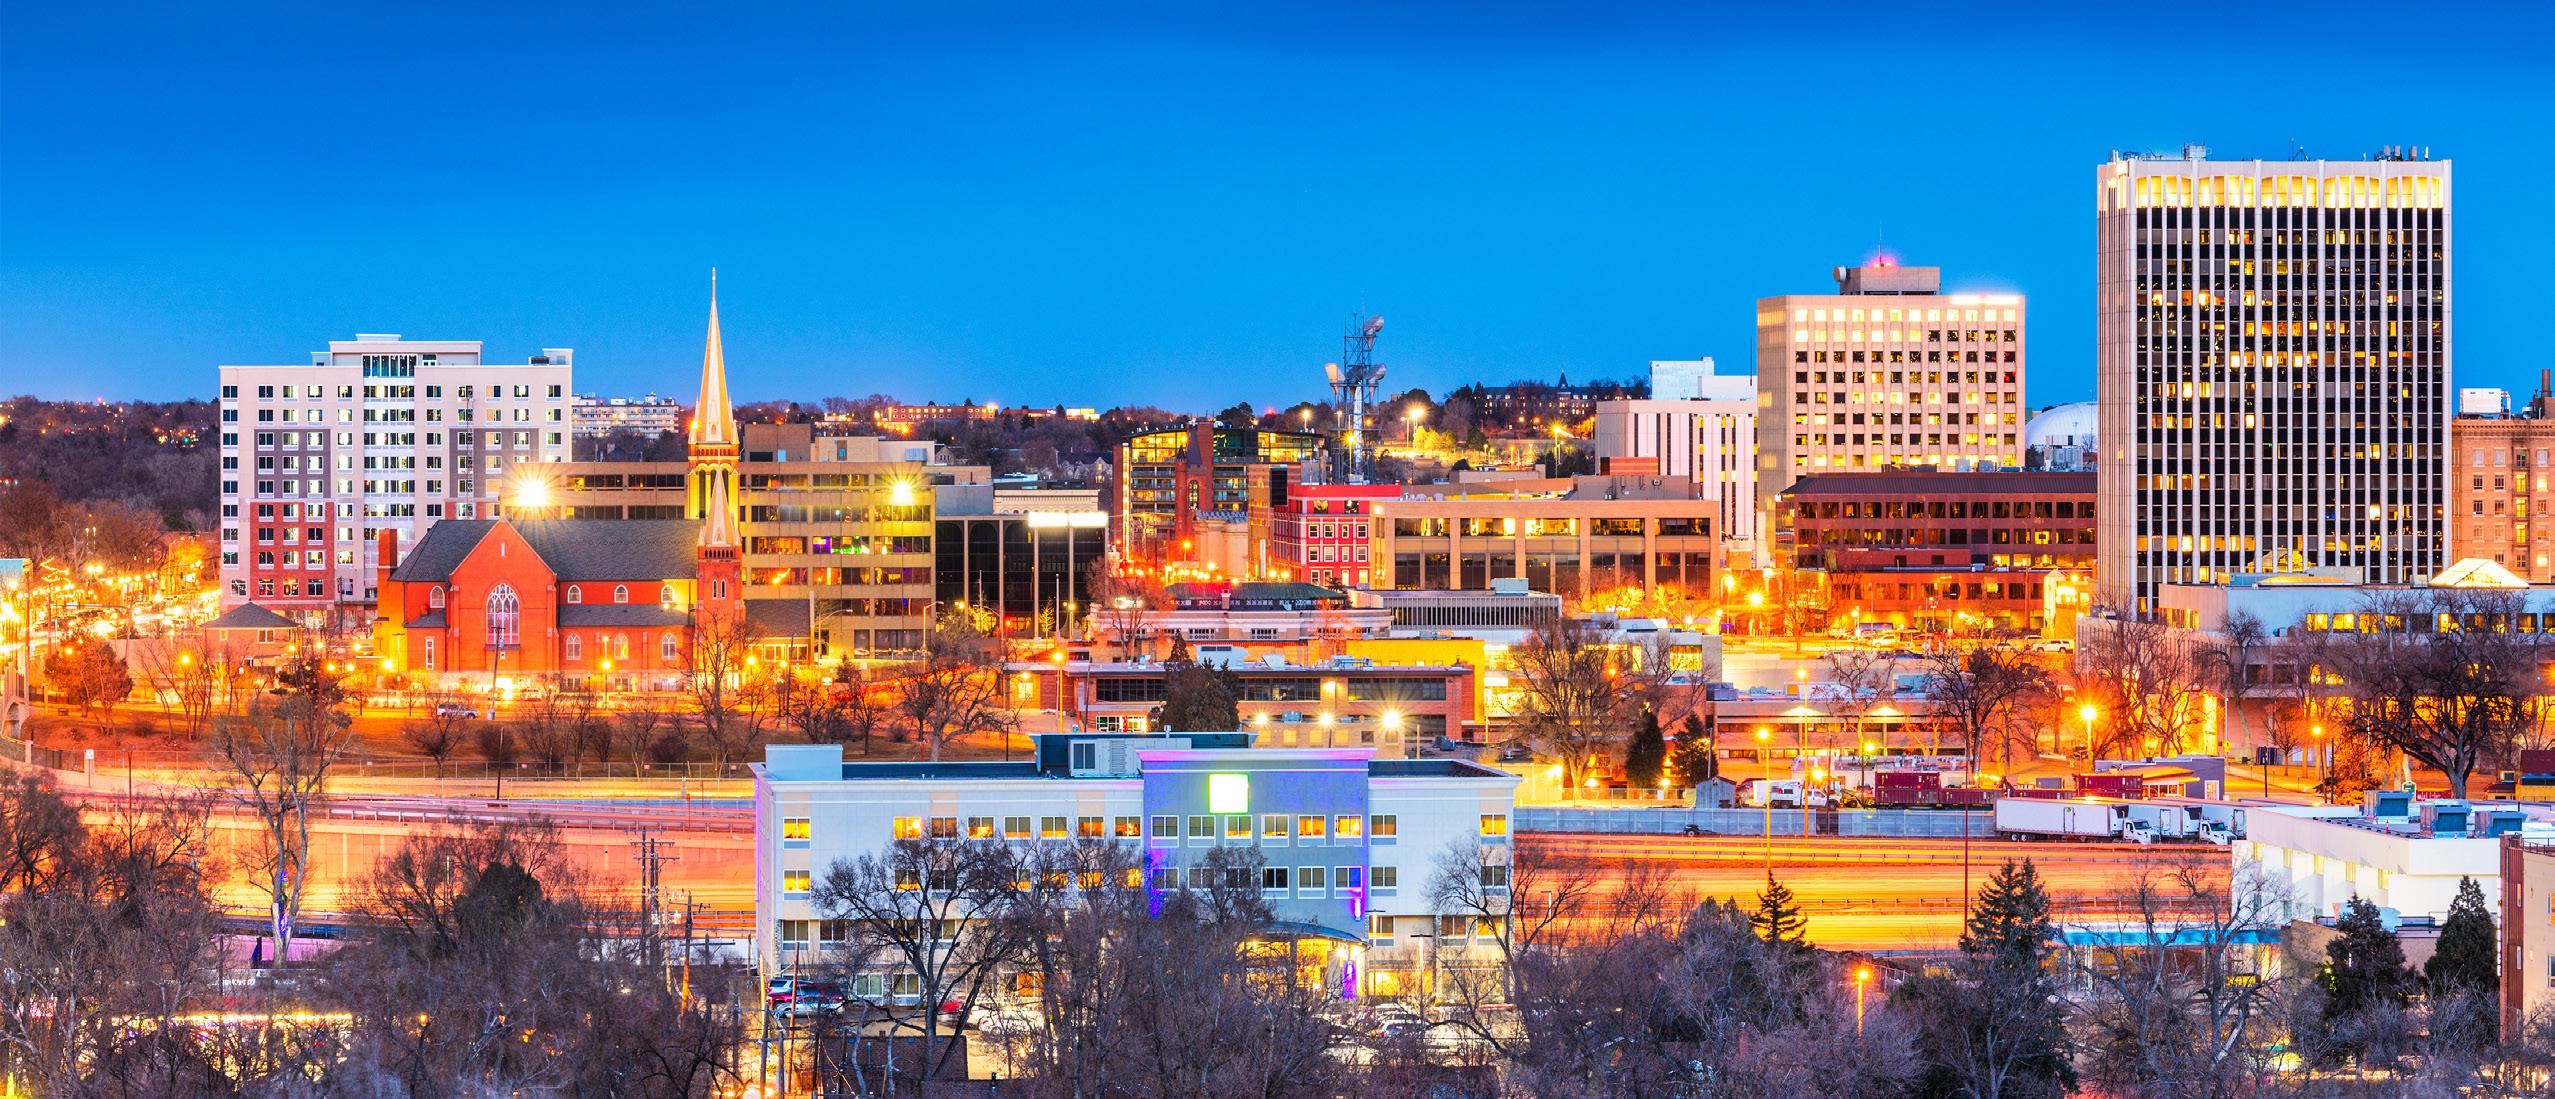
Located just an hour south of Denver, Colorado Springs is a city that combined the very best of natural beauty and an exciting urban lifestyle. Within the luxury real estate market of Colorado Springs, there was a 4.3% increase in the number of luxury homes sold within El Paso and Teller County in 2023 compared to 2022. There were 98 high-end homes sold in this community. The average sale price of those homes decreases by 12.9% which brought the average sale price to $1,290,554 for the area.
Looking at the quantity of luxury real estate sales within the various communities that make up Colorado Springs, Monument saw luxury home sales rise from 22 sales through 2022 to 29 sales this year —a 31.8% increase. The Black Forest neighborhood had an increase in the number of luxury home sales with a total of 26 homes sold for more than $1,000,000.
The speed of the luxury real estate market throughout Colorado Springs decreased compared to the first quarter 1 of 2022, the average days on market is 81 days—increased 5.0% year over year. Some individual neighborhoods experienced faster market speeds. For example, luxury homes in Black Forest remained on the market for an average of just 48 days through March–23.8% decrease.
21
Based on information from the Pikes Peak REALTOR® Services Corp. (“RSC”), for the period January 1, 2022 through March 5, 2023. RSC does not guarantee or is in any way responsible for its accuracy. Data maintained by RSC may not reflect all real estate activity in the market.
+ $1,000,000 Sales January through March 2022 2023 % Change Properties Sold 94 98 4.3% Average Price Per Square Foot $285 $272 -4.6% Average Days on Market 54 81 50.0% Highest Price $3,500,000 $3,000,000 -14.3% Average List Price $1,455,999 $1,382,275 -5.1% Average Sales Price $1,481,846 $1,290,554 -12.9% % Sold Price to List Price 99.2% 97.7% -1.5% Total Dollar Volume $139,293,524 $126,474,292 -9.2% COLORADO SPRINGS El Paso County & Teller County
13.0%
The number of properties sole in Black Forest increased by 13.0% in the first quarter of 2023 compared to that of 2022.
157.1%
The average price per square foot in Flying Horse decreased by 14.3% in the first quarter of 2023 compared to that of 2022.
22 BLACK FOREST BROADMOOR January through March 2022 2023 % Change Properties Sold 9 7 -22.2% Average Price Per Square Foot $266 $228 -14.3% Average Days on Market 28 72 157.1% Highest Price $1,992,500 $1,554,039 -22.0% Average List Price $1,332,562 $1,186,835 -10.9% Average Sales Price $1,394,405 $1,141,519 -18.1% % Sold Price to List Price 99.4% 95.9% -3.5% Total Dollar Volume $12,549,645 $7,990,633 -36.3% January through March 2022 2023 % Change Properties Sold 18 10 -44.4% Average Price Per Square Foot $265 $255 -3.8% Average Days on Market 92 78 -15.2% Highest Price $3,500,000 $3,000,000 -14.3% Average List Price $2,007,495 $1,550,709 -22.8% Average Sales Price $1,728,611 $1,575,500 -8.9% % Sold Price to List Price 97.8% 93.8% -4.1% Total Dollar Volume $31,114,998 $15,755,000 -49.4% January through March 2022 2023 % Change Properties Sold 23 26 13.0% Average Price Per Square Foot $292 $285 -2.4% Average Days on Market 63 48 -23.8% Highest Price $2,500,000 $2,100,000 -16.0% Average List Price $1,537,175 $1,432,201 -6.8% Average Sales Price $1,445,807 $1,268,640 -12.3% % Sold Price to List Price 99.4% 98.2% -1.2% Total Dollar Volume $33,253,561 $32,984,640 -0.8%
FLYING HORSE
31.8%
The number of properties sold in Monument increased by 31.8% in the first quarter of 2023 compared to that of 2022.
23 January through March 2022 2023 % Change Properties Sold 22 29 31.8% Average Price Per Square Foot $281 $254 -9.6% Average Days on Market 34 71 108.8% Highest Price $2,100,000 $1,862,412 -11.3% Average List Price $1,325,329 $1,329,274 0.3% Average Sales Price $1,365,703 $1,215,146 -11.0% % Sold Price to List Price 99.10% 97.3% -1.8% Total Dollar Volume $30,045,466 $35,239,234 17.3% MONUMENT KISSING CAMELS
January through March 2022 2023 % Change Properties Sold 2 3 50.0% Average Price Per Square Foot $372 $273 -26.6% Average Days on Market 5 1 -80.0% Highest Price $1,900,000 $1,492,271 -21.5% Average List Price $1,634,833 $1,075,000 -26.4% Average Sales Price $1,590,000 $1,203,130 -24.3% % Sold Price to List Price 102.40% 100.3% -2.1% Total Dollar Volume $3,180,000 $3,609,390 13.5%
GRAND COUNTY LUXURY MARKET
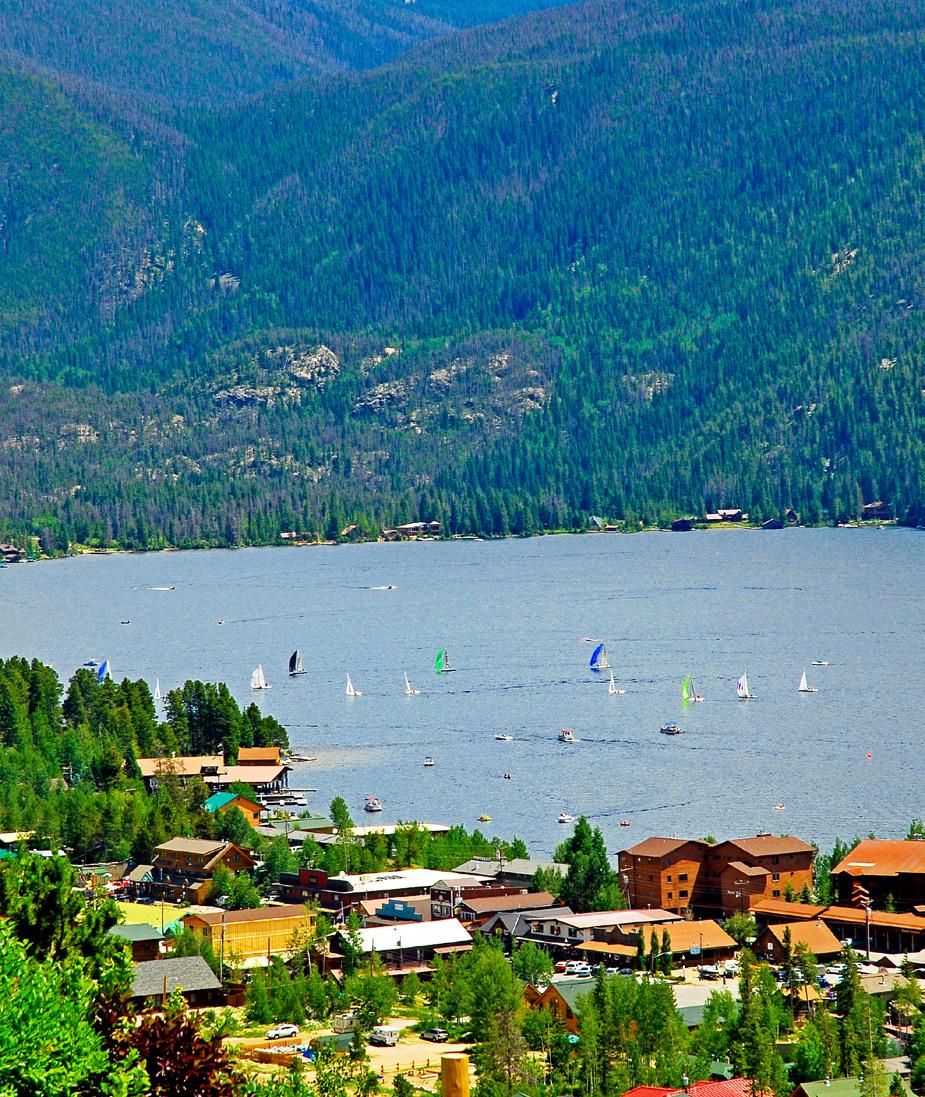
Grand County is home to the communities of Fraser, Granby, Grand Lake, Kremmling, Tabernash, and Winter Park. These towns provide year-round outdoor recreation and are just a short drive from Colorado’s Front Range cities of Denver and Boulder.
Winter Park, which is home to the eponymous ski resort with over 3,000 acres of award-winning terrain, had a 23.1% decline in highest price from $3,200,000 to $2,460,000. Average sold price was off slightly compared to the first quarter of 2022, from $1,976,219 to $1,841,595.
Looking at the total sales volume within the various communities that make up Grand County, Fraser—which is bordered to the south by Winter Park and to the north by Tabernash— saw a 38.5% increase from $13,064,022 to $18,087,899. The number of properties sold increased 66.7% from six to 10 properties. The average list price dropped 22.5% from $2,223,634 to $1,722,995.
Tabernash is a small town located just off of Highway 40 at an elevation of 8,333 feet, with ample options for recreation in the surrounding forests and wilderness area. Tabernash saw a 400% jump in number of properties sold, from 2 homes to 10 homes when compared to the first quarter of 2022. The highest price rose significantly, from $1,795,000 to $2,800,000. The sale of a $2.8 million home drove up the average sold price to $1,714,976, a 22.7% increase.
24
January through March 2022 2023 % Change # of Properties Sold 33 47 42.4% Average Price Per Square Foot $521 $610 17.1% Average Days on Market 185 103 -44.3% Highest Price $8,370,000 $2,895,000 -65.4% Average List Price $1,893,115 $1,520,931 -19.7% Average Sale Price $1,837,022 $1,516,646 -17.4% % Sold Price to List Price 100.2% 101.0% 0.8% Total Dollar Volume $60,621,738 $71,282,364 17.6%
+
Sales
GRAND COUNTY
$1,000,000
Based on $1,000,000+ sales for Grand County. Based on Information from Grand County’s Board of Realtors. This representation is based in whole or in part on data supplied by the Grand County Board of Realtors on March 5, 2023. The Grand County Board of Realtors does not guarantee nor is in any way responsible for its accuracy. Data maintained by the Grand County Board of Realtors may not reflect all real estate activity in the market.
66.7%
The number of properties sold in Fraser increased by 66.7% in the first quarter of 2023 compared to that of 2022.
10.3%
The highest sale price in Granby increased by 10.3% in the first quarter of 2023 compared to that of 2022.
25 GRAND LAKE GRANBY FRASER January through March 2022 2023 % Change # of Properties Sold 6 10 66.7% Average Price Per Square Foot $545 $618 13.4% Average Days on Market 371 382 3.0% Highest Price $3,970,000 $2,895,000 -27.1% Average List Price $2,223,634 $1,722,995 -22.5% Average Sale Price $2,177,337 $1,808,789 -16.9% % Sold Price to List Price 100.0% 106.0% 5.9% Total Dollar Volume $13,064,022 $18,087,899 38.5% Single Family Homes
Single Family Homes January through March 2022 2023 % Change # of Properties Sold 6 6 0.0% Average Price Per Square Foot $444 $478 7.7% Average Days on Market 90 80 -11.1% Highest Price $1,990,000 $2,195,000 10.3% Average List Price $1,375,667 $1,303,333 -5.3% Average Sale Price $1,382,500 $1,259,166 -8.9% % Sold Price to List Price 100.6% 96.1% -4.5% Total Dollar Volume $8,295,000 $7,555,000 -8.9% Single Family Homes January through March 2022 2023 % Change # of Properties Sold 4 1 -75.0% Average Price Per Square Foot $521 $541 3.8% Average Days on Market 232 1,346 480.2% Highest Price $2,750,000 $1,075,000 -60.9% Average List Price $1,860,500 $1,195,000 -35.8% Average Sale Price $1,755,500 $1,075,000 -38.8% % Sold Price to List Price 92.2% 90.0% -2.5% Total Dollar Volume $7,022,000 $1,075,000 -84.7%
The Town of Kremmling is a beautiful Colorado mountain community with year-round activities. We are proud of our rustic appeal and authentic western heritage. Big rivers and big game make this a perfect basecamp for an outdoor lifestyle.

13.4%
The average price per square foot in Winter Park increased by 13.4% in the first quarter of 2023 compared to that of 2022.
26 KREMMLING TABERNASH WINTER PARK
Single Family Homes January through March 2022 2023 % Change # of Properties Sold 1 No SalesAverage Price Per Square Foot $515 -Average Days on Market 191 -Highest Price $8,370,000 -Average List Price $10,000,000 -Average Sale Price $8,370,000 -% Sold Price to List Price 83.7% -Total Dollar Volume $8,370,000 -Single Family Homes January through March 2022 2023 % Change # of Properties Sold 2 10 400.0% Average Price Per Square Foot $444 $557 25.5% Average Days on Market 40 123 207.5% Highest Price $1,795,000 $2,800,000 56.0% Average List Price $1,349,000 $1,882,700 39.6% Average Sale Price $1,397,525 $1,714,976 22.7% % Sold Price to List Price 104.0% 92.4% -11.1% Total Dollar Volume $2,795,050 $17,149,760 513.6% Single Family Homes January through March 2022 2023 % Change # of Properties Sold 4 3 -25.0% Average Price Per Square Foot $545 $618 13.4% Average Days on Market 310 615 98.4% Highest Price $3,200,000 $2,460,000 -23.1% Average List Price $2,029,750 $1,782,333 -12.2% Average Sale Price $1,976,219 $1,841,595 -6.8% % Sold Price to List Price 96.4% 103.1% 6.9% Total Dollar Volume $7,904,878 $5,524,785 -30.1%
SUMMIT COUNTY LUXURY MARKET
With the ski resorts of Arapahoe Basin, Breckenridge, Copper Mountain, and Keystone, Summit County is renowned for its snow-covered peaks. In warmer months, it offers endless options for hiking and mountain biking as well as boating on Dillon Reservoir.
Summit County’s luxury real estate market cooled slightly in the first quarter of 2023, after exceptionally high sales volume over the past three years. Breckenridge, known for its Main Street lined with Victorian-era homes, had a 17.5% decline in price per square foot, from $869 to $717. The number of properties sold increased 61.1% from 18 homes to 29 homes. Average list price dipped 38.3% from $4,164,333 to $2,569,119.
Copper Mountain is only 75 miles from Denver, making it an ideal mountain escape. Its average price per square foot rose 7.1% from $768 to $822 during the first quarter. The average list price was off only 0.7% from $3,625,000 to $3,600,000.
Keystone’s number of homes sold jumped from 2 homes to 5 homes in the first quarter. The average price per square foot was up slightly, from $748 to $770. The average list price was down 26.7% from $3,372,500 to $2,473,000.
27
January through March 2022 2023 % Change # of Properties Sold 56 37 -33.9% Average Price Per Square Foot $808 $908 12.4% Average Days on Market 47 86 83.0% Highest Price $12,200,000 $6,000,000 -50.8% Average List Price $3,319,713 $3,242,159 -2.3% Average Sale Price $3,219,958 $3,110,195 -3.4% % Sold Price to List Price 98.5% 96.5% -2.0% Total Dollar Volume $180,317,623 $115,007,219 -36.2% SUMMIT COUNTY + $2,000,000 Sales
Based on $2,000,000+ sales in Summit County. Based on information from Summit Association of Realtors®. This representation is based in whole or in part on data supplied by Summit Association of Realtors® on March 5, 2023. Summit Association of Realtors® does not guarantee nor is in any way responsible for its accuracy. Data maintained by Summit Association of Realtors® may not reflect all real estate activity in the market.
7.1%
The average price per square foot in Copper Mountain increased by 7.1% in the first quarter of 2023 compared to that of 2022.
28 January through March 2022 2023 % Change # of Properties Sold 18 29 61.1% Average Price Per Square Foot $869 $717 -17.5% Average Days on Market 50 89 78.0% Highest Price $12,200,000 $6,000,000 -50.8% Average List Price $4,164,333 $2,569,119 -38.3% Average Sale Price $3,970,687 $2,445,519 -38.4% % Sold Price to List Price 98.2% 96.5% -1.7% Total Dollar Volume $71,472,370 $59,490,000 -16.8%
January through March 2022 2023 % Change # of Properties Sold 2 1 -50.0% Average Price Per Square Foot $768 $822 7.1% Average Days on Market 18 68 277.8% Highest Price $4,200,000 $3,500,000 -16.7% Average List Price $3,625,000 $3,600,000 -0.7% Average Sale Price $3,600,000 $3,500,000 -2.8% % Sold Price to List Price 99.4% 97.2% -2.2% Total Dollar Volume $7,200,000 $3,500,000 -51.4% January through March 2022 2023 % Change # of Properties Sold 2 5 150.0% Average Price Per Square Foot $748 $770 3.0% Average Days on Market 8 79 887.5% Highest Price $4,295,000 $4,300,000 0.1% Average List Price $3,372,500 $2,473,000 -26.7% Average Sale Price $3,405,000 $2,386,500 -29.9% % Sold Price to List Price 101.3% 96.5% -4.7% Total Dollar Volume $6,810,000 $9,950,000 46.1% Single Family Homes Single Family Homes Single Family Homes BRECKENRIDGE COPPER MOUNTAIN KEYSTONE
CRESTED BUTTE LUXURY MARKET
Created Butte, which was founded in the late 1800s during the silver mining boom, is now known for its steep and deep skiing in winter months and as the wildflower capital of Colorado in the summer.
Properties in Gunnison County priced above $2 million saw a 74.4% increase in average price per square foot in the first quarter, from $824 to $1,437. The average list price ticked up 18.7% from $4,126,500 to $4,900,000. The average days on market jumped from 106 to 233, affording potential buyers more time to make decisions than in the past three years.
The Town of Crested Butte and Mt Crested Butte didn’t have any new sales above the $2 million threshold between January and March 2023, which is typically a quiet season.
Homes in Rural Crested Butte had a 41.6% increase in the average price per square foot, from $614 to $870. The highest priced property jumped 64.7% from $2,550,000 to $4,200,000.
CRESTED BUTTE
29
Based on $2,000,000+ residential sales in Gunnison County. Based on data from the Gunnison County Association of Realtors® MLS, Colorado Real Estate Network (CREN) on March 5, 2023. Verify with a local Realtor®. All information is deemed reliable but not guaranteed. Data maintained by CREN MLS may not reflect all real estate activity in the market.
January through March 2022 2023 % Change # of Properties Sold 10 2 -80.0% Average Price Per Square Foot $824 $962 74.4% Average Days on Market 106 233 119.8% Highest Price $11,550,000 $5,175,000 -55.2% Average List Price $4,126,500 $4,900,000 18.7% Average Sale Price $4,019,060 $4,687,500 16.6% % Sold Price to List Price 97.4% 95.7% -1.8% Total Dollar Volume $40,190,600 $9,375,000 -76.7%
+ $2,000,000 Sales Gunnison County
Crested Butte is a town in the Rocky Mountains of Colorado. Downhill ski and mountain-bike trails crisscross the slopes of Crested Butte Mountain Resort. There are Nordic ski routes around town.
41.6% The average price per square foot in Rural Crested Butte increased by 41.6% in the first quarter of 2023 compared to that of 2022.
30 January through March 2022 2023 % Change # of Properties Sold 1 No SalesAverage Price Per Square Foot $1,600 -Average Days on Market 44 -Highest Price $5,100,000 -Average List Price $5,100,000 -Average Sale Price $5,100,000 -% Sold Price to List Price 100.0% -Total Dollar Volume $5,100,000 -January through March 2022 2023 % Change # of Properties Sold 4 No SalesAverage Price Per Square Foot $871 -Average Days on Market 102 -Highest Price $3,700,000 -Average List Price $3,266,250 -Average Sale Price $3,135,150 -% Sold Price to List Price 96.0% -Total Dollar Volume $12,540,600 -January through March 2022 2023 % Change # of Properties Sold 1 1 0.0% Average Price Per Square Foot $614 $870 41.6% Average Days on Market 200 189 -5.5% Highest Price $2,550,000 $4,200,000 64.7% Average List Price $2,650,000 $4,300,000 62.3% Average Sale Price $2,550,000 $4,200,000 64.7% % Sold Price to List Price 96.2% 97.7% 1.5% Total Dollar Volume $2,550,000 $4,200,000 64.7% Single Family Homes Single Family Homes Single Family Homes TOWN OF CRESTED BUTTE MT. CRESTED BUTTE RURAL CRESTED BUTTE
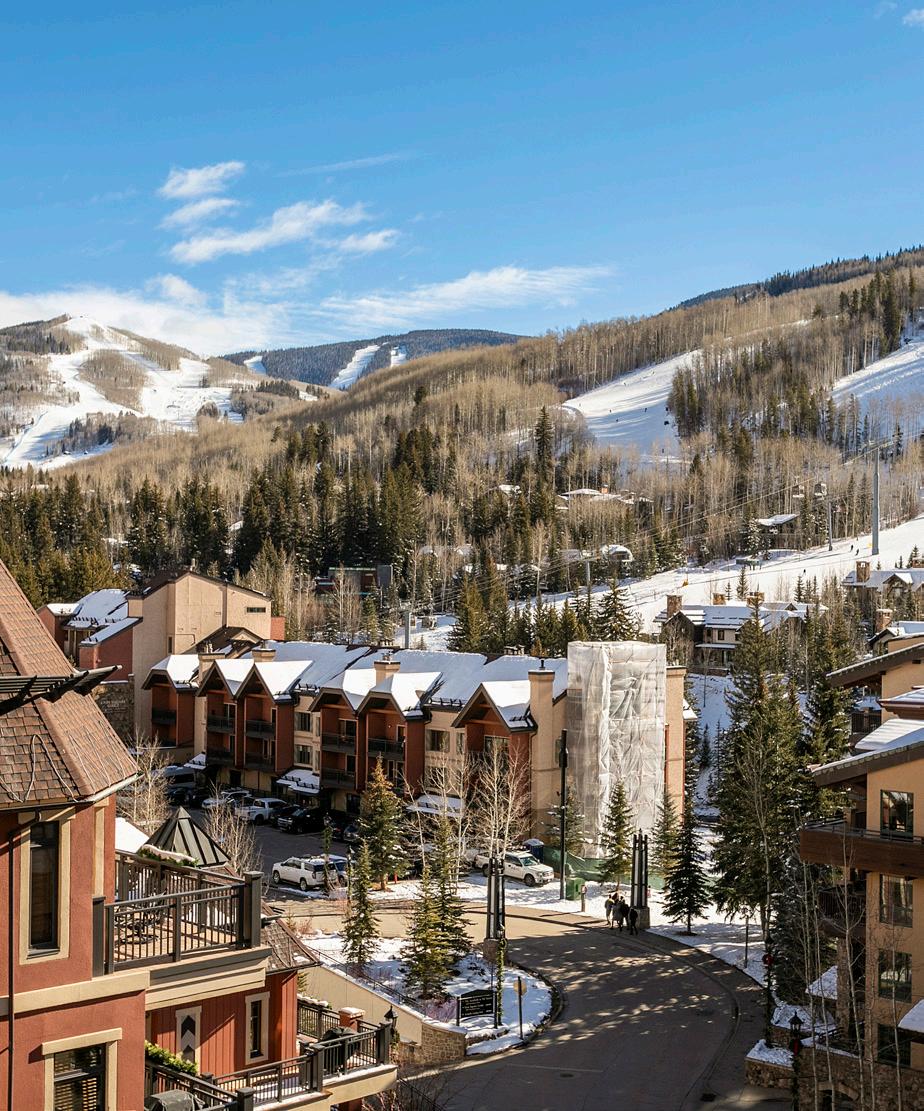
VAIL VALLEY LUXURY MARKET
The Vail Valley is home to upscale enclaves from Arrowhead to Bachelor Gulch to the Vail Golf Course. Demand for these neighborhoods remains healthy as buyers look for mountain communities with access to outdoor recreation and cultural events. Overall, luxury homes in this region saw a 24.4% increase in average price per square foot from $1,336 to $1,662 in the first quarter of 2023.
Vail Village boasts high-end shops and restaurants and is a quick walk to Gondola One for skiing, hiking, and mountain biking adventures. The average price per square foot rose 16.7% from $2,666 to $3,100 as buyers were willing to pay a premium for amenities in the core village. The highest price ticked up 2.6% from $19,000,000 to $19,500,000.
The Vail Golf Course neighborhood, which is walking distance to Vail’s Golden Peak, has beautiful homes lining the fairways and greens. The average price per square foot increased 2% from $1,692 to $1,726. The highest price jumped 17.1% from $5,850,000 to $6,850,000. The average list price went up 16.2% from $4,475,000 to $5,200,000 for properties along the golf course in East Vail.
Bachelor Gulch, with access to Beaver Creek ski resort, offers stunning views of the Gore Range and homes with large lots set amongst aspen groves. The average price per square foot was down slightly from $1,346 to $1,327. Average list price declined 9.5% from $7238,182 to $6,547,500.
31
Based on $3,000,000+
by Vail Board of Realtors® on March 5, 2023. Vail Board
Vail
of Realtors®
not
all real estate activity in the market.
sales in Eagle County. Based on information from Vail Board of Realtors®. This representation is based in whole or in part on data supplied
of Realtors® does not guarantee nor is in any way responsible for its accuracy. Data maintained by
Board
may
reflect
+ $3,000,000 Sales January through March 2022 2023 % Change # of Properties Sold 54 43 -20.4% Average Price Per Square Foot $1,336 $1,662 24.4% Average Days on Market 83 82 -1.2% Highest Price $30,875,000 $20,500,000 -33.6% Average List Price $6,252,167 $5,757,767 -7.9% Average Sale Price $6,047,777 $5,491,315 -9.2% % Sold Price to List Price 97.9% 95.8% -2.1% Total Dollar Volume $326,579,971 $236,126,569 -27.7% VAIL VALLEY Eagle County
20.0%
The number of properties sold in Arrowhead increased by 20.0% in the first quarter of 2022 compared to that of 2022.
85.0%
The average price per square foot in Beaver Creek increased by 85.0% in the first quarter of 2023 compared to that of 2022.
32 January through March 2022 2023 % Change # of Properties Sold 5 6 20.0% Average Price Per Square Foot $1,061 $1,096 3.3% Average Days on Market 212 42 -80.2% Highest Price $7,575,000 $7,495,000 -1.1% Average List Price $5,917,600 $4,745,000 -19.8% Average Sale Price $5,892,000 $4,570,000 -22.4% % Sold Price to List Price 101.3% 95.8% -5.4% Total Dollar Volume $29,460,000 $27,420,000 -6.9% January through March 2022 2023 % Change # of Properties Sold 11 4 -63.6% Average Price Per Square Foot $1,346 $1,327 -1.4% Average Days on Market 31 70 125.8% Highest Price $11,750,000 $9,100,000 -22.6% Average List Price $7,238,182 $6,547,500 -9.5% Average Sale Price $7,117,909 $6,250,000 -12.2% % Sold Price to List Price 98.2% 95.5% -2.7% Total Dollar Volume $78,297,000 $25,000,000 -68.1% January through March 2022 2023 % Change # of Properties Sold 7 4 -42.9% Average Price Per Square Foot $1,110 $2,053 85.0% Average Days on Market 103 292 183.5% Highest Price $10,200,000 $20,500,000 101.0% Average List Price $4,948,000 $10,996,250 122.2% Average Sale Price $4,767,214 $10,347,500 117.1% % Sold Price to List Price 97.1% 96.5% -0.6% Total Dollar Volume $33,370,500 $41,390,000 24.0%
All Properties All Properties All Properties ARROWHEAD
BACHELOR GULCH BEAVER CREEK
65.2%
The average number of days on market in the Town of Vail decreased by 65.2% in the
compared to that of 2022.
33.8%
The average number of days on market in Lionshead decreased by 33.8% in the first quarter of 2023 compared to that of 2022.
33 All Properties January through March 2022 2023 % Change # of Properties Sold 16 13 -18.8% Average Price Per Square Foot $2,079 $2,787 34.1% Average Days on Market 69 24 -65.2% Highest Price $30,875,000 $19,500,000 -36.8% Average List Price $7,924,375 $6,244,231 -21.2% Average Sale Price $7,512,687 $6,005,000 -20.1% % Sold Price to List Price 96.8% 96.6% -0.2% Total Dollar Volume $120,203,000 $78,065,000 -35.1% All Properties January through March 2022 2023 % Change # of Properties Sold 8 8 0.0% Average Price Per Square Foot $2,666 $3,110 16.7% Average Days on Market 81 22 -72.8% Highest Price $19,000,000 $19,500,000 2.6% Average List Price $7,305,375 $7,311,250 0.1% Average Sale Price $6,912,875 $7,030,000 1.7% % Sold Price to List Price 97.6% 96.9% -0.7% Total Dollar Volume $55,303,000 $56,240,000 1.7% All Properties January through March 2022 2023 % Change # of Properties Sold 1 3 200.0% Average Price Per Square Foot $2,602 $2,634 1.2% Average Days on Market 68 45 -33.8% Highest Price $30,875,000 $4,000,000 -87.0% Average List Price $32,950,000 $4,095,000 -87.6% Average Sale Price $30,875,000 $3,898,333 -87.4% % Sold Price to List Price 93.7% 95.3% 1.8% Total Dollar Volume $30,875,000 $11,695,000 -62.1% LIONSHEAD VAIL VILLAGE TOWN OF VAIL
2023
first quarter of
16.2%
The average list price in Vail Golf Course increased by 16.2% in the first quarter of 2023 compared to that of 2022.
A gated community high above the town of Avon, Mountain Star is noted for its incredible views and privacy. From quiet aspen groves to expansive views of Beaver Creek and Bachelor Gulch, Mountain Star is just minutes to the slopes of Beaver Creek and Vail.
34 January through March 2022 2023 % Change # of Properties Sold 2 2 0.0% Average Price Per Square Foot $1,692 $1,726 2.0% Average Days on Market 13 2 -84.6% Highest Price $5,850,000 $6,850,000 17.1% Average List Price $4,475,000 $5,200,000 16.2% Average Sale Price $4,487,500 $5,065,000 12.9% % Sold Price to List Price 100.4% 97.2% -3.2% Total Dollar Volume $8,975,000 $10,130,000 12.9% January through March 2022 2023 % Change # of Properties Sold No Sales No Sales — Average Price Per Square Foot — — — Average Days on Market — — — Highest Price — — — Average List Price — — — Average Sale Price — — — % Sold Price to List Price — — — Total Dollar Volume — — — All Properties All Properties VAIL GOLF COURSE SPRADDLE CREEK January through March 2022 2023 % Change # of Properties Sold 1 No Sales — Average Price Per Square Foot $848 — — Average Days on Market 551 — — Highest Price $9,050,000 — — Average List Price $9,350,000 — — Average Sale Price $9,050,000 — — % Sold Price to List Price 96.8% — — Total Dollar Volume $9,050,000 — — MOUNTAIN
STAR
All Properties
TELLURIDE LUXURY MARKET
In a scenic box canyon in southwestern Colorado, Telluride is known for its world-class ski resort and its historic downtown area with Victorian-era homes and buildings. Perched at the headwaters of the San Miguel River, it was first established as a mining town and experienced the gold rush in the late 1800s.
San Miguel County, home to Telluride, had varied first quarter data in the areas of Mountain Village and the Town of Telluride. Mountain Village had an 8.3% increase in number of luxury homes sold compared to 2022. The average price per square foot increased 17.5% from $1,169 to $1,374 as this unique neighborhood continues to be desirable due to its location in the San Juan Mountain range with access to worldclass resort skiing and stunning wilderness. The highest price was down 11.6% from $10,750,000 to $9,500,000.
The Town of Telluride, known for its pedestrian-friendly downtown, had a 14% decline in the average price per square foot, from $2,122 to $1,826. The average list price dropped 17.3% from $6,857,083 to $5,669,143. The average sold price dipped 21% from $6,6490,931 to $5,256,001.
Based on sales $3,000,000+ and information from flexmls/Telluride Association of Realtors®. This representation is based in whole or in part on data supplied by Telluride Association of Realtors® on March 5, 2023. Telluride Association of Realtors® does not guarantee nor is in any way responsible for its accuracy. Data maintained by Telluride Association of Realtors® may not reflect all real estate activity in the market.does not guarantee nor is in any way responsible for its accuracy. Data maintained by REColorado may not reflect all real estate activity in the market.
35
+ $3,000,000 Sales January through March 2022 2023 % Change # of Properties Sold 27 21 -22.2% Average Price Per Square Foot $1,796 $1,544 -14.0% Average Days on Market 206 147 -28.6% Highest Price $15,000,000 $9,500,000 -36.7% Average List Price $7,228,704 $5,607,667 -22.4% Average Sale Price $6,717,618 $5,360,334 -20.2% % Sold Price to List Price 92.9% 95.6% 2.9% Total Dollar Volume $181,375,675 $112,567,010 -37.9% TELLURIDE San Miguel County
14.0%
The average price per square foot in the Town of Telluride decreased by 14.0% in the first quarter of 2023 compared to that of 2022.
51.6%
The average number of days on market in the Surrounding Mesas decreased by 51.6% in the first quarter of 2023 compared to that of 2022.
36 January through March 2022 2023 % Change # of Properties Sold 12 7 -41.7% Average Price Per Square Foot $2,122 $1,826 -14.0% Average Days on Market 146 152 4.1% Highest Price $14,000,000 $9,067,010 -35.2% Average List Price $6,857,083 $5,669,143 -17.3% Average Sale Price $6,649,931 $5,256,001 -21.0% % Sold Price to List Price 97.0% 92.7% -4.4% Total Dollar Volume $79,799,175 $36,792,010 -53.9% January through March 2022 2023 % Change # of Properties Sold 12 13 8.3% Average Price Per Square Foot $1,169 $1,374 17.5% Average Days on Market 262 139 -46.9% Highest Price $10,750,000 $9,500,000 -11.6% Average List Price $6,257,917 $5,406,923 -13.6% Average Sale Price $6,127,208 $5,244,231 -14.4% % Sold Price to List Price 97.9% 97.0% -0.9% Total Dollar Volume $73,526,500 $68,175,000 -7.3% January through March 2022 2023 % Change # of Properties Sold 6 2 -66.7% Average Price Per Square Foot $1,928 $1,548 -19.7% Average Days on Market 335 162 -51.6% Highest Price $15,000,000 $7,600,000 -49.3% Average List Price $8,414,862 $5,918,500 -29.7% Average Sale Price $10,240,833 $5,762,500 -43.7% % Sold Price to List Price 82.2% 97.4% 18.5% Total Dollar Volume $50,489,175 $11,525,000 -77.2%
Deep Creek Mesa, Hastings Mea, Iron Springs/Horsefly Mesa, Specie Mesa, Sunshine Mesa, Turkey Creek Mesa, Wilson Mesa All Properties All Properties TOWN OF TELLURIDE MOUNTAIN VILLAGE SURROUNDING MESAS
in your happy place
The definition of paradise depends on your point of view. Find a home that makes each day more extraordinary than the last with LIV Sotheby’s International Realty.
livsothebysrealty.com
38
04 07 28 NATIONAL PARKS MOUNTAIN RANGES SKI AREAS & RESORTS
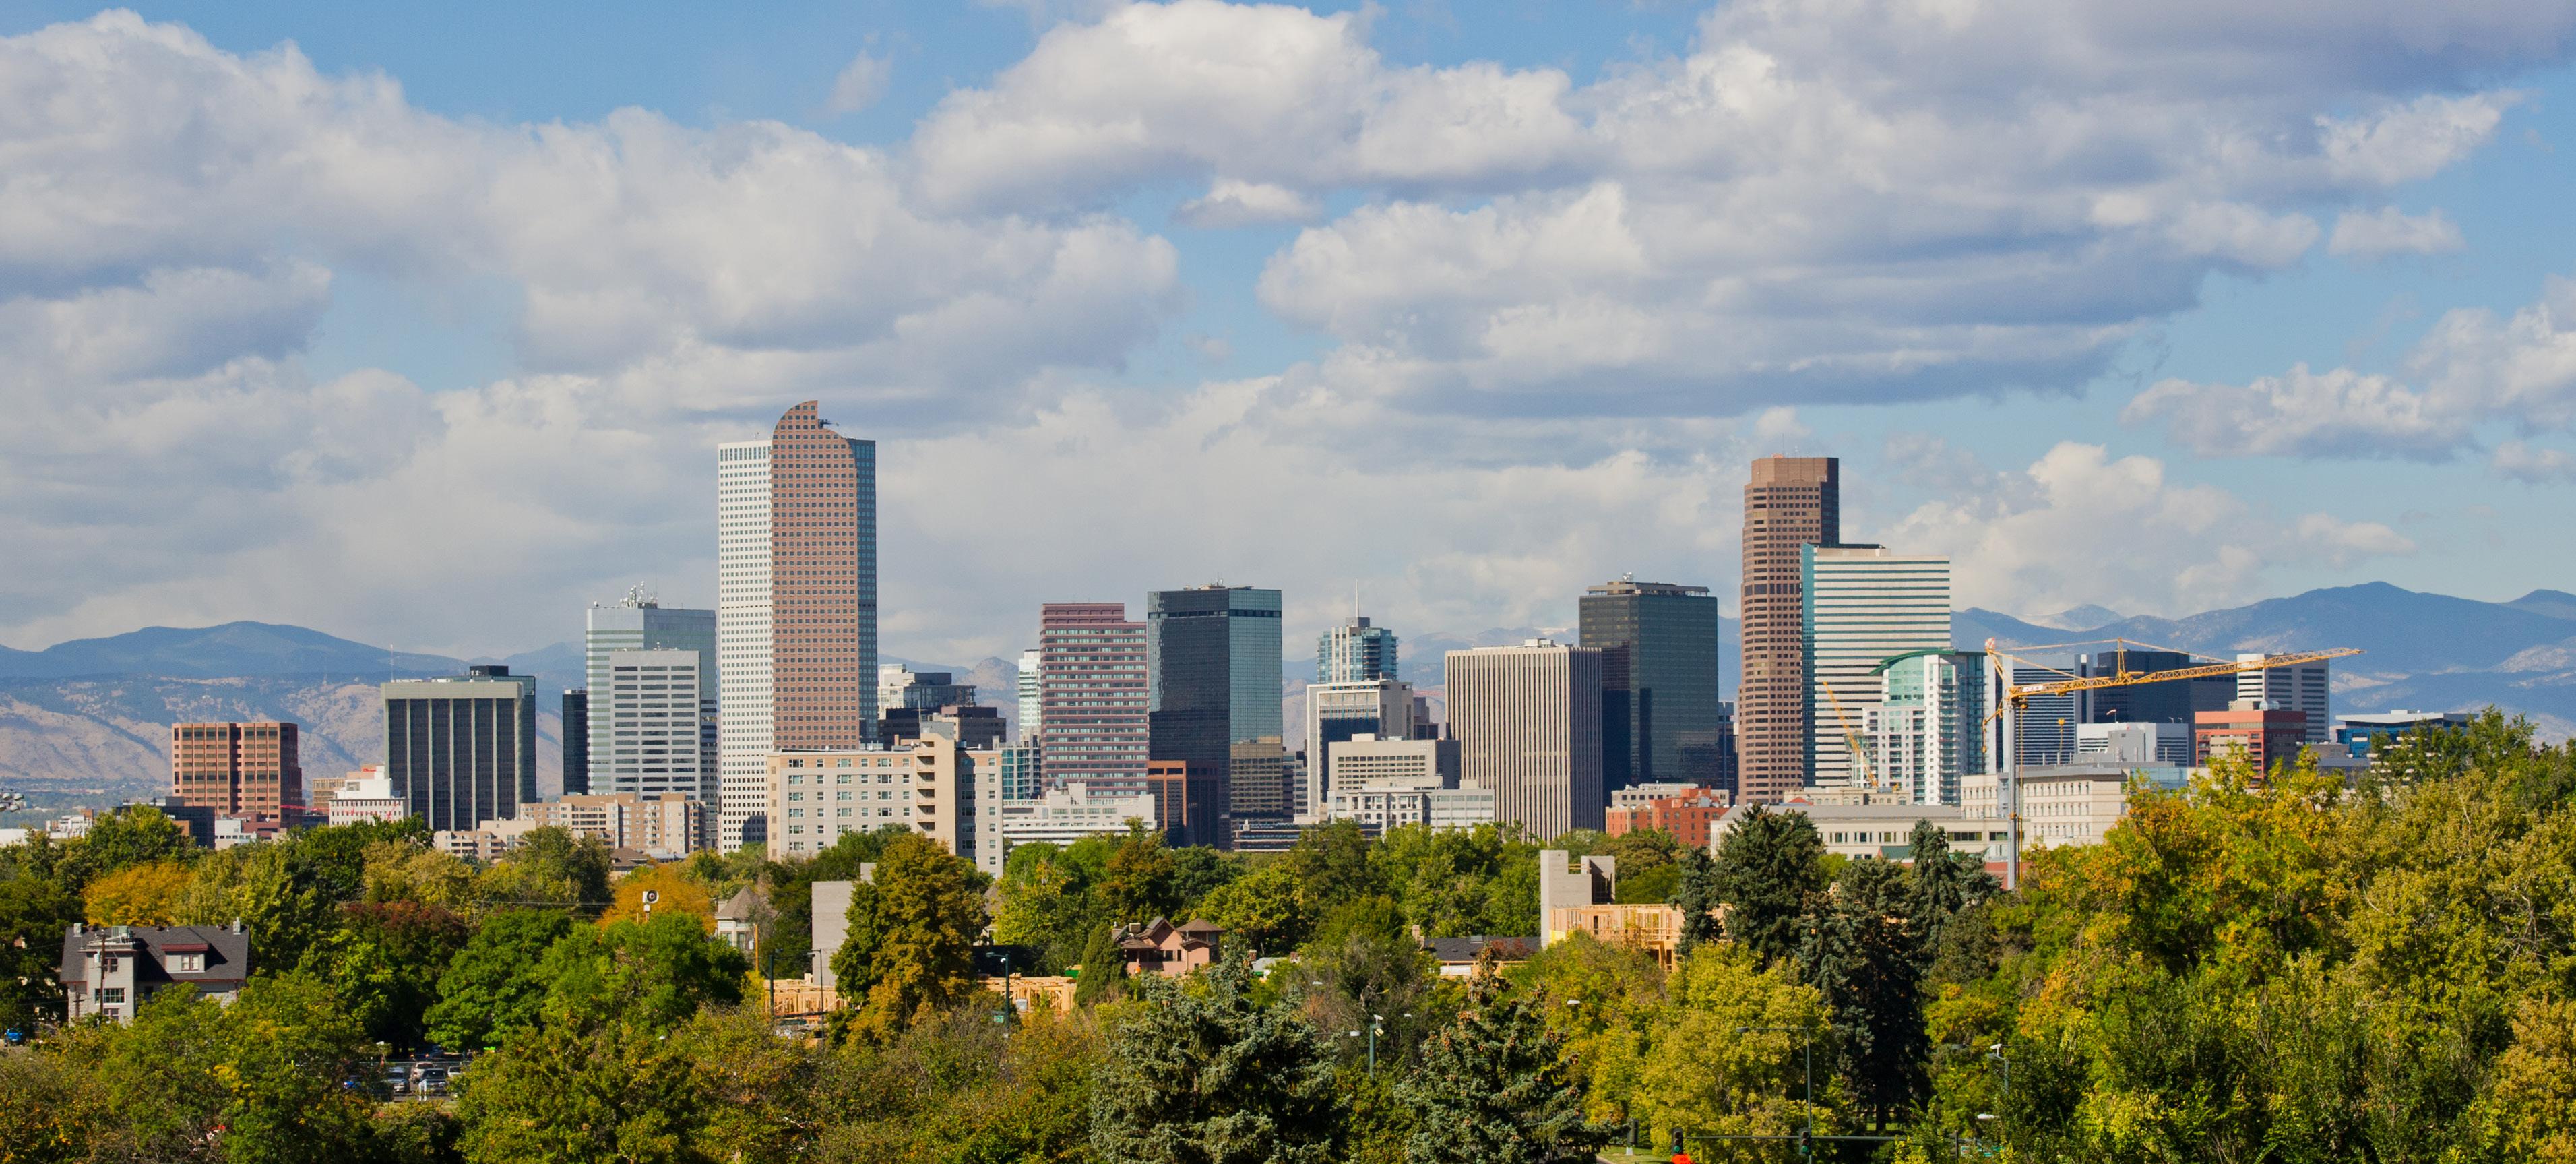
WHY COLORADO?
39 AVG DAYS OF SUNSHINE ANNUALY CRAFT BREWERIES 300 350+
