

BETTERING HUMAN LIVES
2020 ESG REPORT
ENERGY MATTERS!
Liberty’s mission is to BETTER HUMAN LIVES.
Liberty is a TECHNOLOGY PIONEER of the shale revolution and has driven enormous improvements in both human well-being and environmental quality.
Liberty management and board are ALIGNED with our owners and our communities.
Liberty partners with our customers to deliver LOW-IMPACT, LOW-COST, RELIABLE ENERGY (and we’re proud of it!).
Liberty sees THREE GLOBAL ENERGY CHALLENGES:
• Energy poverty
• Reliable, affordable, clean energy
• Climate change


TABLE OF CONTENTS
6. INTRODUCTION
7. A MESSAGE FROM CHRIS WRIGHT, CHAIRMAN AND CEO 10. COMMITMENT TO ESG 12. LEGACY OF SUSTAINABILITY
PART 1: LIBERTY’S BUSINESS IN GLOBAL CONTEXT:

PART 2: LIBERTY TODAY: BETTERING HUMAN LIVES AND REDUCING ENVIRONMENTAL IMPACTS
46. THE SHALE REVOLUTION 48. IMPROVING ENVIRONMENTAL PERFORMANCE
50. DIGITAL TECHNOLOGY 52. FRAC ENGINES 54. NOISE/DUST/SAND 56. FRAC FLUID CHEMISTRY 58. WATER
60. ECOLOGICAL IMPACT 62. COLORADO FRONT RANGE: CASE STUDY
SAFETY
COVID-19 RESPONSE 67. A CULTURE OF EXCELLENCE 72. REVITALIZING SMALL TOWN AMERICA
COMMUNITY ENGAGEMENT
CORPORATE GOVERNANCE 80. BUSINESS AND REGULATORY AFFAIRS
KEY METRICS AND DISCLOSURES - SASB
74.
81.
64.
66.
76.
LOW-COST
HUMAN WELL-BEING 16. ENERGY 19.
30.
ENERGY AS AN AGENT OF
ENERGY POVERTY
CLIMATE CHANGE 38. CLIMATE CHANGE ECONOMICS 42. EMISSIONS AND AIR QUALITY: THE BIG PICTURE
INTRODUCTION

IT IS SIMPLY NOT POSSIBLE TO DISCUSS THE ENVIRONMENTAL AND SOCIAL IMPACTS OF OUR INDUSTRY WITHOUT CONSIDERING THE ENVIRONMENTAL AND HUMAN IMPACTS OF THE ABSENCE OF OUR INDUSTRY.
As with all complex issues, Liberty strives to learn first, define a thoughtful plan, and then act. Our inaugural Environmental, Social, and Governance (ESG) report is designed to share our journey with you. We go far beyond the narrow focus on our company to look at the bigger picture of the world in which we live and the industry in which we operate. Would the world be better off without fossil fuels? Emphatically “no” is our answer. Because the issues around energy, poverty, and the environment are so important – and so often misunderstood – we will explore and explain them in depth.
Part 1 covers in greater depth the larger issues that form the Energy/ Environment/Poverty nexus. This begins with why worldwide clean energy access matters. Since the oil and gas industry began in the second half of the 19th century, global life expectancy has doubled, extreme poverty has plummeted, and human liberty has grown tremendously. The timing here is no coincidence. This progress in the human condition was enabled by the surge in plentiful, affordable energy from oil, gas, and coal.
Unfortunately, many people still lack access to life-enhancing modern energy, which presents the most pressing global energy challenge. Our energy-rich lifestyles have both environmental downsides such as pollutants and climate change, and upsides like forest preservation, reduced need for cropland, and cleaner air.
Part 2 covers the actions Liberty is taking to maximize the benefits of our services and to lead the industry into a new era of technology and stewardship. At Liberty, we view ESG principles as foundational to our business strategy, expanding beyond our four walls to ensure that the work we do benefits our families, our communities, and the world. We passionately work to better the process of bringing hydrocarbons to the surface in a clean, safe, and efficient fashion. It is important to not lose sight of the rich history of progress enabled by the oil and gas industry, and this broader context motivates our team every day.
Liberty’s ESG report offers information on critical issues that are important to our business today. Information is provided by Liberty’s subject matter experts, approved by our leadership team, and reviewed by the Liberty board of directors. Data in the report covers our 2020 calendar year unless otherwise indicated. The report is prepared in accordance with Sustainability Accounting Standards Board (SASB) standards and uses several other ESG standards to inform our discussion. In developing our report, we have identified opportunities for expanded reporting in subsequent years as we continue to drive improvement.
6
6
A MESSAGE FROM CHRIS WRIGHT, CHAIRMAN AND CEO
LIBERTY’S MISSION IS TO BETTER HUMAN LIVES.
The Liberty family, from our field crews to our board of directors, forms a passionate, committed, and engaged team. We strive to enhance our company, families, communities, and the world. Liberty is committed to meeting the challenges of our time. By investing in our people and technology we are helping our customers efficiently produce cleaner oil and gas resources. It is simply not possible to discuss the environmental and social impacts of our industry without considering the environmental and human impacts of the absence of our industry.
Today there is discontent among the public in wealthy nations with oil and gas, and even a growing belief that our industry soon will be, and should be, gone. This report explains why the near-term disappearance of our industry is both highly unlikely and undesirable. Liberty takes great pride in our work, and we strive to explain why in this report.
The big-picture issues are tackled in depth in Part 1 of this report, which gives data-packed summary overviews on energy, energy poverty, climate change, and climate economics. At least a basic understanding of these issues is critical to engaging with today’s three global energy challenges: 1) energy poverty, 2) affordable, reliable, clean energy, and 3) climate change.
This report explains why the longer, healthier, opportunity-rich lives in the modern world are simply not possible without oil and gas. Borrowing Thomas Hobbes’ words, life for most everyone in history was “nasty, brutish, and short” when liberty was scarce and energy was supplied only by human toil and draught animals. Liberty’s mission is to bring modern energy to the fully one-third of humanity that lacks that access today and, therefore, must live far more dangerous and constrained lives than we enjoy.
Part 2 of this report covers Liberty’s efforts to better human lives, strengthen our communities, and reduce negative environmental impacts from North American oil and natural gas production. Our efforts on the social front began with the inception of our company. We chose our name, Liberty, because we believe in human liberty: everyone should have the freedom and opportunity to pursue their dreams. This ethos pervades our diverse workforce and hiring policies that focus on where people are headed with their lives far more than where they came from. Liberty provides a home to many of the brave service men and women who have served our country. We also employ dozens of formerly incarcerated people who had a tough start in life, but are now building meaningful careers.
COVID-19 dealt a body blow to Liberty. Our top priority was the health and safety of our team and their families. We were highly effective in suppressing COVID-19 transmission at Liberty even as we worked 24/7 to supply reliable energy and raw materials critical to fighting the global pandemic. We were forced to make our firstever layoffs in company history. We also had to make significant compensation cuts and, in Liberty fashion, the compensation cuts
HOW MUCH RICHER WOULD THE WORLD HAVE BEEN HAD WE SOLVED DIFFERENT ISSUES, 1900-2050. COST OF CLIMATE CHANGE WITH OPTIMAL POLICY ADDED FOR REFERENCE.
Figure 1.1 Source: Bjorn Lomborg https://www.sciencedirect.com/science/article/pii/S0040162520304157
7
100 80 60 40 20 0 Cost of problem, % global GDP 1900 1920 1940 1960 1980 2000 2020 2040 Air pollution Climate change ~1% Education Gender inequality Health NutritionConflicts
Trade
were made first and deepest at the executive level. Now as the country has entered a recovery phase, most compensation cuts for the Liberty team are restored and we are hiring again. April 2020 was the toughest professional time of my career. I am proud and humbled to be part of a team that faced adversity with courage, perseverance, and steadfast commitment to Liberty’s mission.
Liberty provides over 100 K-12 scholarships to low-income kids through ACE (Alliance for Choice in Education), and we recently launched a Liberty Scholars program at Montana Tech to enable lower income students to get a college engineering education. We have numerous other efforts targeting schools and kid programs, poverty abatement programs, low-income housing (Habitat for Humanity), criminal justice reform and job opportunities for those who had a disadvantaged start in life. Our efforts are all targeted at bettering human lives and growing individual liberty and opportunity.
Liberty is committed to honest, sound, aligned governance that assures management and our board of directors are responsible stewards of our owners’ capital. All the Liberty founders are still here fulfilling our dream to build a truly special company. We have always recognized that incentives drive human behavior and that principle guides our corporate governance. We align our financial incentives with our shareholders, and our social and operational practices with the communities in which we operate. Businesses are major players in setting the tone, culture, and character of our society. We behave in ways that our children and neighbors can be proud of for years to come.
This report is long, but necessarily so. It is critical to put Liberty’s efforts and our whole industry in proper context. We start in Part 1 by showing how low-cost, reliable energy is an agent of human wellbeing. The essential role of energy access lifts people out of poverty and reduces the health and environmental stresses that accompany the use of traditional biomass fuels like wood, dung, and agricultural waste. Regrettably, traditional fuels still dominate for roughly onethird of the world’s people. The World Health Organization (WHO) estimates that over 2 million premature deaths each year arise from indoor use of traditional biomass fuels, which generate copious particulate matter during combustion. This staggering loss of human potential can and must be eradicated.
WHO estimates there are several million additional deaths from outdoor air pollution, predominantly from the same source: particulate matter, or PM2.5, which is one of the world’s deadliest pollutants. Transitioning from traditional biomass fuels to modern fuels and using appropriate industrial pollution controls are the keys to reducing outdoor PM2.5 concentrations. PM2.5, malnutrition, preventable disease, and lack of access to drinking water and basic education collectively account for over 10 million premature deaths per year. Bringing affordable, reliable energy to the world’s poor is essential to eradicating these scourges. Even in wealthy nations, rising energy prices pose significant economic and health threats to lower income people.
We see three global energy challenges today: energy poverty; maintaining reliable, affordable, and clean energy; and climate change. There is no reason that we can’t master all these challenges. But doing so will require honest assessment, rational evaluation of tradeoffs, continued technology advancement, and the will to get it right. Unfortunately, the first and most urgent issue, energy poverty, afflicts poor countries and lower income residents of the wealthier countries, hence it garners tragically little attention. This is wrong.
The second global energy challenge is maintaining reliable, affordable and clean energy. This issue is starting to garner more attention as power grids become more expensive and less reliable, amply illustrated by the recent serious blackouts in California, Texas, and the U.K.
The third global energy challenge, climate change, has become so politicized and emotionally charged that rational, fact-based decision-making is becoming scarce. Urgent desires to visibly take politically appealing action have often driven up energy prices, made power grids less reliable, and grown energy poverty without making meaningful progress on climate change. Climate change is a long-term challenge requiring broad-based actions with significant technology and system advancements required. Liberty is excited to play a growing role here.
Decisions at Liberty are driven by data, facts, customer preferences, and our commitment to do the right thing. Our efforts on these three big issues that make up the energy/environment/poverty nexus will be no different. Our efforts are both internal to Liberty’s operations and in partnership with our customers.
8
To put the global energy challenges in context, Figure 1.1 shows an economic analysis of the staggering lost economic output resulting from the major afflictions of the world since 1900. Although we have seen over a century of progress, air pollution, disease, malnutrition, etc., still dwarf climate change in urgency. Solving these challenges is intimately tied to raising the poorest third of the world population out of energy poverty. For context, Figure 1.1 overlays, on a like-forlike basis, projections of climate change economic impacts from Nobel Prize winning climate economist, William Nordhaus.
Liberty works in the shale revolution, made possible by innovations in hydraulic fracturing and horizontal drilling. The shale revolution is a major driver of progress for all three global energy challenges. Surging U.S. oil and gas production has reset global oil and gas prices lower, lifting the economic fortunes of everyone, most of all the world’s poor. 2020 marked the second straight year that the U.S. produced more total energy than consumed. The last time the U.S. produced more energy than consumed was in the 1950s.
Surging U.S. exports of liquid petroleum gas (LPG) bring this critical fuel to improve the lives of families in dire energy poverty still relying on dirty, life-shortening traditional biomass fuels. On the climate front, surging U.S. natural gas production and plunging natural gas prices brought by the shale revolution have been the largest factors driving down U.S. per capita greenhouse gas (GHG) emissions to their lowest levels in my lifetime! Lower global natural gas prices and surging exports of liquified natural gas (LNG) are globalizing the incremental displacement of coal with cleaner electricity sources like natural gas, solar, and wind.
The broader social, community, governance, environmental, and human flourishing aspects of energy are topics near and dear to our hearts and were significant drivers of why we founded Liberty ten years ago.

TO BETTERING HUMAN LIVES,
 CHRIS WRIGHT CHAIRMAN AND CEO LIBERTY OILFIELD SERVICES

COMMITMENT TO ESG
Liberty has been a force for disruptive change in the service industry since our founding a decade ago. We saw the power of putting people first, developing a service business from the ground up by fostering an engaging environment for our employees, and delivering value to our customers and communities. The most crucial intangible assets are culture and a strong reputation, curated through investment in our employees, innovation in an ever-changing environment, and a robust governance system. Liberty has grown into one of the largest North American completions companies by sustaining these competitive advantages through cycles.
In 2020, we acquired Schlumberger’s North American completions business, advancing our business with complementary technologies, people, assets, geographic diversification, and vertical integration. The combination of talent, knowledge, and enhanced scale lays the groundwork for continued improvement to our processes to improve our efficiency and reduce our negative impacts on the environment. We have strengthened our ability to advance our customers’ ESG efforts, while providing expanded opportunities for our employees and communities.
Liberty is proud to deliver affordable, dependable energy that is vital to human progress. We constantly strive to advance sustainable solutions for our clients and within our operations. The market’s focus on ESG aligns with the principles that have been part of our DNA since day one. Liberty’s focus on digital technology has been critical to the immense improvements in shale-well productivity and efficiency over the last decade. Our team was first to develop the Quiet Fleet®, an incredible advancement in reducing environmental impact through the elimination of noise pollution in nearby communities. We created a logistics solution through containerized sand that reduces dust and noise in our operations and truck traffic in the community. Today, our team’s ingenuity and careful evaluation of emissions and efficiency over the past few years have now led to continuous improvements in frac engine technology, leading to our soon-to-be-deployed electric frac fleet, digiFrac, that we expect to drive emissions at least 20% below the best technologies on the market.
As we move forward, Liberty will strive to serve our customers exceptionally, provide transparency for our stakeholders, and strengthen our communities through best-in-class governance and risk management and controls. We take our responsibility seriously and will continue to hold ourselves accountable with vigorous ethical standards.
652
EMPLOYEE OWNERS (34% OF EMPLOYEES)
26%
PERCENTAGE OF TIER IV OFF-ROAD ENGINES
2020 TOTAL RECORDABLE INCIDENT RATE (TRIR)
121 STUDENTS RECEIVED SCHOLARSHIPS FROM LIBERTY IN 2020 0.66 0.80
47% WOMEN AT CORPORATE HEADQUARTERS
HIGHLY EFFECTIVE COVID RESPONSE
10
Liberty TRIR Industry Average TRIR

LEGACY OF SUSTAINABILITY
FROM DAY ONE
2011
Assembled industry-first comprehensive database of Bakken petrophysical and completions well data
SEPTEMBER 2014
Liberty team grows to 500
2014
CONTAINERIZED SAND
Reduces dust, noise, and truck traffic
2012
JANUARY 2012
Inaugural frac in North Dakota
2012 SLICKWATER DESIGN
Increasing Bakken oil productivity by 50%
Rolled out FIRST iPads to E&P customers, a key enabler of customer integration
2013
DUAL FUEL
Liberty’s first dual fuel fleet reduces emissions
2015
SPIRIT
Fluid system places proppant cheaper and cleaner
MAY 2013
Liberty starts in Colorado
FEBRUARY 2015
Liberty starts in Wyoming
JUNE 2016
Liberty acquires Sanjel assets
Liberty starts in West Texas
12
12
MARCH 2017
Liberty team grows to 1,500
JANUARY 2017
IVF and adoption assistance added as employee benefit
JULY 2017
Liberty starts in South Texas
NOVEMBER 2016
Liberty team grows to 1,000
2016
QUIET FLEET ®
Liberty introduces Quiet Fleet technology
NOVEMBER 2017
Liberty team grows to 2,000
OCTOBER 2018
DIGIFRAC
Starts development program for fully electric low emissions fleet
DECEMBER 2020
Closes OneStim® acquisition
Liberty adds Wireline and Freedom Proppant businesses
2020 Liberty starts in Canada
Liberty becomes the 2nd largest frac service provider
JANUARY 2019
Adopts Ban the Box initiative
JUNE 2018
First Liberty Women’s Summit
2018
Tier IV DGB Caterpillar Field Test Partnership
2020
NEXT GEN FRAC FLEET WHITE PAPER
ESG profile quantified for Next Gen fleets
2020
Deploys Tier IV DGB Fleets
13 2021
LBRT IPO

14
PART 1:
LIBERTY’S BUSINESS IN GLOBAL CONTEXT: LOW-COST ENERGY AS AN AGENT OF HUMAN WELL-BEING
ENERGY
ENERGY POVERTY
CLIMATE CHANGE
CLIMATE CHANGE ECONOMICS
EMISSIONS AND AIR QUALITY: THE BIG PICTURE
15
ENERGY

THE STORY OF ENERGY IS QUITE SIMPLE. IT IS THE STORY OF FREEDOM. FREEDOM FROM BACK-BREAKING TOIL. WHAT DOES A HUMAN SPIRIT FREED FROM TOIL CREATE? OUR WORLD. THE MODERN WORLD.
CHRIS WRIGHT, LIBERTY CEO 2016 COMMENCEMENT ADDRESS
Energy is the essential ingredient that makes everything happen. Everything. The dramatic complexity of living organisms today was only made possible by an energy revolution billions of years ago: mitochondria as the energy source in all complex life. Mitochondria organelles have their own DNA but are ubiquitous within nearly all complex plants and animals (eukaryotes) and provide four to five orders of magnitude more energy per gene than bacteria, enabling copious protein synthesis and, hence, complex lifeforms (source: https://www.pnas.org/content/112/35/E4823).
Human history has been profoundly influenced by the energy sources available. Harnessing of fire, perhaps a million years ago, significantly changed the energy (food) sources available to humans. While we have larger brains than other mammals, we also have a smaller digestive tract, which makes us unable to liberate much energy from complex carbohydrate chains. Cooking food breaks down these complex chains making them digestible in human stomachs.
The second human energy transition was the invention of agriculture roughly ten thousand years ago. This led to a large increase in the human ability to produce energy from the land. The soaring production of energy (food) from agriculture led to a substantial rise in human population and the first cities, written language, complex culture, and many other changes in human communities. Unfortunately, the historical evidence doesn’t show improvement in the lives of the average person. Life expectancy remained around 30 years before and after the arrival of agriculture. The second energy revolution changed the world markedly, but it did not improve the lot in life of the average human.
The third energy transition, the arrival of fossil fuels, completely changed humanity. This energy transition led to a doubling of human life expectancy globally. Prior to fossil fuels only a lucky few at the top of social hierarchies escaped dire poverty that simply was the human condition. Fossil fuels today support billions of people in lifestyles that were simply unimaginable only a few generations ago. Planes, trains, and automobiles changed the game of human mobility. Modern medicine, communications, the internet, and air conditioning have changed the human condition beyond recognition for our ancestors. The explosion of air conditioning post World War II dramatically changed the map of where people live, enabling growth of mega cities like Houston, Atlanta, Phoenix, and Miami. This one energy-enabled technology has led to mass migration in the U.S. to the warmer, sunnier climates that more people prefer.
16
Figure 1.2 provides a rough timescale of fossil fuels displacing the nearly 100% of human energy previously supplied by renewable biofuels and a small amount from wind. The figure shows how in the second half of the 19th century fossil fuels ignited the industrial revolution, enormously increasing human productivity that economic historian Deirdre McCloskey called the Great Enrichment. By the year 1900 over half of global energy was supplied by fossil fuels. It was not until after World War II, however, that the Great Enrichment began to spread in the world’s lesser developed countries. But spread it did. The decades after WWII saw billions of humans lifted out of poverty. A revolution that is still far from done, but has boosted living standards like never before.
After dominating human energy supply throughout history, renewable energy’s percent of global energy bottomed in the 1970s/1980s at around 13%. Since then, it has crept up to around 15% today as the continued gradual decline in market share of traditional fuels like wood, dung, and agricultural waste is being offset by the rise of solar, wind, and industrial scale biofuels. Solar and wind today make up about 2-3% of global primary energy supply. Also shown is the wide range of future projections for renewables market share from the International Energy Agency and U.N. out to 2050. Of course, projections are just projections. Figure 1.3 shows that changing the global energy system is a gradual process. It moves slowly even when significantly more
PRIMARY
Source: https://www.sciencedirect.com/science/article/pii/S0040162520304157
abundant, higher quality, cheaper, and cleaner fuels lead to consumer pull as in the case of hydrocarbons displacing older, lower quality energy sources.
In addition to the continued displacement of traditional fuel sources with hydrocarbons, there is a strong and growing force for change in today’s energy system: concerns about climate change. Climate change is covered in more detail in a subsequent section.
Media and political proclamations today calling for massive and rapid changes in world energy systems appear unrealistic.1 Similar proclamations have been made over at least the last five decades The recent record illustrates the collateral human damage when attempting to force large-scale change without superior, costeffective technologies. The early movers like Germany, the U.K., and California used top-down political mandates to drive changes in the energy system without carefully evaluating the tradeoffs. They
17
1800 1850 1900 1950 2000 2050 100% 90% 80% 70% 60% 50% 40% 30% 20% 10% 0%
Share
Renewables as
of Global Energy
Figure 1.3 Renewable energy as a percentage of total global energy, 1800-2050. Data from 1800-2018. The hatched funnel shows the spread of scenarios from the International Energy Agency and United Nations.
RENEWABLE ENERGY AS A PERCENTAGE OF TOTAL GLOBAL ENERGY Projections 1800 1810 1820 1830 1840 1850 1860 1870 1880 1890 1900 1910 1920 1930 1940 1950 1960 1970 1980 1990 2 00 0 2010 2020 Traditional biomass
All energy per person, TWh Figure 1.2 Source: Vaclav Smil (2017) and BP Statistical Review of World Energy. 140,000 120,000 100,000 80,000 60,000 40,000 20,000 0 Modern biofuels Other renewables Solar Wind Hydro Nuclear Gas Oil Coal Traditional biomass 1JP Morgan Annual Energy Paper 2021, Michael Cembalest: https://am.jpmorgan.com/ content/dam/jpm-am-aem/global/en/insights/eye-on-the-market/future-shock-amv.pdf
GLOBAL DIRECT
ENERGY CONSUMPTION, 1800-2019
have all driven significant increases in electricity (and other energy) prices with a resulting economic burden on their citizens, particularly lower income people who spend a larger percent of their income on energy. Lower income citizens also skew toward energy-intensive jobs like manufacturing, farming, and transportation and hence disproportionately see their jobs being displaced to locales with lower energy costs. We will cover this issue more in the following section on energy poverty.
The U.S. Energy Information Administration (EIA) data in Figure 1.4 gives a sense of the changing global sources of electricity over the last 50 years. The first thing that is clear is that global demand for electricity and energy is rising. Globally electricity represents only 20% of total energy consumption. In wealthy countries, electricity can get as high as 40% of total energy supplied. On a global basis coal is the largest source of electricity, supplying around 35%. Natural gas is second at around 25%. Low carbon energy sources – nuclear, hydropower, wind, and solar – combined supply just over 35% of global electricity, a market share that has been roughly flat for the last 35 years but is rising modestly now.
The last ten years have seen the dramatic impact in the United States, and to a lesser extent globally, of the shale revolution. American natural gas production has risen dramatically, which pushed global natural gas prices down.
The biggest impacts are seen in the electricity sector, where natural gas vaulted to the top supplying nearly 40% of U.S. electricity. Coal has fallen hard from over 50% of U.S. electricity supply just 15 years ago, to less than 25% today.
This has meant both cleaner air (lower PM2.5, SOX, mercury, etc.) in the U.S. and a decline in U.S. GHG emissions on a per capita basis to its lowest level in over 50 years. Well over half of the steep U.S. drop in GHG emissions over the last 15 years is attributable to natural gas displacing coal (source: EIA September 2020 report). The displacement of coal by natural gas has also led oil and gas to their highest ever market share of U.S. primary energy of nearly 70% in 2019 and 2020. The story is not a surge of hydrocarbons’ market share, just a shifting among oil, gas, and coal. Nuclear energy comes third at nearly 20% of U.S. electricity. The rest comes mainly from hydropower, wind, and solar.
18
Globally, and in the U.S., hydrocarbons remain just above 80% of total primary energy supplied as they have been for the last few decades. This is not to say that there are not significant changes happening in the mix of energy sources. Besides natural gas taking market share from coal, we have also seen solar and wind rising rapidly. Nuclear and hydro have not seen meaningful growth even with their status as the two largest sources of very low carbon energy. Hydro struggles with environmental pushback due to the large land footprint and intrusion in waterways. Nuclear is held back by uncertainty around permitting and regulatory challenges due to public fears over nuclear safety. The data does not support the public fears as nuclear has an outstanding, packleading safety record.
The global energy system is and always has been both complex and critical to human welfare. It is too important to get wrong. In our own time the energy system is just as important as ever, but it is also immense in scale, meaning that rapid change cannot be expected. As Vaclav Smil has reminded us repeatedly, energy transitions take time.
1985 1990 1995 2000 2005 2010 2015 2020 0 TWh 5,000 TWh 10,000 TWh 15,000 TWh 20,000 TWh 25,000 TWh Other renewables Solar Wind Hydropower Nuclear Oil Gas Coal
Figure 1.4 Source: EIA, Our World in Data based on BP Statistical Review of World Energy and Ember (2021) Note: ‘Other renewables’ includes biomass and waste, geothermal, wave and tidal.
GLOBAL ELECTRICITY PRODUCTION BY SOURCE

In sub-Saharan Africa, an estimated five out of six people (approximately 900 million people) in total lack access to clean cooking resources.
95%
Almost 95% of that subset of the population rely on solid biomass for cooking in the form of fuel wood, charcoal, or dung. The remaining 5% rely on kerosene or coal.
500,000
Household air pollution stemming from inefficient and polluting cooking fuels was linked to nearly 500,000 premature deaths in subSaharan Africa in 2018.
ENERGY POVERTY
The most urgent challenge with energy today is that fully one-third of humanity still lacks access to basic modern energy, including over 80% of Africans and half of Indians. Over two billion people still cook their daily meals and heat their homes with traditional fuels, typically wood, dung, agricultural waste, or charcoal. Simply for lack of access to a basic stove and an LPG canister, two to three million people die every year from the resulting indoor air pollution. This staggering loss of human potential can and must be eradicated.
2.5 MILLION
Globally, WHO estimates deaths from indoor air pollution at 2.5 million – a figure comparable to the combined death toll of malaria, tuberculosis, and HIV/AIDS in 2018.
19
WHO estimates there are several million additional deaths from outdoor air pollution from the same source: particulate matter, or PM2.5, which is one of the world’s deadliest emissions. Transitioning from traditional solid fuels to liquid fuels (or natural gas or electricity) is the key to reducing outdoor PM2.5 concentrations just as it is for reducing indoor PM2.5 levels. Figure 1.5 shows a global map of outdoor PM2.5 pollution. This problem is worst in Africa, south Asia, southeast Asia, and China, the same places where energy poverty drives the indoor air pollution crisis. Wealthy countries have used technology to have both highly energized societies and clean air.
Together PM2.5, malnutrition, preventable disease, and lack of access to drinking water and basic education collectively are responsible for over 10 million premature deaths per year. Bringing affordable, reliable energy to the world’s poor will be essential to eradicating these scourges.
GLOBAL SATELLITE-DERIVED
The good news is that tremendous progress is being made. Energy access is increasing globally as hundreds of millions of people have made the transition from traditional cooking and heating fuels to modern fuels – most commonly to liquid petroleum gas (LPG) –over the last 15 years. The U.S. shale revolution has been simply tremendous in lowering the energy cost bar for low-income families to transition from burning solid biofuels to clean-burning LPG stoves fueled by refillable LPG canisters. The U.S. is now by far the world’s largest exporter of LPG (dominantly propane) as well as the source of virtually all the growth in world LPG trade over the last decade. This has brought down LPG prices and significantly grown available supplies. Continuing this trend is essential to bringing everyone cleanburning cooking fuel in the next two decades.

Figure 1.5 Source: Global satellite-derived map of PM2.5 averaged over 2001-2006. Credit: Dalhousie University, Aaron van Donkelaar https://www.nasa.gov/topics/earth/features/health-sapping.html
20
MAP OF PM 2.5
AVERAGED OVER 2001-2006
Figure 1.6 Source: IEA and IHS Waterborne
Figure 1.7 Source: The World Bank, World Development Indicators (WDI) and UN Population Prospects

HEALTH AND HYDROCARBONS

21 0 1 billion 2 billion 3 billion 4 billion 5 billion 6 billion 7 billion 1990 1992 1994 1996 1998 2000 2002 2004 2006 2008 2010 2012 2014 2016 NUMBER OF PEOPLE IN THE WORLD WITH AND WITHOUT ELECTRICITY ACCESS, 1990-2016
with electricity without electricity U.S. RESPONSIBLE FOR VIRTUALLY ALL GLOBAL LPG EXPORT GROWTH 1,600 1,400 1,200 1,000 800 600 400 200 0 LPG waterborne exports (MBPD) U.S. Qatar Algeria U.A.E. Saudi Arabia Norway Iran Kuwait 2010 2014 2018 2020 2010 2014 2018 2020 2012 2016 2019 2012 2016 2019 2012 2016 2019 2012 2016 2019 2010 2014 2018 2020 2010 2014 2018 2020 Cleaner indoor
Poverty
air
abatement
CLEAN-BURNING LPG
TO MITIGATING OVER
MILLION DEATHS EACH YEAR FROM INDOOR AIR POLLUTION.
ACCESS TO
IS ESSENTIAL
2
Source: UN
Photo courtesy of the World LPG Association
THE DEVELOPED WORLD TAKES
ELECTRICITY ACCESS FOR GRANTED. FOR HUNDREDS OF MILLIONS OF PEOPLE IT IS A LUXURY OR ABSENT.
Nearly one billion people have no access to electricity. Another billion have only intermittent – four hours per day – access to modest amounts of electricity. This is enough to power a light bulb or charge a cell phone, but not enough to power a water pump or other machinery necessary to raise their productivity and energize significant increases in productivity and income. One billion people received their first access to electricity in the last 20 years – the large majority from hydrocarbons or hydropower.
Below are side-by-side maps of per capita electricity consumption by country and child malnutrition by country. There is a reason that both maps look quite similar: energy is the prime mover that enables everything else. If you have electricity, your life and that of your family improves beyond recognition.
Continuing the last several decades of unprecedented progress in the human condition requires massive increases in affordable, reliable energy for the world’s poorest countries and the poorest citizens in the world’s middle income and wealthy nations. While progress continues to be made, there are now growing headwinds due to the heavyhanded actions of the world’s wealthy nations in the name of climate change. The World Bank, European Development Bank, and many large commercial banks are now restricting or simply not offering funding for hydrocarbon-fueled power plants, which are the main source of electricity generation globally, and even more so in developing nations.
22
0 kWh >55,000 kWh 6,000 kWh 750 kWh
ELECTRICITY CONSUMPTION kWh PER CAPITA
Figure 1.8 Source: World Bank – World Development Indicators
CHANGING WOMEN’S LIVES
• WOMEN IN ENERGY POVERTY SPEND MORE THAN AN HOUR PER DAY GATHERING FUEL WOOD FOR COOKING.
• WOMEN IN ENERGY POVERTY SPEND AN HOUR PER DAY SOURCING WATER FOR DRINKING AND COOKING.
Source: UN report – https://sustainabledevelopment.un.org/content/documents/17489PB12.pdf

PERCENTAGE OF UNDERWEIGHT CHILDREN AT AGE 5
ENERGY ACCESS = BETTER HEALTH
Nations with low access to electricity have dramatically higher child malnutrition rates, as can be seen in the similarity in these two maps. Improved energy access is a necessary condition to improved health outcomes.
23
>60% 0% 10% 25% 40%
Figure 1.9 Source: World Bank – World Development Indicators
The United Nations Human Development Index (HDI) is a good rough proxy for the human condition as it combines life expectancy at birth, years of education received, and per capita gross national product. In 1990 62% of the global population (5.3 billion in 1990) scored “Low” on the HDI. The last three decades have shown tremendous progress as now only 12% of today’s larger population (7.6 billion) score “Low” on the HDI. However, 12% is still over 900 million people.
As with child mortality, and virtually any index of human well-being, increasing the HDI requires increased energy consumption. This point is illustrated in the two graphs below. The first graph shows the relationship between energy consumption per capita and HDI across countries, and the second graph shows the changes over the last thirty years for both China and India where rising energy consumption accompanies rising HDI.
ACCESS TO AFFORDABLE ENERGY IS ESSENTIAL FOR HDI IMPROVEMENT
(HDI)
ENERGY USE PER CAPITA (KG OF OIL EQUIVALENT)
Figure 1.10 Size of Circles Depicts Relative Size of Population | Source: World Bank and United Nations Development Programme 2018
24
HUMAN DEVELOPMENT INDEX
0 24
BETWEEN 1990 AND 2018, INDIA AND CHINA HAVE SEEN A 51% AND 52% IMPROVEMENT, RESPECTIVELY, IN HDI
INDIA
• MOVED FROM LOW TO MEDIUM HDI
• MEAN EDUCATION INCREASED 2.2X
• LIFE EXPECTANCY INCREASED 11.5 YEARS
• ENERGY PER CAPITA INCREASED 82%
ENERGY USE PER CAPITA (KG OF OIL EQUIVALENT)
CHINA
• MOVED FROM LOW TO HIGH HDI
• MEAN EDUCATION INCREASED 1.6X
• LIFE EXPECTANCY INCREASED 7.4 YEARS
• ENERGY PER CAPITA INCREASED 192%
Figure 1.11
Source: World Bank and United Nations Development Programme 2018
25
INDEX (HDI)
HUMAN DEVELOPMENT
Swedish public health doctor and global data maestro Hans Rosling wrote a great book as he was dying. Factfulness chronicles the enormous progress of humanity over the last several decades based on empirical measures of human well-being. The book also contains an illustrative figure (Figure 1.12), shown below, that captures and quantifies the range of today’s living conditions. What we often fail to realize is that only about one-seventh of the world’s population lives in conditions at all like the readers of this report. Too often policy-making and simply opinion formation focus only on that top one-seventh.
Rising from poverty and joining the modern, developed world requires an enormous increase in personal energy consumption. There is simply no other way to rise from poverty.
The modern world was enabled by a surge of available, reliable, affordable energy and all that followed in a highly energized society. The speed at which liberating, energy-rich living conditions can be brought to more people depends on the low energy costs that will create rising per capita income. Slower economic growth inhibits the rise out of energy poverty as do rising energy costs. Energy costs matter.


Energy access for the world’s least fortunate is not only a social goal for Liberty, it is a driving principle upon which the company was founded. Energy poverty is not just a developing world problem. Over 10% of Americans struggle to pay energy bills and report keeping their houses at unsafe temperatures to balance their budgets (source: EIA).
Rich-world policies made to combat climate change can cause more damage than benefits delivered if they don’t consider all the world’s citizens. Making energy more expensive or impeding access to hydrocarbons is dangerous and opportunity crushing for those struggling to better their lives. Many climate policies also generate poor results in lowering global GHG emissions.
Wood has higher GHG emissions than LPG per unit of energy. Extensive dependence on wood for fuel also leads to significant deforestation impacts. Haiti has suffered extreme deforestation as so many of its citizens depend on wood for heating and cooking, while neighboring wealthier and modern-energy enabled Dominican Republic is covered in rainforest. Aerial photos show the stark contrast at the border between these two nations.


26
Cooking Transportation Drinking Water LEVEL 1 LEVEL 2 LEVEL 3 LEVEL 4 LEVEL 1 LEVEL 2 LEVEL 3 LEVEL 4 WORLD POPULATION IN BILLIONS OF PEOPLE $2/Day $8/Day
Source: Factfulness Gapminder and Dollar Street 26
$32/Day Figure 1.12
OUR NEED FOR PETROCHEMICALS IS GROWING FASTER THAN DEMAND FOR HYDROCARBON ENERGY
A little-known fact is that 14% of worldwide oil demand and 8% of natural gas demand go to make petrochemicals, like plastics and pharmaceuticals. This demand is not for energy, it is to provide the essential raw materials that make the modern world possible. Petrochemical demand is growing faster than demand for oil or natural gas. Petrochemicals represent between one-third and one-half of total projected future demand growth for oil and gas. Could you imagine battling COVID without face masks, other PPE, syringes, carrier fluids for vaccines, etc.?
EVERYDAY GOODS
• Electronics
• Food packaging
• Clothing and footwear
• Textiles
• Deodorants and cosmetics
• Detergents
• Diapers
• Sports equipment
• Eyewear
TRANSPORTATION
• Lighter vehicle exteriors
• Synthetic rubber tires
• Fuel additives
• Engine coolants
• Interior panels, seats, and carpet
• Bicycles
• Boats
HEALTHCARE
• Sterile packaging
• Ethyl-alcohol/hand sanitizer
• Ventilators, monitors, defibrillators, masks
• PPE
• Room conveniences
• Vaccine syringes
• Vaccine carrier fluids and vaccine refrigeration
• Pharmaceuticals

DID YOU KNOW?
HYDROCARBONS ARE AN INTEGRAL PART OF THE COVID-19 VACCINE RESPONSE. THEY ARE USED TO DEVELOP, DISTRIBUTE, AND REFRIGERATE, AND ARE EVEN USED IN CARRIER FLUID IN VACCINES.
ENGINEERING AND OTHER
• Wind turbine and solar panel parts
• Battery containers and parts
• Coatings
• Insulation
• Paints
• Unbreakable glass
• Agro-chemicals

27
ENERGY ACCESS IS GREEN.

DOMINICAN REPUBLIC
HAITI
28
THE ISLAND OF HISPANIOLA IS SHARED BY HAITI AND THE DOMINICAN REPUBLIC.
The national border can be seen in this photo DUE TO THE SEVERE DEFORESTATION in Haiti as traditional biofuels are the primary energy source for much of the population.
The Dominican Republic, on the other hand, has EIGHT TIMES HIGHER PER CAPITA ENERGY CONSUMPTION than Haiti, almost entirely from fossil fuels.
Higher energy consumption means HEALTHY, LONGER LIVES.
Far less people relying on traditional energy sources like wood means THRIVING FORESTS AND A CLEANER ENVIRONMENT.
29
8X
CLIMATE CHANGE

The human condition has been completely transformed by three energy transitions: harnessing of fire, advent of agriculture, and fossil fuels. (source: Ian Morris, Foragers, Farmers and Fossil Fuels). The fossil fuel transition that so uplifted the human condition came with another change: climate change. While agriculture was the primary source of human energy, including that harnessed from draught animals, the carbon cycle had annual flows. During the Northern Hemisphere spring and summer plant photosynthesis, using energy from sunlight, draws carbon dioxide (CO2) out of the atmosphere to combine with water to make chlorophyll, the basic building block of plant biology. In the fall and winter photosynthesis drops dramatically and plant decomposition returns CO2 to the atmosphere, completing the annual cycle. Photosynthesis requires a minimum atmospheric CO2 concentration of 0.015% (150 ppm). During the last glacial period (16,000 to 100,000 years ago) atmospheric CO2 nearly breached this level, falling to only 180 ppm.
It is estimated that atmospheric CO2 concentration was just below 0.03% (280 ppm) before the industrial revolution and large scale burning of hydrocarbons, or fossil fuels. The hydrocarbon-powered global economic growth since World War II has driven a steady climb (shown in Figure 1.13) in atmospheric CO2 concentration to slightly above 0.04% (415 ppm in 2019) as humans have been liberating the solar energy stored long ago (over hundreds of millions of years) in ancient plants (coal) and marine phytoplankton (oil and natural gas). Atmospheric CO2 concentration rises due to the combustion of fossil fuels, which is essentially a reversal of the photosynthetic reaction where oxygen is combined (burning) with hydrocarbons. The equation shown on the next page represents the chemical reaction of burning methane, the simplest hydrocarbon.
One methane molecule combines with two oxygen molecules to create one CO2 molecule and two water vapor molecules (the white steam you see rising from power plants) while liberating significant amounts of energy to produce electricity, power industrial processes, heat your house, etc.
Double Preindustrial Levels
Atmospheric CO2
Photosynthesis Ceases
Figure 1.13 Scripps Institution of Oceanography NOAA Earth System Research Laboratory https://www.e-education.psu.edu/earth103/node/1018
30
1960 1970 1980 1990 2000 2010 2020 700 650 600 550 500 450 400 350 300 250 200 150 100 50 0
ATMOSPHERIC CO 2 AT MANUA LOA OBSERVATORY
CH4 +
2 O2 = CO2 + 2 H2O
Roughly half of the CO2 released in this combustion reaction has gone either into the oceans or into “greening” the planet as the increased availability of CO2 (plant food) in the atmosphere has led not only to increased agricultural productivity (why commercial greenhouses enrich their air with CO2) but also to a significant increase in grasses, trees, phytoplankton, and plant matter of all kinds across the globe. Figure 1.14 shows the significant greening of the planet over the last few decades.
The other half of the released CO2 has remained in the atmosphere driving the increased CO2 concentration shown in Figure 1.13. It is this increased atmospheric CO2 concentration that is the source of climate change concerns as CO2, like water vapor, methane and nitrous oxide, is a significant “greenhouse” gas. The term greenhouse gas (GHG)

is used because these molecules absorb infrared radiation that the earth continually emits into space to balance the incoming heat from the sun. The net impact of increasing GHG concentrations is to warm the average temperature of the earth. The largest warming is expected (and has been measured) in the cold polar areas at night with progressively less warming moving towards the tropics. Even in the tropics, the warming impact is larger at night than during the day. Estimates from radiation physics predict that doubling pre-industrial times atmospheric CO2 concentration to 560 ppm (likely by late this century) would result in a 1.3 – 1.4 degree C average warming of the planet in the absence of feedback effects. A recent empirical study of historical temperature data provides similar warming estimates of 1.2 – 1.8 degree C in response to a doubling of atmospheric CO2 levels (source: Lewis, Curry, 2018). There remains significant scientific uncertainty around feedback effects, mainly induced changes in atmospheric water vapor (a more significant GHG than CO2) and impacts on cloud formation. This is highly technical with myriad research efforts focusing on this critical topic. We will not delve into a discussion of climate feedback in this report.
This summary is simply to provide basic understanding and context around climate change and provide a summary overview of key historical observational data for global average temperature, sea level rise, extreme weather events and deaths from extreme weather events. The first two are rising, the third displays no trend, and the fourth is plummeting. These are far from the only areas of climate change discourse, but they are the central ones.
Figure 1.15 on the next page shows the entire record of the atmospheric temperature record from the University of Alabama, Huntsville. We show atmospheric data as this technology allows a
31
Figure 1.14 https://www.nasa.gov/feature/goddard/2016/carbon-dioxide-fertilization-greening-earth
GLOBAL GREENING FROM CO 2 FERTILIZATION
https://www.nsstc.uah.edu/data/msu/v6.0/tlt/uahncdc_lt_6.0.txt
more uniform measure across the whole planet, as opposed to landbased sensors that suffer from uneven spatial coverage, changing conditions around measurement locations like urban heat island effects, different temperature sensors employed, continuously evolving “homogenization” techniques, etc. Satellite measurement of global temperatures began in 1979. The full 40-year record of lower atmospheric temperature shown in Figure 1.15 shows a rate of warming of 0.14 degree C per decade.
Remote Sensing Systems also provide global atmospheric temperature measurements that show a somewhat higher rate of warming. Averaging the two raises the observed warming rate to around 0.17 degree C per decade. This implies that at the rate of warming observed over the past 40 years, we would expect little more than another one degree C of warming by the end of the 21st century. This is in addition to the roughly one degree C of warming that the world has seen over

WHILE GLOBAL SEA LEVEL IS RISING, CORAL ATOLL ISLANDS ARE NOT SHRINKING.
Source: https://agupubs.onlinelibrary.wiley.com/doi/10.1029/2020GL088752
32
1980 1990 2000 2010 2020 0.5 0.4 0.3 0.2 0.1 0.0 -0.1 -0.2 -0.3 -0.4 Temperature Anomaly (°C) UAH GLOBAL LOWER TROPOSPHERIC TEMPERATURE VARIATIONS (°C) 1979-2020
Figure 1.15
Version 6.0 of the UAH Temperature Dataset Spencer, et al 2015
the last century. Climate change impacts are most often estimated by economists based on the total warming from pre-industrial times. We will discuss these projections in the following Climate Economics section.
After increasing global temperatures, sea level rise and extreme weather events are the other climate changes that are most often raised as concerning. We include the data here on sea level rise over two different time scales and with two different measurement technologies. Tide gauges have the longest direct instrumental (not proxy) record of global sea level rise. Figure 1.16 shows a roughly 150-year record of changes in global average sea level from tide gauges. The modern rise in sea level began in the middle of the 19th century as the Little Ice Age came to an end and the planet started warming. It shows an average rate of rise of a little less than one inch per decade. The quality of the data set is limited by the number of tide gauges included, which is
1.16 Sea level rise PSMSL Tidal Data 1700-2002 Updated from Jevrejeva et al, 2008, https://www.psmsl.org/products/reconstructions/gslGRL2008.txt
lower in the early years of the record but much better in the more recent years. Despite this limitation it is worthwhile to view a longer-term perspective on sea level trends. From indirect proxy records, we know that sea levels have risen around 400 feet since the end of last glaciation nearly 20,000 years ago.
Figure 1.17 shows the satellite record of changes in sea level. The satellite sea level record only begins in 1993. It shows a relatively constant rate of sea level rise over its 28-year record of a little over one inch per decade (1.3 inches per decade). The discrepancy between the rates of rise from satellite and tide gauges remains in the most modern data. It is likely the result of the different measurement mechanism that each are employing. However, we have some
33
1880 1900 1920 1940 1960 1980 2000 2020 350 300 250 200 150 100 50 0 -50 -100 Global Mean Sea Level Change (mm) MEAN SEA LEVEL RISE FROM TIDAL STATION AND ALTIMETRY FROM 1880-2020
1995 2000 2005 2010 2015 2020 150 125 100 75 50 25 0 -25 -50 Global Mean Sea Level Change (mm) MEAN SEA LEVEL RISE FROM SATELLITE DATA FROM 1993-2020
Figure
Figure 1.17 Sea level rise https://scitechdaily.com/satellite-mission-keeps-a-steady-eye-on-sea-level-change-from-space/
Figure 1.18 Updated from Maue, R.N. (2011) http://climatlas.com/tropical/
Figure 1.19 Updated from Pielke, Roger (2020), https://journals.ametsoc.org/view/journals/clim/25/13/jcli-d-11-00719.1.xml
Figure 1.20 Source: https://journals.ametsoc.org/view/journals/bams/99/7/bams-d-17-0184.1.xml
*Cyclones are commonly referred to as hurricanes and typhoons.
34 1970 1980 1990 2000 2010 2020 2400 2000 1600 1200 800 400 Accumulated Cyclonic Energy (ACE) 10 4 knots 2 GLOBAL TROPICAL CYCLONE ACCUMULATED CYCLONIC ENERGY (ACE) 1972-2020
1970 1980 1990 2000 2010 2020 32 30 28 26 24 22 20 18 16 14 12 10 8 6 4 2 0 Number of global tropical cyclone landfalls GLOBAL TROPICAL CYCLONE LANDFALLS 1970-2018
U.S. TROPICAL CYCLONE LANDFALLS 1900-2020 7 6 5 4 3 2 1 0 Number of U.S. tropical cyclone landfalls 1900 1910 1920 1930 1940 1950 1960 1970 1980 1990 2000 2010 2020 Global Northern Hemisphere Category 1-2 Category 3+
confidence in knowing that sea levels are currently rising at a global average rate of around one inch per decade or perhaps a bit more, with no observable change in the rate of rise over the last few decades. We must say “global average” as sea level has significant geographical variability due to the uneven rebound of the continental plates (isostatic rebound) in response to the massive ice sheets melting at the end of the last glaciation 10,000 to 20,000 years ago. For example, currently sea level is roughly static near San Francisco and along the U.S. west coast, while rising at about global average along the U.S. east coast, and rising at a much more rapid rate than the global average on Australia’s west coast. Rising sea level presents a threat to coastal cities and their fresh water aquifers, hence it is important to understand what is happening.
Extreme weather features prominently in the news perhaps due to the frightening sense of awe inspired by hurricanes, tornadoes, floods and droughts. Extreme weather has killed millions of people over the years, displacing and impoverishing countless more. Fortunately, to date we have not seen an increase in extreme weather events, and deaths from extreme weather events have been plummeting as a wealthier, more energized world has proven far more resilient than in times past.
Figure 1.18 shows the trend in Accumulated Cyclonic Energy (ACE), a metric that captures together the frequency, duration and intensity of global hurricane activity since 1970. Figure 1.19 shows a different hurricane metric: the trend in the number of global land-falling hurricanes since 1970. Figure 1.20 shows the same metric for the United States dating all the way back to 1900. As you can see
1.21 Source: NOAA (2020) https://www.spc.noaa.gov/wcm/
Figure 1.22 Source: https://www.sciencedirect.com/science/article/pii/S0040162520304157
35
Figure
20 15 10 5 0 130 120 110 100 90 80 70 60 50 40 30 20 10 0 Area in severe drought, million km2 Number of tornadoes >F3 1900 1920 1940 1960 1980 2000 2020 1950 1960 1970 1980 1990 2000 2010 2020
GLOBAL AREA IN SEVERE METEOROLOGICAL DROUGHT, 1901–2017
U.S. STRONG TO VIOLENT TORNADOES (>F3), 1950-2019
U.S.
Figure 1.23 Source: https://ascelibrary.org/doi/10.1061/%28ASCE%2915276988%282005%296%3A1%2813%29; https://www.pnas.org/content/118/4/e2017524118/tabfigures-data; https://rogerpielkejr.substack.com/p/global-disasters-a-remarkable-story
U.S.
Figure 1.24 Source: https://iopscience.iop.org/article/10.1088/1748-9326/aab791; https://www.sciencedirect.com/science/article/pii/S0040162520304157#fig0018
from these figures, while there is large annual variability in hurricane activity, the data shows no obvious increasing trend. 2020 proved a very active hurricane season, at least in the Atlantic where there was a record number of named storms (tropical storms plus hurricanes). However, 2020 doesn’t even crack the top 10 years in Atlantic Accumulated Cyclonic Energy.
Figure 1.21 shows the frequency of severe tornadoes in the United States starting in 1954. Fortunately, the trend here appears to be downward.
Figure 1.22 shows the percent of the world in extreme level drought since 1900. There appears to be a slight decline in global drought prevalence over the last century, as might be expected as a slightly warmer world implies a slightly wetter world due to increased evaporation. Floods are harder to quantify except in their economic
damage. United States annual flood damage as a percent of GDP starting in 1940 is shown in Figure 1.23. Annual flood damage shows a meaningful downward trend, more likely due to better flood preparedness than due to an actual reduction in floods or extreme rain events. With the availability of abundant, reliable energy, humans have been better able to predict, prepare, and sometimes even prevent these deadly and costly flooding events.
Wildfires are a slightly different story as forest management practices play a leading role. A U.S. Forest Service scientists study of Western U.S. Forests concluded that increased “live fuel” due to changing forest management practices were responsible for more than 50% of the recent increase in wildfires. Figure 1.24 shows a hundred years of annual U.S. forest acres burned. In the 1930s wildfires annually burned several times more acres than they do today. The Wildfire Acres Burned graph also shows the dramatic impact of the
36
1926-2020
FOREST AREA BURNED,
50M 45M 40M 35M 30M 25M 20M 15M 10M 5M 0 0.75% 0.70% 0.65% 0.60% 0.55% 0.50% 0.45% 0.40% 0.35% 0.30% 0.25% 0.20% 0.15% 0.10% 0.05% 0.00% Millions of acres burned U.S. flood damage 1930 1940 1950 1960 1970 1980 1990 2000 2010 2020 1940 1950 1960 1970 1980 1990 2000 2010 2020
FLOOD DAMAGE AS PERCENTAGE OF GDP, 1940-2018
U.S. Forest Service Smokey Bear campaign launched in the 1940s that targeted preventing and early extinguishment of wildfires. Multiple regulatory changes from the 1960s onwards made significant changes to forest management practices.
By far the most important factor regarding extreme weather is the impact that it has on human lives. Here the trend is manifestly positive. Figure 1.25 shows the dramatic decline in the deadliness of extreme weather events. There has been an over 90% decline in annual global deaths from extreme weather over the last century even while the world population has more than tripled over the same time-period.
Wealthier societies with abundant access to affordable energy are simply far safer places to live. The large majority of the remaining deaths from extreme weather are concentrated in poorer nations with high rates of poverty and energy poverty (nearly synonymous). Spreading energy access to those currently in energy poverty discussed in the last section is the key to further driving down deaths from extreme weather.
While climate change is both broad and complicated, familiarity with the basic science and data is highly valuable and, sadly, quite rare. This brief section is included to provide an introductory overview of the chemistry, physics and empirical data surrounding the central climate change issues. The following section on Climate Economics touches on the work of economists to quantify the potential human impacts from climate change now and into the future.
GLOBAL DEATHS FROM SEVERE WEATHER, 1920–2020 (FLOODS, DROUGHTS, STORMS, WILDFIRES, EXTREME TEMPERATURES)
Figure 1.25 Source: EM-DAT: The Emergency Events Database - Universite catholique de Louvain (UCL)CRED, D. Guha-Sapir - www.emdat.be, Brussels, Belgium https://www.sciencedirect.com/science/article/pii/S0040162520304157#fig0018
37
450K 400K 350K 300K 250K 200K 150K 100K 50K 0 Deaths per year (average per decade) 1920 1930 1940 1950 1960 1970 1980 1990 2000 2010 2020
CLIMATE CHANGE ECONOMICS

The last section provided a brief overview of climate change and observed data that already happened. That covers the easy part. The future is harder. There are numerous global efforts to build complex models of the earth atmosphere, oceans and lands to predict the future course of climate change. The two biggest variables in these models are the future course of global GHG emissions and the nature of climate feedbacks, or climate sensitivity to the increasing atmospheric greenhouse gas concentrations. Climate economics goes one step further and uses predicted climate model results as inputs to estimate the human economic impacts of various magnitudes of future warming.
Climate economics is a rich and relevant topic in the energy industry. There are numerous relevant complexities like territorial GHG emission targets that localize the costs but socialize the benefits across the whole planet. For example, if the U.S. were to rapidly decarbonize its entire economy as many are advocating the costs would be counted in the trillions of dollars and the benefits to the U.S. would be rather modest. UN IPCC climate models predict a less than 0.1 degree C reduction in global temps in the year 2100 would result from a rapid and complete de-carbonization of the U.S. economy. For the U.S. to realize any material benefits GLOBAL emissions must be reduced.
This territorial problem is even more stark at the state level, although many states are passing legislation with territorial emission targets. We’ll leave this complexity and many others aside and discuss projected impacts on a global scale.
HOW MUCH RICHER WOULD THE WORLD HAVE BEEN HAD WE SOLVED DIFFERENT ISSUES, 1900-2050. COST OF CLIMATE CHANGE WITH OPTIMAL POLICY ADDED FOR REFERENCE.
Figure 1.26 Source: https://www.sciencedirect.com/science/article/pii/S0040162520304157
38
100 80 60 40 20 0 Cost of problem, % global GDP 1900 1920 1940 1960 1980 2000 2020 2040 2060 2080 2100 Air pollution Climate change Education Gender inequality Health NutritionConflicts
Trade
The most recent Intergovernmental Panel on Climate Change (IPCC) Assessment Report (AR5) provided estimates, almost certainly incomplete estimates, of economic damage from a cumulative 2.0 degree C of warming from pre-industrial times. The IPCC estimated that global per capita income would be reduced by somewhere between 0.2% and 2.0% from 2.0 degree C. of global warming. It cannot be overstated how immense is the problem to predict economic impacts of climate in the coming century! Nevertheless, for discussion purposes we cover the existing estimates from these efforts. The world is estimated to have so far warmed about 1 degree C since preindustrial times. At the current observed rate of observed warming of 0.17 degree C/decade from averaging the satellite data, we would expect to hit 2 degree C total warming around 2080.
The rate of global warming may increase in the future. Of course, it may also decrease. Scenarios of more significant 21st century warming are also considered. Nobel Prize winning climate economist, William Nordhaus, analyzed a scenario on the upper end of the IPCC projections where the rate of warming accelerates significantly and rises to 3.5 degree C by the end of the century even after his calculated optimal GHG mitigation efforts are undertaken. This is the scenario included in the figure in the CEO letter at the front of this report and in Figure 1.26. Estimated current and future climate economic impacts are plotted together with impacts from the world’s greatest current challenges like malnutrition, air pollution, disease, illiteracy, and gender inequality. Nordhaus estimates a less than 1% economic impact from climate change through 2050, rising to over 3% by 2100.
Projected economic impacts from climate change are global and large in gross dollar magnitude, but pale in comparison to today’s challenges for the one-third of humanity that still live in energy poverty/ economic poverty. It is very difficult to have confidence in global predictions nearly a century in the future, hence the
uncertainties on these predictions about the future are rightfully quite large. But even upper bound future predictions of climate damage from leading climate economists are far lower than those suffered today by people in energy poverty (source: Koonin, 2021).
As discussed earlier, two to three million annual deaths from energy poverty is a lower bound as it only considers impacts from a lack of clean cooking fuels. Despite media proclamations of dramatic threats to human health today from climate change induced rising extreme weather and heat, the climate change impact on mortality so far is likely a modest reduction in annual deaths. The Climate Change section showed the century-long dramatic decline in deaths from extreme weather. Deaths from extreme heat have likely risen, but those deaths are almost certainly far more than offset by a reduction in the number of deaths from extreme cold. Deaths from extreme cold globally are more than five times larger than deaths from extreme heat. Surely there are significant impacts from climate change today, but it is nothing near the magnitude of energy poverty.
Adjusted for omitted damages
39
Impact, % of global GDP 5% 0% -5% -10% -15% -20% 0°C 2°C 4°C 6°C 8°C 10°C Temperature increase
Nordhaus best regression
TOTAL IMPACT FROM TEMPERATURE INCREASE MEASURED IN PERCENT OF GLOBAL GDP Figure
1.27 Source: https://www.sciencedirect.com/science/article/pii/S0040162520304157
Figure 1.27 is a compilation of work done by climate economists projecting economic impacts over a wide range of possible future warming magnitudes. One thing that stands out among climate economics is the broad agreement that economic impacts today and over the next few decades are likely to be quite modest. This is exactly the time-period where energy poverty hits hardest: today and the near future. It is very possible on current trends of growing global economies and energy production that the next few decades could see a near eradication of severe energy and economic poverty.
These next few decades will likely also see tremendous progress in low-carbon energy technologies, including reliable on-demand (non-intermittent) sources like Enhanced Geothermal Systems, next generation nuclear, improved energy storage, and perhaps economic Carbon Capture Use and Storage (CCUS) and nature-based carbon sequestration. Solving climate change must and can be done with new technologies and systems that do not increase the price or reduce the
reliability of energy, as energy is simply critical to human flourishing and emergence from poverty. Unfortunately, too many efforts to date to address climate change have driven up the price of energy with enormous tolls on human lives.
Greenhouse gas mitigation efforts so far have been mostly in wealthy countries and concentrated in the power sector. Electricity, however, represents less than 20% of global energy and all the projected growth in GHG emissions is in non-OECD countries. Figure 1.28 shows global greenhouse gas emissions over the last 40 years broken down by major world regions/countries. This figure illustrates that the wealthy (OECD) countries have been reducing their GHG emissions for more than 20 years, while non-OECD countries GHG emissions are rising rapidly as they are energizing their societies and raising the standards of living of their residents.
Most GHG reduction efforts to date have been more effective at raising energy prices than they have been at reducing global greenhouse gas emissions. Meaningful global progress hinges on future advances in energy technology, an area of tremendous focus and real promise.
EU-27
EU-27)
California, Germany and the United Kingdom have been aggressive early movers in responding to climate change concerns and the results do not appear positive. California has driven their electricity prices up to 50% higher than the U.S. national average, displacing energy intensive industries out of the state. California has disproportionately harmed their low-income residents and now has the highest adjusted poverty rate of any U.S. state, according the U.S. Census Bureau. California’s negative impacts were coupled with only modest reductions in GHG emissions and much of those GHG “reductions” were simply exported out of California and not true reductions.
40
1750 1800 1850 1900 1950 2000 2019 0 t 5 billion t 10 billion t 15 billion t 20 billion t 25 billion t 30 billion t 35 billion t International transport Oceania Asia (excl.
Africa
(excl.
(excl.
China & India) China India
South America North America
U.S.) United States Europe
Figure 1.28 Source: Our World in Data based on the Global Carbon Project
ANNUAL
TOTAL CO₂ EMISSIONS, BY WORLD REGION
Germany’s aggressive de-carbonization efforts have doubled their electricity prices, now almost three times higher than the U.S. average while achieving a smaller percent reduction in their GHG emissions than the U.S. over the last decade. The United Kingdom has achieved a larger reduction in their GHG emissions but at a heavy cost to their residents as they have also driven electricity costs up dramatically. Energy prices matter. A lot.
The United Kingdom’s emission reductions are significantly overstated as it is now the leading nation in per capita imported GHG emissions,1 an unsurprising result of their territorial efforts to lower emissions leading to large scale outsourcing of energy intensive industries from the birthplace of the industrial revolution. China illustrates the degree to which energy intensive industries are displaced to countries with lower energy costs. China today produces 50% of the world’s steel, 61% of the world’s cement, and 31% of the world’s plastics.2
Our top priority now should be urgently addressing the immense energy poverty challenges. Starting with providing modern energy to the one-third of humanity still cooking with traditional fuels like wood,
1 https://www.gov.uk/government/statistics/uks-carbon-footprint, https://www.ons. gov.uk/peoplepopulationandcommunity/birthsdeathsandmarriages/deaths/bulletins/ excesswintermortalityinenglandandwales/2019to2020provisionaland2018to2019final
dung, and agricultural waste. Low cost LPG cook stoves exist and growing local businesses are providing stoves and LPG canisters to households eager to improve the health and well-being of their families. Another giant target is to energize the billion people who lack any access to electricity and at least a second billion who lack sufficient quantity and sufficient reliable electricity to drive up their incomes and quality of life. These two large groups are mostly overlapping. A third major concern is the rising grid instability problems in states and countries that are politically mandating large amounts of intermittent, unreliable electricity on their grids. These actions are driving up energy costs and driving down grid reliability for reductions in global GHG that are not significantly meaningful.
As the world seeks to reduce energy poverty and improve energy access for all citizens, we can also mitigate the risks of climate change via aggressive, thoughtful investing and innovating to develop lowcarbon ways to produce affordable, reliable, clean energy that is so essential for the long, healthy lives made possible by the modern world. Energy matters. A lot.
2JP Morgan Annual Energy Paper 2021, Michael Cembalest: https://am.jpmorgan.com/ content/dam/jpm-am-aem/global/en/insights/eye-on-the-market/future-shock-amv.pdf

THE BIG PICTURE
The Clean Air Act named six “Criteria Pollutants” that posed the greatest threat to human health: Ground-level Ozone, Particulate Matter, Carbon Monoxide, Lead, Sulphur Dioxide, and Nitrogen Oxides. Technology and Innovation — automobile catalytic converters, scrubbers on coal plants, dramatic improvements in Diesel engines, etc. — have led to a simply dramatic 83% decline in these six harmful pollutants over the last 50 years! By far the world’s deadliest pollutant, particulate matter, is considerably lower in the U.S. today than in all the other OECD countries in Europe and Asia.
The spectacular cleaning of American air has come about coincident with significant population growth, a more than doubling of per capita GDP, and a large increase in vehicle miles traveled. Broad-based innovation and (mostly) sensible regulation has enabled this success. A similar path can be followed by the world’s emerging economies as their per capita wealth grows. Historically, countries have traveled an enrichment path of necessities first, then improving environmental quality becomes prioritized as captured in the Environmental Kuznets curve.1 Many emerging middle income countries have lower environmental quality than they had previously. As per capita income rises, they follow similar patterns to the U.S., which has seen at least 50 years of improving environmental quality.
Figure 1.29 also tells the story of energy efficiency and market-based de-carbonization. U.S. per capita energy consumption is currently nearly 10% below where it was 50 years ago even with increases in personal income. Rising from poverty necessarily involves a significant increase in per capita energy consumption as machines replace human hands in producing life’s necessities. Further increases in human wealth become increasingly less energy intensive.
Per capita greenhouse gas emissions were relatively flat from 1970 until the shale revolution hit scale. However, today per capita greenhouse gas emissions have dropped by 22% compared to 1970, significantly driven by natural gas rapidly replacing coal as the U.S.’s
leading source of electricity. Gas displacement of coal in the U.S. has mostly been driven by cost reduction. However, gas electricity generation brings an additional benefit: further reduction of air pollutants.
Globally, coal is still the world’s dominant source of electricity with a market share over one-third. Growing natural gas electricity generation globally could be a major source of greenhouse gas reduction as well as a major factor in reducing air pollution. China, India, Korea etc. are all pursuing this strategy. In most countries without significant local natural gas production, coal electricity is still the most cost effective option. An even more urgent energy substitution is to transition the remaining one-third of humanity away from cooking with wood, charcoal, dung or agricultural waste. Liquid Petroleum Gas (LPG, mostly comprised of propane) has been the dominant replacement cooking fuel for people moving out of energy poverty. Surging U.S. exports of propane are increasing availability and lowering the cost to make this critical step out of energy poverty.
1 https://www.perc.org/2002/12/01/the-environmental-kuznets-curve/
AGGREGATE EMISSIONS DOWN 83% SINCE 1970
42 EMISSIONS AND AIR QUALITY:
-83%
U.S. PER CAPITA GROWTH AND EMISSIONS 1970-2017
SINCE 1970, ON A PER CAPITA BASIS:
Income has more than doubled, aggregate emissions have plummeted by 83%, and since the start of the Shale Revolution, GHG emissions have reached a 50 year low.
Figure 1.29 Source: EPA ** 6 named criteria pollutants from The Clean Air Act: Ground-level Ozone, Particulate Matter, Carbon Monoxide, Lead, Sulphur Dioxide, Nitrogen Oxides
Image source: https://historicpittsburgh.org/islandora/object/pitt%3ASCLS001

TRIANGLE PARK, PITTSBURGH, PA, 1940 AT 8:38 AM

TRIANGLE PARK, PITTSBURGH, PA, PRESENT DAY
150 100 50 0 -50 -100 1970 1975 1980 1985 1990 1995 2000 2005 2010 2015 2020 Aggregate Emissions **: -83% CO2 Emissions: -22% Vehicle Miles: +82% GDP: +128% Energy Consumption: -9% % CHANGE SINCE 1970

44
PART 2:
LIBERTY TODAY: BETTERING HUMAN LIVES AND REDUCING ENVIRONMENTAL IMPACTS
THE SHALE REVOLUTION
IMPROVING ENVIRONMENTAL PERFORMANCE
DIGITAL TECHNOLOGY
FRAC ENGINES
NOISE/DUST/SAND
FRAC FLUID CHEMISTRY
WATER
ECOLOGICAL IMPACT
COLORADO FRONT RANGE: CASE STUDY
SAFETY
COVID-19 RESPONSE
CULTURE OF EXCELLENCE
REVITALIZING SMALL TOWN AMERICA
COMMUNITY ENGAGEMENT
CORPORATE GOVERNANCE
BUSINESS AND REGULATORY AFFAIRS
KEY METRICS AND DISCLOSURES - SASB
45
THE SHALE REVOLUTION

THE UNITED STATES HAS RESHAPED ENERGY MARKETS BOTH DOMESTICALLY AND AROUND THE WORLD. THE UNITED STATES IS A CORNERSTONE OF GLOBAL ENERGY SECURITY. 1
DR. FATIH BIROL IEA EXECUTIVE DIRECTORThe American shale revolution has transformed world energy markets and driven a significant drop in GHG emissions, particularly in the U.S. The shale revolution has led the U.S. to produce more total energy than it consumes for the first time since the 1950s, which also significantly impacts the U.S. trade balance and geopolitical calculus.
Liberty was founded 10 years ago due to a strong desire to help drive further growth and improvements to the shale revolution. Our focus remains the same today, although it is expanding in scope as we see additional energy opportunities for Liberty’s services, technologies and expertise. Much of the later sections of this report cover Liberty specific efforts, and even delving into the details in specific areas of
Liberty’s operations. However, to fully judge Liberty’s impact requires a holistic view of the ESG impacts of the whole industry.
The shale revolution has positively impacted several key factors in the energy system: lowering energy costs, increasing energy density, lowering pollutant and GHG emissions intensity, and diversifying global supply sources.
The next several sections cover specific areas of Liberty’s business, all in the service of bettering the shale revolution. Liberty is shrinking our environmental impact and working in harmony with the communities in which we operate.
Later you will also read about our commitment to building a strong, diverse, and ethical workforce and our exceptional independent Board of Directors working to make sure that corporate governance is aligned with our shareholders and the communities in which we operate.
1 https://www.iea.org/news/the-us-shale-revolution-has-reshaped-theenergy-landscape-at-home-and-abroad-according-to-latest-iea-policy-review
46
MAJOR ESG IMPACTS OF THE SHALE REVOLUTION
Surging growth in oil, natural gas, and natural gas liquids production has driven down global energy prices, saving energy consumers over $1 trillion annually
A particularly rapid rise in global propane (and other NGLs) supplies which lowers the cost and increases the availability of the key clean cooking fuel, LPG. Potential to save millions of lives annually as wood, dung, charcoal and agricultural waste are displaced.
U.S. is again a net energy exporter for the first time since the 1950s
Natural gas drilling rig count is down by 90% from 15 years ago, yet the U.S. has gone from the world’s largest importer of natural gas to one of the top exporters
Re-shoring blue collar American manufacturing jobs due to low-cost energy
Enormous growth in well-paying (~$100K) blue collar jobs in rural U.S. and Canada, areas with severe economic stress over the last decades as urbanization progresses
Lowering geopolitical tensions via greater diversity of oil and gas suppliers
Improving U.S. air quality, most importantly PM2.5, to the best in generations
Largest factor in reducing U.S. GHG emissions to the lowest in nearly 30 years, and on a per capita basis to the lowest in over 60 years
Dramatic increase in energy produced per acre of land disturbed, evidenced by North Dakota’s Bakken oil field using less than 2% of surface land with minimal impact on local farms and ranches
NEW YORK VS. PENNSYLVANIA: A TALE OF TWO RURAL COMMUNITIES
If you miss the sign, you will notice no change in the countryside while driving north from Susquehanna County Pennsylvania into Broome County New York. Nothing in the subsurface geology changes either. Job opportunities, tax revenues, and opportunities for small businesses, however, change dramatically. Susquehanna County is booming with Marcellus Shale natural gas production. Broome County has zero Marcellus Shale natural gas production. The facts below highlight the stark differences across the two local communities.
PENNSYLVANIA
Pennsylvania embraced the energy industry and from 2007-2012 experienced large job and wage growth, despite the great recession. The oil and natural gas industry saw a 259% increase in jobs, 12% increase in average annual pay, and 36% growth in wages. Rural and lower income areas of the state saw the most job growth and revenue, a change largely welcomed by residents and businesses. Since 2012, the natural gas impact fee has raised at least $1.7 billion for the state.
NEW YORK
New York Implemented a moratorium on hydraulic fracturing in 2008 and banned it outright in 2014. The ban has cost approximately 400 jobs per year in many counties. New York is the 6th largest consumer of natural gas in the U.S. New Yorkers pay the ninth highest average price for electricity, 45% higher than Pennsylvania and the national average.
Source: EIA, https://powerthefuture.com/wp-content/uploads/2020/01/PA-NY-Study.pdf
47
IMPROVING ENVIRONMENTAL PERFORMANCE
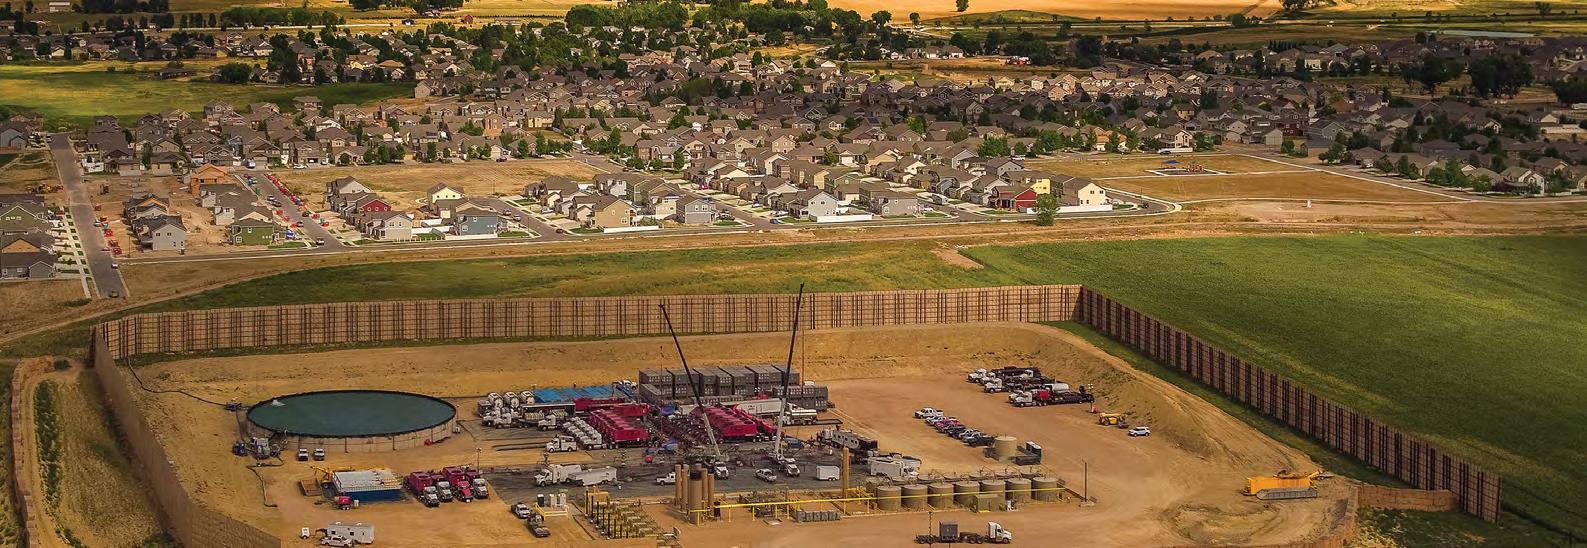
At Liberty, we are extremely proud of the investments we have made and continue to make with the goal of reducing our negative impacts and growing our positive impacts. We are committed to working with our partners, both customers and suppliers, to identify and act on new opportunities to mitigate negative impacts. The following pages highlight some of the mitigation areas in which we are focused and some of the successes we have achieved.
Perhaps our most successful mitigation has come from efficiency gains made possibly by our extensive development of digital optimization tools. Liberty’s tools, from our North Americanwide extensive database of shale wells to our physics-constrained multivariate analysis “Big Data” tools, and our direct measurement diagnostics of fracture growth, all serve to make each shale well more productive, less resource consuming and lower emissions producing.
In the world of steel and rubber, we had great success in reducing truck traffic traveling to fracture locations from multiple avenues. Liberty’s early (2014) move to containerized sand ensured that each truck was hauling an optimal load of sand to location, minimizing
the number of trips required. A typical well-pad requires 1,000 sand loads per month, so even a 5% improvement in sand hauled per load is meaningful. We are taking further steps in this area using smart dispatching software. This software provides insight into the efficiency of our truck fleet and the opportunities for further progress. Eventually, it will fully automate the routing of all our trucks with consideration for load and unload times and traffic and road conditions, minimizing the overall impact for our proppant (sand) supply chain.
Liberty is also moving toward “dry” chemical additives wherever possible. “Dry” chemicals are replacing legacy chemical delivery that uses mineral oil as a carrier fluid to contain the desired chemicals. One truck load of dry additive might replace four loads of the equivalent liquid additive. These dry additives also remove the manufacturing step of slurrying the chemical into mineral oil, further lowering the footprint.
The various oil and gas production basins in the lower 48 U.S. States are geographically widespread. Liberty is strategically located in
48
each of the major basins, nearby the work we will be completing. This helps to reduce distances traveled to and from location before, during and after each job. Our supply chain is designed with this same principle in mind. The breadth and scale of the Liberty supply chain ensures access to the necessary sand and chemicals at conveniently located facilities, keeping trip distance and number of trucks at the lowest possible levels.
Reduction of emissions on location is accomplished via the deployment of next generation frac engine technology. Much like automobile engines, today’s large diesel engines are dramatically cleaner than their older counterparts. Liberty has been an enthusiastic test partner and early adopter of each improved engine technology, with the latest being Tier IV DGB (Dynamic Gas Blending). We are also very excited about the next step in this journey – an electric frac fleet that we have been developing over the past three years.
There are some places where, by necessity, oil and gas completions activity takes place in close-proximity to households and other occupied structures. Noise levels were the single biggest complaint to regulatory agencies in these circumstances. So Liberty set out to address the issue. Two years of R&D led to the deployment of the Quiet Fleet, a frac fleet so quiet that you could listen to the birds chirping just 500 feet away from active frac operations. Liberty now has eight Quiet Fleets working across the country, making the lives of those living nearby and those working on location much quieter.
A typical fracture treatment requires millions of gallons of water. Historically, this was all fresh water. Recognizing that we could do better, Liberty has worked closely with our chemical supply partners and customers to migrate further and further toward alternative water sources, including saline non-potable water and recycled water from previous oil and gas production operations. We have made meaningful progress in this area, allowing our customers to use an ever increasing percentage of non-fresh or recycled water.
Liberty has a proud history of innovation leading to reductions in the impacts of our fracture services. Many further initiatives are underway, ensuring that each year we are improving.

IMPROVING ENVIRONMENTAL PERFORMANCE
DIGITAL TECHNOLOGY

affordable energy from the same number of wells drilled. This marked improvement in efficiency has been a major driver of increased energy density, reduced environmental footprint, and downward pressure on the price of natural gas, natural gas liquids and oil. All three are helping to better human lives.
How did Liberty and our customer partners achieve this dramatic well performance increase? It all starts with carefully building a database of well performance, geologic parameters of the producing rocks, and careful recording of the specific fracture and completions designs
Proprietary statistical analysis combined with calibrated frac and reservoir models allow us to provide valuable insight for our customers. These tools determine which frac design changes best impact production economics. Our tech team is focused on data. We have built a range of data-centric tools to help our customers build better wells. Liberty FracTrends visualizes our extensive proprietary database of completion, petrophysical and production data assembled from both public and private sources, as shown to the right. Our database covers more than 100,000 unconventional wells in the basins where we work. We use statistical analysis methods such as multi-variate analysis
50
(MVA) to uncover independent relationships between frac design parameters and well productivity. Our economic model, Liberty’s Fraconomics, incorporates the cost impacts of frac design changes to optimize per barrel of oil or MCF of natural gas production costs for our customers.
Liberty customers are technology leaders in the shale revolution. Together, we strive relentlessly to lower production costs, shrink negative environmental impacts, and improve the communities where we operate.
OVER THE LAST DECADE, SHALE TECHNOLOGY HAS DOUBLED U.S. OIL PRODUCTION, CUTTING OIL PRICES IN HALF. THIS SAVES CONSUMERS OVER $1 TRILLION A YEAR (APPROXIMATELY $200 FOR EVERY HUMAN ON THE PLANET).


51
Figure 2.1 Visualization of Permian Basin Well Productivity from Liberty FracTrends database.
Figure 2.2 Liberty physics-based models of hydraulic fracture growth.
Figure 2.3 Economic optimization of fracture design parameters.
FRAC ENGINES
When Liberty built its first frac fleet in 2011, the engines used were capable of consuming only diesel fuel and met the then current Tier II emissions standard for off-road engines. In the years since that first fleet, engine technology has continued to advance. Liberty has been an early adopter, and often a test partner, of each of these advancements. We are keen to provide our customers with the best available technology for their completions.
The diesel engine we use now is cleaner and more powerful than ever before, and the dual natural gas/diesel fuel capabilities have also advanced significantly when compared to earlier generations.
In 2013, our second year of operations, Liberty deployed its first Tier II dual fuel frac fleet. This advancement allowed for the displacement of up to 65% of the diesel fuel with natural gas. The use of natural gas in place of diesel offered benefits from both a cost and particulate matter emissions standpoint when compared with the base Tier II engine. Tier II dual fuel capabilities were included in every new Liberty fleet built between then and the end of 2017 until a higher standard became available.
Tier IV emissions requirements became effective and available at the start of 2018, ushering in a new generation of vastly cleaner diesel engines that had 90% lower NOX and particulate emissions when compared with the original Tier I diesel engines. Liberty built several new fleets using the new Tier IV engines for deployment in 2018. Caterpillar introduced dual fuel capability to its Tier IV frac engines in the fall of 2019, pushing the diesel displacement rate to 85% from the previous limit of 65% on a Tier II engine. As an early field test partner for this technology, Liberty had already developed a level of comfort with the new system and quickly placed an order for 45 of these next-generation engines to ensure our ability to provide customers
access to this better technology. Liberty is committed to upgrading additional fleets to this leading engine technology in the coming months and years to improve the technology of our fleet and drive emissions down.
A further opportunity for emissions reduction on diesel and dual fuel fleets comes in the form of engine idle reduction on location. Currently, engines are often left idling between fracture stages, leading to unnecessary fuel consumption and resultant emissions. This happens because the process of shutting down and restarting a large 2500 HP diesel engine is not simple. Liberty is in the process of testing an idle reduction system that would automate the process of shutting down and restarting frac pumps, which is expected to lead to a reduction of about 30% in idle time.
Our next step in the journey to deliver cleaner, safer, more efficient and resilient frac operations is the deployment of a fully electric frac fleet, an effort we began years ago. Our novel approach to electric frac fleets addresses many of the shortcomings present in early-generation electric frac equipment. A redesigned pump to distribute higher flow rates through more valves, and multiple electric motors running in parallel to ensure redundancy and efficiency are just a couple of the unique features that distinguish Liberty’s coming digiFrac pumps. When paired with the fully electric process trailer (combination blender and hydration unit) acquired through the OneStim transaction, Liberty will be able to offer a fully electric frac fleet. This fleet is designed to be powered by high-efficiency natural gas reciprocating engines paired with a battery pack to ensure optimal operations and emissions profile. We arrived at this conclusion after an extensive study observing emissions of different electric configurations (please see whitepaper in Appendix titled: The Next Generation of Fracturing Fleets, A Liberty ESG Evaluation at libertyfrac.com).
PERCENTAGE OF REDUCTION IN PARTICULATE MATTER EMISSIONS FROM TIER II DIESEL TO TIER IV DGB
PERCENTAGE OF DUAL FUEL CAPABLE FLEETS 26%
PERCENTAGE OF TIER IV OFF-ROAD ENGINES
52 IMPROVING ENVIRONMENTAL PERFORMANCE
-87%
35%
In Liberty’s 10-year history we have seen a dramatic decline in particulate matter emissions with next generation frac fleets and a significant decline in NOX emissions. We have more work to do on GHG emissions at the frac fleet level, and we are making progress. Our latest frac fleet technology, digiFrac, should deliver a significant 20% or more decline in GHG emissions at the frac fleet level.
Holistically, however, Liberty and our industry have in fact delivered dramatic GHG reductions via the shale gas revolution. This has led to a large reduction in U.S. GHG emissions that is now being exported as surging U.S. LNG exports are driving down the global cost of natural gas and making it more competitive with coal globally. In addition to the GHG emissions from the shale revolution, the accompanying declines in particulate matter (PM2.5) emissions are even more dramatic and impactful for human health. The rising role of natural gas in the U.S. electricity sector has helped drive down PM2.5 emissions together with reductions in SOX and mercury emissions as well. At a much smaller scale, the same can be said globally. Perhaps most importantly, rising U.S. exports of propane and butane are helping millions graduate from cooking with wood, dung, and agricultural waste to clean burning LPG. The number of lives saved is likely counted in the hundreds of thousands.
2.4 CO2e is the combination of CO2 and unburnt methane emissions from an engine. Tier IV engines are slightly more efficient that Tier II engines, leading to reduced to CO2 emissions. Tier IV DGB technology is a dramatic improvement over the older Tier II dual solution, reducing methane slip to basically zero.
MATTER
Figure 2.4 The emission of particulate matter (PM), the black smoke typically associated with a diesel engine, is massively lower for a Tier IV engine than for a Tier II diesel engine. This reduction is accomplished through the use of a diesel particulate filtration system on each engine.
NOX EMISSIONS
Figure 2.6 NOX emissions are a result of high temperatures in the combustion process. One of the main goals when transitioning from Tier II to Tier IV engines was to reduce NOX emissions. The manufacturers accomplished this by reducing peak temperatures and pressures within the engine.
Source: all figures are generated using proprietary
53
PARTICULATE
CO2e EMISSIONS NO x EMISSIONS ( g/kW-hr ) PM EMISSIONS ( g/kW-hr ) CO 2 e EMISSIONS (g/kW-hr) TIER II DIESEL 4.55 7.00 6.00 5.00 4.00 3.00 2.00 1.00 0.00 TIER II DUAL FUEL TIER IV DIESEL TIER IV DUAL FUEL 5.77 3.69 3.69 TIER II DIESEL TIER II DIESEL 49.26 796.0 60.00 50.00 40.00 30.00 20.00 10.00 0.00 1,200.0 1,000.0 800.0 600.0 400.0 200.0 0.00 TIER II DUAL FUEL TIER II DUAL FUEL TIER IV DIESEL TIER IV DIESEL TIER IV DUAL FUEL TIER IV DUAL FUEL 45.04 1,015.9 9.03 788.1 6.28 786.1
EMISSIONS
Figure
data and modeling tools.
NOISE/DUST/SAND

QUIET FLEET
While many oil basins are located beneath rural farm and ranch land, there are areas of some basins that overlap with significant population centers and urban areas. Along the edges of these developed areas, and sometimes in the middle, wellsites need to coexist with homes.
With the goal of being responsible neighbors, the exploration and production companies that operate in these urban areas continually seek ways to minimize their footprint. A top area of focus is noise levels. To assist in mitigating the noise issue, Liberty invested several years of research and development leading to the introduction of our patented Quiet Fleet™. The Quiet Fleet™ combines a suite of noise reduction solutions that together help to reduce sound levels of a frac fleet by approximately 3x compared to a fleet not equipped with the technology. High rate fracturing operations can be conducted with the expectation that noise levels 500 feet from the pad would be equivalent to that of a nearby conversation. This was no easy feat as our fleets have similar horsepower to a 747-jet engine. Liberty Quiet Fleets™ also make for a much safer working environment for field personnel. The reduced noise levels allow for improved communication on location and significantly reduced impacts to and complaints from neighboring communities.
54
3 x QUIETER THAN A CONVENTIONAL FRACTURING FLEET ROCK CONCERT STADIUM SPORTING EVENT FOOD BLENDER (@3 FEET) HEAVY TRAFFIC NEIGHBOR’S LAWNMOWER CONVENTIONAL FRAC FLEET (@1000 FEET) NORMAL CONVERSATION LIBERTY QUIET FLEET (@ 1000 FEET) LIBRARY THRESHOLD OF HEARING 110 105 85 80 70 65 60 50 30 5 NOISE LEVEL (DB) IMPROVING ENVIRONMENTAL PERFORMANCE

CONTAINERIZED SAND
A single frac fleet will pump several million pounds of silica sand underground in a 24-hour period. The logistics involved in picking up that sand, transporting it to location and ultimately into the blender for pumping is a significant undertaking. Historically, this process involved the use of a pneumatic trailer for hauling the sand and a larger blower which transferred the sand to storage bins on location using a stream of air. Not only was this a very noisy process, it was also incredibly dusty. Liberty recognized early on that there must be a better way to handle sand. The dust and noise from conventional sand handling techniques were a common source of complaints from nearby residents.
In 2014 Liberty moved the transport of sand to a completely containerized method. Like shipping containers, this allowed for the transfer of a box full of sand on location rather than the transfer of the sand itself. The innovation of containerized sand removed the pneumatic trailer from the equation, eliminating the noise and dust
that had long been a part of hauling sand. It also optimized volumes that could be hauled, minimizing the number of truck trips made to a given location. Silica exposure levels on location dropped by as much as 10-fold at the blender with the switch providing a much safer environment for personnel on location and a massive reduction in dust released to the atmosphere.
Containerized sand also provides a significant reduction in emissions on location. It takes a forklift 7-9 minutes to unload two full boxes from a trailer and replace them with two empty ones. Compared to the historical approach of blowing sand from a pneumatic trailer into a storage bin on location, this represents an 80% reduction in the time that a truck would be sitting on location idling while the load is transferred. At approximately 1000 truckloads of proppant per month per frac fleet, a Liberty fleet using containerized sand saves up to 36,000 minutes of engine idle time per month.
55
IMPROVING ENVIRONMENTAL PERFORMANCE
FRAC FLUID CHEMISTRY

Liberty has been a pioneer driving frac fluid chemistry forward since our founding. We have focused on the twin goals of increasing production efficiency and therefore lowering the cost of producing natural gas and oil from shale, while also reducing the usage of frac chemicals. Another avenue of improvement has been our drive to develop and use ever-greener chemicals.
We’re proud that we have helped reduce the number and volume of chemicals needed to make top-performing frac fluids. Liberty has worked hard to go even further by continuously looking for safer and greener alternatives. Most of our frac fluid systems can be made with only ingredients purchased at a local grocery store. Of course, we don’t actually source chemicals from a grocery store. For cost reasons we source in bulk. Liberty’s GreenSelect program uses Global Harmonized System (GHS) as developed by the United Nations and adopted by OSHA to track health, physical and environmental hazards.
It is Liberty’s aim to be a good neighbor. Efficiency gains and well economics have driven Liberty to the forefront of efforts to lower the cost to place a pound of proppant (sand) downhole – an effort that has also led to cleaner and safer alternatives. This effort starts from the very launch of our company 10 years ago in North Dakota’s Williston Basin where Liberty championed slickwater (FR) frac jobs
instead of the gels commonly being used then. Liberty’s slickwater designs are now standard practice throughout the Williston Basin. We played a similar role in driving Colorado’s DJ Basin away from expensive, chemical intensive frac fluid systems to simpler, cleaner fluid systems pioneered by Liberty. Liberty engineers and chemists have deployed sophisticated flow-loops, oscillating rheometers, mass spectrometers, and extensive knowledge to advance the economics of shale gas and oil production while also reducing environmental impacts and risks.
Our industry is subject to state and federal regulations, such as the Safe Drinking Water Act, which has helped to make our industry BTEX-free (no use of Benzene, Toluene, Ethylbenzene and Xylenes) since the early 2000s.
Opponents of fracking rightfully pointed to the hundreds of chemicals found in frac fluid and, more importantly, the lack of transparency about frac fluid recipes. Our industry was wrong to initially oppose efforts to bring transparency on what exactly is pumped underground. Fortunately, since 2011 oil and gas operators submit a list of all chemicals pumped as provided by their Frac services company, down to the gallon and pound, to FracFocus, a public online repository. Liberty welcomes the industry wide transparency of today.
56
As shown in the graph below, there is a general trend away from more expensive, viscous chemical derivative guar frac fluid systems that dominated for decades. Guar systems are being replaced with simpler, water-dominant, low-concentration Friction Reducer (FR) based fluid systems called “slickwater.” The innovation of low viscosity, water-dominant frac fluid systems was not only essential to cracking the code of extracting oil and gas from shales, it also led to a significant greening of the fracturing process itself (source: Fisher, et.al, 2002, 2004). Moving from traditional guar-based viscous frac fluids to slickwater – water plus a FR chemical – led to a dramatic reduction in chemical additives used in fracturing. Certain applications still require a more viscous frac fluid, but advancements in slickwater frac fluid systems continue to gain market share as shown in the plot below. Since 2014 an increasing amount of frac treatments employ slickwater (FR fluid systems), including the heavy sand-laden parts of jobs that previously required more viscous gels. The displacement of viscous gels has been made possible by improvements to FR fluid systems, allowing them to transport higher
HISTORICAL CHANGE IN AVERAGE FRICTION REDUCER AND GEL CONCENTRATION FOR FRACTURE TREATMENTS
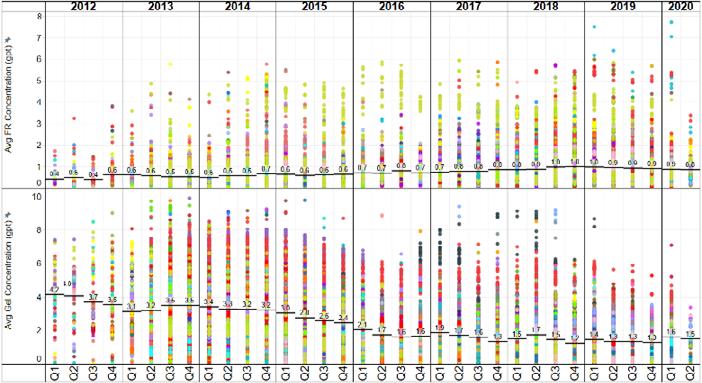
2.7 Source: Liberty FracTrends Database. Historical change in average Friction Reducer and gel concentration for fracture treatments in liquid-rich reservoirs pumped between 2012 and 2020. In general, the all-in average FR concentrations have increased while average gel concentrations have been reduced.
added sand concentrations. Another benefit of FR systems is that they do not need the additional chemical additives such as crosslinkers, buffers and breakers that are required when using guar gel frac fluid systems.
While using 100% water may be an elusive goal for frac fluid composition, the industry has successfully replaced the need for fluid “viscosity” with fluid “velocity” through higher frac pumping rates. Our industry’s future will continue driving toward cleaner frac fluids that trend toward the composition of water in a swimming pool. The diagram below represents the potential future composition of a light FR frac fluid – made with 99.8% water, with a small fraction of friction reducer (FR), biocide and a surfactant.
FLUID COMPOSITION OF FR FRAC FLUID
99.83% Water
0.10% Soap
0.05% Friction Reducer
0.02% Bleach
2.8
57
Figure
Figure
IMPROVING ENVIRONMENTAL PERFORMANCE
WATER

Water is a precious resource critical for life on earth. Oil and gas production requires significant water use, whereas the combustion of oil and gas creates new fresh water. Hence our work touches the water cycle in multiple ways. Liberty and our customers are keenly aware of this fact and we have worked to reduce our usage of fresh water, protect fresh water sources present in our areas of operation, and to grow our usage of recycled water.
LIBERTY INNOVATIONS ENABLE OUR CUSTOMERS TO RECYCLE WATER FOR FRAC OPERATIONS
The production of oil and natural gas brings to the surface subsurface water from two sources: 1) half or more of water used in operations like hydraulic fracturing soon flows back to the surface with the subsequent natural gas and oil production, and 2) formation water
that was present for millions of years with oil and gas in the reservoir rocks also flows to the surface with oil and gas production. Liberty works with our customers to increase the use of recycled water from these two sources in subsequent well-fracturing operations. We do this by developing custom fluid chemistry that is compatible with the highly brine produced formation water in our customers’ area of production operations. Liberty’s chemical expertise lets our customers grow their use of recycled water in frac operations.
12%
PERCENTAGE OF JOBS UTILIZING RECYCLED WATER
58
COMBUSTION
OF NATURAL GAS AND OIL PRODUCES MORE FRESH WATER THAN IS CONSUMED IN DRILLING AND FRACTURING WELLS
Fracturing new wells consumes significant quantities of fresh water – increasingly being offset by recycling. However, fresh water vapor produced from natural gas and oil combustion at power plants, industrial operations, exhaust pipes, etc. likely exceeds the total water used in drilling new oil and gas wells. This is a little-known fact.
A two-mile long Haynesville Shale natural gas well in Louisiana consumes around 30 million gallons of water during drilling and fracturing operations. Combustion of that natural gas chemically combines oxygen with methane yielding water vapor, carbon dioxide and a significant energy release. The same two-mile Haynesville natural gas well yields about 20 billion cubic feet (20 BCF) of natural gas which produces 70 million gallons of new fresh water when combusted, roughly twice the water used to drill and frac the well. Bakken and Permian oil wells generally use smaller quantities of water in their construction and yield smaller quantities of water when the oil, gas and natural gas liquids are combusted. However, they also ultimately produce more new fresh water than they consume. The created water volume is very small compared to total atmospheric water vapor and most all will be returned to the surface as rain.
The fact that oil and gas production produces more fresh water than it consumes does not take away from our desire to minimize our consumption of local fresh water sources. The new fresh water produced during combustion may be hundreds or many thousands of miles away, wherever the products are consumed. Fortunately, our industry is a highly efficient user of fresh water.
IN COLORADO, OIL AND GAS REPRESENTS BETWEEN 4-8% OF STATE TAX REVENUES, EMPLOYMENT, AND TOTAL ECONOMIC ACTIVITY WHILE CONSUMING LESS THAN 0.1% OF COLORADO’S FRESH WATER USAGE. OUR FRESH WATER USAGE IS A BIT LARGER THAN SNOW-MAKING FOR SKI RESORTS AND A BIT LESS THAN GOLF COURSES. 1
1 cogcc.state.co.us/documents/library/Technical/Public_Health_ Safety_and_Welfare/Water_Sources_and_Demand_for_ Hydraulic_Fracturing_2017_January.pdf


ECOLOGICAL IMPACT
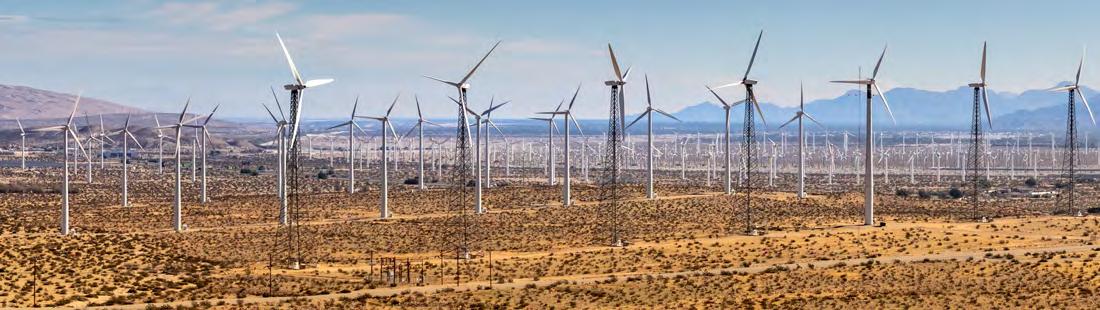
One of our first district managers summarized the Liberty philosophy succinctly: “Our goal is to leave the location cleaner than when we arrived.”
The Liberty family is full of outdoor enthusiasts, including hikers, climbers, cyclists, skiers to hunters, fishers, and wilderness explorers. Our CEO is a long-time board member of an environmental group, Property and Environment Research Center, and our mindset is always on how we can get our jobs done while minimizing our ecological impact.
Our efforts to lessen ecological impact from routine operations and mitigate risk of serious failures are wide ranging, many of which are covered in more detail in this report. Our efforts to minimize impacts on nearby residents – efforts that include our Liberty Quiet Frac Fleets, keeping all sand sealed in containers to reduce dust and noise, and Uber-for-Sand to minimize truck traffic and waiting times – also bring significant ecological benefits.
Liberty’s ten-year effort to build the industry’s leading database of unconventional wells coupled with multivariate (Big Data) analytic tools and leading physical modeling tools have helped drive the tremendous progress in getting more oil and gas out of the ground with fewer wells and minimal waste. Efficiency is eco-friendly. In Liberty’s history we have seen a nearly two-fold increase in average well productivity and a more than two-fold decrease in the time required to drill and frac a well, which combine to shrink by a factor of FOUR the time required to produce a set amount of oil and gas.

The story of U.S. natural gas production nicely illustrates this “Efficiency is Eco-friendly” point. From 2005 - 2008, the U.S. averaged over 1,000 rigs drilling for natural gas and we were one of the largest natural gas importers in world. Today the U.S. has roughly 100 rigs drilling for natural gas, yet we are now the world’s largest natural gas producer and one of the top four largest natural gas exporters! There is more. Natural gas prices are now less than half of what they were in 2005-2008, allowing major headway addressing energy poverty in the U.S. and around the world. Additionally, U.S. greenhouse gas emissions have been on a strong downward trajectory and air quality continues to improve as natural gas displaces coal in the U.S. electricity grid.
Liberty was an early adopter of deploying sealed containment across our locations so that incidental spills from fracturing operations do not even touch the ground. They are captured within containment and immediately cleaned up. Fortunately, this practice has now spread throughout our industry.
Liberty has been a major innovator driving the “greening” of frac chemicals throughout our ten-year history. We have also developed a suite of novel friction reducers that can work with recycled produced water, enabling our customers to displace more and more freshwater usage with water recycling, driving down any pressure on local fresh water sources.
A theme throughout our ecological efforts is always to be open and transparent. Our operations are run by humans. We are all fallible. Liberty is proud of always being transparent when mistakes happen and rectifying whatever went wrong to the fullest extent we can. This culture of transparency not only is good for our business, but it is also good for our ecological efforts with our customers, communities, and local governments.
60 IMPROVING ENVIRONMENTAL PERFORMANCE
ENERGY DENSITY
Energy density is a key metric for both environmental impact and on long-term economic viability of various energy sources, and the high energy-density of shale natural gas and oil means that our terrestrial footprint is small. The American shale revolution has dramatically increased the amount of energy that can be produced per acre of impacted land. Flying over the massive Bakken oil field in Western North Dakota, only farm and ranch activities are immediately visible. Although the Bakken field produces more than one million barrels of oil per day, roughly 10% of total U.S. oil production and more than several OPEC nations, less than 2% of the land is disturbed. Small well pads are constructed along roads that each contain several wells that go down two miles to the Bakken shale and then either two miles north or two miles south of the well-pad location. This allows producing Bakken oil from throughout the field with only modest surface land use.
After accounting for the land used for transportation via pipelines, processing, and refining into final products, in addition to the land impacted by drilling wells, oil and gas can provide enough energy to supply 180 homes for every acre of land employed. One acre of solar can supply enough energy for about 1.5 homes and for wind it is far less than even a single home. The star of energy density is nuclear, which can provide for over 1,500 homes per acre of land employed.
World population continues to grow as does per capita energy consumption which is critical to enable humans to live healthier and wealthier lives. High energy density helps balance the ever-increasing demand for energy against other land use priorities like food production, cities and towns, and the growing desire to preserve more land for wildlife and natural habitats.
HOW MANY HOUSEHOLDS DOES AN ACRE OF ENERGY SERVE?
WIND
OIL AND GAS
Figure 2.9 Source: Vaclav Smil http://vaclavsmil.com/wp-content/uploads/docs/smil-article-power-density-primer.pdf https://www.masterresource.org/smil-vaclav/smil-density-comparisons-v/
61
SOLAR
COLORADO FRONT RANGE: CASE STUDY
Colorado’s Denver – Julesburg (DJ) Basin extends northeast from the northern and eastern suburbs of Denver up to southeast Wyoming. It has been an active area for oil and gas drilling for the last 50 years. During that time, the Denver metro area has grown from about one million residents in 1970 to more than three million today. Much of Denver’s expansion to the northeast has been in and among oil and gas development activity in the DJ Basin.
This overlap of Denver’s booming suburbs with oil and gas development has driven Colorado to lead the nation in developing more stringent regulations on oil and gas development. It has also been a catalyst for many oil and gas industry advancements to reduce impacts on nearby communities. These developments include Liberty’s Quiet Frac Fleet, a two-year technology development effort to suppress sound markedly so that at only 500 ft. away fleet noise fades into background noise levels. Colorado operations also drove Liberty to move entirely to containerized sand handling systems, significantly reducing noise and dust, and reducing truck traffic and idle time on location. Our customers developed “green completions” to mitigate methane venting and flaring. Our customers also pioneered “tank-less” well-pad locations that utilize underground pipelines to carry all producing fluids from the wellheads to a remote location where the water, oil, and natural gas are separated and processed before entering long-haul pipelines to consumer markets. These Colorado DJ Basin advancements are spreading around the country and the world.
As the figure on the following page shows, annual production in Colorado’s DJ Basin grew modestly from 25 million barrels oil equivalent (BOE) in 1990 to over 50 million BOE in 2010. Then shale production technology arrived and things truly took off, rising to 365 million BOE in 2019 and 2020. This equates to one million BOE per day, roughly half of which is oil and the remainder split between natural gas and natural gas liquids. This surging DJ Basin oil and gas
production brings roughly $1 billion dollars a year in taxes to Colorado state, county and local governments. It also results in low energy costs locally and thousands of high-paying jobs to the northern Denver suburbs and rural Weld county.
But at what cost? The biggest pushback from Colorado residents has been around air quality concerns. Figure 2.10 shows aggregate emissions (particulate matter, photochemical oxidants like ozone, carbon monoxide, sulfur dioxides, nitrogen oxides, and lead) from Colorado’s Front Range Region, which have declined roughly 50% over the last 25 years even with surging population and oil and gas production. Just in the last ten years, while DJ Basin oil and gas production rose six-fold, oil and gas emissions of Volatile Organic Compounds – precursors to ozone – dropped more than 40%! The two photos show clearly the change in Denver air quality from the 1970s to today.
Thousands of air quality measurements (source: CDPHE, 20171) have been taken near oil and natural gas development sites in Colorado over the past five years and not one measurement attributable to oil and natural gas has been above EPA or Health and Human Services health guideline values, from monitoring by the state, industry and third parties. Liberty is proud to be a part of the Colorado example showing that technology, best-practices and commitment can deliver low-cost, reliable energy, environmental progress, with large social and economic benefits to communities.
1 https://drive.google.com/file/d/0B0tmPQ67k3NVVFc1TFg1eDhMMjQ/view)
Sources for Figure 2.10:
https://www.denvergov.org/opendata/dataset/greenhouse-gas-inventories https://www.epa.gov/air-emissions-inventories/air-pollutant-emissions-trends-data https://www.macrotrends.net/cities/22972/denver/population
62
EMISSIONS DECREASE WHILE POPULATION AND PRODUCTION INCREASES
Image source: https:// opensky.ucar.edu/islandora/ object/imagegallery%3A384


1974 DENVER, PRESENT DAY 63
DENVER,
POPULATION AND EMISSIONS (METRIC TONNE) ANNUAL PRODUCTION (BBL + BOE) 1985 12,000,000 10,000,000 8,000,000 6,000,000 4,000,000 2,000,000 0 400,000,000 350,000,000 300,000,000 250,000,000 200,000,000 150,000,000 100,000,000 50,000,000 0 1990 1995 2000 2005 2010 2015 2020 POPULATION CO 2 e EMISSIONS AGGREGATE EMISSIONS PRODUCTION Figure 2.10
SAFETY

Our people come first. Ensuring their safety and that of those around them is the most important thing we do. Our strong safety culture makes us an attractive place to work and an attractive partner for our customers. The COVID-19 pandemic introduced a new and unexpected challenge, which the Liberty team met head-on with great success.
At Liberty, the service we provide is critical to ensuring the continued supply of hydrocarbons to meet global demand. It was essential that our operations continued unimpeded throughout the year. A Liberty response team formed in February laid out plans for specialized training, company communication, cleaning protocols, and field strategies to maximize social distancing and minimize COVID transmission risk while on location. Together with our staff and accommodation partners (housing for workers in remote locations), testing and quarantine protocols were put in place with the goal of preventing exposure incidents in the field.
At our offices and facilities, higher cleaning standards were introduced along with screening and tracing procedures to help protect those who needed to come in to work. Where a presence in the office was not required, employees were offered the flexibility to work from home and virtual tools were provided to facilitate collaboration among the Liberty family and our many partners up and down the supply chain.
The efforts of the Liberty team proved very successful over the course of the year. The CDC estimates that one-third of Americans have contracted COVID-19 (source: Estimated Disease Burden of COVID-19, April 29, 2021), however there were only a handful of transmission cases that occurred while working at Liberty. Liberty did not contribute meaningfully to the spread of COVID, yet operations continued uninterrupted through the entire year.
We put millions of miles on our fleet of vehicles every year, making driving the highest-risk activity that we undertake. Early adoption of electronic logs, driver monitoring and driver coaching in the cabs of all our heavy vehicles has helped ensure Liberty maintains very strong Department of
0.80 2020 TOTAL RECORDABLE INCIDENT RATE (TRIR)
*Total Recordable Incident Rate (TRIR) is a metric depicting an organization’s past safety performance by calculating the number of recordable incidents per 100 full-time workers during a one-year period 0.66
64
Liberty
Industry Average
TRIR
TRIR
Transportation (DOT) scores. Our Motor Vehicle Accident Rate (MVAR) for 2020 was 0.57, more than 60% below non-compliance levels, and we remain in full compliance with all other DOT scoring areas as well.
We ended 2020 with a Total Recordable Incident Rate (TRIR) of 0.66, a more than 25% improvement over the end of 2019. From our equipment operators to the executive team, the Liberty family remains focused on improving our workplace safety every day, with the goal of making sure everyone gets home safely to their families at the end of every shift.
The Liberty Frac Academy boosts our culture by providing ongoing inhouse training with almost 2,400 team members completing individual competency assessments in 2020. Liberty also created the position of Field Safety Representative (FSR), an individual who is dedicated to the safety of their crew. Our FSR’s rely on the Behavior Based Safety Model to
observe human trends in the workplace and to help predict and prevent incidents before they happen. From location audits to DOT spot checks on vehicles the FSR’s sole role is to keep our personnel, equipment, and the environment safe.
To maximize training opportunities with our field staff, Liberty will be deploying our mobile classroom to the field. This traveling training room allows the opportunity to provide quick training sessions right at the wellsite. In just 30-60 minutes before the start of a shift, Liberty trainers can offer in-person instruction on a chosen focus area, such as a revised maintenance practice, to reinforce or update previous classroom training.

19.4
ANNUAL AVERAGE HOURS OF TRAINING PER EMPLOYEE
TRAINING PROGRAMS
• AFEX system training for operations
• Access to employee exposure and medical records
• Basic safeland
• Bloodborne pathogens
• CMV driver basics
• CMV pre/post trip
• CPR/first aid/AED
• Fit test respiratory protection
• Forklift training
• Hazard communications
• Hazards materials handling general awareness and security awareness
• Hot work
• Hours of service
• H2S awareness training
• Loads securement
• Lock out tag out training
• Manlift training
• Portable fire extinguishers
• Radiation awareness
• Telehandler forklift
• Basic safeland
• Drug and alcohol policies
• Working in extreme temperatures
65


COVID-19 RESPONSE
THE LIBERTY TEAM CONTINUED TO SHOW UP 24 HOURS A DAY DURING THE PANDEMIC TO BE SURE WE COULD PROVIDE THE ENERGY NEEDED TO FIGHT COVID-19.
IN FEBRUARY 2020, WE FORMED A COVID-19 RESPONSE COMMITTEE to design and implement safety procedures and contingency plans at our customer locations and our offices and facilities that allowed continued delivery of safe frac services while protecting the health of both our customers and employees.
DEFINED COVID-19 POLICY THROUGH A COVID PREPAREDNESS PLAN
Developed protocols for exposure, contact tracing and quarantine in each state and basin where we operate.
PIVOTED OUR HSE PROCEDURES TO ENSURE SAFETY IN ALL WORK ENVIRONMENTS
This included: face covering policies, temperature checks, increased sanitization practices, and the installation of plexiglass partitions.
PIVOTED ALL CORPORATE POSITIONS ABLE TO WORK FROM HOME and outlined protocols and procedures for a return-to-work plan.
66
A CULTURE OF EXCELLENCE

PEOPLE AND CULTURE ARE WHAT SET US APART. INVESTING IN OUR TEAM IS OUR TOP PRIORITY.
The Liberty family works as a team, passionately pursuing our mission to better human lives.
Year after year, Liberty’s employee turnover rates are substantially lower than that of our industry. We built a culture where all team members have an aligned focus and are incentivized to achieve results that are impossible to accomplish alone. Our innovative approach to hiring allows us to seek out individuals who embody Liberty’s core values. We believe building a strong culture inside our organization translates to strong communities where Liberty families call home.
WE ARE DRIVEN BY ONE GOAL:


BUILD THE BEST DAMN SERVICE COMPANY, PERIOD.
2019 Liberty Women’s Summit Denver Business Journal’s Best Places to Work, 2018 | 2021 67
652
EMPLOYEE OWNERS
LIBERTY AT-A-GLANCE
91% OF LIBERTY EMPLOYEES SAVE FOR THEIR FUTURE THROUGH OUR 401K PLAN
60
FAMILIES RECEIVED FINANCIAL ASSISTANCE WITH FERTILITY TREATMENT IN 2020
82
LIBERTY BABIES WERE BORN IN 2020
3
FAMILIES RECEIVED ASSISTANCE WITH ADOPTION IN 2020
47% WOMEN AT CORPORATE HEADQUARTERS
BAN THE BOX
- Chris Wright, Chairman and CEO IN 2019, LIBERTY JOINED THE BAN THE BOX INITIATIVE THAT ALLOWS TALENTED INDIVIDUALS TO RETURN TO WORK.
“We employ more than 50 formerly incarcerated people at Liberty. Early life mistakes should not define and constrain an entire life. Many people deserve a second chance to create value in their lives that they are not getting today. We seek to hire people with integrity, a positive attitude, and a hunger to learn and contribute to a team. There are plenty of people who have been incarcerated that we wouldn’t hire, just as there are plenty of people who have never been incarcerated that we wouldn’t hire. Liberty is proud to pave the way for other companies to a forward-looking hiring processes that enables mutual benefit from so many talented individuals.”

68
Chris Wright speaking at the Criminal Justice Reform Symposium in Albuquerque, New Mexico.
LIBERTY DOESN’T HIRE SUPERVISORS. AT LIBERTY, WE BELIEVE IN OUR PEOPLE AND OUR TRAINING PROGRAM AND PROMOTE FROM WITHIN.
INNOVATION IN THE FIELD IS CELEBRATED AND OUR TEAM IS ENCOURAGED TO RESEARCH AND DEVELOP NEW TECHNOLOGIES, LIKE OUR SONICSTRAP.

OUR ROTATING SCHEDULE MAKES SURE OUR FIELD EMPLOYEES SPEND MORE TIME WITH THEIR FAMILIES.
LIBERTY WAS AN EARLY ADOPTER OF FLEX TIME IN THE OFFICE.
IN 2020 THE LIBERTY TEAM ADAPTED QUICKLY, CREATING A VIRTUAL COMMUNITY OUTREACH PROGRAM AND VOLUNTEERING OVER 1000 HOURS DURING THE PANDEMIC.
WE HAVE A DEDICATED NETWORK OF LIBERTY SPOUSES IN EACH DISTRICT, MAKING SURE THE LIBERTY FAMILY HAS THE SUPPORT AND RESOURCES THEY NEED.
EXTREME OWNERSHIP

AT LIBERTY, WE ARE COMMITTED TO GETTING BETTER, SMARTER, AND STRONGER; TO BE THE BEST DAMN SERVICE COMPANY, PERIOD.
Never afraid to do things a bit differently, we decided to call in the U.S. Military Special Operations - specifically, Navy Seals team leader and decorated combat Veterans Jocko Willink and Leif Babin to introduce their Extreme Ownership program within Liberty.
Through a companywide keynote event and a series of breakout sessions for our senior field leadership, we were all challenged to live up to our full potential both personally and professionally.

70

BLAKE FENNEL
MAINTENANCE MANAGER, FARMINGTON, NM
“My wife, Justis, and I had tried to start a family for five years without success. We had been saving money to try IVF. I’ll never forget the day Liberty announced the new benefit to help families with this expensive process. I immediately called Justis to tell her the news and she started crying! In September of 2018, we welcomed our twins, Willow and Wyatt. Liberty played a huge part in making my wife and I parents, something that has brought so much joy to our lives. Justis and I love this company and will never forget what they have done for us!”
Q&A
ROBERT HENDERSON SONICSTRAP

HOW DO TECHNOLOGY AND INNOVATION FACTOR INTO THE CULTURE
AT
LIBERTY?
We have a saying at Liberty that guides everything we do. We want to be the Best Damn Frac Company, period. If we are other things, we want to be that one thing first. This concept requires us to test and to innovate technology while pursuing that goal. Our customers deserve to have us live up to that commitment. We owe it to ourselves as well. The acquisition of OneStim reinforces our commitment to excellence through innovation by providing some very powerful tools to our teams.
YOU INVENTED TECHNOLOGY THAT IS NOW USED ACROSS
LIBERTY OPERATIONS. TELL US ABOUT THE SONICSTRAP AND HOW IT CAME TO BE. Nothing happens in a vacuum. SonicStrap would not be a realized technology without our gritty technical development engineers, expert fabrication team, or a supportive management team helping challenge the status quo by supporting new ideas – full stop. The SonicStrap system is a highly accurate and precise electronic system of level sensors to track chemicals. It was conceptualized by realizing there was a better tool to accomplish the necessary task of
maintaining a location’s chemical inventory than an operator and a wooden stick. This technology has protected operators, increased efficiency, and increased operational excellence. We created a tool we would be proud to use ourselves.
WHAT OTHER FUN THINGS DO YOU GET TO DO AS THE TECHNICAL
DEVELOPMENT MANAGER?
I am a huge nerd. I love technology and games. I also believe that access to energy is central to humanity’s continued prosperity. When we mix technology, games, and that truth, you get the creation of some of our educational tools like the Joule Grand Prix. We make energy requirements tangible to participants in a 30-second competitive hand crank drag race game that lights up lightbulbs. The game captures a person’s output and compares that to their friends’ and other energy sources. Humans use a whole lot of energy to live, and we often are out of touch with just how much energy or what that looks like from a relative effort standpoint. EMPLOYEE
71
REVITALIZING SMALL TOWN AMERICA
Liberty’s work schedule for field employees allows families the freedom to choose where to live across our great nation. This flexibility creates wealth in areas of our country where economic opportunity makes a huge impact. Our employees’ salaries, families and community efforts help revitalize small towns across America. The result is improved education, healthcare, and essential services.
SPOTLIGHT ON WILLISTON, ND
• SINCE 2010, WILLISTON’S POPULATION HAS NEARLY DOUBLED
• THANKS IN LARGE PART TO GROWTH IN THE ENERGY SECTOR, NORTH DAKOTA’S PER CAPITA GDP STATE RANKING JUMPED FROM 39TH IN 2001 TO 1ST IN 2014 (5TH IN 2019)
DID YOU KNOW?
LIBERTY’S BLUE COLLAR WORKFORCE HAS A MEDIAN SALARY THAT IS OVER 2X GREATER THAN THE U.S. AVERAGE.

72


 Almarez Family, Farmington, NM
Arellano Family, Denver, CO
Arnold Family, Greeley, CO
Moon Family, Commerce City, CO
Tjaden Family, Cheyenne, WY
Stapleton Family, Columbia Falls, MT
McGary Family, Commerce City, CO
Dalbey Family, Loveland, CO
Pottorff Family, New Braunfels, TX
Garcia Family, Casper WY
Rainey Family, Firestone, CO
Hadaway Family, Greeley, CO
Newcomb Family, Bay Springs, MS
Hansen Family, Loveland, CO
Reynolds Family, Moorcroft, WY
Koehn Family, Elbert, CO
Sanchez Family, Ault, CO
Leavell Family, Chippewa Falls, WI
Seymour Family, New Braunfels, TX
McBride Family, Williston, ND
Shankweiler Family, Greeley, CO
Atkins Family, Briggsdale, CO
Moseley Family, Castle Rock, CO
Weijers Family, Denver, CO
Summers Family, Canton, TX
Miramontes Family, Brighton, CO
Colontrelle Family, Cross Roads, AL
Nauta Family, Greeley, CO
Welch Family, San Antonio, TX
Cowan Family, New Braunfels, TX
Ortiz Family, Riverton, WY
Wiley Family, Frederick, CO
Almarez Family, Farmington, NM
Arellano Family, Denver, CO
Arnold Family, Greeley, CO
Moon Family, Commerce City, CO
Tjaden Family, Cheyenne, WY
Stapleton Family, Columbia Falls, MT
McGary Family, Commerce City, CO
Dalbey Family, Loveland, CO
Pottorff Family, New Braunfels, TX
Garcia Family, Casper WY
Rainey Family, Firestone, CO
Hadaway Family, Greeley, CO
Newcomb Family, Bay Springs, MS
Hansen Family, Loveland, CO
Reynolds Family, Moorcroft, WY
Koehn Family, Elbert, CO
Sanchez Family, Ault, CO
Leavell Family, Chippewa Falls, WI
Seymour Family, New Braunfels, TX
McBride Family, Williston, ND
Shankweiler Family, Greeley, CO
Atkins Family, Briggsdale, CO
Moseley Family, Castle Rock, CO
Weijers Family, Denver, CO
Summers Family, Canton, TX
Miramontes Family, Brighton, CO
Colontrelle Family, Cross Roads, AL
Nauta Family, Greeley, CO
Welch Family, San Antonio, TX
Cowan Family, New Braunfels, TX
Ortiz Family, Riverton, WY
Wiley Family, Frederick, CO
COMMUNITY ENGAGEMENT

No matter what changes we have faced as a company, Liberty is a family. We hold tight to the small company feel, and this mentality has shaped our approach to community outreach. Our families and communities are resilient, and we take pride in supporting local organizations who are fighting tirelessly to support those in need.
AN ACTIVE APPROACH TO COMMUNITY OUTREACH
As strong believers in the “work hard, play hard” mentality, Liberty has sought opportunities that get us engaged and moving. While we had to make some adjustments in 2020, our team was still out there building houses with Habitat for Humanity, playing basketball with the kids at the Tennyson Center for Children, and packing lunches for students in need.
VOLUNTEERING GOES VIRTUAL
We acted fast to adapt our community outreach opportunities to include both virtual and safe in-person options. We got to work writing thank-you cards to our first responders and cards to those in nursing homes, and we encouraged all members of the Liberty family to share their gratitude. While we missed seeing many of our community partners in person, we are so proud of the creative ways we adapted and were able to support our communities in 2020.
LIBERTY’S HYBRID VOLUNTEERING PROGRAM HAS ENABLED LIBERTY TO EXTEND VOLUNTEER OPPORTUNITIES INTO OUR BROADER LIBERTY FAMILY, INCLUDING THEIR SPOUSES AND CHILDREN.
SINCE LIBERTY WAS FOUNDED IN 2011, WE HAVE BECOME DEEPLY ROOTED IN OUR COMMUNITIES. EVERY COMMUNITY IS DIFFERENT, AND SINCE WE ARE UNABLE TO ADDRESS EVERY NEED, LIBERTY HAS CHOSEN THREE CORE FOCUS AREAS:
EDUCATION
Liberty supports organizations that provide educational opportunities.
ALLEVIATING POVERTY
Liberty supports organizations dedicated to lifting people out of poverty by providing opportunities for individuals to find their definition of success.
VETERAN/MILITARY SERVICES
Liberty supports organizations that provide support and opportunities for veterans, first responders, and active military personnel.
74
1,200+
HOURS SPENT GIVING BACK TO LIBERTY’S COMMUNITIES.
104

ACE SCHOLARSHIPS PROVIDED BY LIBERTY AND ITS EMPLOYEES IN 2019.

32
DIFFERENT ORGANIZATIONS COUNTRYWIDE THAT LIBERTY EMPLOYEES VOLUNTEERED WITH.

100 $350,000+
IN CHARITABLE DONATIONS TO OUR COMMUNITIES.
$15,000
CONTRIBUTED TO DEFY COLORADO, TRANSFORMING THE LIVES OF CURRENTLY AND FORMERLY INCARCERATED INDIVIDUALS.
HOURS SPENT SUPPORTING KIDS AT THE TENNYSON CENTER FOR CHILDREN.
$17,630 DONATED TO ORGANIZATIONS THAT HELP VETERANS.

17 SCHOLARSHIPS
Liberty presented 17 scholarships to Butte High School students in need of financial support, helping them realize their dreams of pursuing higher education at Montana Tech. We are proud to be long-term supporters of this program and allowing these bright individuals to create their own success.
75 KEY COMMUNITY
EFFORTS

CORPORATE GOVERNANCE
CORPORATE GOVERNANCE PRINCIPLES AT THE FOUNDATION OF TRUST AND VALUE CREATION
At Liberty, we strive to transform sound governance principles into best practices to create value for our stakeholders. Our dedication to economic, environmental and societal leadership and performance is an integral part of our corporate strategy, leading to a 24% average historical CROCI*. Liberty’s Board of Directors provides the oversight that strengthens accountability, promotes the long-term interest of our stakeholders and builds trust. Our senior management team further utilizes rigorous governance practices to ensure that our risks and opportunities are effectively managed for the continued vitality and sustainability of our business in a responsible and ethical manner. It is our team’s commitment to continually enhance our service offering and deliver value to our stakeholders that led to the transformational acquisition of OneStim in 2020, laying the foundation of a new era of technology and sustainability in our industry.
7/9 INDEPENDENT BOARD OF DIRECTORS 1/9 DIRECTORS IS FEMALE 8 TIMES BOARD FORMALLY MET IN 2020 ALL BOARD COMMITTEES COMPRISED ENTIRELY OF INDEPENDENT DIRECTORS ADOPTED STRINGENT INSIDER TRADING POLICIES, INCLUDING ANTI-HEDGING AND ANTI-PLEDGING THE LIBERTY TEAM’S COMMITMENT TO INTEGRITY AND EXCELLENCE TRANSLATES INTO A STRONG REPUTATION OF TRUST WITH OUR EMPLOYEES, CUSTOMERS, SUPPLIER PARTNERS, POLICY MAKERS, COMMUNITIES, AND SHAREHOLDERS.
76
*Cash Return on Capital Invested (CROCI) defined as the ratio of adjusted EBITDA to average Gross Capital Invested (Total Assets plus Accumulated Depreciation less Non-Interest Bearing Current Liabilities); CROCI of 24% represents the 2012-2020 average.
BOARD OF DIRECTORS
Liberty’s directors bring a variety of leadership experience and perspectives that foster productive dialogue and decision-making when carrying out strategic and oversight responsibilities. Our Board has adopted Corporate Governance Guidelines* in accordance with New York Stock Exchange (NYSE) rules that serve as a framework within which our Board and committees operate, including the practices and policies that relate to the Board’s structure and composition, membership criteria and qualifications, director responsibilities, evaluation of management and succession planning, and interaction with external constituencies. We continuously assess our corporate governance principles to ensure they are effectively supporting a culture of the highest ethical standards.
In 2020, Liberty added two new directors to our Board in connection with the OneStim transaction, Messrs. Ayat and McDonald, and concurrently, Messrs. Shah and Lancaster resigned from the Board. Liberty maintains an independent Board in accordance with NYSE rules and our Corporate Governance Guidelines, with eight out of nine directors meeting the qualifications of independence since our initial public offering and all directors divided into three classes with staggered, three-year terms. Our Board values diversity in gender, geography, skill set, experience and thought, with one female director, one director of French and Lebanese citizenship, and directors from a wide variety of backgrounds in technology, energy, public policy, finance and accounting and international business. Liberty also recently joined the National Association of Corporate Directors (NACD) to provide our directors with additional governance insight.
AUDIT COMMITTEE
The Audit Committee oversees, reviews, acts on and reports on various auditing and accounting matters to our Board, including: the selection of our independent accountants, the scope of our annual audits, fees to be paid to the independent accountants, the performance of our independent accountants and our accounting practices.
COMPENSATION COMMITTEE
Our Compensation Committee assists our Board in establishing salaries, incentives and other forms of compensation for officers and other employees. Our Compensation Committee also assists the Board with the administration and oversight of our incentive compensation and benefit plans.
NOMINATING AND GOVERNANCE COMMITTEE
Our Nominating and Governance Committee identifies, evaluates and recommends qualified nominees to serve on our Board, subject to the terms of the stockholders’ agreements the Company has entered into with certain stockholders related to the appointment of directors.
Peter A. Dea
William F. Kimble
Gale A. Norton
Ken Babcock
Cary D. Steinbeck
= Chairperson = Member
*A current copy of our Governance Guidelines can be found on our website, www.libertyfrac.com.
77
Name Audit Committee Compensation Committee Nominating and Governance Committee
LEADERSHIP ACCOUNTABILITY: PAY FOR PERFORMANCE
>90%
The Liberty team has been aligned with shareholders since our founding. Our pay for performance compensation philosophy strategically uses incentives that align employee behaviors with their responsibilities to drive better business outcomes. This persists across all areas of the company, from our employees in the field managing efficiency and safety to our sales team’s ability to improve profitability outcomes. At the helm, our executive team has a compensation program with a high percentage of variable compensation that is designed to reward the long-term interests of the Company and our shareholders. Incentive compensation includes a focus on pre-tax earnings per share, return on capital employed (ROCE) and adjusted ROCE against a peer group. For 2020, the Compensation Committee added the S&P 500 to our peer group; by measuring our results against the broader market, we believe this creates a further tie to shareholder priorities.
OVER 90% OF VOTES CAST IN 2020 WERE IN FAVOR OF OUR EXECUTIVE COMPENSATION PROGRAM
In response to the severe disruption to oil and gas demand caused by the global COVID-19 pandemic, our executive team was amongst the industry’s first teams to request a reduction to executive compensation. Beginning in the second quarter of 2020, Liberty officers and directors took voluntary compensation reductions, as described in greater detail in our 2020 proxy statement.
The Compensation Committee reviews shareholder votes and feedback to ensure executive compensation programs align with their interests on an ongoing basis. Additional details on our executive compensation program are available in our 2021 proxy statement.
BUSINESS ETHICS
Our business thrives with robust partnerships we’ve cultivated with our customers, suppliers and communities over the years. At the foundation of these relationships is a strong sense of business ethics that underscores our reputation and trust we have built with all of our stakeholders. Our Corporate Code of Business Conduct and Ethics (Code) and our Financial Code of Ethics together set the stage for which we operate our business, by establishing expectations for our team to maintain a high level of integrity, ethical standards and compliance with all legal requirements.
Liberty’s Code includes topics ranging from conflicts of interest, employee practices and compliance with applicable laws. All of our employees are required to commit to the Code annually, acknowledging an understanding of our key policies. This includes a strict policy against improper payments or gifts from the Company that benefit any government, labor union, customer or supplier, which is intended to prevent corruption and bribery across the supply chain. To protect our Company, Liberty has a whistleblower hotline and encourages employees to report misconduct. Liberty prohibits retaliation for good faith reporting of violations.
78
RISK OVERSIGHT
At the core of our business is leading edge innovation and technology, but that often involves taking measured risks. Risk assessment and oversight are an integral part of our governance and management processes. Our Board is responsible for monitoring and assessing strategic risk exposure and providing oversight of risk management, assisted by the Audit Committee. The Board encourages management to promote a culture that incorporates risk management into our corporate strategy and day-to-day business operations.
Liberty management discusses strategic and operational risks at regular management meetings and conducts specific strategic sessions during the year that include a focused discussion and analysis of material operational and financial risks. The Company also conducts a comprehensive risk management session with the executive leadership team periodically with the help of outside consultants, where key risks are identified, prioritized and documented with mitigation strategies assigned to the appropriate risk owner.
Throughout the year, senior management reviews risks with the Board and steps taken to mitigate or eliminate such risks. These ongoing discussions assist us with identifying, monitoring and controlling these exposures, providing assurance that the risks we take are consistent with the Board’s risk tolerance.
For a comprehensive discussion of material risks Liberty has identified, please refer to our Form 10-K for the fiscal year ended December 31, 2020.
EMPLOYEE OWNERSHIP
Liberty takes pride in fostering an entrepreneurial workplace where employees have the autonomy to take ownership of their work and grow professionally. As a part of our professional development and annual goal setting for our employees, Liberty offers restricted stock units to attract, engage, retain and reward our employees. Employee ownership connects our employees’ work to Liberty’s strategic decisions, supporting both our long-term business model and our people.

652 EMPLOYEE OWNERS 34% OF EMPLOYEES
BUSINESS AND REGULATORY AFFAIRS
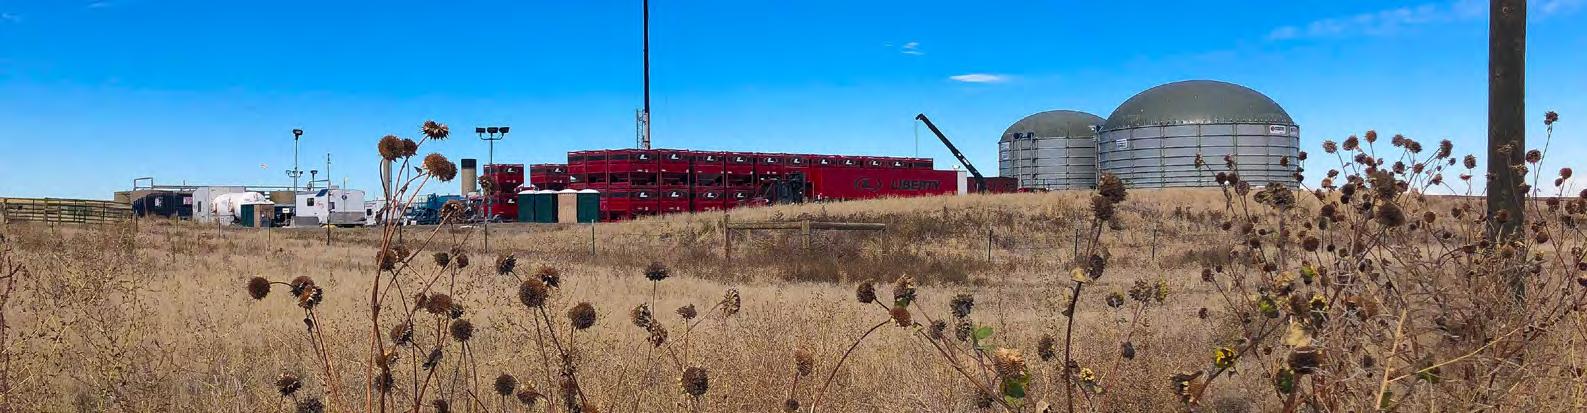


POLITICAL ENGAGEMENT AND TRADE ASSOCIATION INVOLVEMENT


At Liberty we believe when our customers succeed, we succeed. That means working side by side with our customers and industry partners to engage in the legislative and regulatory processes through workgroups and trade associations. The partnerships we have created between our customers extend well beyond our location boundaries and our nationwide network of employees are advocates for the industry.
We believe that through collaboration and open communication we can work to adopt policies that put health and safety first, while allowing our industry to continue providing our communities with the low-cost energy we all depend on.

80
KEY METRICS AND DISCLOSURES
FORWARD LOOKING STATEMENT
In order to utilize the ‘safe harbor’ provisions of the United States Private Securities Litigation Reform Act of 1995 (the ‘PSLRA’) and the general doctrine of cautionary statements, Liberty is providing the following cautionary statement.
This report contains certain forecasts, projections and forward looking statements – that is, statements related to future, not past events and circumstances with respect to the financial condition, results of operations and businesses of Liberty and certain of the plans and objectives of Liberty with respect to these items. These statements may generally, but not always, be identified by the use of words such as ‘will’, ‘expects’, ‘is expected to’, ‘aims’, ‘should’, ‘may’, ‘objective’, ‘is likely to’, ‘intends’, ‘believes’, ‘anticipates’, ‘plans’, ‘we see’ or similar expressions.
These forward-looking statements are subject to certain risks, uncertainties and assumptions, including those disclosed from time to time in Liberty’s filings with the Securities and Exchange Commission. As a result of these factors, actual results may differ materially from those indicated or implied by such forward-looking statements.
Any forward-looking statement speaks only as of the date on which it is made, and, except as required by law, we do not undertake any obligation to update or revise any forwardlooking statement, whether as a result of new information, future events or otherwise. New factors emerge from time to time, and it is not possible for us to predict all such factors. When considering these forward-looking statements, you should keep in mind the risk factors and other cautionary statements in “Item 1A. Risk Factors” included in Liberty’s Annual Report on Form 10-K for the year ended December 31, 2020 as filed with the SEC on February 24, 2021 and in our other public filings with the SEC. These and other factors could cause actual results to differ materially from those contained in any forward-looking statements.
81
SUSTAINABILITY ACCOUNTING STANDARDS BOARD (SASB) INDEX
TABLE 1. SUSTAINABILITY DISCLOSURE TOPICS AND ACCOUNTING METRICS
Emissions Reduction Services and Fuels Management
Total fuel consumed, percentage renewable, percentage used in: (1) on-road equipment and vehicles and (2) off-road equipment
Discussion of strategy or plans to address air emissions-related risks, opportunities, and impacts
Management Services
Environmental Performance (pg. 48-49) and Frac Engines (pg. 52-53)
Percentage of engines in service that meet Tier 4 compliance for non-road diesel engine emissions 25.7%
(1) Total volume of fresh water handled in operations, (2) percentage recycled Water (pgs. 58-59)
Discussion of strategy or plans to address water consumption and disposal-related risks, opportunities, and impacts
(pgs. 58-59)
Volume of hydraulic fracturing fluid used, percentage hazardous 41,078,829 m3 of frac fluid slurry (includes sand volumes); 0.072% hazardous chemicals
Discussion of strategy or plans to address chemicalrelated risks, opportunities, and impacts Frac Fluid Chemistry (pgs. 56-57)
Ecological Impact Management Average disturbed acreage per (1) oil and (2) gas well site
Discussion of strategy or plan to address risks and opportunities related to ecological impacts from core activities Ecological Impact (pgs. 60-61)
82
TOPIC ACCOUNTING METRIC RESPONSE CODE
Off-Road
On-Road
EM-SV-110a.1
8,340,600.28 GJ
339,531.97 GJ
EM-SV-110a.2
Improving
EM-SV-110a.3
Water
EM-SV-140a.1
Water
EM-SV-140a.2
Chemicals Management
EM-SV-150a.2
See footnote
EM-SV-160a.1
EM-SV-150a.1
1
EM-SV-160a.2
Workforce Health and Safety
(1) Total recordable incident rate (TRIR), (2) fatality rate, (3) near miss frequency rate (NMFR), (4) total vehicle incident rate (TVIR), and (5) average hours of health, safety, and emergency response training for (a) full-time employees, (b) contract employees, and (c) short-service employees
Description of management systems used to integrate a culture of safety throughout the value chain and project lifecycle
(1) TRIR .66 (2) Fatality rate (0) (3) NMFR .51 (4) TVIR 2.51 (5a) 19.4 (5b) not relevant (5c) not relevant
(pgs. 64-65)
Business Ethics and Payments
Transparency
Management of the Legal and Regulatory Environment
Amount of net revenue in countries that have the 20 lowest rankings in Transparency International’s Corruption Perception Index
Description of the management system for prevention of corruption and bribery throughout the value chain
(pgs. 76-79)
Discussion of corporate positions related to government regulations and/or policy proposals that address environmental and social factors affecting the industry Business and Regulatory Affairs (pg. 80)
and mitigate catastrophic and tail-end risks
1. Ecological Impact Management was deemed not applicable, as management of disturbed acreage per oil and gas wellsite is outside of Liberty’s operational control.
2. Liberty does not operate outside North America.
3. Number of active rigsites, number of active wellsites, and total amount of drilling performed are not relevant to the Liberty’s operational control, and have been omitted.
83
EM-SV-320a.1
Safety
EM-SV-320a.2
See footnote 2 EM-SV-510a.1
Corporate Governance
EM-SV-510a.2
EM-SV-530a.1 Critical Incident Risk Management
Corporate
EM-SV-540a.1
Description of management systems used to identify
Governance (pgs. 76-79)
ACTIVITY METRIC CATEGORY UNIT OF MEASURE CODE Number of active rig sites Quantitative See footnote 3 EM-SV-000.A Number of active well sites Quantitative See footnote 3 EM-SV-000.B Total amount of drilling performed Quantitative See footnote 3 EM-SV-000.C Total number of hours worked by all employees Quantitative 3,927,396 hours EM-SV-000.D
TABLE 2. ACTIVITY METRICS

2020 ESG REPORT LIBERTYFRAC.COM