SUSTAINABLE GROWTH STUDY UPDATE: 2023 VACANT LAND AND GROWTH TRENDS
December 10, 2023
Prepared for: Lexington Fayette County Urban Government Planning Department
Prepared by: Stantec Consulting Services Inc.
i Table of Contents 1 INTRODUCTION...........................................................................................................1 2 VACANT LAND UPDATE 1 2.1 Analysis Summary 1 2.2 Vacant Land Summary .................................................................................................................. 2 3 RESIDENTIAL DEVELOPMENT TRENDS ...................................................................4 3.1 Population 4 3.2 Households 6 3.3 Housing Units 7 3.4 Building Permits ............................................................................................................................. 8 3.5 Household Growth Trends 10 4 INDUSTRIAL DEMAND 11 4.1 Market Summary 11 4.2 Trend Analysis 14 5 OFFICE DEMAND ......................................................................................................15 5.1 Market Summary 15 5.2 Trend Analysis ............................................................................................................................. 16 6 RETAIL DEMAND ......................................................................................................17 6.1 Trend Analysis 19 LIST OF TABLES Table 1. Fayette County Urban Service Area Vacant Land Summary 3 Table 2. Total Vacant Acres within the Fayette County Urban Service Boundary by Year 4 Table 3. Fayette County and Regional Population Growth 5 Table 4. Regional Share of Population Growth ............................................................................................ 6 Table 5. Regional Household Growth 6 Table 6. Fayette and Regional Household Profile (2021-2022).................................................................... 7 Table 7. Regional Housing Units 7 Table 8. Fayette County Housing Units ........................................................................................................ 8 Table 9. Fayette County Building Permits 9 Table 10. Fayette County Historic and Projected Household Growth ........................................................ 10 Table 11. Regional Industrial Inventory by Submarket 12 Table 12. Regional Industrial Vacancy Rates by Submarket...................................................................... 13 Table 13. Regional Office Inventory by Submarket 15 Table 14. Regional Office Vacancy Rates by Submarket ........................................................................... 15 Table 15. Regional Retail Inventory by Submarket 17 Table 16. Regional Retail Inventory by Submarket .................................................................................... 18 LIST OF FIGURES Figure 1. Population Growth Since 2000 5 Figure 2. Fayette County Housing Units ....................................................................................................... 8 Figure 3. Fayette County Single and multi-Family Building Permits 9 Figure 4. 20-year Household Growth Trendlines ........................................................................................ 11 Figure 5. CoStar Submarkets 12 Figure 6. Fayette County Industrial Annual Inventory and Vacancy Rate .................................................. 13 Figure 7. Fayette County Industrial Growth Trendlines 14 Figure 8. Fayette County Office Inventory (SF) and Vacancy Rate............................................................ 16 Figure 9. Fayette County Office Growth Trendlines 17 Figure 10. Fayette County Retail Annual Inventory and Vacancy Rate ..................................................... 18 Figure 11. Fayette County Office Growth Trendlines 19
1 Introduction
In 2020, The Lexington Fayette County Urban Government (LFUCG) convened the Lexington Sustainable Growth Study Task Force to establish a data-driven framework for evaluating the growth trends and projections that will determine whether Lexington has the land resources available to meet the needs of a continually growing community and economy. In November 2021, the Existing Conditions and Growth Trends Report was released. This report was the culmination of an extensive analysis of land use and development trends occurring within the Lexington metropolitan area, with a specific emphasis on land and development within Fayette County’s Urban Service Area (USA) The report presented statistics on the development status, zoning, and current land use of all parcels within the USA and reported on the demand trends that affect the need and rate of new development, including residential, industrial, office, and retail uses.
This report is the first data update of the vacant land and growth trends data originally included in the Existing Conditions and Growth Trends Report. Like that report, this update is intended to assist the staff of the LFUCG Division of Planning, the Planning Commission, the Urban County Council, and community members in making decisions regarding the expected land use needs in Lexington over the next twentyyear period.
2 Vacant Land Update
2.1 Analysis Summary
A comprehensive analysis of all parcels within Fayette County’s USA was performed as part of the 2021 Lexington Sustainable Growth Study and reported in the Existing Conditions and Growth Trends Report The primary purpose of the analysis was to estimate the amount of existing vacant land within the USA by zoning classification. Vacant land was defined as land without an existing structure or other principal permitted or conditionally approved use, with the following exceptions:
• Easements, including driveways and utilities,
• Parks and active golf courses,
• Common areas held by condominium or homeowner associations,
• All other land within LFUCG’s “Greenway” GIS coverage, which includes “open space established along a natural corridor, rail-trail, utility corridor, scenic road, or other route for conservation, recreation, or alternative transportation purposes.” 1
All land in agricultural use within the USA is considered vacant under the presumption that it’s inclusion within the USA reflects the expectation of eventual urban development. Parcels consisting of entirely
1 https://data.lexingtonky.gov/datasets/
2023
1
Sustainable Growth Study Update:
Vacant Land and Growth Trends
surface parking (excluding industrial storage) are also considered vacant for the purpose of eventual redevelopment.
To perform this analysis for the original study and this update, a GIS database was created from current 2 LFUCG’s GIS parcel, zoning, and greenway layers, as well as parcel data from the Fayette County Property Valuation Administrator (PVA). Data from the PVA served as a first designation of the existing land use of each parcel, specifically distinguishing between improved and unimproved parcels. The greenway layer was overlayed with the parcel layer to estimate the specific portion of each parcel that is within the greenway. If a parcel is entirely or almost entirely within the greenway (leaving no functional area outside the greenway), the parcel is designated as “greenway.” For vacant parcels that are partially included within a greenway, only the area outside the greenway is estimated as eligible for potential development. An aerial imagery survey, using readily available online sources, was used to verify the current vacancy status of all parcels listed in the PVA data as vacant.
Based on the analysis, each parcel within the USA was assigned one of the following vacancy statuses:
• Greenway – the parcel is entirely or almost entirely within LFCUG’s GIS Greenway coverage.
• Golf/Park – the parcel is part of a park or active golf course.
• Exempt – the parcel is in the active principal permitted or conditionally approved use for that zoning classification, a commonly held area of a condominium or homeowner association, an easement, or otherwise ineligible for development based on limitations resulting from the parcel’s size, shape, and/or location.
• Developed – the parcel includes a principal permitted or conditionally approved structure (i.e., house or building)
• Vacant – land is either in agricultural use or without any structure or assessed improvement, and otherwise eligible for development according to its zoning classification.
The original study’s previous designation of “parcels in transition”, which had identified select parcels for which specific development plans were recognized, has been dropped from this analysis. For the updated analysis, all parcels are summarized according to their current zoning classification and state of development or vacancy. Parcels under construction are not considered developed until a certificate of occupancy is filed, except for residential parcels where advanced construction has been verified by aerial examination as being enclosed and near completion.
2.2 Vacant Land Summary
Table 1 presents the number of vacant parcels and the sum of vacant acres for all parcels within the Fayette County USA by current zoning classification. It compares the sums from the original study’s final analysis of 2020 parcel data with the sums from this updated analysis of 2022 parcel data. Changes in parcel count and acreage are generally a result of zoning changes, development status changes, or
2 LFUCG GIS data was provided in September 2022. Fayette County PVA data was provided in November 2022.
Sustainable Growth Study Update: 2023 Vacant Land and Growth Trends 2
changes in vacancy status due to the more exact application of LFUCG’s Greenway GIS coverage area. Other vacancy status determinations reflect the review and approval of the LFUCG Planning Department.
Growth Study Update: 2023 Vacant Land and Growth
3
Sustainable
Trends
Table
Zone Zoning Description Parcels Total Acres 2020 2022 Delta 2020 2022 Delta A-R Agricultural Rural 23 29 6 1,380.3 1,267.5 -112.8 A-U Agricultural Urban 30 23 -7 538.6 381.4 -157.1 B-1 Neighborhood Business 137 124 -13 51.3 47.7 -3.6 B-2 Downtown Business 3 26 23 0.8 6.7 5.8 B-2A Downtown Frame Business 49 41 -8 5.6 6.9 1.3 B-2B Lexington Business Center 12 44 32 2.9 32.3 29.5 B-3 Highway Service Business 71 58 -13 140.1 144.6 4.5 B-4 Wholesale and Warehouse Business 71 62 -9 135.2 133.5 -1.8 B-5P Interchange Service Business Zone 7 7 0 10.0 8.5 -1.5 B-6P Commercial Center 26 27 1 91.3 91.7 0.4 CC Expansion Area Community Center Mixed Use 13 8 -5 60.6 22.4 -38.2 CD Conservation District 0 0 0 0.0 0.0 0.0 EAR-1 Expansion Area Residential - LDS 89 147 58 188.7 187.0 -1.7 EAR-2 Expansion Area Residential - MDS or 9 du w TDR 115 50 -65 413.4 419.7 6.3 EAR-3 Expansion Area Residential - HDS 6-18 4 3 -1 83.1 92.5 9.4 ED Economic Development Zone - Ind., wrhse, ofc 12 15 3 531.5 526.6 -5.0 I-1 Light Industrial 276 175 -101 523.1 449.3 -73.8 I-2 Heavy Industrial 34 12 -22 24.3 21.3 -2.9 M-1P Mobile Home Park 0 0 0 0.0 0.0 0.0 MU-1 Mixed Use: Neighborhood Node 0 0 0 0.0 0.0 0.0 MU-2 Mixed Use: Neighborhood Corridor 0 1 1 0.0 3.1 3.1 MU-3 Mixed Use: Neighborhood Community 3 10 7 8.4 8.9 0.5 P-1 Professional Office 53 50 -3 81.9 80.6 -1.3 P-2 Office Industry and Research Park Zone 22 20 -2 206.2 243.2 37.0 PUD-1 Residential Planned Unit Development 0 0 0 0.0 0.0 0.0 PUD-2 Luigart Planned Unit Development 1 0 -1 0.1 0.0 -0.1 R-1A Single Family Residential - 25k lot 10 7 -3 25.5 6.9 -18.7 R-1B Single Family Residential - 15k lot 92 73 -19 103.5 77.2 -26.4 R-1C Single Family Residential - 8k lot 207 156 -51 279.3 220.5 -58.8 R-1D Single Family Residential - 6k lot 210 93 -117 162.4 65.5 -96.9 R-1E Single Family Residential - 4k lot 46 20 -26 5.0 74.8 69.9 R-1T Townhouse Residential - 1.5k lot 11 14 3 5.8 16.3 10.5 R-2 Two-Family Residential - 7.5k lot 215 183 -32 43.2 33.5 -9.7 R-3 Planned Neighborhood Residential - 6k lot 893 665 -228 955.8 705.8 -250.0 R-4 High Density Apartment Residential - 6k lot 230 230 0 157.3 131.5 -25.8 R-5 High Rise Apartment Residential - 6k lot 3 8 5 0.4 1.2 0.9 Grand Total 2,968 2,381 -587 6,216 5,509 -707
1. Fayette County Urban Service Area Vacant Land Summary
Table 2 compares the total estimated vacant acreage within the Fayette County USA by plan or study year. Note that the methodologies used to estimate these values were independently established and differ between studies.
3 Residential Development Trends
3.1 Population
Since the release of the Lexington Sustainable Growth Study’s Existing Conditions and Growth Trends Report in 2021, population and household data from the 2020 US Census has become available, along with similar data for 2021 and 2022 from the American Community Survey (ACS), which the US Census uses to continuously release updates. While the 2020 Census data is the more thorough time-specific data set (it was collected throughout the nation in the spring and summer of 2020), ACS data reflects smaller samples taken continuously in various locations, allowing for population estimates for the year 2022 3 Table 3 and Figure 1, presented below, update Table 2.1 and Figure 2.2 from the original report with population estimates from the 2020 Census and 2022 ACS data, shaded in grey. They demonstrate that the region of Fayette County and six surrounding counties continues to grow at more than twice the rate of Kentucky. However, it also shows that Fayette County’s population has declined slightly since the 2019 ACS. This may be in part due to the different sampling methodology of the ACS compared to the 2020 Census, but all other counties reflect population growth generally in line with trends measured since the year 2000.
3 The ACS provides 1-year estimates for counties with a population of at least 65,000 people. This includes Fayette County and Madison County. The most recent ACS estimates for these counties are for 2022. The ACS provides 5year summary estimates for smaller counties. The most recent ACS estimates for these counties are for 2021 and cover the years 2017-2021. TACS 5-year series estimates have a higher sample rate and therefore a lower margin of error than ACS 1-year series estimates. However ACS 1-year series estimates include the most recent data available. For select statistics, such as population estimates, the Census provides regular updates as they become available via its website: https://www.census.gov/quickfacts/
Sustainable Growth Study Update: 2023 Vacant Land and Growth Trends 4
Year Study Amount 1996 Comprehensive Plan 14,553 2001 Comprehensive Plan 14,042 2007 Comprehensive Plan 8,974 2013 Comprehensive Plan 6,715 2018 Comprehensive Plan 5,616 2020 Sustainable Growth Study 6,216 2022 Sustainable Growth Study Update 5,509
Table 2. Total Vacant Acres within the Fayette County Urban Service Boundary by Year
Bourbon County
Woodford County
Clark County
Jessamine County
Scott County
Madison County
Fayette County
steadily since 2000 and its share of new population growth is less than half and continues to decrease.
Sustainable Growth Study Update: 2023 Vacant Land and Growth Trends 5
County 2000 Census 2010 Census 2019 ACS 2020 Census 20221 Growth (20002022) % Growth (20002022) Fayette County 260,512 295,803 323,152 322,750 320,347 59,835 23.0% Madison County 70,872 82,916 90,802 92,701 95,187 24,315 34.3% Scott County 33,061 47,173 54,667 57,155 59,099 26,038 78.8% Jessamine County 39,041 48,586 53,032 52,991 54,254 15,213 39.0% Clark County 33,144 35,613 35,971 36,972 37,061 3,917 11.8% Woodford County 23,208 24,939 26,318 26,871 27,062 3,854 16.6% Bourbon County 19,360 19,985 20,058 20,252 20,093 733 3.8% 7 County Region 479,198 555,015 604,000 609,692 613,103 133,905 27.9% Kentucky 4,041,769 4,339,367 4,467,673 4,505,893 4,512,310 470,541 11.6% Source:
Table 3. Fayette County and Regional Population Growth
United States Census; American Community Survey; 1https://www.census.gov/quickfacts/;
0 100,000 200,000 300,000 400,000
Table 4 presents the share of population for each county within the region and the share of population growth for each county for various years. Fayette County continues to maintain its position as the most populous county in the region, consistently accounting for over 50 percent of the total regional population However, its share of population has fallen moderately but
Population by Year by County 2000 2005 2010 2015 2022 0 5,000 10,000 15,000 20,000 25,000 30,000 35,000 Fayette County 6 Surrounding Counties
2000-05 2005-10 2010-15 2015-22
Population Growth: 2000-2022
Figure 1. Population Growth Since 2000
3.2 Households
Table 5 presents the growth of households in each county in the region. The 2021 five-year estimates, which summarize 2017-2021 data, track closely with the 2020 Census estimates for each county, while the 2022 one-year estimates available for Kentucky, Fayette County, and Madison County suggest a significant increase in households. Unlike population, Fayette County’s share of regional households has remained consistent between 2010 and 2021 at 55 percent.
Table 5. Regional Household Growth
Source: US Census; American Community Survey, Table DP2 : 1(5-Year Series); 2(1-Year Series)
Table 6 updates Table 2.2 in the
household
from the most recently available (2021 or 2022)
for each county. While the number of Fayette County households and families increased between 2019 and 2022, the average household size in Fayette County dropped from 2.37 in 2019 to 2.19 in 2022, and the average family size dropped from 3.02 in 2019 to 2.87 in 2022. During the same period, the percentage of households with minors under the age of 18 years dropped from 28.4 percent to 25.2 percent, while the percentage of households with residents 60 years or older grew from 31.1 percent to 35.1. While the number of households continue to increase in Fayette County, they are growing older and slightly smaller in size. Overall, Fayette County household attributes remain close to the averages for these metrics for the region.
Sustainable Growth Study Update: 2023 Vacant Land and Growth Trends 6
County Share of Population Share of Pop. Growth 2000 2010 2019 2022 20002010 20102022 Fayette County 54.4% 53.3% 53.5% 52.9% 46.5% 42.3% Madison County 14.8% 14.9% 14.9% 15.0% 15.9% 21.1% Scott County 6.9% 8.5% 9.1% 9.4% 18.6% 20.5% Jessamine County 8.1% 8.8% 8.8% 8.7% 12.6% 9.8% Clark County 6.9% 6.4% 6.0% 6.1% 3.3% 2.5% Woodford County 4.8% 4.5% 4.4% 4.4% 2.3% 3.7% Bourbon County 4.0% 3.6% 3.3% 3.3% 0.8% 0.2% 7 County Region 100.0% 100.0% 100.0% 100.0% 100.0% 100.0%
Table 4. Regional Share of Population Growth
County 2000 Census 2010 Census 2019 ACS1 2020 Census 2021 ACS1 2022 ACS2 Fayette County 108,411 123,043 129,784 134,535 134,229 140,837 Madison County 27,181 31,973 33,359 36,148 35,411 37,118 Scott County 12,081 17,408 20,551 21,371 21,347 NA Jessamine County 13,862 17,642 18,821 19,438 19,054 NA Clark County 12,980 14,267 14,509 14,917 14,836 NA Woodford County 8,925 9,806 10,355 10,736 10,395 NA Bourbon County 7,705 7,976 8,106 8,220 8,135 NA 7 County Region 191,145 222,115 235,485 245,365 243,407 NA Kentucky 1,591,739 1,684,348 1,748,732 1,748,053 1,748,475 1,828,680
original report with
data
ACS profiles
US Census American Community Survey: Table S1101 Households and families: 1(2022 1-Year); 2(2021 5-Year)
3.3 Housing Units
Table 7 presents the growth of total housing units within the region. Like households, the number of housing units per county for the 2021 ACS five-year estimates tracks closely to but lower than the 2020 Census estimates for each county. The 2022 ACS one-year also shows a notable increase in Fayette County units. The regional share of housing units in Fayette County has also remained consistent between 2010 and 2022, at 55 percent.
Source: US Census; American Community Survey, Table DP2 : 1(5-Year Series); 2(1-Year Series)
Table 8 and Figure 2 breaks out ACS 1-year estimates of total housing units in Fayette County by year and occupancy status. The one -year ACS 2021 estimate differs notably from the five-year ACS 2021 estimate in that it maintains a positive increase from 2020. The table and figure also show the downward trend of percent-vacant units, with a significant drop occurring since 2020.
Sustainable Growth Study Update: 2023 Vacant Land and Growth Trends 7
County Households Household Population Avg. Hshd. Size Families % Families Avg. Family Size Hshds. with minors Hshds. with 60+ Fayette County1 140,837 308,433 2.19 78,001 55.4% 2.87 25.2% 35.1% Madison County1 37,118 89,826 2.42 21,317 57.4% 3.05 24.1% 38.0% Scott County2 21,347 54,862 2.57 15,403 72.2% 2.98 37.8% 31.3% Jessamine County2 19,054 51,255 2.69 13,215 69.4% 3.17 32.4% 40.4% Clark County2 14,836 36,348 2.45 10,158 68.5% 2.89 31.6% 42.2% Woodford County2 10,395 26,403 2.54 7,402 71.2% 3.01 31.4% 46.3% Bourbon County2 8,135 20,093 2.47 5,279 64.9% 2.97 30.4% 45.1% 7 County Region 251,722 587,220 2.33 150,775 59.9% 2.94 27.5% 36.8% Kentucky1 1,748,053 4,330,127 2.48 1,172,125 67.1% 2.97 29.2% 41.8%
Table 6. Fayette and Regional Household Profile (2021-2022)
Source:
County 2000 Census 2010 Census 2019 ACS1 2020 Census 2021 ACS1 2022 ACS2 Fayette County 116,167 135,160 141,653 146,142 145,092 148,963 Madison County 29,595 35,043 36,707 39,319 38,882 40,310 Scott County 12,977 19,303 22,007 22,795 22,541 NA Jessamine County 14,646 19,331 20,447 20,626 20,542 NA Clark County 13,749 15,706 15,900 16,116 16,063 NA Woodford County 9,374 10,711 11,138 11,487 11,393 NA Bourbon County 8,349 8,927 9,064 9,112 9,106 NA 7 County Region 204,857 244,181 256,916 265,597 263,619 NA Kentucky 1,750,927 1,927,164 1,983,949 1,994,323 1,988,420 2,023,679
Table 7. Regional Housing Units
Fayette County Housing Units
3.4 Building Permits
Figure 3 and Table 9 update Figure 5.1 and Table 5.3 in the original report, adding the number of new building permits by residential unit type since 2019. The table shows the continuation of the trend of multifamily units in structures containing five or more units surpassing single family units.
Sustainable Growth Study Update: 2023 Vacant Land and Growth Trends 8 Table 8. Fayette
Housing Units Year Total Occupied Vacant Percent Vacant 20001 116,167 108,288 7,879 6.8% 20101 135,388 120,761 14,627 10.8% 2011 136,197 122,746 13,451 9.9% 2012 136,447 122,920 13,527 9.9% 2013 137,908 125,138 12,770 9.3% 2014 138,832 127,412 11,420 8.2% 2015 139,840 129,088 10,752 7.7% 2016 140,976 127,137 13,839 9.8% 2017 141,630 129,140 12,490 8.8% 2018 142,688 131,067 11,621 8.1% 2019 144,089 131,929 12,160 8.4% 20201 146,142 134,535 11,607 7.9% 2021 147,590 139,303 8,287 5.6% 2022 148,963 140,837 8,126 5.5% 2010-20 10,754 13,774 -3,020 2020-22 2,821 6,302 -3,481 Source: American Community Survey (1-year series) 1 US Census DEC Summary File 1, 3
County
Figure 2. Fayette County Housing Units
0% 2% 4% 6% 8% 10% 12% 100,000 110,000 120,000 130,000 140,000 150,000 160,000 2010 2011 2012 2013 2014 2015 2016 2017 2018 2019 2020 2021 2022
Total Occupied Vacant Percent % Total
Fayette County Single and Multi-Family Development
Sustainable Growth Study Update: 2023 Vacant Land and Growth Trends 9
Table 9. Fayette County Building
Units in Multi-Family Structures Year Total Units SingleFamily All MF Structures 2-unit MF Structures 3-4 unit MF Structures 5+ Unit MF Structures 2000 2,544 1,898 646 30 32 584 2001 1,758 1,649 109 66 43 0 2002 2,321 2,142 179 6 44 129 2003 2,309 2,206 103 30 0 73 2004 2,960 2,184 776 14 82 680 2005 2,763 2,399 364 8 32 324 2006 2,080 1,521 559 16 75 468 2007 1,360 1,227 133 6 39 88 2008 2,194 771 1,423 18 125 1,280 2009 1,102 770 332 12 8 312 2010 822 628 194 8 18 168 2011 739 513 226 18 4 204 2012 1,816 750 1,066 10 16 1,040 2013 899 676 223 10 26 187 2014 1,225 687 538 12 20 506 2015 1,342 629 713 12 10 691 2016 1,365 670 695 8 8 679 2017 1,348 743 605 8 6 591 2018 1,789 733 1,056 10 7 1,039 2019 1,383 579 804 0 0 804 2020 1,437 702 735 4 0 731 2021 1,655 792 863 4 0 859 2022 1,731 686 1,045 4 0 1,041 2000-2009 Sum 21,391 16,767 4,624 206 480 3,938 2010-2019 Sum 12,728 6,608 6,120 96 115 5,909 2020-2022 Sum 4,823 2,180 2,643 12 0 2,631 Source: US HUD; US Census 0 500 1,000 1,500 2,000 2,500 2000 2001 2002 2003 2004 2005 2006 2007 2008 2009 2010 2011 2012 2013 2014 2015 2016 2017 2018 2019 2020 2021 2022
Figure 3. Fayette County Single and multi-Family Building Permits
Permits
Single-Family All MF Structures
3.5 Household Growth Trends
In Chapter 9 of the original report, growth trends for Fayette County households were selected as the best indicators for future demand of additional residential housing units. Table 10 updates Table 9.1 from the original report, with new data from the 2020 Census and the 2022 ACS shaded in grey. New household projections from the Kentucky State Data Center’s (KSDC), which have been updated to reflect the 2020 Census data for Fayette County, are also included. The rate of historical household growth over the previous 10-year period, and the rate of future household growth through 2040, as projected by the KDSC 4, were used to establish the upper and lower bounds of potential household growth. As the 2020 Census data was not yet available at the time of the original analysis, the Compound Annual Growth Rate (CAGR) for historical growth was based on the 2010 Census and the 2019 ACS estimates for households. That CAGR was 0.99% and represented the lower bound of potential growth. The KSDC projections for 2020 and 2040, which at that time were based on the 2010 Census and ACS data through 2015, were used to calculate the upper bound CAGR, which was 1.29%
Table 10. Fayette County Historic and Projected Household Growth
Compound Annual Growth
Historic (2010-22): 1.13% Projected (2020-2040): 0.93%
Sources: U.S. Census; 1ACS 5-year series estimate; 2ACS 1-year series estimate; 3Kentucky State Data Center
Applying the same approach, the updated historical CAGR for Fayette County households is now calculated using the 2010 Census and the most recently available ACS estimate for 2022. This new CAGR is 1.13%. The new 2020 and 2040 household projections from the KSDC, which now reflect the 2020 Census result in a CAGR of 0.93%. The updated CAGRs for historical and projected household growth have effectively flipped, with the historical CAGR now representing the upper bounds of demand and the projected growth representing the lower bounds of demand. This is the result of notably higher 2022 ACS estimates in the historical CAGR calculation and the KSDC replacing higher 2019 household estimates from the ACS with lower estimates from the 2020 Census in their population projections. The end results are new CAGRs that are slightly lower overall (0.93%-1.13% versus 0.99%-1.29%) and significantly tighter (0.20% versus 0.30%).
Figure 4 updates Table 9.3 from the original report, shifting the 20-year horizon to 2042. The new lower estimate for 20-year household growth is 28,500, which is the same as the lower estimate from the previous analysis, although it now represents the KSDC projected growth. The new upper estimate for
4 KSDC household and population projections have previously been a referred source in the 2018 Imagine Lexington Comprehensive Plan.
Sustainable Growth Study Update: 2023 Vacant Land and Growth Trends 10
2010 Census 2019 ACS1 2020 Census 2022 ACS2 2030 Projection3 2040 Projection3 Total Population 295,803 323,152 322,570 320,347 351,352 375,774 Population in Households 282,999 308,140 309,060 308,433 338,391 362,553 Total Households 123,043 129,784 134,535 140,837 149,639 161,776
20-year household growth is 35,600, which is significantly lower than the previous upper estimate of 41,200 new households.
20 Year Household Growth Trendlines (Cumulative Additional Households) KSDC Projections Historical Trend (2010-2022)
4 Industrial Demand
For the commercial market analysis, this update continues to use market data provided by commercial online data vendor, Costar 5. For this update, the study area encompasses Fayette County and the five surrounding counties that constitute the Lexington Metropolitan Statistical Area (MSA) 6 The industrial inventory reveals around 59.3 million square feet in Fayette County and the other five counties in the MSA as of 2022 Q4. The regional industrial market continues to grow with strong overall fundamentals. Table 11 updates Figure 6.2 from the original report with industrial inventories for Quarter 4 (Q4) of 2022 shaded in grey.
4.1 Market Summary
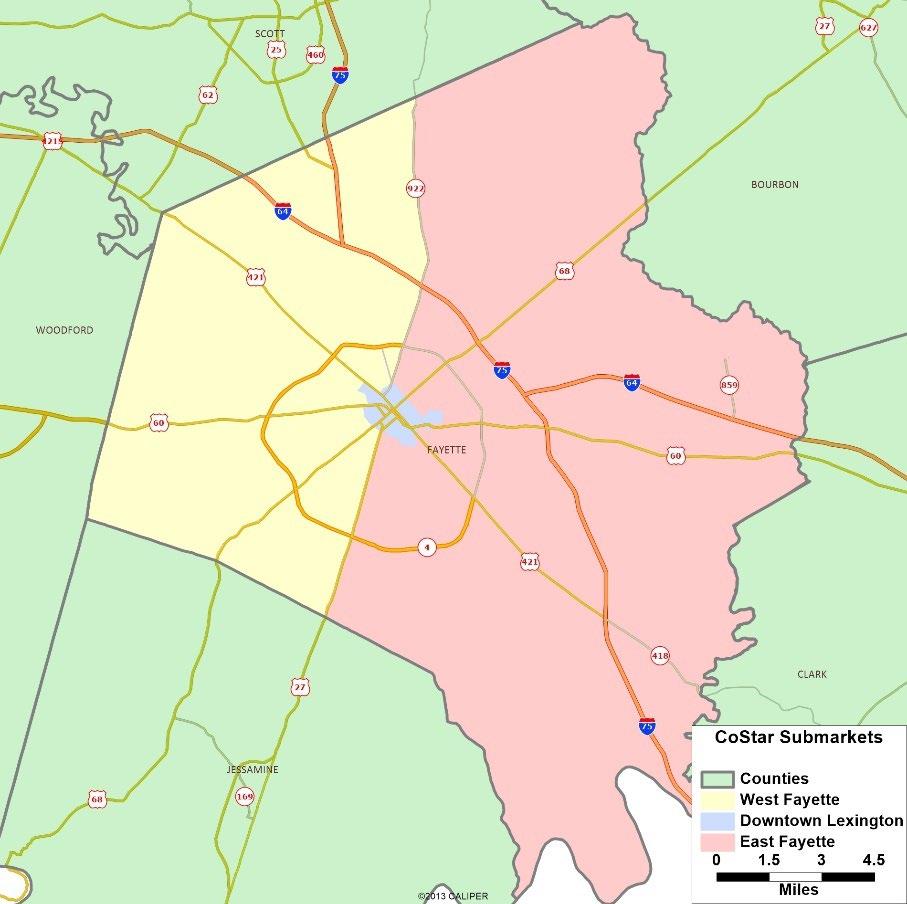
The inventory of industrial space in Fayette County cumulatively totaled over 32.3 million square feet as of Q4 2022. This represents nearly 55% of the overall industrial inventory in the MSA. The surrounding counties account for 26.9 million square feet. Commercial inventory for Fayette County is broken down by CoStar into three submarkets: East Lexington, West Lexington, and Downtown Lexington. Figure 5
5 https://www.costar.com/
6 The previous analysis previous study also included Madison County as part of the MSA; However, Madison is no longer considered by the Census Bureau as part of the MSA and its inventory is no longer included in CoStar’s Lexington area market reports.
Sustainable Growth Study Update: 2023 Vacant Land and Growth Trends 11
Figure 4. 20-year Household Growth Trendlines
28,500 35,600 0 5,000 10,000 15,000 20,000 25,000 30,000 35,000 40,000 45,000
Sustainable Growth Study Update: 2023 Vacant Land and Growth Trends
presents the location of these submarkets. West Lexington is the largest industrial submarket in the region, with a total inventory of 18.4 million square feet.
Source: Costar
Table 12 updates Figure 6.3 from the original report with Q4 2022 vacancy rates shaded in grey. At the end of 2022, the overall vacancy rate for industrial space in the Lexington MSA remains low at 3.3%, although this could increase to 4.0% by 2026 as new inventory becomes available Net absorption of available industrial space in 2021 totaled 830,000 square feet, a strong recovery from the negative
12
Figure 5. CoStar Submarkets
County/Submarket Inventory SF (2020) Inventory SF (2022) Growth (2020-2022) % Growth Fayette County / West Lexington 18,548,598 18,422,899 -125,699 -0.7% Fayette County / East Lexington 12,057,881 12,690,900 633,019 5.2% Fayette County / Downtown Lexington 1,147,049 1,247,409 100,360 8.7% Fayette County / Total 31,753,528 32,361,208 607,680 1.9% Scott County 11,172,325 11,190,940 18,615 0.2% Jessamine County 3,894,887 4,582,256 687,369 17.6% Clark County 3,342,866 3,561,717 218,851 6.5% Woodford County 3,438,999 3,579,554 140,555 4.1% Bourbon County 4,793,315 4,033,817 -759,498 -15.8% Total 58,395,920 59,309,492 913,572 1.6%
Table 11. Regional Industrial Inventory by Submarket
absorption of (300,000) square feet in 2020. Recent deliveries of new space in 2022 total approximately 329,000 square feet. As of Q4 of 2022, a total of 430,000 square feet in new industrial properties are under construction, representing a pipeline of 0.7% of the total inventory.
Fayette
Fayette
Fayette
Scott County
Clark County
Woodford County
Bourbon County
Regional Average
Source: Costar
Rental income grew 12.5% between 2021 Q4 and 2022 Q4, a rate of growth which exceeds the national average. Although most of the recently leased spaces are less than 100,000 square feet, at least five new leases in 2022 have been for space over 100,000 square feet. The tight vacancy rate drives an increase in asking rents in the MSA, although with new supply in the pipeline, overall vacancy should climb moderately and the growth in rent prices may flatten as a result.
Figure 6 updates Figure 6.4 from the original report, extending the annual industrial inventory and vacancy rate for Fayette County through 2022. The figure shows a notable increase in industrial inventory since the previous analysis, along with swings in the vacancy rate between 2020 and 2022.
Source:
Study Update: 2023 Vacant Land and Growth Trends 13
Sustainable Growth
County/Submarket 2020 2022
Table 12. Regional Industrial Vacancy Rates by Submarket
6.7% 5.8%
County / West Lexington
5.6% 2.4%
County / East Lexington
Downtown Lexington 4.4% 4.1%
County /
1.0% 1.6%
5.3% 2.8%
Jessamine County
7.0% 3.5%
3.9% 1.6%
3.8% 0.2%
4.9% 3.3%
Fayette County Industrial Annual Inventory and Vacancy Rate 0.0% 1.0% 2.0% 3.0% 4.0% 5.0% 6.0% 30,000,000 30,500,000 31,000,000 31,500,000 32,000,000 32,500,000 Fayette County Industrial Inventory (SF) and Vacancy Rate Inventory SF Vacant % of Total
Costar Figure 6.
Between 2000 and 2010, Fayette County accounted for a larger share of new industrial development than all the other MSA counties combined. Since 2010, the share of new industrial development has been split relatively evenly between Fayette County and the other MSA counties. As a result, Fayette County’s current share of total industrial space within the MSA has stabilized at 55% since 2010. Fayette County’s strongest competition for new industrial development remains other large metropolitan areas outside the region, including Louisville and Cincinnati/North Kentucky.
4.2 Trend Analysis
Applying the approach used in the original analysis, trendlines were estimated from the calculation of 10year and 20-year inventory growth for industrial space in Fayette County. As with the previous analysis, the 20-year Full trendline, which now includes the years from 2003 to 2022, includes the significant buildup in industrial inventory developed before the 2008 financial crisis. The CAGR for the 20-year Full trendline is 0.8%, the same as the CAGR calculated for the 2000-2020 period used in the previous analysis. The 10-year Conservative trendline, which now covers from 2013 to 2022, reflects the lower rate of new development following the resulting recession, but now includes additional inventory added since 2020. The new CAGR for the 10-year Conservative trendline is 0.4%, as compared to 0.2% for the 10-year period between 2010 and 2020 analyzed in the original study
Figure 7 updates Figure 10.1 from the original report. The Full trendline estimate of an additional 5.8 million square feet of additional industrial space by 2042 is similar to the previous Full estimate for 5.6 million square feet. However, after accounting for the increased industrial development occurring between 2020 and 2022, the Conservative 10-year trend line now estimates 2.5 million square feet expected by 2042, which is almost double the 1.3 million square previously estimated.
Sustainable Growth Study Update: 2023 Vacant Land and Growth Trends 14
2,500,000 5,800,000 0 1,000,000 2,000,000 3,000,000 4,000,000 5,000,000 6,000,000 7,000,000 20 Year Industrial Growth Trendlines (Cumulative SF) 10-year Trendline (Conservative) 20-year Trendline (Full)
Figure 7. Fayette County Industrial Growth Trendlines
5 Office Demand
5.1 Market Summary
Table 13 presents the inventory of office space in the Lexington MSA and updates Figure 6.5 in the original report. Between 2020 and 2022, the Lexington MSA added more than 350,000 square feet, or 1.7% of office inventory, for a total of 21.6 million square feet of space as of Q4 of 2022 Fayette County represents 87.7% of the total regional office inventory with almost 19.0 million square feet. The five other countries represent the remaining 2.7 million square feet. The largest sub-market and the sub-market with the highest growth remains the East Lexington market, as growth in the other subareas, Downtown Lexington and West Lexington, has been relatively flat.
Source: Costar
Table 14 updates Figure 6.6 in the original report. The overall vacancy rate in the Lexington office market averaged 7.2% as of Q4 2022, although rates vary by submarket and class. Net absorption has been slightly negative (-16,400 square feet) for the last twelve months through Q4 of 2022 While vacancy rates have changed more noticeably in the other MSA counties since 2020, they reflect much smaller inventories.
Source: Costar
Sustainable Growth Study Update: 2023 Vacant Land and Growth Trends 15
Table
County/Submarket Inventory SF (2020) Inventory SF (2022) Growth (2020-2022) % Growth Fayette County / West Lexington 6,307,585 6,322,416 14,831 0.2% Fayette County / East Lexington 7,189,461 7,367,479 178,018 2.5% Fayette County / Downtown Lexington 5,300,845 5,294,676 -6,169 -0.1% Fayette County / Total 18,797,891 18,984,571 186,680 1.0% Scott County 519,776 609,295 89,519 17.2% Jessamine County 826,114 879,349 53,235 6.4% Clark County 520,494 545,222 24,728 4.8% Woodford County 473,218 470,532 -2,686 -0.6% Bourbon County 160,234 162,885 2,651 1.7% Total 21,297,727 21,651,854 354,127 1.7%
13.
Regional Office Inventory by Submarket
County/Submarket 2020 2022 Fayette County / West Lexington 5.2% 4.5% Fayette County / East Lexington 10.3% 11.4% Fayette County / Downtown Lexington 7.8% 6.7% Scott County 0.6% 8.0% Jessamine County 1.8% 1.7% Clark County 0.5% 0.0% Woodford County 6.6% 4.3% Bourbon County 0.0% 0.0% Regional Average 7.0% 7.2%
Table 14. Regional Office Vacancy Rates by Submarket
Rental rates recorded slow growth of 1.9% between Q4 of 2021 and Q4 of 2022 and averaged about $18.10/SF in Q4 of 2022. New deliveries in 2022 were limited to three buildings totaling 85,000 square feet, two of which were medical offices.
Figure 8 updates Figure 6.7 in the original report.
Fayette County Office inventory (SF) and Vacancy Rate
16,000,000 16,500,000 17,000,000 17,500,000 18,000,000 18,500,000 19,000,000 19,500,000 20,000,000
Source: Costar
Figure 8 Fayette County Office Inventory (SF) and Vacancy Rate
Since 2010, Fayette County has received almost 75 percent of new office development in the MSA: 1.4 million square feet compared to 0.5 million square feet in the surrounding counties. However, since 2020, that share has been closer to 50 percent as total new development has been low. Lexington has historically been considered a small office market with less speculative office development compared to other markets such as Louisville, Cincinnati, or Nashville.
5.2 Trend Analysis
Applying the approach used in the original analysis, trendlines were estimated from the calculation of 10year and 20-year inventory growth for office space in Fayette County. The 20-year Full trendline, which now includes the years from 2003 to 2022, estimates a CAGR of 1.2%, as compared to 1.1% calculated for the previous analysis. The 10-year Conservative trendline, which now covers from 2013 to 2022, estimates a CAGR of 0.6%, which is the same as the previous analysis.
Figure 9 updates Figure 10.2 from the original report. The Full trendline estimates an additional 5.2 million square feet of additional office space will be developed by 2042, an increase from 4.6 million square feet projected by the previous Full trendline. The Conservative 10-year trend line now estimates 2.4 million square feet expected by 2042, which is slightly less than the 2.5 million square previously estimated for the previous Conservative trendline in the original report
2023 Vacant Land and Growth Trends 16
Sustainable Growth Study Update:
0.0% 2.0% 4.0% 6.0% 8.0% 10.0% 12.0%
Inventory SF Vacancy % of Total
20 Year Office Growth Trendline (Cumulative SF)
10-year Trendline (Conservative) 20-year Trendline (Full)
6 Retail Demand
Table 15 presents the inventory of retail space in the Lexington MSA and updates Figure 6.8 in the original report. The inventory of retail space in the region totals 32.1 million square feet. Fayette County represents the bulk of the inventory at 21.7 million square feet, or 67.5 percent of the total. Retail inventory fell between 2020 and 2022 in Fayette County, most notably in the downtown submarket. Retail growth in the other MSA counties, particularly Scott County, counterbalanced this decline for a slight increase in total inventory.
Source: Costar
Table 16 presents vacancy
by submarket in 2020 and 2022. In Q4 of 2022, the Lexington MSA retail market had a vacancy rate of around 3.7% overall. Over the twelve months leading to Q4 of 2022,
Sustainable Growth Study Update: 2023 Vacant Land and Growth Trends 17
Figure 9. Fayette County Office Growth Trendlines
County/Submarket Inventory SF (2020) Inventory SF (2022) Growth (2020-2022) % Growth Fayette County / West Lexington 7,806,687 7,849,761 43,074 0.6% Fayette County / East Lexington 12,064,079 12,045,896 -18,183 -0.2% Fayette County / Downtown Lexington 2,129,827 1,802,211 -327,616 -15.4% Fayette County / Total 22,000,593 21,697,868 -302,725 -1.4% Scott County 2,886,235 3,167,173 280,938 9.7% Jessamine County 2,918,623 2,925,117 6,494 0.2% Clark County 2,106,029 2,166,369 60,340 2.9% Woodford County 994,558 1,015,604 21,046 2.1% Bourbon County 1,116,411 1,167,108 50,697 4.5% Total 32,022,449 32,139,239 116,790 0.4%
Table 15. Regional Retail Inventory by Submarket
2,400,000 5,200,000 0 1,000,000 2,000,000 3,000,000 4,000,000 5,000,000 6,000,000
rates
annual rent growth averaged approximately 6.0%, which is above the national average. The net absorption for the last twelve months through Q4 of 2022 was 188,000 square feet, with the largest lease through that period signed by Floor & Decor for a space of 83,000 square feet. Lexington’s relatively low vacancy rate and relatively high rent growth are due to a historically slow development pipeline. Total retail inventory in the MSA has only grown by 4% since 2015.
16. Regional Retail Inventory by Submarket
Figure 10 updates Figure 6.7 in the original report. Since 2000, Fayette County has seen the creation of 5 million square feet of new retail development, compared to 4 million square feet developed in the surrounding MSA counties. However, the precept “retail follows rooftops” holds that retail inventory will continue to expand in suburban areas with strong residential growth, including outside of Fayette County. The recent decrease in inventory in downtown Lexington reflects in part the renovation of the Lexington Center and other general market forces affecting developed urban areas with aging retail stock.
Source:
2023 Vacant Land and
18
Sustainable Growth Study Update:
Growth Trends
County/Submarket 2020 2022 Fayette County / West Lexington 5.6% 6.4% Fayette County / East Lexington 6.7% 3.0% Fayette County / Downtown Lexington 4.4% 5.6% Fayette County / Total 5.8% 4.4% Scott County 1.0% 1.4% Jessamine County 5.3% 0.8% Clark County 7.0% 4.5%
County 3.9% 3.3%
County 3.8% 1.8% Regional Average 4.0% 3.7%
Table
Woodford
Bourbon
Source: Costar
Inventory and Vacancy Rate 0.0% 1.0% 2.0% 3.0% 4.0% 5.0% 6.0% 7.0% 18,000,000 18,500,000 19,000,000 19,500,000 20,000,000 20,500,000 21,000,000 21,500,000 22,000,000 22,500,000 23,000,000 Fayette County Retail Inventory and Vacancy Rate (SF) Retail Inventory (SF) Vacancy Rate
Costar Figure 10. Fayette County Retail Annual
6.1 Trend Analysis
Applying the approach used in the original analysis, trendlines were estimated from the calculation of 10year and 20-year inventory growth for retail space in Fayette County. The 20-year Full trendline, which now includes the years from 2003 to 2022, estimates a CAGR of 1.0%, which is just slightly lower than the previous CAGR estimated for 2000-2019. In comparison, the 10-year Conservative trendline, which now includes the relatively flat period from 2013 to 2022, estimates a CAGR of 0.3%, compared to 0.5% for the previous CAGR estimated for 2010-2019.
Figure 11 updates Figure 10.3 from the original report. The Full trendline estimates an additional 4.7 million square feet of additional retail space will be developed by 2042, slightly lower than the 5.0 million square feet projected by the previous Full trendline. The Conservative 10-year trend line now estimates 1.4 million square feet expected by 2042, which is notably less than the 2.2 million square previously estimated for the previous Conservative trendline presented in the original report
20 Year Retail Growth Trendline (Cumulative SF)
Sustainable Growth Study Update: 2023 Vacant Land and Growth Trends 19
1,400,000 4,700,000 0 500,000 1,000,000 1,500,000 2,000,000 2,500,000 3,000,000 3,500,000 4,000,000 4,500,000 5,000,000 0 0 0 0 0 0 0 0 0 0 0 0 0 0 0 0 0 0 0 0
Figure 11. Fayette County Office Growth Trendlines
10-year
20-year
Trendline (Conservative)
Trendline (Full)
