
Breakfast seminar: Market update Tuesday 13th September 8:00 am – 10:00 am


Susan Freeman, Partner, Mishcon de Reya
Opening and introductions

WPA Vice Chair and Managing Director, Central London at Landsec


Panellists
Adam Cosgrove Senior Director, CBRE Rory Paton Senior CentralDirector,LondonAgency,JLL
Tiffany Luckett Director, Central LondonSavillsRetail, Tom Bill Head of UK Residential Research, Knight Frank Marcus Geddes

IntroducingCBREDirector,
Adam Cosgrove Senior
West End Market Update
September 2022
Confidential & Proprietary | © 2021 CBRE, Inc. 6 Source: CBRE Research Major European cities take-up, 12 months to end Q2 2022 vs 10-year average Central London take-up has outperformed -30% -20% -10% 0% 10% 20% 30% FrankfurtBrusselsDublinAmsterdamViennaam Main Paris MunichCentralBerlinStockholmCityMadridRomeIle-de-FranceLondon Barcelona WestMilanEnd Take up last 12 months vs 10 year average
Confidential & Proprietary | © 2021 CBRE, Inc. 7 Source: CBRE Research West End take-up Leasing activity improved in Q2, but outlook has weakened 0 111100 1 222 2000Q2 2000Q4 2001Q2 2001Q4 2002Q2 2002Q4 2003Q2 2003Q4 2004Q2 2004Q4 2005Q2 2005Q4 2006Q2 2006Q4 2007Q2 2007Q4 2008Q2 2008Q4 2009Q2 2009Q4 2010Q2 2010Q4 2011Q2 2011Q4 2012Q2 2012Q4 2013Q2 2013Q4 2014Q2 2014Q4 2015Q2 2015Q4 2016Q2 2016Q4 2017Q2 2017Q4 2018Q2 2018Q4 2019Q2 2019Q4 2020Q2 2020Q4 2021Q2 2021Q4 2022Q2 2022Q4 2023Q2 2023Q4 ftsqMillions Secondhand New Completed Pre-let Forecast 10-Year Average
Confidential & Proprietary | © 2021 CBRE, Inc. 8 Source: CBRE Research Under offers remain high relative to trend, West End especially 1.00.50.0 1.5 2.52.0 Q12016 Q22016 Q32016 Q42016 Q12017 Q22017 Q32017 Q42017 Q12018 Q22018 Q32018 Q42018 Q12019 Q22019 Q32019 Q42019 Q12020 Q22020 Q32020 Q42020 Q12021 Q22021 Q32021 Q42021 Q12022 Q22022 ftMillionssq Secondhand New Pre-let 10-year average 37% 39% 9%6% 9% City West End Midtown Southbank Docklands West End under offers Central London under offers by market, Q2 2022
Confidential & Proprietary | © 2021 CBRE, Inc. 9 Source: CBRE Research West End Take-up by Sector The banking and finance sector dominates take-up 32% 25% 8%4% 4% 10%29%2022Q22021Q3 Banking & Finance Business Services Manufacturing, Industrial & Energy Public Sector Professional Consumer Services & Leisure Creative Industries
TENANT: PAYMENT SENSE
Confidential & Proprietary | © 2021 CBRE, Inc. 10
Key Deals of 2022
22 BAKER STREET
SIZE: 220,000 SQ FT
20 CARLTON HOUSE TERRACE


THE SIZE:LANTERN45,000SQ FT
PADDINGTON SQUARE
SIZE: 75,000 SQ FT
PADDINGTON SQUARE


TENANT: BAUER MEDIA
SIZE:N2 39,000 SQ FT
TENANT: QRT
TENANT: CAPITAL INT

SIZE: 52,000 SQ FT
TENANT: BP
TENANT: FORSTERS
SIZE: 68,000 SQ FT
Central London prime headline rents (£PSF)
Steady growth across a majority of the markets
Colour shows year-on-year change
DOCKLANDS£50.00(+1.0%)
VICTORIA £82.50 (+13.8%)
KING’S CROSS £90.00 (+9.1%)
C’WELL / F’DON (+£83.001.8%)
SHOREDITCH / OLD £70.00STREET(-)
FallNoRiseChange
rental
£72.50SOUTHBANK(+11.5%) (+5.9%)£71.50HOLBORN CITY £71.00CORE(+1.4%)
Source: CBRE Research, Q2 2022
Confidential & Proprietary | © 2021 CBRE, Inc. 11
(+14.6%)£82.50GARDENCOVENT(+£95.00SOHO11.8%)
KNIGHTSBRIDGE AND £95.00BELGRAVIA(+15.9%)
NORTH £EASTOXFORDOFSTREET92.50(+12.1%) (+10.3%)PADDINGTON£80.00NORTH OF OXFORD £95.00STREET(+11.8%)MAYFAIR & ST JAMES’S £130.00 (+13%)
Confidential & Proprietary | © 2021 CBRE, Inc. 12 Source: CBRE Research West End availability Availability expected to fall Breakdown of secondhand availability by size and grade 3210 4 1098765 2003Q2 2004Q2 2005Q2 2006Q2 2007Q2 2008Q2 2009Q2 2010Q2 2011Q2 2012Q2 2013Q2 2014Q2 2015Q2 2016Q2 2017Q2 2018Q2 2019Q2 2020Q2 2021Q2 2022Q2 2023Q2 2024Q2 ftMillionssq Secondhand New Completed New U/C Forecast 10-year average 300250200150100500 <5,000 sq ft 5-10,000 sq ft 10-20,000 sq ft 20-50,000 sq ft 50-100,000 sq ft >100,000 sq ft unitsofNumber Grade A Other Grade
Confidential & Proprietary | © 2021 CBRE, Inc. 13 Source: CBRE
West End development
Medium-term pipeline is constrained

DEVELOPER: LANDSEC
SPACE HOUSE SIZE: 230,000 SQ FT DEVELOPER: SEAFORTH LAND THE SIZE:ACRE224,000 SQ FT
Confidential & Proprietary | © 2021 CBRE, Inc. 14
DEVELOPER: NORTHWOOD INVESTORS
SIZE: 140,000 SQ FT DEVELOPER: ROYAL LONDON N2 SIZE: 160,000 SQ FT DEVELOPER: LANDSEC SIZE:LUCENT110,000 SQ FT


THE EARNSHAW
2023
Key Development Schemes
Introducing
Rory Paton Senior CentralDirector,LondonAgency,JLL
2022 Q2 © 2022 Jones Lang LaSalle IP, Inc. All rights reserved.

Robust performance for H1 but cautious optimism for
H2 2022 © 2022 Jones Lang LaSalle IP, Inc. All rights reserved. City leasing office market performance – Q2 2022 6.0 million sq ft active prime£72.50demandpersqftofficerent 8.1% Overall vacancy rate 1.4% new build vacancy rate 2.9 million sq ft take-up (H1 2022) 1.5 million sq ft under offer

17


18 Theme 1: City pre-letting activity continues at pace © 2022 Jones Lang LaSalle IP, Inc. All rights reserved. City take-up, 2016-2022 24% Of 2022 H1 take-up was for pre-let stock 48% Of current City under offer space is for pre-let stock 11 11 pre-lets over 100,000 sq ft signed transacted in the City since 202064% were legal firms Legal Legal sector has accounted for 62% of pre-let take-up since 2020, compared to long-term average of 23%15%10%5%0% 20% 50%45%40%35%30%25%4.03.53.02.52.01.51.00.50.0 H1 H2 H1 H2 H1 H2 H1 H2 H1 H2 H1 H2 H1 2016 2017 2018 2019 2020 2021 2022 ftsqMillions Pre-let Builtstock Pre-let%oftotaltake-up
19 Theme 2: Strong pre-leasing continues to erode the pipeline © 2022 Jones Lang LaSalle IP, Inc. All rights reserved. 5.3 million sq ft Under construction speculatively 33 Charterhouse St, EC1 200,000 sq ft Completion: 2022 38% Of space under construction is pre-let or under offer 8 Bishopsgate, EC2 580,000 sq ft Completion: 2023 2.7 2.03.02.52.01.51.00.50.0 3.5 4.54.0 2019 2020 2021 2022 2023 2024 2025 ftsqMillions Under construction - spec Under construction - under offer Under construction - prelet Completed - spec Completed - prelet The Forge, 105 Sumner Street, SE1 134,000 sq Completion:ft2022 40 EC3Leadenhall, 832,000 sq ft Completion: 2023 Norton Folgate, E1 302,000 sq ft Completion: 2023 Worship Square, EC2 133,000 sq Completion:ft2024 City speculative development pipeline, 2019-2025


20 Theme 3: Strong levels of activity from the professional services sector – largely driven by legal firms City take-up by business sector (2010-2022 Q2) © 2022 Jones Lang LaSalle IP, Inc. All rights reserved. 23%19% 18% 4% 23% 6% 5% 2% 20% 19% 13% 17% 19% 3% 7% 2% Banking & Finance Professional services Service Industry Flexible Workspaces TMT Manufacturing Public Admin Other 17% 36% 11% 6% 17% 3% 8% 2% 2010-2014 2015-2019 2020-2022 Q2
Tata Communications / McDermott Will & Emery / Paloalto Networks


Hogan Lovells

Kirkland & Ellis / Chubb Squire Patton Boggs Aviva


21 Theme 4: Occupiers focusing on flight to quality and flexibility © 2022 Jones Lang LaSalle IP, Inc. All rights reserved. 14-21 Holborn Viaduct, EC1 22 Bishopsgate, EC2 40 Leadenhall Street, EC3 60 London Wall, EC2 80 Fenchurch Street, EC3


© 2022 Jones Lang LaSalle IP, Inc. All rights reserved. 22 Theme 5: Changing market dynamics will impact sentiment in short term • Delayed decision making • Shifting timescales • Tightening development pipeline • Reduced space take Cost of construction Cost of debt • Deferred start on site • Knock on effect on supply ESG • Lack of deliverable schemes • Design / delivery – balancing act • Early engagement from investors and occupiers £

• Increased demand from smaller occupiers with a focus on flexibility
Polarisation

• Increased pressure on return to the office
Return to the office Sector demand
• Changing market dynamics will trigger supply-demand imbalances, fuelling rental growth upside for quality spaces
• Obsolescence will provide plenty of opportunities to review portfolios
© 2022 Jones Lang LaSalle IP, Inc. All rights reserved. 23
Outlook: Three themes for 2023
• Financial services and established tech sector will become more active next year as potential requirements come online
• Hybrid working is here to stay and calls for the rejuvenation of the office
• Spread between prime and secondary rents and yields will widen
• Businesses will prioritise access to high quality spaces as the office remains central to the work ecosystem
Introducing Tiffany Luckett Director, Central LondonSavillsRetail,
Central London Retail Are we at the bottom?
Tiffany Luckett Director - Savills

Central London & International Retail

How has London fared against other Global markets?


London spend has recovered but is lagging other Global
SAVILLS | CENTRAL LONDON OUTLOOK 2022
cities -20%-15%-10%-5%0%5%10%15%20% 25% 2021 Retail sales % differential to 2019 Source: Savills Research, OE (Nominal retail sales in local currency)
retail

lag
(Rent reflective of prime high footfall retail location. Higher sentiment score = incentives and availability significantly higher than pre-Covid levels)) Greater increase in availability % LL Little/incentivesnochangeinavailability%LLincentives
98765432110 -40%-60%-70%-50%-30%-20%-10%0% 10% sentimentincentive&Availabilityrentsinchange% Change in rents Q321 vs Q419 Availability and incentive sentiment (Q321 vs Q419)
Source: Savills Research
SAVILLS | CENTRAL LONDON OUTLOOK 2022
This is reflected in occupational markets
particularly luxury Source: Savills Research, Oxford Economics, Euromonitor, Wealth-X
London’s
SAVILLS | CENTRAL LONDON OUTLOOK 2022 0 10 20 30 40 50 60 70 80 90 100 110 120 130 LosHongSingaporeBeijingSeoulKongParisShanghaiAngelesTokyoLondonNewYork Weighted score Luxury retail: Top 10 Size of retail market International visitor appeal Affluence Growth prospects
But, fundamentals means it remains a key market for international brands,
Global Luxury Retail Trends
2021, a refocus on China
SAVILLS | CENTRAL LONDON OUTLOOK 2022 Source: Savills Research

(new openings excludes relocations, re-openings due to refurbishments and pop-ups)
New store openings by luxury houses Source: Savills Research 41% 33%100%90%80%40%30%20%10%0%50%60%70% 2021 2019 openingsnewofShare LVMH/ Richemont/ Kering Others 0% 10% 20% 30% 40% 50% 60% 70% Other Glasses & opticians Bags & Footwearluggage Jewellery & specilaist watch brands Fashion & accessories Share of new openings 2019 2021 New store openings by category
SAVILLS | CENTRAL LONDON OUTLOOK 2022
big luxury
The groups continued their dominance
Luxury continues to be insulated against macroeconomic headwinds

SAVILLS | CENTRAL LONDON OUTLOOK 2022
SAVILLS | CENTRAL LONDON OUTLOOK 2022 2021 was a big year for M&A and funding activity, this could translate into new store requirements 100246812141618 20 Resale & rental Fashion Jewellery, Watches & Silver Online Footwear Manufacturing Services Other (2021)countDeal Luxury Group/ brand involvement Other funding sources Source: Savills Research, PitchBook Data Inc (Data has not been reviewed by PitchBook analysts)


What parts of the London market leading the recovery?
SAVILLS | CENTRAL LONDON OUTLOOK 2022 Spend in the West End is recovering at a slightly faster pace than footfall -100%-90%-80%-70%-60%-50%-40%-30%-20%-10%0%10%2019toDifference% West End footfall vs 2019 West End sales vs 2019 Heathrow passenger nos vs 2019 London hotel occupancy vs 2019 Source: Savills Research, NWEC (spend data not available during the height of the pandemic, Mar20-Apr21)
SAVILLS | CENTRAL LONDON OUTLOOK 2022
1009080403020506070110120130 2019 2020 2021 2022 2023 2024 2025 2026 (index)passengersairGlobal
Key to the recovery in the West End, is the return of international tourists
Europe International arrivals: leisure 2023
Domestic 2023 recovery to prelevelscovid
Source: IATA, Tourism Economics
EuropearrivalsInternational 2024

International 2025 recovery to pre-covid levels
Domestic International Global air passenger recovery forecast
SAVILLS | CENTRAL LONDON OUTLOOK 2022 The 2023 Rates Revaluation…could not come sooner for retail… - Dramatic recent decrease in rents for retail - Dramatic recent increase in rents for warehouses - 2023 Rates Revaluation is based on April 2021 rental values - Current Government have committed to 3 year revaluation
SAVILLS | CENTRAL LONDON OUTLOOK 2022 Who and what is driving demand? Athleisure D2C brands F&B CosmeticsExperiential Luxury watches Luxury Electric vehicles


SAVILLS | CENTRAL LONDON OUTLOOK 2022
Rents have bottomed out; growth to return in for prime West
End 6070 80 90 100110Q419 Q421 Q422 Q423 Q424 Index Bond Street Mount Street Conduit Street Oxford Street West Regent Street Marylebone High Street Covent Garden (Long Acre) Cheapside Prime headline ZA rent forecast Bond Street -4.2% Q424 vs Q419 Oxford Street -17.6% Q424 vs Q419 Regent Street -12.5% Q424 vs Q419
2023
Introducing
Tom Bill Head of UK Residential Research, Knight Frank


Versus the five-year average (excluding 2020)
PCL sales pipeline robust as supply rises
£5m property Price Decline Jul-14 to Jul22 US$ needed on 2 July 2014 US$ needed on 5 Sept 2022 % Effective discount Knightsbridge 24% $8,583,500 $4,372,280 -49.1% Chelsea 23% $8,583,500 $4,429,810 -48.4% Notting Hill 22% $8,583,500 $4,487,340 -47.7% Bayswater 21% $8,583,500 $4,544,870 -47.1% Fulham 16% $8,583,500 $4,832,520 -43.7% Kensington 16% $8,583,500 $4,832,520 -43.7% Mayfair 12% $8,583,500 $5,062,640 -41.0% Belgravia 11% $8,583,500 $5,120,170 -40.3% Hampstead 10% $8,583,500 $5,177,700 -39.7% Islington 10% $8,583,500 $5,177,700 -39.7% Currency discounts widen as pressure on pound rises
Rental supply remains low
Source: Knight Frank
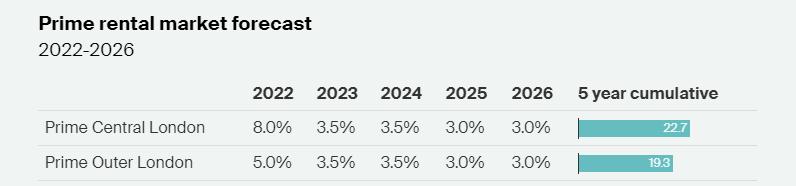
Five Year Forecast

Panel Discussion
WPA Vice Chair and Managing Director, Central London at Landsec
Tiffany Luckett Director, Central LondonSavillsRetail, Tom Bill Head of UK Residential Research, Knight Frank
Marcus Geddes
Adam Cosgrove Senior Director, CBRE Rory Paton Senior CentralDirector,LondonAgency,JLL
Thankyou!