1333 NW 24th Ave Portland, OR 97210
1500 NW Bethany Blvd., #190 Beaverton, OR 97006
Susanne
Raab Premiere Property Group, LLC
Property Profile HOMEBOOK

MultnomahCountyParcelInformation
Parcel#:R171441
TaxLot:1N1E33BB10600
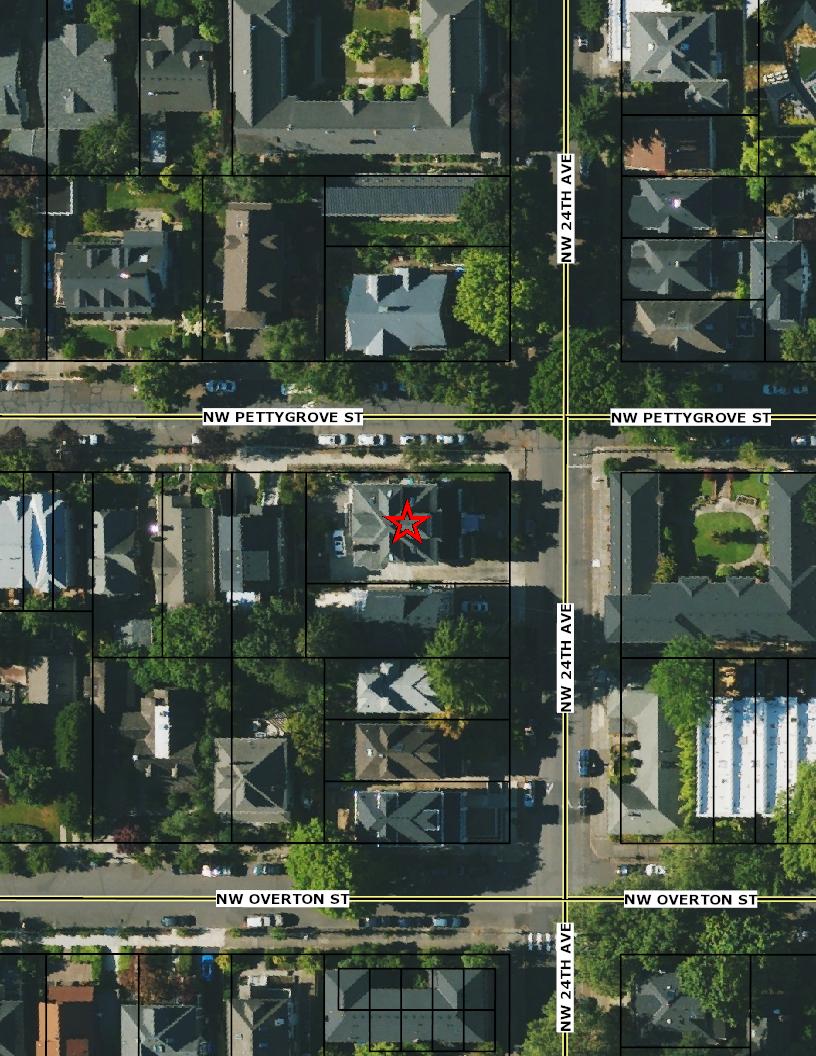
SiteAddress:1333NW24thAve
PortlandOR97210-2603
Owner: 1333NW24thAve
PortlandOR97210-2603
Twn/Range/Section:01N/01E/33/NW
ParcelSize:0.15Acres(6,600SqFt)
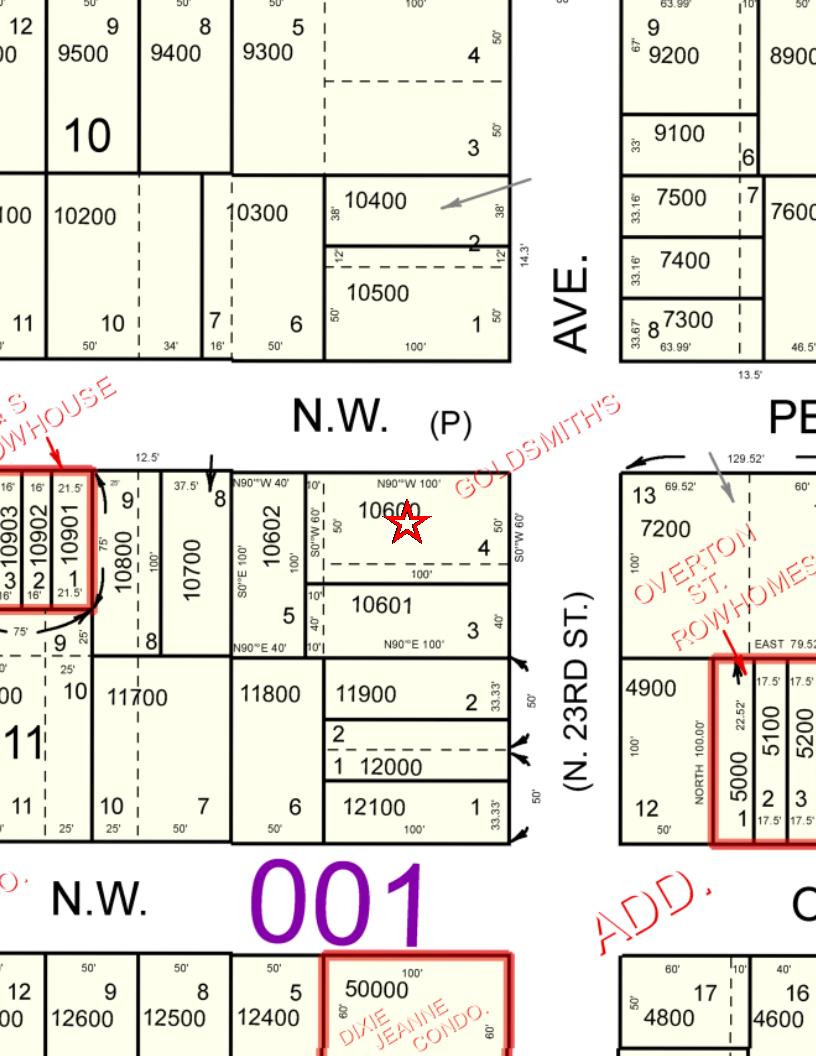
Plat/Subdivision:GoldsmithsAdd
Lot/Block:3/11
MapPage/Grid:596-C4
CensusTract/Block:004700/1018
CntyLandUse:101-Single-Family,Residential,Improved
LandUseStd:RSFR-SingleFamilyResidence
Watershed:ColumbiaSlough-WillametteRiver
Zoning:Portland-RM2-ResidentialMulti-Dwelling2
MarketValueLand: $465,000.00
MarketValueImpr: $1,225,500.00
MarketValueTotal: $1,690,500.00
AssessedValue: $763,990.00(2022)
LevyCodeArea:001
LevyRate:26.6773(2022)
TaxYear:2022
AnnualTax:$20,381.18
Exemption:
GOLDSMITHSADD,BLOCK11,LOT3-5TL10600
CountyBldgUse:B-ResidentialImproved
Recreation:
Neighborhood:NWD-NorthwestDistrict
#Dwellings:

SchoolDistrict:1J-Portland ElementarySchool:CHAPMANELEMENTARY SCHOOL
MiddleSchool:WESTSYLVANMIDDLESCHOOL HighSchool:LINCOLNHIGHSCHOOL
SentryDynamics,Inc.anditscustomersmakenorepresentations,warrantiesorconditions,expressorimplied,astotheaccuracyor completenessofinformationcontainedinthisreport.
YearBuilt:1904 Stories:1 TotalArea:5,918SqFt Bedrooms: Garage: FirstFloor:1,596SqFt Baths, Total:5 Baths, Full/Half:3 / 1 SecondFloor:1,596SqFt RoofCovering:Composition ExteriorWalls: BasementFin/Unfin:0SqFt/1,596SqFt A/C:Yes Heat:ForcedAir AtticFin/Unfin:1,130SqFt/0SqFt Kitchen:1 Porch/Patio:522SqFt/0SqFt Deck: Rec. Date: SalePrice: Doc Num: Doc Type: Owner: Grantor: Orig. Loan Amt: Title Co: FinanceType: Loan Type: Lender:
Information
Information
Information Legal Land Improvement TransferInformation
Parcel
Assessment
Tax
Thismap/platisbeingfurnishedasanaidinlocatingthehereindescribedLandinrelationtoadjoiningstreets,naturalboundariesandotherland,andisnotasurveyofthe landdepicted.Excepttotheextentapolicyoftitleinsuranceisexpresslymodifiedbyendorsement,ifany,theCompanydoesnotinsuredimensions,distances,locationof easements,acreageorothermattersshownthereon.
 Thismap/platisbeingfurnishedasanaidinlocatingthehereindescribedLandinrelationtoadjoiningstreets,naturalboundariesandotherland,andisnotasurveyofthe landdepicted.Excepttotheextentapolicyoftitleinsuranceisexpresslymodifiedbyendorsement,ifany,theCompanydoesnotinsuredimensions,distances,locationof easements,acreageorothermattersshownthereon.
RELATEDPROPERTIES
Split/Merge data prior to February 6, 2018 is not available online, please call Multnomah County Assessment & Taxation division.

Linked Properties -
Property Group ID -
Grouped Properties -
Split / Merge Date -
Split / Merge AccountsSplit / Merge Message -
OWNER
Property Owner Property Address 2022AssessedValue R171441 1333NW24THAVE,PORTLAND,OR97210 $763,990 GENERALINFORMATION Property Status AActive Property Type RPResidential Legal Description GOLDSMITHSADD,BLOCK11,LOT3-5TL 10600
Account
R331301900 Neighborhood
B-RESIDENTIALIMPROVED
Alternate
Number
R492 Map Number 1N1E33BB-10600 Property Use
LevyCodeArea 001
INFORMATION
IMPROVEMENTS ? Expand/Collapse All LANDSEGMENTS LANDNO LANDTYPE LANDSIZE L1 RESRESIDENTIALLAND 6,600Sq.ft TOTALS 6,600Sq.ft/0.15acres ASSESSEDVALUES YEAR IMPROVEMENTS LAND SPECIALMARKET/USE RMV M5VALUE EXEMPTIONS M50ASSESSED 2022 $1,225,500 $465,000 $0 / $0 $1,690,500 $1,690,500 $763,990 2021 $1,288,890 $465,000 $0 / $0 $1,753,890 $1,753,890 $741,740 2020 $1,214,940 $393,500 $0 / $0 $1,608,440 $1,608,440 $720,140 2019 $1,214,940 $393,500 -/ - $1,608,440 $1,608,440 $699,170 2018 $1,278,330 $393,500 -/ - $1,671,830 $1,671,830 $678,810 2017 $1,193,260 $377,000 $0 / $0 $1,570,260 $1,570,260 $659,040 2016 $983,540 $344,000 -/ $0 $1,327,540 $1,327,540 $639,850 2015 $869,130 $316,100 -/ $0 $1,185,230 $1,185,230 $602,960 2014 $462,490 $304,600 $0 / $0 $767,090 $767,090 $411,960 2013 $371,420 $631,300 $0 / $0 $1,002,720 $1,002,720 $571,450 ? Improvement #1 Improvement Type Building Type Class - SINGLEFAMILYRESIDENTIAL 2ORMORESTYW/BSMT 6N
If applicable, the described property is receiving special valuation based upon its use. Additional rollback taxes which may become due based on the provisions of the special valuation are not indicated in this listing.
TAXSUMMARY
? Details

PROPERTYFEES
Eìective Date:
TAXYEAR TOTAL BILLED ADVALOREM SPECIAL ASMT PRINCIPAL INTEREST DATE PAID TOTAL OWED 2022 $20,381.18 $20,381.18 $20,381.18 $0.00 - $0.00 2021 $20,036.23 $20,036.23 $20,036.23 $0.00 - $0.00 2020 $18,379.48 $18,379.48 $18,379.48 $0.00 - $0.00 2019 $17,703.57 $17,703.57 $17,703.57 $0.00 - $0.00 2018 $17,182.88 $17,182.88 $17,182.88 $0.00 - $0.00 2017 $16,468.12 $16,468.12 $16,468.12 $0.00 - $0.00 2016 $15,070.06 $15,070.06 $15,070.06 $0.00 - $0.00 2015 $14,243.19 $14,243.19 $14,243.19 $0.00 - $0.00 2014 $9,872.12 $9,872.12 $9,872.12 $0.00 - $0.00 2013 $13,776.75 $13,776.75 $13,776.75 $0.00 - $0.00 2012 $0.00 $0.00 $0.00 $0.00 - $0.00 2011 $0.00 $0.00 $0.00 $0.00 - $0.00 2010 $0.00 $0.00 $0.00 $0.00 - $0.00 2009 $0.00 $0.00 $0.00 $0.00 - $0.00 2008 $0.00 $0.00 $0.00 $0.00 - $0.00 TOTALTAXESDUE CurrentYearDue $0.00 PastYearsDue $0.00 TotalDue $0.00 PayMyBills
TAXYEAR FEETYPE TOTALBILLED DATEPAID TOTALOWED 2015 BoptaFilingFee $30.00 12-30-2015 $0.00 TAXYEAR RECEIPTNUMBER TRANSACTIONDATE PAYMENTAMOUNT 2022 MULT-1482656 11-15-2022 $19,769.74 2021 MULT-1124292 11-12-2021 $19,435.14 2020 MULT-884256 11-13-2020 $17,828.10 2019 MULT-440447 11-8-2019 $17,172.46 2018 MULT-56782 11-6-2018 $16,667.39 2017 8679166 11-9-2017 $15,974.08 2016 8357370 11-14-2016 $14,617.96 2015 8144840 12-30-2015 $30.00 2015 7983830 11-12-2015 $13,815.89 2014 7697527 11-14-2014 $9,575.96 2013 7176411 10-29-2013 $13,363.45 $0 $0 $0 $0 $0 $0 $0 $0 $0 $0 $0 $0 $0 $0 $0
Neighborhood Information HOMEBOOK ClickhereforWalkScore

Utilities
HOMEBOOK
Please Use/Click on this Digital U lity Link

Most u lity service providers require you to go online, fill out a form and e-mail back, or use their online service.


School Information HOMEBOOK
ClickHereforthe OregonSchoolReportCards

OREGON AT-A-GLANCE SCHOOL PROFILE 2021-22 Chapman Elementary School


PRINCIPAL: Pamela Van Der Wolf | GRADES: K-5 | 1445 NW 26th Ave, Portland 97210 | 503-916-6295
Academic Progress
REGULAR ATTENDERS
Students who attended more than 90% of their enrolled school days.
INDIVIDUAL STUDENT PROGRESS
Year-to-year progress in English language arts and mathematics.
Academic Success
ENGLISH
MATHEMATICS
Students meeting state grade-level expectations.
Data not available in 2021-22
SCIENCE
Students meeting state grade-level expectations.
School Goals
Our focus is on literacy and math fluency, with the aim of refining our instructional strategies and providing all students with the skills they need to be ready to succeed in college and careers. We strive to provide a welcoming environment and equitable opportunities for students of all races, genders, and home languages. We encourage you to contact us with any questions, concerns, or information that will help us ensure success for your students.
State Goals

The Oregon Department of Education is partnering with school districts and local communities to ensure a 90% ontime, four year graduation rate by 2025. To progress toward this goal, the state will prioritize efforts to improve attendance, provide a well-rounded education, invest in implementing culturally responsive practices, and promote continuous improvement to close opportunity and achievement gaps for historically and currently underserved students.
Safe & Welcoming Environment
We work hard to make our school a place where all students and families feel welcome and included. We celebrate our community’s diversity and we honor this diversity in our learning activities. We understand how important it is to keep our students feeling safe, both physically and emotionally, when they are with us.
Students We Serve Student Enrollment 341 DEMOGRAPHICS American Indian/Alaska Native Students 1% Teachers 0% Asian Students 3% Teachers 0% Black/African American Students 9% Teachers 4% Hispanic/Latino Students 16% Teachers 7% Multiracial Students 15% Teachers 4% Native Hawaiian/Pacific Islander Students <1% Teachers 0% White Students 57% Teachers 86% Ever English Learners 7% Languages Spoken 12 Students with Disabilities 12% Required Childhood Vaccinations 92% Free/ Reduced Price Lunch >95% *<10 students or data unavailable
Environment CLASS SIZE Median class size. 21 Oregon average 22
School
64% Oregon average
64%
state grade-level expectations. 55% Oregon average 44%
LANGUAGE ARTS Students meeting
45% Oregon
36%
average
50% Oregon
average 31%
School Website: www.pps.net/schools/chapman Eligibility for Free/Reduced Price Lunch expanded in 2020-21, for more information please visit: www.oregon.gov/ode/schools-and-districts/reportcards/reportcards/Pages/Accountability-Measures.aspx
Outcomes

REGULAR ATTENDERS

ENGLISH LANGUAGE ARTS
MATHEMATICS

About Our School BULLYING, HARASSMENT, AND SAFETY POLICIES

Portland Public Schools has created policies to help our schools provide safe environments for every student. This includes teaching students and staff about bullying and harassment, and providing methods to report and respond to any of these incidents. We have a PPS threat assessment team to help address reports of safety concerns. We also support the district-wide implementation of Positive Behavioral Interventions and Supports (PBIS), and Restorative Justice practices through our Multi-tiered System of Supports (MTSS) department.

EXTRACURRICULAR ACTIVITIES
Our school offers a variety of extracurricular activities. Check our website for details about specific activities.

PARENT ENGAGEMENT
Our school offers several meetings each year where we invite families to attend. The meetings are to discover what your children are learning at school, to see examples of their good work, and to learn ways that you can help them succeed at school. We will inform you of these school events and celebrations through our newsletters and other media. Please check our website for details about these events.
COMMUNITY ENGAGEMENT
We appreciate our community neighbors and want them to feel welcome to join us in supporting the success of our students. Please contact us if you and your community organization are interested in providing support, and we will be happy to talk with you about options.
Staff (rounded FTE)
Teachers
Educational assistants 1 Counselors/ Psychologists Average teacher retention rate
% of licensed teachers with more than 3 years of experience
principal in
OREGON AT-A-GLANCE SCHOOL PROFILE CONTINUED 2021-22 Chapman Elementary School Our
22
3
88%
87% Same
the last 3 years Yes
American Indian/Alaska Native <10 students or data unavailable Asian 90% Black/African American 36% Hispanic/Latino 58% Multiracial 76% Native Hawaiian/Pacific Islander <10 students or data unavailable White 67% Free/Reduced Price Lunch 64% Ever English Learner 83% Students with Disabilities 70% Migrant <10 students or data unavailable Homeless <10 students or data unavailable Students in Foster Care <10 students or data unavailable Talented and Gifted 83% Female 66% Male 63% Non-Binary <10 students or data unavailable
<10 students or data unavailable <10 students or data unavailable <10 students or data unavailable 36% 65% <10 students or data unavailable 63% 55% <5% 41% <10 students or data unavailable <10 students or data unavailable <10 students or data unavailable 84% 51% 60% <10 students or data unavailable
<10 students or data unavailable <10 students or data unavailable <10 students or data unavailable 20% 60% <10 students or data unavailable 51% 45% 10% 18% <10 students or data unavailable <10 students or data unavailable <10 students or data unavailable 84% 37% 54% <10 students or data unavailable
Data are suppressed to protect confidential student information. For more information please visit:
www.oregon.gov/ode/schools-and-districts/reportcards/reportcards/Pages/Accountability-Measures.aspx
OREGON AT-A-GLANCE SCHOOL PROFILE
West Sylvan Middle School
PRINCIPAL: Jill Hunt | GRADES: 6-8 | 8111 SW West Slope Dr, Portland 97225 | 503-916-5690
REGULAR ATTENDERS
Students who attended more than 90% of their enrolled school days.
2021-22
Academic Progress
INDIVIDUAL STUDENT PROGRESS
Year-to-year progress in English language arts and mathematics.
Academic Success
ENGLISH
MATHEMATICS
Students meeting state grade-level expectations. 60% Oregon average 28%
School Goals
Our focus is on literacy and math fluency, with the aim of refining our instructional strategies and providing all students with the skills they need to be ready to succeed in college and careers. We strive to provide a welcoming environment and equitable opportunities for students of all races, genders, and home languages. We encourage you to contact us with any questions, concerns, or information that will help us ensure success for your students.
State Goals
The Oregon Department of Education is partnering with school districts and local communities to ensure a 90% ontime, four year graduation rate by 2025. To progress toward this goal, the state will prioritize efforts to improve attendance, provide a well-rounded education, invest in implementing culturally responsive practices, and promote continuous improvement to close opportunity and achievement gaps for historically and currently underserved students.
Data not available in 2021-22
SCIENCE
Students meeting state grade-level expectations. 45% Oregon average 28%
Safe & Welcoming Environment
We work hard to make our school a place where all students and families feel welcome and included. We celebrate our community’s diversity and we honor this diversity in our learning activities. We understand how important it is to keep our students feeling safe, both physically and emotionally, when they are with us.
Students We Serve Student Enrollment
DEMOGRAPHICS American Indian/Alaska Native Students 1% Teachers 0% Asian Students 9% Teachers 5% Black/African American Students 4% Teachers 0% Hispanic/Latino Students 11% Teachers 3% Multiracial Students 13% Teachers 7% Native Hawaiian/Pacific Islander Students <1% Teachers 0% White Students 62% Teachers 85% Ever English Learners 6% Languages Spoken 22 Students with Disabilities 11%
Childhood Vaccinations
Free/
Price Lunch
*<10 students or data unavailable
Environment CLASS SIZE Median class size. 26 Oregon average 22
728
Required
94%
Reduced
>95%
School
Oregon average
76%
64%
state grade-level expectations. 71% Oregon average 44%
LANGUAGE ARTS Students meeting
School Website: www.pps.net/schools/east-west-sylvan Eligibility for Free/Reduced Price Lunch expanded in 2020-21, for more information please visit: www.oregon.gov/ode/schools-and-districts/reportcards/reportcards/Pages/Accountability-Measures.aspx
Our
OREGON AT-A-GLANCE SCHOOL PROFILE CONTINUED 2021-22
West Sylvan Middle School
Outcomes
REGULAR ATTENDERS
ENGLISH LANGUAGE ARTS
90%
About Our School BULLYING, HARASSMENT, AND SAFETY POLICIES
Portland Public Schools has created policies to help our schools provide safe environments for every student. This includes teaching students and staff about bullying and harassment, and providing methods to report and respond to any of these incidents. We have a PPS threat assessment team to help address reports of safety concerns. We also support the district-wide implementation of Positive Behavioral Interventions and Supports (PBIS), and Restorative Justice practices through our Multi-tiered System of Supports (MTSS) department.
EXTRACURRICULAR ACTIVITIES
Our school offers a variety of extracurricular activities. Check our website for details about specific activities.
PARENT ENGAGEMENT
Our school offers several meetings each year where we invite families to attend. The meetings are to discover what your children are learning at school, to see examples of their good work, and to learn ways that you can help them succeed at school. We will inform you of these school events and celebrations through our newsletters and other media. Please check our website for details about these events.
COMMUNITY ENGAGEMENT
We appreciate our community neighbors and want them to feel welcome to join us in supporting the success of our students. Please contact us if you and your community organization are interested in providing support, and we will be happy to talk with you about options.
Staff
FTE)
Teachers
Educational assistants
Counselors/ Psychologists Average teacher retention rate
% of licensed teachers
more than
(rounded
47
5
3
with
3 years of experience 80% Same principal in the last 3 years No
American Indian/Alaska Native <10 students or data unavailable Asian 93% Black/African American 65% Hispanic/Latino 68% Multiracial 75% Native Hawaiian/Pacific Islander <10 students or data unavailable White 76% Free/Reduced Price Lunch 76% Ever English Learner 91% Students with Disabilities 53% Migrant <10 students or data unavailable Homeless <10 students or data unavailable Students in Foster Care <10 students or data unavailable Talented and Gifted 84% Female 76% Male 76% Non-Binary <10 students or data unavailable
<10 students or data unavailable 83% 46% 49% 74% <10 students or data unavailable 75% 71% 56% 30% <10 students or data unavailable <10 students or data unavailable <10 students or data unavailable 92% 81% 62% <10 students or data unavailable MATHEMATICS <10 students or data unavailable 83% 17% 34% 62% <10 students or data unavailable 64% 60% 54% 22% <10 students or data unavailable <10 students or data unavailable <10 students or data unavailable 91% 61% 58% <10 students or data unavailable
Data are suppressed to protect confidential student information. For more information please visit: www.oregon.gov/ode/schools-and-districts/reportcards/reportcards/Pages/Accountability-Measures.aspx
1,450
OREGON AT-A-GLANCE SCHOOL PROFILE
Lincoln High School
PRINCIPAL: Peyton Chapman | GRADES: 9-12 | 1750 SW Salmon St., Portland 97205 | 503-916-5200
REGULAR ATTENDERS
Students who attended more than 90% of their enrolled school days.
2021-22
Academic Progress ON-TRACK
Students earning one-quarter of graduation credits in their 9th grade year.
Academic Success ON-TIME
Students earning a diploma within four years. Cohort includes students who were first-time ninth graders in 2017-18 graduating in 2020-21
FIVE-YEAR COMPLETION
Students earning a high school diploma or GED within five years. Cohort Includes students who were firsttime ninth graders in 2016-17 finishing in 2020-21
COLLEGE GOING
Students enrolling in a two or four year college within 16 months of completing high school in 201920. Data from the National Student Clearinghouse.
School Goals
Our focus is on literacy and math fluency, with the aim of refining our instructional strategies and providing all students with the skills they need to be ready to succeed in college and careers. We strive to provide a welcoming environment and equitable opportunities for students of all races, genders, and home languages. We encourage you to contact us with any questions, concerns, or information that will help us ensure success for your students.
98% Oregon average 88%
State Goals
The Oregon Department of Education is partnering with school districts and local communities to ensure a 90% ontime, four year graduation rate by 2025. To progress toward this goal, the state will prioritize efforts to improve attendance, provide a well-rounded education, invest in implementing culturally responsive practices, and promote continuous improvement to close opportunity and achievement gaps for historically and currently underserved students.
86% Oregon average 56%
Safe & Welcoming Environment
We work hard to make our school a place where all students and families feel welcome and included. We celebrate our community’s diversity and we honor this diversity in our learning activities. We understand how important it is to keep our students feeling safe, both physically and emotionally, when they are with us.
Serve Student Enrollment
Students We
DEMOGRAPHICS American Indian/Alaska Native Students <1% Teachers 0% Asian Students 9% Teachers 4% Black/African American Students 2% Teachers 0% Hispanic/Latino Students 12% Teachers 8% Multiracial Students 12% Teachers 2% Native Hawaiian/Pacific Islander Students <1% Teachers 0% White Students 65% Teachers 86% Ever English Learners
31
6%
95% Free/
Price Lunch >95% *<10 students or data unavailable
6% Languages Spoken
Students with Disabilities
Required Childhood Vaccinations
Reduced
CLASS SIZE
School Environment
26.5 Oregon average 22
Median size of classes in core subjects.
68% Oregon average 64%
GRADUATE
TO
Oregon average 83%
>95%
GRADUATION
96% Oregon average 81%
School Website: www.pps.net/schools/lincoln Eligibility for Free/Reduced Price Lunch expanded in 2020-21, for more information please visit: www.oregon.gov/ode/schools-and-districts/reportcards/reportcards/Pages/Accountability-Measures.aspx
About Our School
ADVANCED COURSEWORK
Most high schools in Portland Public Schools offer Advanced Placement or International Baccalaureate courses in several subject areas. In addition, students have the option to earn college credit for some classes.
ON-TRACK TO
Coming in 2022-23
CAREER & TECHNICAL EDUCATION
District-wide we have 60 state-approved CTE programs of study. Career clusters include Architecture and Construction, Health Services, Information Technology, Manufacturing, and others. As part of these programs, we facilitate career learning experiences for students such as guest speakers, field trips, job shadows, etc. Visit our CTE web page for additional information: https://www.pps.net/Domain/190
EXTRACURRICULAR ACTIVITIES
Our school offers a variety of extracurricular activities. Check our website for details about specific activities.
PARENT & COMMUNITY ENGAGEMENT
Our school offers several meetings each year where we invite families to attend. The meetings are to discover what your children are learning at school, to see examples of their good work, and to learn ways that you can help them succeed at school. We will inform you of these school events and celebrations through our newsletters and other media. Please check our website for details about these events. We appreciate our community neighbors and want them to feel welcome to join us in supporting the success of our students.
Our Staff (rounded FTE) 73 Teachers 2 Educational assistants 6 Counselors/ Psychologists Average teacher retention rate 90% % of licensed teachers with more than 3 years of experience
Same principal in the last 3 years
Outcomes REGULAR ATTENDERS American Indian/Alaska Native <10 students or data unavailable Asian 81% Black/African American 50% Hispanic/Latino 61% Multiracial 63% Native Hawaiian/Pacific Islander <10 students or data unavailable White 69% Free/Reduced Price Lunch 68% Ever English Learner 68% Students with Disabilities 60% Migrant <10 students or data unavailable Homeless <10 students or data unavailable Students in Foster Care <10 students or data unavailable Talented and Gifted 76% Female 65% Male 72% Non-Binary 47%
OREGON AT-A-GLANCE SCHOOL PROFILE CONTINUED 2021-22 Lincoln High School
91%
Yes
GRADUATE <10 students or data unavailable >95% <10 students or data unavailable 95% >95% <10 students or data unavailable >95% >95% 89% 92% <10 students or data unavailable <10 students or data unavailable <10 students or data unavailable >95% >95% >95% <10 students or data unavailable ON-TIME GRADUATION <10 students or data unavailable >95% <10 students or data unavailable 86% >95% <10 students or data unavailable >95% 80% 77% 86% <10 students or data unavailable <10 students or data unavailable <10 students or data unavailable >95% >95% 93%
Data are suppressed to protect confidential student information. For more information please visit:
www.oregon.gov/ode/schools-and-districts/reportcards/reportcards/Pages/Accountability-Measures.aspx
School Information
Centennial
North
David
Gresham
Banks 503 . 324 . 8591 | www.banks.k12.or.us Beaverton 503 672 3721 | www.beaverton.k12.or.us
503 266 7861 | boundaries: 503 266 2064 | www.canby.k12.or.us
Canby
503 760 7990 | www.centennial.k12.or.us
Clackamas 503 . 653 . 6000 | boundaries: 503 . 353 . 6119 | www.nclack.k12.or.us
503 824 3535 | boundaries: 503 824 3534 | www.colton.k12.or.us
Colton
Douglas 503 . 252 . 7990 | www.centennial.k12.or.us
503 . 630 . 6871 | www.esd108.k12.or.us
Grove 503 357 6171 | boundaries: 503 359 8167 x 221 | www.fgsd.k12.or.us
503 . 655 . 2777 | www.gladstone.k12.or.us
Estacada
Forest
Gladstone
/ Barlow 503 . 618 . 2450 | www.gresham.k12.or.us Hillsboro 503 844 1500 | boundaries: 503 648 9123 | www.hsd.k12.or.us
Oswego 503 . 534 . 2000 | boundaries: 503 . 534 . 2490 | www.loswego.k12.or.us
Lake
School Information
McMinnville 503 565 4000 | www.msd.k12.or.us Molalla River 503 . 829 . 2359 | boundaries: 503 . 829 . 2512 | www.molallariv.k12.or.us Newberg 503 554 5000 | boundaries: 503 538 8365 | www.newberg.k12.or.us Oregon City 503 657 4283 | boundaries: 503 657 2471 | www.orecity.k12.or.us Oregon Trail 503 668 5541 | www.oregonrailschools.k12.or.us Parkrose 503 408 2100 | www.parkrose.k12.or.us Portland 503 916 2000 | boundaries: 503 916 3262 | www.pps.k12.or.us Reynolds 503 . 661 . 7200 | boundaries: 503 . 492 . 4921 | www.reynolds.k12.or.us Sherwood 503 625 8100 | boundaries: 503 625 8107 | www.sherwood.k12.or.us Tigard / Tualatin 503 431 4000 | www.ttsd.k12.or.us West Linn / Wilsonville 503 . 673 . 7000 | boundaries: 503 . 673 . 7034 | www.wlwv.k12.or.us Woodburn 503 . 981 . 9555 | www.woodburn.k12.or.us
County G School Type Tuition Range A(%) E(#)C(#)M(#) U Washington County (OR) 1. Agia Sophia Academy PK-5 Montessori $6,600–8,300 95 30 12 Yes 2. Catlin Gabel School PK-12 College Prep $27,190–34,100 26 776 17 61 No 4. Forest Hills Lutheran Christian School PK-8 Lutheran $6,531–6,875 98 197 18 No 5. German International School PK-5 Language Immersion, INTL Baccalaureate $15,110–15,275 98 144 12 10 No 6. Holy Trinity Catholic School PK-8 Catholic $6,600–8,400 285 30 Yes 7. Horizon Christian School PK-12 College Prep $4,650–11,975 95 411 14 24 No 8 Islamic School of MET PK-12 Muslim College Prep $7,750–8,250 90 206 16 5 Yes 9. Jesuit High School 9-12 College Prep $15,475 71 1274 23 86 No 11. Living Wisdom School PK-8 Education for Life $7,200–9,100 95 38 12 No 12. Montessori School of Beaverton PK-6 Montessori $11,400–12,000 80 120 1010 No 13. Northwest Chinese Academy PK-5 Language Immersion $17,250–19,525 96 33 77 Yes 14. Oregon Episcopal School PK-12 College Prep $28,900–35,000 43 858 16 72 Yes 15. Pilgrim Lutheran Christian School PK-8 Christian $6,850–8,295 12512 5 Yes 16. St. Matthew Catholic School PK-8 Catholic $6,850–8,600 99 184 21 16 Yes 17. St. Pius X Grade School K-8 Catholic $7,240–9,430 85 492 3029 Yes 18. St. Stephen‘s Academy PK-12 Classical Christian $5,160–10,620 96 256 1610 Yes 19. Tualatin Valley Academy PK-12 Christian $4,980–9,108 99 175 20 8 No Grade Range Acceptance Rate A 2014-2015 Enrollment E G
School Information
School Information County G School Type Tuition Range A(%) E(#)C(#) M(#) U Washington County (OR) 20. Valley Catholic Elementary School K-5 Catholic $8,520 337 13 Yes 21. Valley Catholic Middle School 6-8 College Prep $11,610 252 24 Yes 22. Valley Catholic High School 9-12 College Prep $14,685 370 28 No 23. Visitation Catholic School PK-8 Catholic $4,793–5,868 98 165 20 8 Yes Multnomah County (OR) 1. A Renaissance School of Arts and Sciences K-8 Progressive $14,440 90 115 8 9 No 2. Central Catholic High School 9-12 College Prep, Catholic $15,378–19,000 98 850 21 52 No 3. Childpeace Montessori School, Metro Middle School PK-8 Montessori $11,600–17,300 6 254 26 10 No 4. Columbia Christian School PK-12 Christian, College Prep $4,000–8,000 95 250 20 18 No 5. Edison High School 9-12 Learning Differences $24,650 50 102 9 14 No 6. French American International School PK-8 Language Immersion $18,296–21,113 79 451 16 48 No 7. Grace Lutheran School PK-8 Lutheran $2,825–6,695 95 88 22 1 No 8. Holy Redeemer Catholic School PK-8 Catholic $5,450–7,775 95 304 27 11 Yes 9. Northwest Academy 6-12 College Prep $22,900–24,400 75 240 15 26 No 10. Open Door Christian Academy PK-12 Christian $2,210–3,940 50 285 25 5 No 11. Pacific Crest Community School 6-12 College Prep $14,250 70 95 12 9 No Average Class Size C Required clothing or Uniforms? U Faculty with Master’s Degrees M
Grade Range Acceptance Rate A 2018-2019 Enrollment E G County G School Type Tuition Range A(%) E(#)C(#)M(#) U Multnomah County (OR) 12. Portland Christian Schools PK-12 College Prep $7,400–11,335 94 547 42 30 No 13. Portland Jewish Academy PK-8 Jewish $19,415–20,035 60 18818 No 14. St. Agatha Catholic School PK-8 Catholic $6,350–7,930 60 18818 No 15. St. Clare School K-8 Catholic $6,600–8,400 100 20726 Yes 16. St. John Fisher School K-8 Catholic $7,160–9,335 89 200 24 17 Yes 17. St. Mary’s Academy 9 - 12 College Prep $15,995 97 680 21 46 No 18. St. Rose School PK-8 Catholic $6,190–7,840 94 224 25 12 Yes 19. Sunstone Montessori School PK-6 Montessori $11,900–12,800 90 172 26 14 No 20. The International School PK-5 Language Immersion $19,040–19,640 87387 14 24 No 21. The Madeleine School K-8 Catholic $6,065–7,750 95 264 30 11 Yes 22. The Portland Montessori School PK-6 Montessori $10,725–11,600 80 151 24 7 No 23. Trinity Lutheran Christian School K-8 Lutheran $7,300 1005210 24. Tucker Maxon School PK-5 Independent $8,200–17,000 91 45 1212 No 25. Venn Academy K-8 Relationship BasedLearning $11,000 50-60 18 9 26. West Hills Christian School K-8 Christian $5,800–8,875 90 308 18 11 No 27 West Hills Montessori PK-6 Montessori $11,495–12,255 80 125 25 15 No
School Information
School Information Average Class Size C Required clothing or Uniforms? U Faculty with Master’s Degrees M County G School Type Tuition Range A(%) E(#)C(#)M(#) U Clackamas County (OR) 1. Arbor School of Arts and Sciences K-8 Progressive $14,400 29 189 21 24 No 2. Christa McAuliffe Academy School of Arts and Sciences K-12 College Prep $3,995–8,795 100 380 10 12 No 3. La Salle Catholic College Prep 9-12 College Prep $14,750 85 703 19 45 No 4 Micha-el School PK-8 Waldorf $6,370–8,340 95 110 18 9 No 5. North Clackamas Christian School PK-12 Christian $6,353–7,860 95 263 1815 No 6. Park Academy 3-12 Learning differences $21,000 96 10 7. Portland Waldorf School PK-12 Waldorf $11,275–19,595 325 20 8. Spring Mountain Christian Academy K-12 Christian $3,460$4,440 90 165 12 4 No 9. St. John the Apostle Catholic School PK-8 Catholic $6,499 98 190 18 9 Yes 10. The Marylhurst School PK-8 Progressive $11,000 80 85 18 7 No Clark County (WA) 1. Cascadia School 1 - 6 Montessori $9,960–10,440 90 98 22 3 No 2. Cedar Tree Classical Christian School K - 12 College Prep $6,600–6,960 75 213 16 8 Yes 3. The Gardner School of Arts & Sciences PK - 8 Independent $16,950–18,550 37 10 4 Our Lady Of Lourdes Catholic School PK-8 Catholic $7,034–8,975 98 232 22 10 Yes


