Phoenix Children’s Quality Day 2023
The purpose of Phoenix Children’s annual Quality Day is to further its mission of providing hope, healing and the best health care for children and their families. Quality Day strives to engage institutional leaders in quality improvement projects, foster new ideas for the future, increase staff participation in quality initiatives and provide a venue for sharing outcomes.
This annual competition provides a platform to celebrate quality improvement successes and learn about new creative project ideas. It is a time to interact with staff, residents and fellows, staff physicians, nurses and allied health professionals, and learn about completed/ongoing or new projects across the Phoenix Children’s health system and care network.
Our community is well‑positioned to identify potential areas for improvement in patient safety, patient satisfaction and efficiency – and recognize possible solutions. To encourage this critical work, this year Phoenix Children’s added a new requirement data!
As our health system evolves, so does the quality of our improvement work. There were an incredible amount of impressive submissions for Quality Day this year, that our judges were unable to rank prize levels, so all winners will receive a prize of $500.
Join Us For The Awards Ceremony And Q&A
The Quality Day Awards Ceremony will be online and in person on May 16, 2023, from 12 to 1 p.m. The in-person event will take place at the Phoenix Children’s conference center in rooms 101-104. If you are unable to join in person, you can join the ceremony online.
Zoom Link: PhoenixChildrensHospital.zoom.us/j/99338669837?pwd=ZmdBUmt5Wjl0VkVjY2lxd1NKSGQyQT09
Passcode: 825065
The Awards Ceremony will feature a brief message from Dr. Kelly Kelleher, Chief Quality and Safety Officer at Phoenix Children’s, and a short presentation from each finalist followed by a Q&A session.
Review All Abstracts Now
This guide showcases a number of this year’s record - breaking 100 submitted abstracts, including updates from last year’s 1st place winners for Completed/Ongoing and High-Value/New Idea Abstracts, 2023 finalists, honorable mentions and accepted abstracts.
To determine the winners, all the abstracts were reviewed by a panel of selected judges, across five factors:
• The potential impact on patient outcomes and education
• Feasibility and scalability
• Association with institutional goals
• Alignment with high value care
• Data Component
We hope you will join us in congratulating and recognizing this year’s Quality Day participants.
Special Quality Day Grand Rounds
“The Critical Role of Quality Improvement in Improved Clinical Outcomes: Two Real-life Examples at Phoenix Children’s Making a Big Impact.”
Rob Gonsalves, DO
Phoenix Children’s Endocrinologist
Wendy Arafiles, MD
Phoenix Children’s Hospitalist
Improving the Percent of Patients Seen by a Diabetes Educator Utilizing Upgraded Staff
Training, Telemedicine-Capable Devices, and a PowerBI Dashboard
AUTHORS
Primary: Chirag Kapadia, MD
Author(s)/Affiliations: Lily Sandblom, MS3; Melissa Chambers, DO; Francine Hoekstra, RN, CDCES; Lea Ann Holzmeister, RD, CDCES; Vinay Vaidya, MD; Pierina Ortiz, MS; Stewart Goldman, MD; Rob Gonsalves, DO
BACKGROUND
We have a practice of about 2,000 patients with type 1 diabetes (T1D) at Phoenix Children’s. Previous quality improvement projects within our division have shown that increasing patient education improves care. Certified Diabetes Care and Education Specialists (CDCES) are the backbone of our program and provide medical nutrition therapy (MNT) as well as direct education pertaining to the growing number of medications, devices, and strategies for improving care. Their crucial role is further exemplified by American Diabetes Association (ADA) recommendations that patients be seen by a CDCES at least one a year. CDCES visits are also factored into our division-specific Patient Safety and Quality (PSQ) metrics and our contract with the state’s Medicaid program. Given their importance across the spectrum of patient care and clinic metrics, we have focused efforts on increasing CDCES patient visits over the past few years. Prior efforts have increased annual CDCES visits from 54% in 2017 to 78% in 2020, and we aimed to further increase that number for 2022.
SPECIFIC AIM
To increase the percentage of T1D patients receiving an annual CDCES visit from 78% in 2020 to greater than 90% by the end of 2022. Our secondary aim was continued improvement of practice median hemoglobin A1c (HbA1c)
INTERVENTION
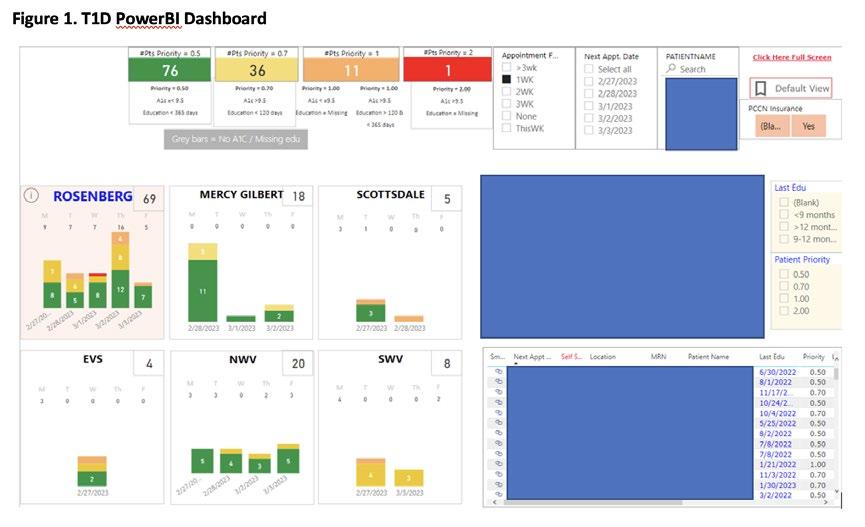
Multiple interventions were employed toward these aims. We upgraded the training of all our clinic Registered Dieticians to become full CDCESs in 2021. Early morning and evening coverage was lacking in the past, so we adjusted CDCES schedules to four 10-hour days to better accommodate these times. Building on our progress from last year’s QI project, we continued to encourage daily huddles with our providers and CDCESs, with the goal of having at least half the patients seen by both a provider and CDCES at the same visit. We also implemented telemedicine-capable devices in clinic rooms across our six satellite locations to further increase coverage and availability. Finally, a PowerBI dashboard was created to help track and coordinate these efforts. The dashboard identified patients requiring education and organized efforts via a color-coded system that categorized patient needs and location (Figure 1).
OUTCOME MEASURE
Percent of patients getting a formal CDCES appointment in the calendar year of 2022.
PROCESS MEASURE
Monthly percent of patients seeing both a provider and a CDCES.
METRICS
We chose percent of patients getting a formal CDCES appointment in the calendar year as our outcome measure as it directly related to our primary aim and ADA recommendations. The process measure of monthly percent of patients seeing both a provider and CDCES helped us gauge whether the multiple efforts above were truly resulting in increased visits throughout the year (Figure 2).
RESULTS
90% of patients received diabetes education via a formal CDCES visit in 2021. In the last quarter of 2022, about 2/3 of patients who saw a provider also saw a CDCES. Clinic median A1c decreased by 0.8% from 2017 to 2022, and by another 0.4% over 2022 to a median of 8.1%.
1st Place:
High-Value/New
Idea 2022 Winner Update
IMPACT
We were able to significantly increase the percentage of patients receiving formal annual diabetes education. Providing additional training, adjusting schedules, and implementing increased telemedicine capabilities allowed us to achieve this without needing to increase staffing ratios. A PowerBI dashboard was invaluable when it came to tracking the needs of our large patient population across different satellite locations. The dashboard will also help sustain these improvement efforts. Clinic A1c continued to improve as we increased education. While there is no doubt that improvements in diabetes technology (continuous glucometer and pump advancements) over the past several years have also contributed to improvements in care and A1c, our CDCES team is vital when it comes to initiating and optimizing this technology for our patients. In addition to continuing to increase CDCES visits and improve A1c, future efforts will be aimed at identifying and overcoming barriers to technology use within our patient population.

Improving Discharge Processes for Children with Medical Complexity: Post-Implementation Study
AUTHORS
Primary: Wendy Arafiles, MD
Author(s)/Affiliations: Edith Allen, MD; Matt Zayatz
BACKGROUND
As the population of children with medical complexity (CMC) at Phoenix Children’s (PC) continues to grow, it becomes increasingly important to streamline concurrent inpatient care and care transitions. Coordinating discharges of CMC is time consuming and requires more attention to detail.1,2 CMC care is fragmented, resulting in higher resource utilization.3,4 An earlier study of the CMC population at PC revealed an average of 2-3 inpatient admissions per patient per year, high average length of stay (ALOS), throughput inefficiencies, high readmission rates, and unfavorable patient, family, and provider experiences.5 To address these concerns, a number of pilot interventions were implemented in 2022 on care area 6 west (CA6W). A quality improvement project, “Discharge Process Improvements for Children with Medical Complexity”5, was designed with the overall goal of improving communication, patient safety, patient throughput, resource utilization, and caregiver experiences through enhanced continuity of care.
SPECIFIC AIM
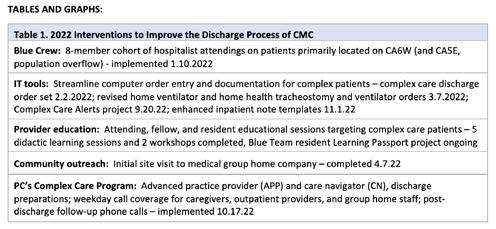
Table 1 details interventions implemented to achieve the following aims:
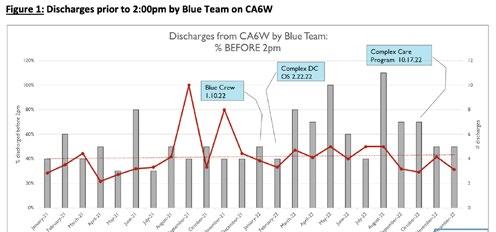
1. Within 6 months of Blue Crew implementation (1.10.22), the average percent of Blue Team discharges from CA6W before 2:00pm will increase by 10% from a baseline of 41%.
2. Within 3 months of tool availability, at least 50% of complex care patients discharged from CA6W will have a compilation of accurate and contemporary key descriptive information in a central location within the electronic health record that is accessible to all providers, staff, and authorized caregivers, as well as a copy of this summary in hand.
3. Within 3 months of Complex Care Program (CCP) implementation, all Complex Care patients discharged from CA6W will receive a follow-up phone call from an advanced practice provider or physician within 72 hours of discharge (90% attempt, 75% connect, sustain for 2-year pilot).
4. Within 12 months of Complex Care Program implementation, the inpatient ALOS for Complex Care patients on CA6W will be decreased by 6 hours without a concurrent increase in 30-day all-cause readmission rate.
INTERVENTIONS/METHODS
A Medical Director of Complex Care (0.25FTE) was appointed to design strategies and guide interventions to achieve the goal of improvement for CMC care. Interventions implemented in 2022 are outlined in Table 1. Outcome, process, and balancing measures were followed with the help of the hospital’s decision support team.
METRICS (MEASURE AND ANALYZE)
Outcome Measures
• [AIM 4] Complex Care patients on CA6W ALOS: Baseline 13 days in Oct 2019-2021 for 91 patients, 11 days for 99 patients in 2022 = 15% decrease (Complex Care Dashboard data)
• [AIM 1] % of Blue Team discharges from CA6W completed before 2:00pm (Figure 1): Baseline 39% in 2021, 41% in January through June 2022, 42% July through December 2022 for CA6W and Care Area 5E (CA5E)* = 6% increase (One Call Discharge Dashboard)
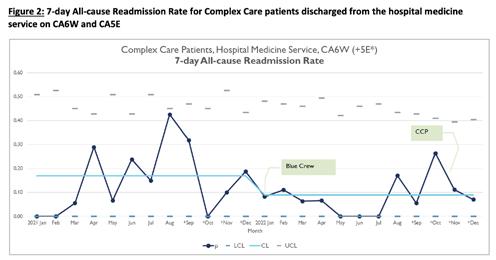
• [new measure] 7-day all-cause readmission rate for Complex Care patients on CA6W and CA5E* (Figure 2): Baseline median 17% in 2021, median 9% in 2022 = 47% decrease (Complex Care Analysis, M. Zayatz) Process Measures
• [AIM 2] % of discharged patients provided with updated Complex Care Patient Summary: tabled, tool not yet available
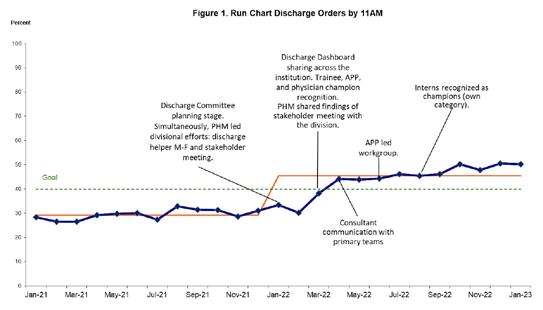
• [AIM 1] % of discharged patients from CA6W with discharge order placed by 11:00am*: Baseline average 30% in 2021, 39% in 2022 = 30% increase (Care Area metrics, M. Zayatz)
• [AIM 3] CCP post-discharge follow-up phone calls, October through December 2022: 100% attempt, 73% connect, 35% of completed calls resulted in action by APP – prescriptions, orders, care advice (CCP logs) Balancing Measures
• CMI for CA6W: Baseline 3.3 in Oct 2019-2021 for 91 patients, 2.98 2022 for 99 patients = 9% decrease (Complex Care Dashboard)
1st Place:
High-Value/New Idea 2022 Winner Update
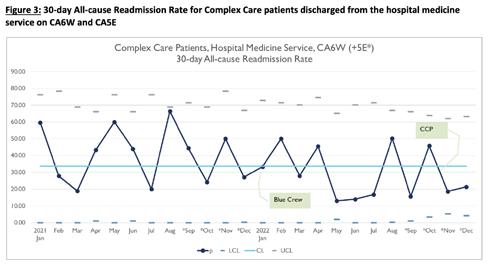
• [AIM 4] 30-day all-cause readmission rate for Complex Care patients on CA6W and CA5E* (Figure 3): Baseline median 33% 2021 and 2022 – (Complex Care Analysis, M. Zayatz)
• [new measure] Blue team coverage rate for hospital medicine patients admitted to CA6W and CA5E*: Baseline of 35% in 2021 and 40% in 2022 (One Call discharge dashboard)
IMPACT/CONCLUSION
Children with medical complexity and technology dependence spend a large proportion of their time in the inpatient environment. In this quality improvement project, improved continuity of inpatient care providers, enhanced discharge coordination, and post-discharge follow-up communication may have contributed to decreased ALOS, improved timeliness of discharges, and decreased 7-day readmission rate. 2022 brought the highest volume of inpatient stays in the last 4 years. Due to this census surge and resultant shifts in admission geography, the included care areas for this improvement project were expanded beyond CA6W to include CA5E. Various measures were adjusted to accommodate appropriate Complex Care patients in both care areas as well as incorporate higher fidelity data [affected measures are denoted by (*) above]. AIM 2 – discharged patients provided with Complex Care Patient Summary – was tabled since the summary tool has not yet been built, but tool design is currently underway with target availability by 3rd quarter 2023. In conclusion, medically complex and technology dependent children benefit from enhanced continuity of care providers and dedicated care coordination in the inpatient environment. The positive trend of measures in this ongoing quality improvement project suggests that a small team of dedicated providers and staff can sustainably provide continuous process improvement. With continued success, this model of care continuity may support expansion to additional inpatient care areas as well as the outpatient environment with respect to transitions of care.
REFERENCES
1. Sobush KT. Principles of Managing Children with Medical Complexity and a New Delivery Model. Mo Med. 2019 MarApr;116(2):134-139. PMID: 31040500; PMCID: PMC6461320.
2. Pordes E, Gordon J, Sanders LM, Cohen E; Models of Care Delivery for Children with Medical Complexity. Pediatrics March 2018; 141 (Supplement_3): S212–S223. 10.1542/peds.2017-1284F
3. Berry, Jay G., et al. “The landscape of medical care for children with medical complexity.” Overland Park, KS: Children’s Hospital Association 7 (2013).
4. JoAnna K. Leyenaar, Emily R. O’Brien, Laurel K. Leslie, Peter K. Lindenauer, Rita M. Mangione-Smith; Families’ Priorities Regarding Hospital-to-Home Transitions for Children with Medical Complexity. Pediatrics January 2017; 139 (1): e20161581. 10.1542/peds.2016-1581
5. Arafiles W, Allen E. Discharge Process Improvements for Children with Medical Complexity. Abstract. 2022 Phoenix Children’s Hospital Quality Day. May 17th, 2022
Discharge Order Entry by 11AM 2023 Quality Day
AUTHORS
Primary: Edith P. Allen, MD
Author(s)/Affiliations: Richard Engel, MD; Robert Yniguez, MD; Neil Friedman, MD; Courtney Howell; Stephanie Conrad, MD; Denice Twitchell; Carey Lewis; Matt Zayatz; Department of Pediatric Hospital Medicine, Department of Pediatric Emergency Medicine, Barrow Neurological Institute at Phoenix Children’s, Department of Pediatric Surgery, Finance Department
BACKGROUND
Discharge order entry is one of the key steps to get patients discharged and was identified as a potential opportunity for improvement at Phoenix Children’s (PC). In 2021, discharge orders at PC were only placed by providers before 11AM 29.5% of the time. Facilitating discharging patients early helps with hospital efficiency and safety as beds are made available for patients waiting in the emergency department (ED) and in the post-anesthesia care unit (PACU).1 The ED is particularly susceptible to backlogs and patient dissatisfaction due to long wait times.2 Timing of discharge order entry is affected by the practitioner’s workload (patient list’s acuity and volume), rounding style (prioritization on who gets seen first), the involvement of trainees (teach teams), and communication with consulting subspecialities.3,4
SPECIFIC AIM(S)
Increase the percentage of discharge orders entered by 11AM from a baseline 29.5% 2021 to a goal of 40% by the end of 2022.
DESCRIPTION OF INTERVENTION
In January 2022 a multidisciplinary group was tasked to work together with the purpose of increasing the percentage of discharge orders by 11AM to help with patient throughput.
Preparation (Q1): Dashboard creation and formulation of an action plan for the year focused on physicians’ barriers to discharge order entry by 11AM. The group met monthly and created a dashboard to monitor progress and target inter ventions. Additionally, the division of Pediatric Hospital Medicine (PHM) led efforts to improve this metric by holding a stakeholder meeting with hospitalists to identify barriers (fish bone diagram), formulate interventions, and define division specific goals.
INTERVENTIONS
1. PHM division added a discharge helper on weekdays and some weekends (January).
2. PHM promoted preparation of discharges the evening prior to the anticipated discharge date and discussing discharge needs with case managers (March). PHM encouraged teach attendings to discharge 1-2 non-complex patients prior to starting rounds with the residents (March).
3. Shared dashboard data monthly with PCMG members and trainees via e-mail and during various division meetings (March-December).
4. Recognition of champions: trainees, advanced practice providers (APP), and physicians (March-December).
5. Individual recognition to interns (August-December).
6. Communication tips (March, April, May).
7. APP led mentoring to divisions with high volume of discharges (Jun-Jul).
8. Discouraging the overuse of activatable orders (March, October)
MEASURES AND RESULTS:
Primary outcome measure(s):
• Monthly Percentage of discharge orders entered by 11AM from January 1 to December 31, 2022. Process metric(s):
• Monthly percentage of discharge orders entered by 11AM stratified by divisions that discharge hospitalized patients.
• Monthly percentage of PHM discharge orders entered by 11AM by teach versus non teach teams. Balancing measure(s):
• Average length of stay (ALOS).
• 7-day unplanned readmission rates (URR).
• 30-day URR.
Results:
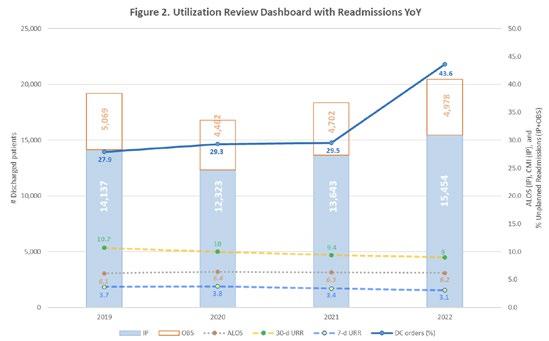
Between January 1st and December 31st, 2022, our hospital discharged 20,434 patients admitted as inpatient or observation status. Patients admitted as Same Day Care/Extended Care were excluded. 55% of the patients were discharged by the Pediatric Hospital Medicine (PHM) division. 43.6% of the discharge orders were placed by 11AM compared to 29.5% in the 2021 baseline period (Figure 1). In 2022, our hospital did not see an increase in URR at 7 or 30 days and the ALOS did not increase (Figure 2). From 18 divisions that discharge hospitalized patients, 14 (78%) had improvements compared to the previous year (3.5 to 32.8% variance). Four divisions (22%) had a decline (-1.4 to -12% variance).
IMPACT/CONCLUSION
General and targeted interventions improved the percentage of discharge order entry by 11AM. Primary and consulting divisions’ changes in behaviors and workflows contributed to the success of this institutional effort. Unfortunately, this improvement has only been accompanied by much more modest increase in the percentage of discharges by 11AM and 2PM (Figure 3). This suggests that the provider discharge order is not the only bottleneck to be addressed in the discharge process. This may reflect misalignment of priorities or incentives or may relate to the nature of the problem itself (adaptive challenge). Next steps will be to expand efforts with stakeholders beyond providers including case managers, nurses, pharmacists, and other departments.
REFERENCES
1. Kravet SJ, Levine RB, Rubin HR, Wright SM. Discharging patients earlier in the day: a concept worth evaluating. Health Care Manag (Frederick). 2007 Apr-Jun;26(2):142-6. doi: 10.1097/01.HCM.0000268617.33491.60. PMID: 17464227.
2. Nyce A, Gandhi S, Freeze B, Bosire J, Ricca T, Kupersmith E, Mazzarelli A, Rachoin JS. Association of Emergency Department Waiting Times With Patient Experience in Admitted and Discharged Patients. J Patient Exp. 2021 Apr 28;8:23743735211011404. doi: 10.1177/23743735211011404. PMID: 34179441; PMCID: PMC8205338.
3. Zoucha J, Hull M, Keniston A, Mastalerz K, Quinn R, Tsai A, Berman J, Lyden J, Stella SA, Echaniz M, Scaletta N, Handoyo K, Hernandez E, Saini I, Smith A, Young A, Walsh M, Zaros M, Albert RK, Burden M. Barriers to Early Hospital Discharge: A Cross-Sectional Study at Five Academic Hospitals. J Hosp Med. 2018 Dec;13(12):816-822. doi: 10.12788/jhm.3074. PMID: 30496327.
4. van Sluisveld, N., Oerlemans, A., Westert, G., van der Hoeven, J. G., Wollersheim, H., & Zegers, M. (2017). Barriers and facilitators to improve safety and efficiency of the ICU discharge process: a mixed methods study. BMC Health Services Research, 17, 1-12.
Development and Implementation of a Quality Improvement
Curriculum for Phoenix Children’s Critical Care Fellows
AUTHORS
Primary: Elizabeth Zorn, MD
Author(s)/Affiliations: Heather Hanley, MD
BACKGROUND
Phoenix Children’s Critical Care fellows must complete an independent quality improvement (QI) scholarly project as a part of their graduation requirements. Formal QI education is highly variable amongst pediatric residencies, and most fellows have been observed to have limited understanding of QI concepts at the start of our fellowship training. No formal training program for QI existed for Phoenix Children’s PICU fellows prior to 2020. In addition, new fellows have limited awareness of institutional priorities and resources; this presents additional obstacles to fellow-initiated quality work. Historically ≤25% of PICU fellows have submitted independent, Phoenix Children’s-based improvement projects to quality day at Phoenix Children’s.
SPECIFIC AIM(S)
Within 3 years of intervention, the knowledge and confidence of graduating PICU fellows regarding QI techniques will increase by 40% over baseline, and every fellow will complete a relevant, independent, institutional QI project prior to their class graduation date and submit an abstract for Quality Day. Our secondary aim is to increase the value of the projects, aiming for ≥ 75% of the PICU abstract acceptance at Phoenix Children’s Quality Day prior to graduation.
DESCRIPTION OF INTERVENTION (IMPROVE AND CONTROL)
A QI curriculum was developed and implemented by PICU faculty in August 2020.
PDSA Cycle #1: Over the course of a year, didactic topics included project identification and development (problem statement, SMART aim, teambuilding, outcome measurement, resource identification, data analysis), error reporting, institutional quality focus areas, PICU quality outcomes, and lifelong QI/MOC requirements. Additionally, dedicated workshop time provided group feedback for projects under development.
PDSA cycle #2: ran during academic year 21-22 using the “flip the classroom” approach, limiting lecture time, providing resource materials prior to the sessions, and maximizing workshop time for discussion and feedback. PDSA cycle #3: 2022-23: After evaluation, the curriculum reverted to traditional format, resuming programmed lectures balanced with workshop time. A focused session has been added, emphasizing data collection and organization, with hands on instruction in analytic tools and methods.
METRICS (MEASURE AND ANALYZE)
Baseline surveys were sent to each fellow prior to program initiation, at the beginning of each academic year, and to graduating fellows prior to graduation.
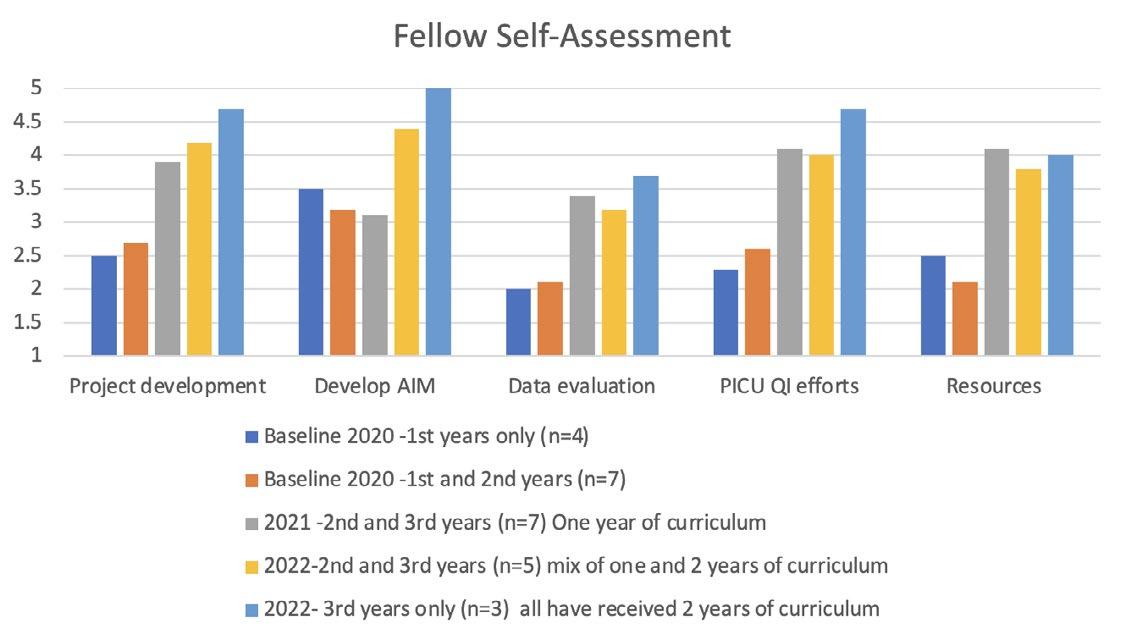
Self-assessment of knowledge and confidence: Using a Likert Scale (1-5), fellows were questioned regarding their level comfort in developing a project, selecting and refining a SMART AIM statement, analyzing data related to their project, familiarity with QI efforts in the Phoenix Children’s PICU, and knowledge of available resources. Fellow confidence in all assessed areas grew, reaching a 4 or higher in every category except data analysis after just 2 years. Surveys do not reflect PDSA cycle #3.
ACCEPTED ABSTRACTS/AWARDS
• In 2021, 2 of 4 graduating fellows submitted abstracts accepted for Quality Day a. One received Honorable Mention, one was an overall Quality Day winner.
• In 2022, 3 of 4 graduating and one 2nd year fellow submitted abstracts for Quality Day; all 4 accepted. a. One received a 3rd place award and 2 received Honorable Mention.
• In 2023, all 3 remaining 3rd year fellows have submitted Quality Day abstracts.
IMPACT
Implementation of a quality curriculum has been successful in improving the confidence and knowledge of PICU fellows in QI work and has also resulted in higher caliber improvement work. Future curriculum modifications include engagement of the 3rd year fellows in teaching components of the course, submitting projects for MOC credit, and, when appropriate, for publication. We are also considering opening the curriculum to pediatric residents with declared interest in a PICU career.
Do They Really Have a Drug Allergy?
General Pediatricians Collaborate with Allergists to Delabel
False Penicillin Allergies
AUTHORS
Primary: Renee J. Crawford
Author(s)/Affiliations: Victoria Lorah, DO; Jacob Phouthavong-Murphy, DO; Harrison Van Dolah, MD; Alyssa Pianto, DO, MS; Taylor Burton, DO, MS; Ian Kloehn, DO; Jason Abbott, MD; Jackson Reynolds, MD; Claire Coronado, MD; Ashley Bartlett, MD; Lora Duncanson, MD; Morgan Neale, DO; Jennifer S Nelson, DO; Katy Mullens, MD; Christine RF Rukasin, MD; Kristen Samaddar, MD
BACKGROUND
Approximately 10% of US patients report an allergy to penicillin-class antibiotics, making it one of the most reported drug allergies. Of those, 90% can tolerate penicillin (PCN) upon confirmatory testing. The prevalence of these false allergy labels leads to negative health outcomes and higher costs from the use of alternative antibiotics that are often less effective and lead to higher antibiotic resistance. Studies have shown PCN allergy labels are associated with increased rates of infection with MRSA, vancomycin-resistant enterococcus, C. Difficile and surgical site infections.
SPECIFIC AIM(S)
1. Determine the baseline PCN allergy rate for Phoenix Children’s (PC) Primary Care, Complex Care, Adolescent Medicine (PCCCAM) patients (7/1/20-6/30/21)
2. Refer >30% of patients with a PCN allergy label to PC Allergy by 7/1/23
3. Track number of patients delabeled
METHODS AND INTERVENTIONS
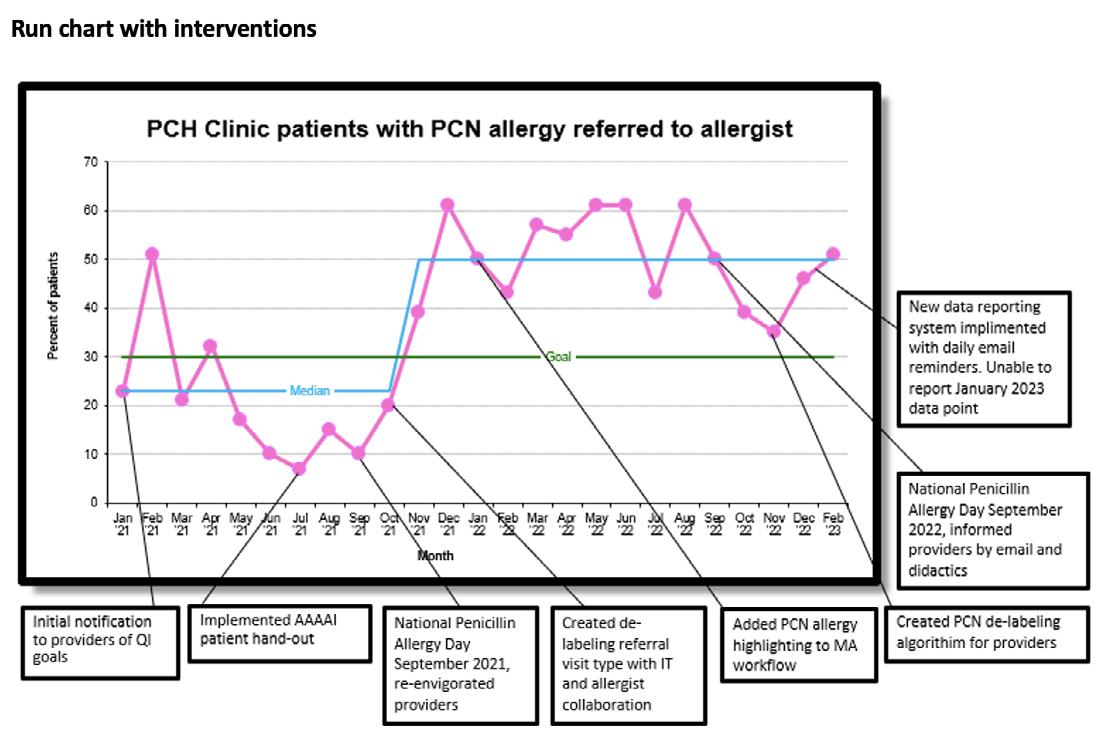
This quality improvement (QI) project used several interventions to achieve our aims: physician training, improved workflows, patient education materials, and increased collaboration between teams. We created and implemented a workflow that allowed for immediate delabeling if no risk of true allergy and referrals to allergists for at- risk patients. Patients with PCN allergy labels, new allergy referrals, and scheduled or completed allergy appointments (process measures) were tracked monthly. Multiple PDSA cycles were implemented. Data was initially measured by running a report on how many patients were seen within the general pediatric clinic with a PCN allergy were referred to the allergy clinic. We will be tracking the number of patients delabeled in primary care and allergy clinics (outcome measures). Lastly, in January 2023 with the support of IT, a daily email was sent to providers to remind them of scheduled patients with a penicillin allergy and a new dashboard was created to better manage the data. New EMR includes patients with a PCN allergy label having a section where the provider can address the label based on the family’s decision; i.e. refer to allergy, decline referral, delabel in clinic, addressed at previous visit. The new data system was recently shared with allergy/ immunology clinicians to help bridge the communication between gen peds clinic and allergy clinic.
RESULTS
Pre-intervention (prior to 7/2021), 7% of patients at PCCAM had a PCN allergy label, 51/292 (17.47%) of patient with a PCN allergy label were referred to an allergist, and 27/292 (9.25%) had an appointment with allergy. Post initial interventions (7/1/21-6/30/22), 214/413 (51.8%) of patients with a documented allergy had an allergy referral, and 111/413 (26.87%) patients with a PCN allergy had an allergy visit in past 24 months. After creation of the dashboard (Jan 2023), reporting changed slightly to include all visits (not filtered by unique patient), a check of box of options (new referral, immediate delabeling, existing allergy patient, decline referral). The data in February 2023 shows 23/45 (51%) of the patients with an allergy were offered an allergy referral.
CONCLUSIONS
Despite pandemic related staffing issues, we raised awareness for the importance of accurately assessing drug allergies. We enhanced communication between teams and streamlined the referral process. Oral drug challenges are now offered the same day as initial consult. Daily email reminders to all gen peds clinic providers was met with negative feedback, as the notifications weren’t specific to each provider patient list. We have achieved the aim of referring >30% of patients with PCN allergies to allergists for oral challenges. Next steps include ongoing education for providers to ensure sustainability, optimizing allergists’ post-challenge communication, and improving tracking of patient who have been delabeled. Now that we have IT support, we are working towards providing feedback to individual providers regarding performance. By removing false allergy labels, we can impact healthcare for both the individual and system at large.
Improving the Rate of Necrotizing Enterocolitis in the NICU 2023 Quality Day Finalist
AUTHORS
Primary: Navin Bhopal, MD
Author(s)/Affiliations: Amy Brown, MD; Ian Kloehn, MD; Amaris Tapia, MS4; Nisha Patel, RD; Rhonda Kurz, PharmD; Megan Shea, NNP; Nanette Whittington, NNP; Pam Griffiths, MD; Michelle Weller, IBLCE; Mohammed Elkhwad, MD; Gregg Martin, MD
BACKGROUND
Necrotizing enterocolitis (NEC) is a potentially devastating inflammatory disease of the gastrointestinal (GI) tract in newborns and infants. Risk factors for the development of NEC include prematurity, low birth weight, hypoxia-ischemia and certain congenital anomalies of the heart and GI tract. Strategies for the prevention of NEC have been well established and include measures such as: 1) following a standardized feeding protocol for the initiation and advancement of enteral feeds; 2) prioritization of human milk (either maternal or donor milk) over formula; 3) limiting unnecessary antibiotic exposure in order to preserve a healthy gut microbiome; 4) limiting exposure to antacids in premature infants; 5) probiotic use in preterm infants. Since 2017, the baseline median NEC rate in the NICU was 4.3%, which is above the benchmark of ~2% for similar centers. Interventions to reduce NEC in our NICU included: 1) establishment of a neonatal enteral feeding protocol for the NICU; 2) monitoring breast milk at discharge and formation of a breast milk work group; and 3) establishment of a NEC work group.
SPECIFIC AIM
To decrease rate of NEC by 10% between December 1, 2020 and December 31, 2022.
DESCRIPTION OF INTERVENTION
Interventions Included:
1. Establishment of a neonatal enteral feeding protocol for the NICU
2. Formation of a breast milk work group with the goal of improving human milk use in the NICU
3. Establishment of a NEC work group.
MEASURES AND RESULTS
Process Measure
1. Adherence to Neonatal Enteral Feeding Protocol for non-surgical infants in the NICU We introduced a standardized feeding protocol for preterm and critically-ill term infants in September of 2020; the protocol did not apply to infants that underwent GI surgery. Compliance with the protocol was measured based on “self-reporting” using a data collection tool. Training on the protocol occurred from Jan 2021 to Jan 2022. Copies were posted by computer work-stations (January 2021) and on an online share-drive (Jan 2022). In January 2022, NICU dieticians gained privileges to order TPN and modify feeding orders. Our baseline compliance improved to 100% compliance by March, 2022.
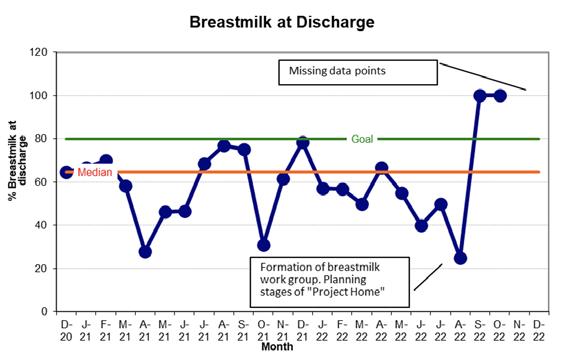
2. Breastmilk at Discharge
Our enteral feeding protocol emphasized and prioritized human milk. We monitored breast milk rates at NICU discharge to see if breast milk and breastfeeding were able to be sustained throughout the hospitalization. The median breast milk at discharge rate was 64.7%. In August, 2022, a work-group was created to improve breast milk use in the NICU. We saw a trend towards improved breast milk rates at the end of 2022.
Primary Outcome
To decrease the incidence of NEC at PC by 10% from September 2020 to December 2022
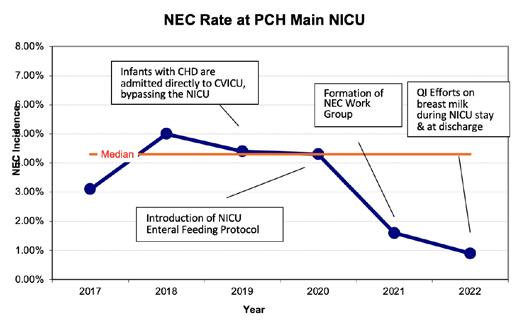
The baseline median NEC rate since 2017 was 4.3%. The NEC rate decreased to 1.6% and to 0.9% in 2021 and 2022 respectively. Prior to 2019, infants with congenital heart disease were admitted to the NICU pre-operatively and transferred to CVICU post-operatively. The NEC data set prior to 2019 includes many infants with congenital heart disease that were admitted initially to the NICU and later transferred to the CVICU. After 2019, term infants with congenital heart disease were preferentially admitted directly to the CVICU after birth and may not have been included in the NICU NEC data. This change in hospital practice may have had an impact on the NICU NEC rate. However, the NEC rate remained at ~4% in both 2019 and 2020 despite this change in practice.
In 2021, a NEC multi-disciplinary work group including neonatologists, dieticians, lactation specialists, cardiac intensivists and pharmacists was formed. The focus of the group is to review best practice guidelines for NEC prevention, as well as the establishment of a NEC treatment pathway, which was introduced in August 2022.
CONCLUSIONS AND FUTURE DIRECTIONS
Through multidisciplinary work groups and interventions focusing on breastmilk use and best feeding practices, we improved our NEC rate at the PC NICU from 4.3% to 0.9%; while there are not enough data points to establish a complete “shift” in baseline, the trends are very promising. NEC carries a high morbidity and mortality; survivors of NEC are more likely to develop long-term neurodevelopmental impairment compared to infants without NEC. By decreasing the rate of NEC, we are able to improve long-term patient outcomes and reduce cost of NICU care.
Future work includes evaluating antacid practices, implementation of a standardized feeding protocol for infants undergoing GI surgery and implementing human-milk derived fortifiers in the NICU and CVICU. The PC NICU is participating in Project HOME, a national QI project aimed at improving breast milk rates in NICUs across the nations. Since joining Project HOME, we have established formal weekly lactation rounds, and developed a formal breast milk/ breastfeeding education program for nursing staff and parents. We look forward to seeing the impact of these measures on NICU breast milk rates and ultimately on NEC rates.
REFERENCES
1. Alganabi M, Lee C, Bindi E, Li B, Pierro A. Recent advances in understanding necrotizing enterocolitis. F1000Res. 2019;8:F1000 Faculty Rev-107. Published 2019 Jan 25. doi:10.12688/f1000research.17228.1
2. Gil, E., Jung, K., Qvist, N., and Ellebaek M.B. Antibiotics in the medical and surgical treatment of necrotizing enterocolitis. A systematic review. BMC Pediatrics. 2022: 22 (66).
3. Cotton, M. Modifiable risk factors in necrotizing enterocolitis. Clin Perinatol 46 (2019) 129–143.
4. Gephart, S. et al. NEC-zero recommendations from scoping review of evidence to prevent and foster timely recognition of necrotizing enterocolitis. Maternal Health, Neonatology, and Perinatology (2017) 3:23
5. Grishin, A. et al. The role of the intestinal microbiota in the pathogenesis of necrotizing enterocolitis. Seminars in Pediatric Surgery 22 (2013) 69–75.
6. Mavis. S. et al. A quality improvement initiative to reduce necrotizing enterocolitis in high-risk neonates. J Perinat Aug 1 2022. https:// doi.org/10.1038/s41372-022-01476-5
Drowning Prevention: A Life Preserver 2023
Drowning Prevention: A Life Preserver 2023 Quality Day Finalist
AUTHORS
AUTHORS
Primary: Alexa Modrell
Primary: Alexa Modrell
Author(s)/Affiliations: South Mountain Resident Cohort Team Members: Robert Eagle, Alexa Modrell, Meggan Roman, David Robertson, Luca Farrugia, Austin Cooper, Ashnaa Rao, Bhavan Modi, Tanner Duncan, Saurabh Patil, Amanda Chung, Joanna Kramer; Injury Prevention Team Members: Tiffaney Isaacson, Bianca Cardiel
Author(s)/Affiliations: South Mountain Resident Cohort Team Members: Robert Eagle, Alexa Modrell, Meggan Roman, David Robertson, Luca Farrugia, Austin Cooper, Ashnaa Rao, Bhavan Modi, Tanner Duncan, Saurabh Patil, Amanda Chung, Joanna Kramer; Injury Prevention Team Members: Tiffaney Isaacson, Bianca Cardiel
BACKGROUND
BACKGROUND
Drowning is a leading cause of death in US children ages 1-4 years old. Children in Arizona are at higher risk of drowning than the national average, and 95% of drownings in Arizona occur in children ages 1-4. The American Academy of Pediatrics recommends that pediatricians assess all children for drowning risk and prioritize evidence-based strategies to mitigate their risks. Our goal was to increase the frequency with which providers discussed drowning prevention as part of their anticipatory guidance during well child checks for ages 1-4.
Drowning is a leading cause of death in US children ages 1-4 years old. Children in Arizona are at higher risk of drowning than the national average, and 95% of drownings in Arizona occur in children ages 1-4. The American Academy of Pediatrics recommends that pediatricians assess all children for drowning risk and prioritize evidence-based strategies to mitigate their risks. Our goal was to increase the frequency with which providers discussed drowning prevention as part of their anticipatory guidance during well child checks for ages 1-4.
SPECIFIC AIM(S)
SPECIFIC AIM(S)
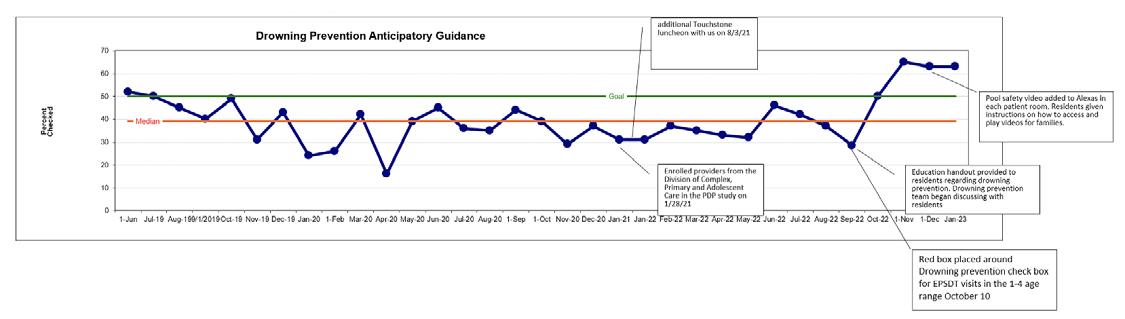
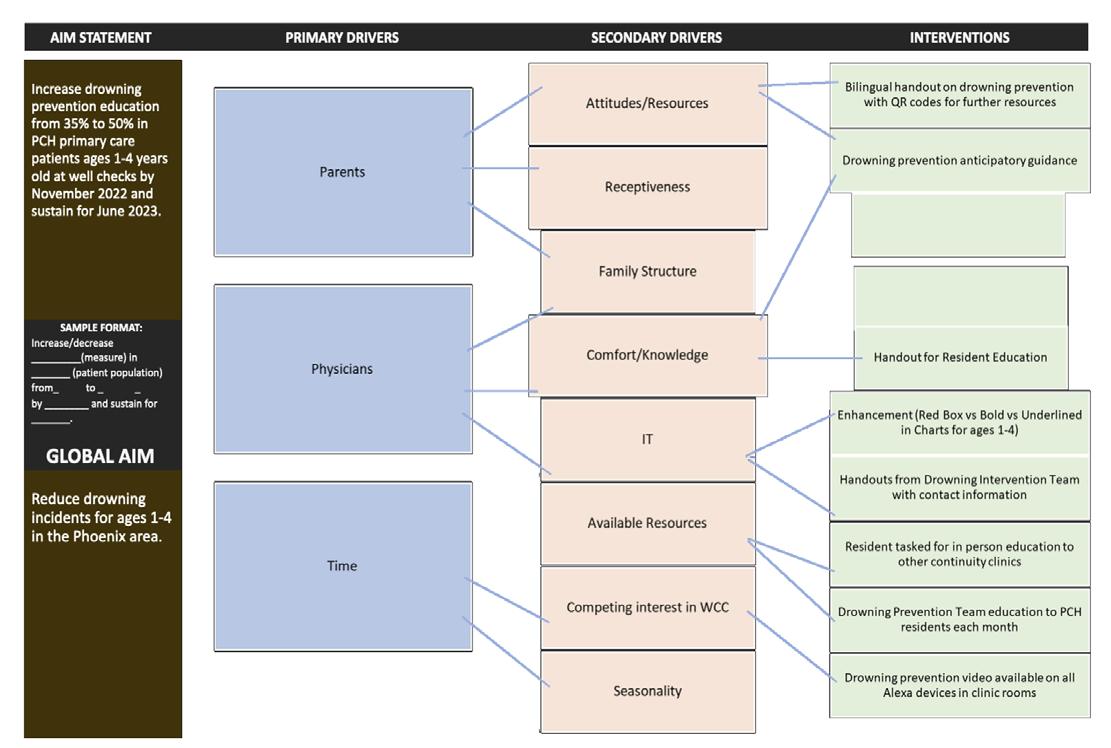
Increase drowning prevention anticipatory guidance at 1-4 yo well checks in the Phoenix Children’s General Pediatrics Clinic from a baseline of 35% to 50% by June 2023 and sustain for one year.
Increase drowning prevention anticipatory guidance at 1-4 yo well checks in the Phoenix Children’s General Pediatrics Clinic from a baseline of 35% to 50% by June 2023 and sustain for one year.
DESCRIPTION OF INTERVENTION(S)
DESCRIPTION OF INTERVENTION(S)
Several initiatives targeting physician education, parental understanding, and clinic practices were introduced. The Phoenix Children’s Injury Prevention team was recruited to help educate providers in the clinic about specific teaching points to educate families. The drowning prevention checkbox in the anticipatory guidance section of the note was highlighted in 1-4 yo well check templates to serve as a visual reminder to providers. To address health disparities in children with special needs, we provided targeted education about their unique risks to providers and families. An easily accessible, education drowning prevention education video by the injury prevention team was linked on all exam room Alexa devices for providers to play during the visit. A bilingual handout was created to highlight community resources for patient safety in aquatic settings.
Several initiatives targeting physician education, parental understanding, and clinic practices were introduced. The Phoenix Children’s Injury Prevention team was recruited to help educate providers in the clinic about specific teaching points to educate families. The drowning prevention checkbox in the anticipatory guidance section of the note was highlighted in 1-4 yo well check templates to serve as a visual reminder to providers. To address health disparities in children with special needs, we provided targeted education about their unique risks to providers and families. An easily accessible, education drowning prevention education video by the injury prevention team was linked on all exam room Alexa devices for providers to play during the visit. A bilingual handout was created to highlight community resources for patient safety in aquatic settings.
MEASURES AND RESULTS
MEASURES AND RESULTS
In 2021, the injury prevention team provided education to attending providers at an in-service. However, at that time the chosen outcome measure of CPT codes was not frequently utilized. In August 2022, our resident cohort selected an outcome measure that was better suited to our clinic workflow. Our primary outcome measure was to measure the percentage of visits where the drowning prevention education checkbox has been marked as completed. After initial interventions of resident education with both provider handout and injury prevention team presentations as well as placing a red box around the check box, the percentage of drowning prevention anticipatory guidance increased from 35% to 60.3%.
In 2021, the injury prevention team provided education to attending providers at an in-service. However, at that time the chosen outcome measure of CPT codes was not frequently utilized. In August 2022, our resident cohort selected an outcome measure that was better suited to our clinic workflow. Our primary outcome measure was to measure the percentage of visits where the drowning prevention education checkbox has been marked as completed. After initial interventions of resident education with both provider handout and injury prevention team presentations as well as placing a red box around the check box, the percentage of drowning prevention anticipatory guidance increased from 35% to 60.3%.
IMPACT
IMPACT
Pediatric drowning has a very small incidence but is highly consequential and preventable. Thus, it is difficult to measure the impact of drowning prevention education in preventing actual drowning. Providing adequate education is a staple of informing parents how to prevent such an event from occurring. In our clinic, we increased our rate of drowning prevention education well above our goal. To continue these efforts, we will continue to educate incoming residents about the importance of providing anticipatory guidance for drowning prevention. We plan to implement periodic practice briefing to provide targeted education to providers. We will continue to work with the Injury Prevention Team to stay up to date on the most effective strategies to prevent drowning and pass the information we learn along to providers in our clinic. One example is to have selected residents attend a workshop on drowning prevention. Through the efforts described above, residents, many of whom will spread throughout the country working in primary care practices, will continue to provide this education and potentially save countless lives.
Pediatric drowning has a very small incidence but is highly consequential and preventable. Thus, it is difficult to measure the impact of drowning prevention education in preventing actual drowning. Providing adequate education is a staple of informing parents how to prevent such an event from occurring. In our clinic, we increased our rate of drowning prevention education well above our goal. To continue these efforts, we will continue to educate incoming residents about the importance of providing anticipatory guidance for drowning prevention. We plan to implement periodic practice briefing to provide targeted education to providers. We will continue to work with the Injury Prevention Team to stay up to date on the most effective strategies to prevent drowning and pass the information we learn along to providers in our clinic. One example is to have selected residents attend a workshop on drowning prevention. Through the efforts described above, residents, many of whom will spread throughout the country working in primary care practices, will continue to provide this education and potentially save countless lives.
Social Determinants of Health Quality Improvement Program
AUTHORS
Primary: Nathan Larsen, Network Quality Performance Manager
Author(s)/Affiliations: Dr. Roy Jedeikin, Chief Medical Officer; Jodi Brigola, Manager Practice Integration and Quality Programs; Griffin Baker, Sr. Practice Integration Rep; Regan Williams, Practice Integration Rep; Brittany Baarson, Sr. Health Informatics Analyst; Dillon Davis, Sr. Health Informatics Analyst; Bryce Sherman, Director Business Operations and Clinical Programs; Kelley Guerriero, Manager Integrated Care Coordination
BACKGROUND
Social determinants of health are the conditions in the environments where people are born, live, learn, work, play, worship, and age that affect a wide range of health, functioning and quality of life outcomes and risks. Data and research suggest that up to 80% of a person’s overall health status is influenced by social determinants of health.
To provide the highest quality of care, it is important to understand the variety of factors that affect a child’s overall health and well-being. Unmet social needs have been correlated with higher no-show rates, more than double the rate of Emergency Department usage, and can put patients at greater risk for long-term, negative social and health outcomes that can persist over their lifetime. Low education attainment, unemployment, housing insecurity and financial insecurity, along with increased rates of alcoholism, depression, heart disease, diabetes, and other chronic diseases, are examples of the long term social and health outcomes associated with unmet social needs.
Children who experience adversity caused by unmet social needs are more likely to experience developmental delays, have decreased functioning of immune and nervous systems, and have behavioral and mental health issues. The use of an SDoH screening tool with simple, effective questions is the first step to addressing social needs. Integrating SDoH screening into clinical workflows allows providers to successfully provide whole person care by understanding patients’ social needs in addition to their clinical needs.
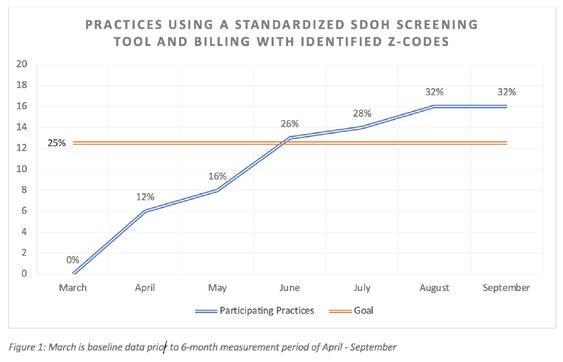
The network conducted a pre-intervention survey that showed no practices were using a standardized SDoH screening tool and billing with identified Z-codes, setting a March baseline of 0%. The SDoH program was rolled out network wide in April and measured for a 6-month period. PDSA cycle methodology was utilized for review of outcome measures and intervening through education and system changes.
SPECIFIC AIM
Increase the percentage of network practices using a standardized SDoH screening tool and billing with identified Z-codes from a baseline of 0% to a goal of 25% within 6 months.
INTERVENTIONS
Development of standardized SDoH screening tool was grounded on the following principles:
• Screening questions need to include domains where high-quality evidence exists linking them to health outcomes and must identify needs for which there are some resources and services in the community available to address them.
• Screening questions must be simple, brief, and applicable to most populations, so that they can be easily integrated into workflows in diverse settings across the state. The questions do not have to address all nuances of need; rather, a positive response on a screening question should trigger a more in depth assessment that allows a greater understanding of specific needs and more targeted navigation to resources by a community health worker, care manager, social worker, or other member of the team.
• Screening questions must be validated (align with existing screening tools, i.e., PRAPARE, Health Leads), draw from best practices, and must be written at accessible reading levels to ensure that they can be effectively used. This intentional alignment to existing tools will allow for easier implementation and similar data collection.
Development of standardized SDoH workflow at the practice level:
• The screening and follow-up should be a team-based effort integrated into the practice’s workflows. A successful workflow includes guidance for frequency of screening, documentation, patient needs follow-up and coding.
• The network followed American Academy of Pediatrics’ recommendation to screen every patient at every visit. Frequent screening provides the most accurate, up to date needs assessment possible. The screening tool assesses social needs that can change quickly, and some may require immediate assistance.
• The SDoH screening tool was provided to each practice and can be administered on paper or electronically if available.
• The SDoH screening should be completed by the caregiver or patient as appropriate upon check-in. Verbal screenings should be avoided whenever possible.
• Results of the screening (positive or negative) should be recorded in the patient’s chart/electronic health record. SDoH data may be documented in the problem or diagnosis list, patient history or provider notes
Development of standardized SDoH referral process:
• A patient centered social needs conversation should take place if a patient screens positive for any social needs identified in the SDoH screening.
• If the patient/caregiver would like help and is eligible for the network’s services, the practice refers them by sending the positive screening tool to the network’s Care Coordination team.
• If the patient/caregiver would like help and is not eligible for the network’s services, the practice refers them to available community resources.
METRICS (MEASURE AND ANALYZE)
Outcome Measure
• Measure the percentage of network practices using a standardized SDoH screening tool and billing with identified Z codes
Process Measure
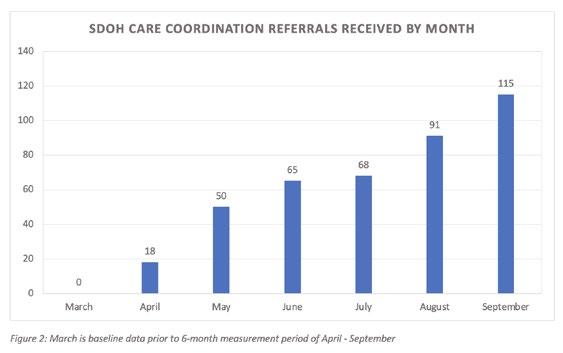
• Measure the number of patients who received help through the network’s Care Coordination team
• Measure the percentage of network practices that participated in SDoH educational opportunities
• Categorize and measure the patient needs identified into the domains of SDoH
Balancing Measure
• Hesitancy to adopt the program due to insufficient practice staffing and workflow/process changes
IMPACT
During the 6-month measurement period 85 providers, representing 16 of the 50 network practices, adopted the use of a standardized SDoH screening tool with appropriate Z-codes. This data represents an increase from a baseline of 0% to 32%, exceeding the goal by 7%. The Care Coordination team received 510 positive SDoH screening referrals with 1,725 needs identified during this same time.
36 practices, representing 72% of the network, participated in SDoH educational opportunities, which included: Specialty Education Series webinar, Maintenance of Certification Quality Improvement project, and Practice Integration visits. 64% of the identified needs related to economic stability, 20% related to social and community context, 8% related to healthcare access and quality, and 8% related to neighborhood and built environment.
Through the iterative process of the PDSA methodology, next steps to increase practice utilization of the screening process will include mitigating the balancing measures as noted above and review of identified best practices.
Using a Power Dashboard to Optimize Treatment Management of Patients with Adrenal Insufficiency
AUTHORS
Primary: Sara Vivatson, DO
Author(s)/Affiliations: Varshini Chakravathy, MD; Katie Barger, MD; Rob Gonsalves, DO; Vinay Vaidya, MD; Chirag Kapadia, MD; Dorothee Newbern, MD
BACKGROUND
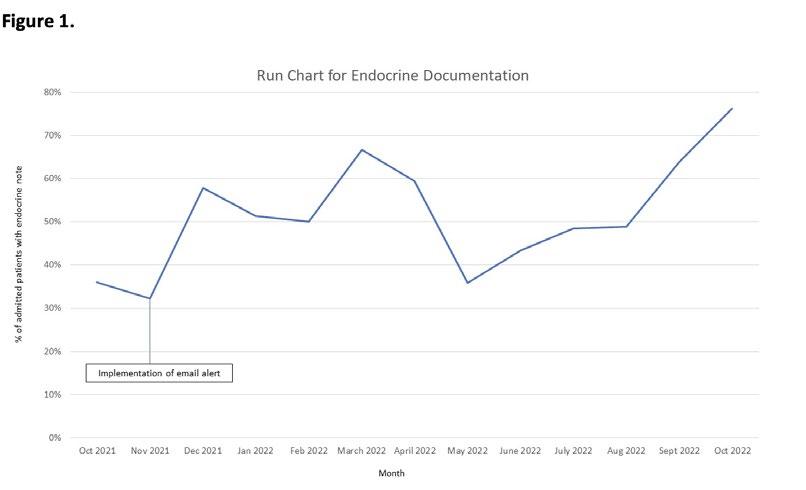
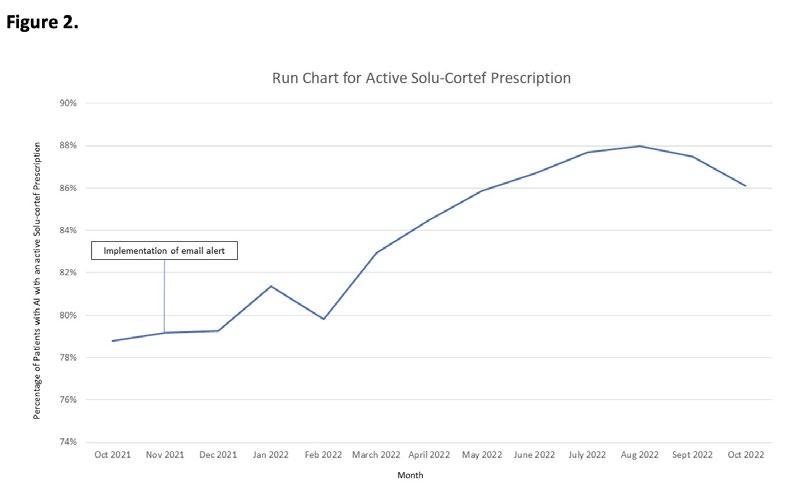
Adrenal insufficiency (AI) is a life-threatening condition characterized by impaired glucocorticoid secretion, and in the case of primary AI mineralocorticoid secretion too. An adrenal crisis is the clinical deterioration that may occur in patients with AI when they are unable to mount or receive adequate amounts of glucocorticoids. This continues to be a significant source of morbidity and mortality in children with an estimated incidence is 5-10 episodes per 100 patient-years and 1 in 200 of these episodes resulting in death (Miller et al.). To prevent adrenal crises, patients with AI require increased doses of glucocorticoids in times of physiologic stress. It is thus imperative that there is effective communication between endocrine and non-endocrine clinicians regarding these “stress” doses for timely administration when patients with AI are in the ED or hospitalized. In the outpatient setting, patients and families must be equipped with hydrocortisone injection (Solu-cortef) when having crisis symptoms to avoid delay in care. Baseline data obtained in October 2021 from a power dashboard created by IT showed that only 36% of admitted patients with AI had an inpatient endocrine note and 79% of patients with AI had an active Solu-cortef prescription. Thus, this project’s main objective is to improve communication of stress dosing instructions through written documentation by the Endocrinologists and increase rates of active Solu-cortef prescriptions for patients with AI.
SPECIFIC AIM
1. Improve endocrine documentation for admitted patients with AI to a monthly rate of 75% by end of October 2022
2. Increase the rate of active Solu-cortef prescription to monthly rate of 95% by end of October 2022
DESCRIPTION OF INTERVENTION
A daily email alert system was created to notify all Endocrine clinicians of admitted patients with AI without an endocrine note in the prior 6 months and patients with AI who do not have an active Solu-cortef prescription.
METRICS
Outcome Measures
• Monthly percentage of endocrine documentation (inpatient consult, progress note, or interval note)
• Monthly percentage of patients with AI who have a Solu-cortef prescription written in last 2 years (expiration timeframe) Process Measures
• Evaluating if the email alert system captures patients with missing endocrine documentation or active Solu-cortef prescription using the AI power dashboard Balancing Measures
• Documentation errors
• Email alert fatigue
RESULTS
From October 2021 (baseline) to end of October 2022, the endocrine documentation for admitted patients with AI increase from 36% to greater than 75% and the percentage of current Solu-cortef prescription increased from 79% to a peak of 88%. We were able to reach our goal for Aim 1 for endocrine documentation and were very close to reaching the goal for Aim 2 for percentage of active Solu-cortef prescription (Figure 1 and Figure 2, respectively). Regarding the process measures, the alert system worked well. The daily emails alerted either the inpatient team to write a consult note or the Endocrine Quality nurse write an interval note. In addition, the emails reminded the primary endocrinologist of the patient missing an active Solu-cortef prescription to refill the script. Addressing the balancing measures, the emails seemed to capture the appropriate information without being too overwhelming and endocrine clinicians did not have complaints of alarm fatigue. However, given the large number of emails clinicians receive on daily basis, they may have missed the alert or may have not had time to address it. This may explain why the goal for Aim 2 was not reached.
IMPACT
The immediate impact for these patients includes prompt administration of stress dosing for patients with AI and ensuring that families are equipped with emergency Solu-cortef in the outpatient setting to prevent adrenal crisis. Future steps include setting new targets for endocrine documentation rates and continuing to work towards our goal of 95% for active Solu-cortef prescription. We plan to utilize the AI power dashboard to help identify additional areas of improvement such as ensuring that hospitalized patients with AI are receiving stress hydrocortisone within 6 hours of admission.
REFERENCES
1. Chakravarthy V, Barger K, Gonsalves R, Kapadia C, Vaidya V, Newbern D Standardizing Treatment in the Management of Adrenal Insufficiency. Abstract presented at: Quality Day 2022; May 17, 2022; Phoenix AZ.
2. Miller BS, Spencer SP, Geffner ME, et al. Emergency management of adrenal insufficiency in children: advocating for treatment options in outpatient and field settings. J Investig Med. 2020;68(1):16-25. doi:10.1136/jim-2019-000999
Improving Communication in NICU Post-Operative Handovers
AUTHORS
Primary: Jessica Wickland
Author(s)/Affiliations: Kristen Farnsworth, NNP
BACKGROUND
Post operative handovers involve multiple teams and require clear communication to ensure safe transfer of patient care from one team to another. Interdisciplinary, team based handovers improve transition of care between operating rooms (ORs) and intensive care units (ICUs). Communication errors are a common cause of preventable medical errors with many of these occurring during patient handovers. Standardization of handovers can improve team communication and patient safety during this critical transition. The Phoenix Children’s (PC) neonatal ICU (NICU) is comprised of a high number of surgical patients with regular post operative handovers occurring.
SPECIFIC AIM
Improve communication in post-operative handovers occurring in the PC level IV NICU by increasing percentage of completed post-operative handover items to >75% by June 2023. Increase the agreeance of staff in the PC level IV NICU that they have sufficient information needed to care for the postoperative patient from
DESCRIPTION OF INTERVENTION
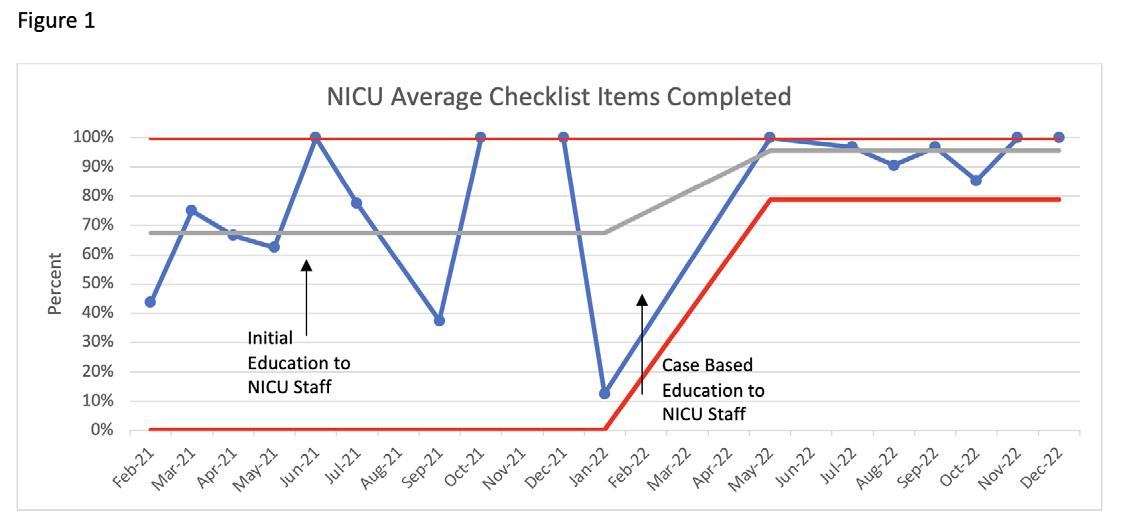
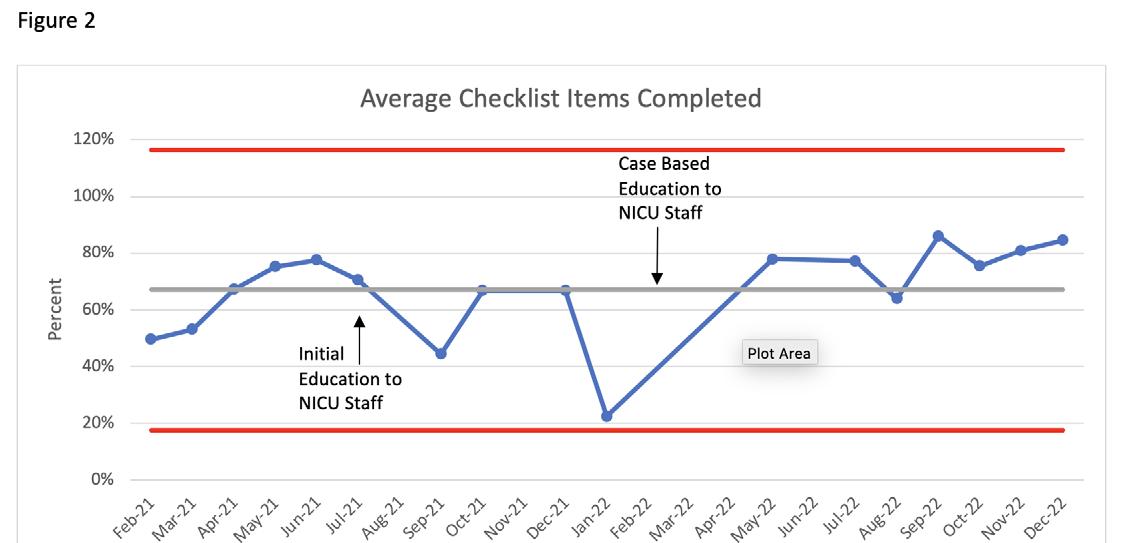
Baseline data were collected through random audits, using a standardized data collection tool, of post-operative handovers occurring in the PC NICU from February 2021 through June 2021. In addition, staff were surveyed following the handover on the completeness of the process, clarity of post operative plan, and having all necessary information to care for the patient post-operatively. A key driver diagram and a flow diagram were then created highlighting change ideas and detailing the OR to NICU handover process. All NICU staff, including physicians, neonatal nurse practitioners (NNPs), nurses and respiratory therapists (RTs), were provided education on the new post-operative handover process in July 2021 verbally and in writing. In February 2022, the new process was incorporated into quarterly case based education for nurses and yearly for physicians and NNPs. Data continues to be collected through random audits of postoperative handovers using the standardized data collection tool with outcome measures of percent of items reviewed during handover by each team and staff agreeance with completeness of handover on the staff survey. Process measure is number of audits completed compared to total patients who went to OR per month. Balancing measure is time to complete the post operative handover.
METRICS
In the baseline data collection period 18 audits of the handover process were performed. The baseline average percentage of completed handover items reviewed during the post-operative handover for the anesthesia, surgical, and NICU teams were 75%, 43%, and 65%, respectively. Improvement was seen in the completeness of the post-operative handover for the NICU team to 96% of checklist items, exceeding the goal of 75% (Figure 1). The average percent of checklist items completed for all teams has not increased above the goal of 75%, but is showing an upward trend from September 2022 on (Figure 2).
The average agreeance of staff (RNs, RTs, NNPs, and Physicians) responses to the third survey question (Do you have all the information to care for the patient post-operatively?) increased from the baseline of 4.0 to 4.6 out of 5. Time to complete the handover was similar in the baseline and intervention time periods at 7 and 8 minutes, respectively. A limitation of the data is the small number of random audits performed during some months. This is likely due to high patient census, opening of a second NICU area that is non-adjacent to the current NICU and staffing shortages that limited availability of team members to perform the audits.
IMPACT/CONCLUSION
Improving communication during the critical transition of the post operative handover is key to providing consistent patient care. Future goals include maintaining the completeness of post operative handovers and increasing direct surgical team member communication during the post operative handover.
Improving Recognition and Timely Management of Pediatric
Patients with
Suspected Sepsis on Resident Ward Teams
AUTHORS
Primary: Bethany Farretta, MD
Author(s)/Affiliations: Sandra Gage, MD and Jennifer Hall, MD
BACKGROUND
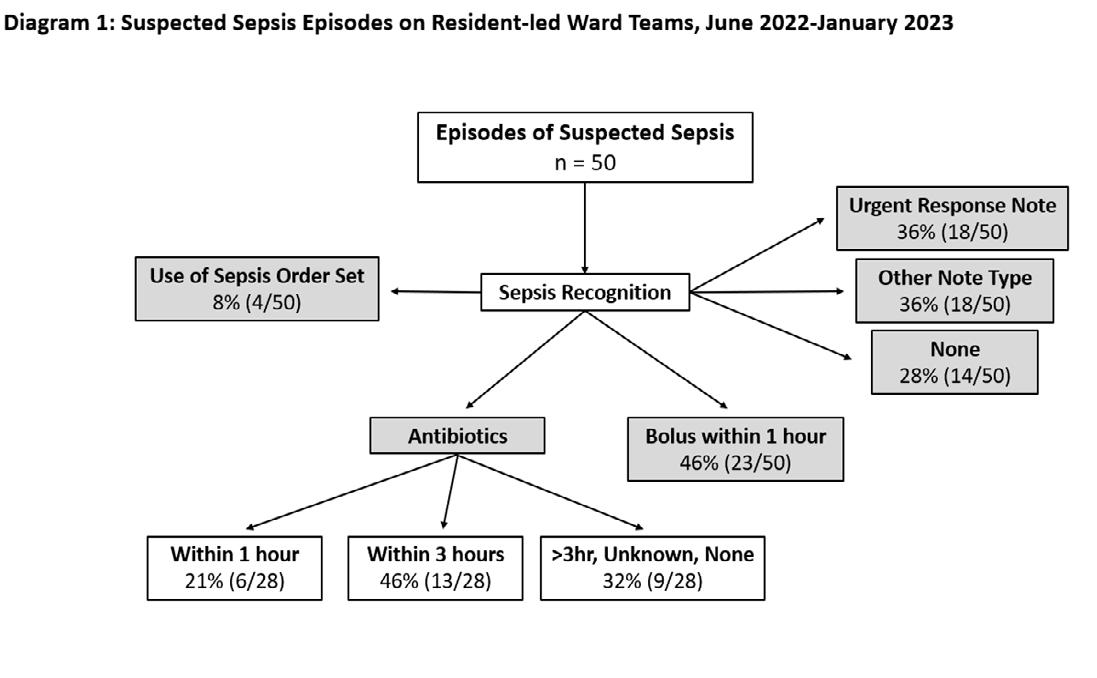
Severe sepsis and septic shock have significant morbidity and mortality in hospitalized pediatric patients. The determinants of mortality have been linked to education, specifically to delays in diagnosis and the lack of adherence to treatment guidelines. Through the sepsis guideline at Phoenix Children’s (PC), pediatric residents are often first to the bedside when patients are suspected of having sepsis. However, review of past data shows that residents utilize the Sepsis Order Set only 8% of the time and enter an Urgent Response note in only 36% of these episodes. Likewise treatment delays from point of sepsis recognition are common; the first fluid bolus was timely in only 46% of episodes while antibiotics were given appropriately within 3 hours only 68% of the time with time from recognition to order noted as the key delay (Diagram 1). Research has shown that resident learning through simulation and clinical case scenarios improves timely diagnosis as well as adherence to and execution of time-sensitive protocols. Education for pediatric residents at PC is a feasible and actionable component that can impact diagnosis, treatment, and ultimately improve patient outcomes. Therefore, we chose this initiative to improve resident recognition of sepsis with a global aim to improve the care of patients with sepsis at PC.
SPECIFIC AIM
For the purpose of this study, sepsis recognition is identified when an Urgent Response note is documented by the provider or when clinical orders are placed using the PC Sepsis Order Set. Although applications through the electronic medical record (EMR) provide universal sepsis screening and clinical notification, this will not constitute resident recognition as they are automated, captured 80% of episodes, and do not require resident activation.
1. Our primary aim is to increase timely treatment of pediatric patients on resident led ward teams with suspected sepsis to 80% through administration of first bolus within 1 hour and first antibiotic within 3 hours before December 2023.
2. Our secondary aim is to increase resident recognition of pediatric sepsis to 60% through use of the Sepsis Order Set or documentation of an Urgent Response note by December 2023.
DESCRIPTION OF INTERVENTION
Initial interventions planned as noted below with additional plans in development.
• Education through simulation: Adjusting existing monthly simulation for residents on wards (small groups of residents rotate through weekly) to use specific pediatric sepsis cases with high-fidelity manikins allowing hands-on learning for recognition and treatment. This also includes simulating use of the Sepsis Order Set with appropriate lab tests, bolus, and antibiotic orders. This was implemented 2.14.23.
• Education through case discussion – “Sepsis Sundays”: Weekly interactive teaching topics for wards residents utilizing pediatric sepsis cases implemented 2.5.2023.
• Education through Handouts, Posters, Emails: In combination with the resident wards curriculum, handouts regarding sepsis diagnosis/workup/management and the automated universal sepsis screening system at PC were created and placed in the K drive for resident access with an email notifying residents on 2.10.23. Resident team room laminated cards of these handouts completed 3.8.23.
• Education through Large Group teaching: Residents on ward teams attend a large group weekly teaching for one hour on Friday mornings called Morning Report. A session specifically about sepsis will be scheduled for April or May 2023.
Finalist
MEASURES AND RESULTS
Outcome Measures
• Frequency (%) of first fluid bolus within 1 hour for PC patients on resident-led ward teams with suspected sepsis.
• Frequency (%) of first antibiotic within 3 hours for PC patients on resident-led ward teams with suspected sepsis. Process Measures
• Frequency (%) of use of the Sepsis Order Set for PC patients on resident-led ward teams with suspected sepsis.
• Frequency (%) of Urgent Response notes documented for PC patients on resident-led ward teams with suspected sepsis.
Balancing Measures
• No change in resident satisfaction of patient care as it relates to alarm fatigue monitored by anonymous surveys before, every 2-3 months during, and after interventions.
IMPACT
Residents care for many of the patients admitted to the medical floor at PC and they are in a unique position to impact the treatment of patients with sepsis. In addition, they have structured education within their ward schedules. This combination allows for focused improvement in sepsis recognition and treatment metrics by the provision of sepsis specific educational interventions in already established teaching arenas. Timely recognition of sepsis is the first step to improve outcome measures, and a consistent teaching script will allow learning at all levels of training. Timing of resident teaching may also be an area of further interventions as more episodes of suspected sepsis happen during the resident night shift compared to day shift. These educational initiatives can show improvement and will be incorporated into PC resident ward teaching curriculum. However, additional interventions will be needed for sustainable systemic change with lasting effects. Timely recognition and treatment of pediatric sepsis is important to prevent morbidity and mortality. Improving these metrics through resident education will impact current and future patients who are admitted to PC.
Decreasing Contaminated Blood Cultures in the Emergency Department: A Multi-faceted Approach
AUTHORS
Primary: Cecilia Monteilh
Author(s)/Affiliations: Lucia Jauregui, RN; Jennifer Krause, PhD; Elizabeth Zorn, MD; Wassim Ballan, MD; Kelly Kelleher MD
BACKGROUND
Contaminated blood cultures are a costly and burdensome issue affecting the healthcare of our patients. Skin bacteria causing contaminating blood cultures increases unnecessary blood draws, returns to the hospital, further tests for evaluation of infection, unnecessary antibiotics, hospital admissions and overall hospital costs. A blood culture is diagnostically important to identify the presence of a blood stream infection and to guide the appropriate choice of antibiotics. The technique in which the culture is drawn, the amount of blood obtained, and accurate handling of the culture all affect the accuracy of the culture. Additionally, many blood cultures may not be clinically indicated. Our Pediatric Emergency Department (PED) is seeking to decrease our skin bacteria contamination rate utilizing a multi-step and multi disciplinary approach.
SPECIFIC AIM
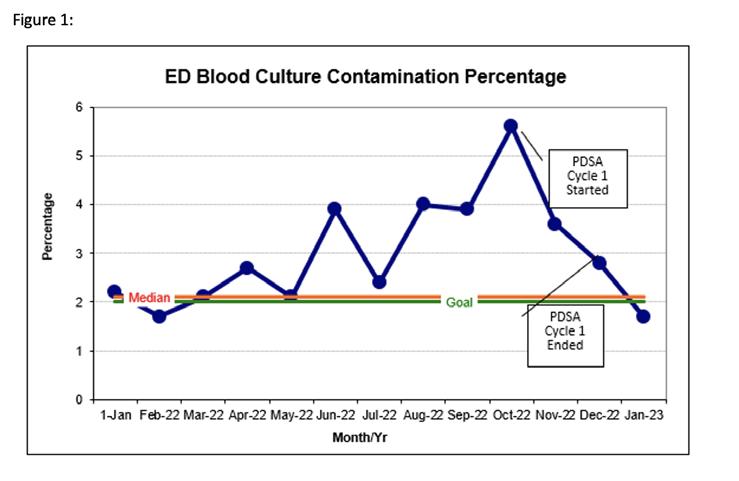
Decrease the blood culture contamination rate in the PED from 3.1% in 2022 to 2.0% over the course of a year by implementing multiple PDSA cycles.
DESCRIPTION OF INTERVENTION (IMPROVE AND CONTROL)
PDSA Cycle #1: The first intervention involved focused nursing education to new ED hires. All nurses hired after May 2022;125 total, were trained in proper aseptic technique when obtaining blood cultures during their clinical skills sessions. This intervention ran from October 2022-December 2022.
PDSA Cycle #2: The second intervention started February 2023 and will continue until June 2023. An audit is performed after blood culture draws within the PED. Audits can be performed by the bedside nurse, technician, clinical supervisor, or trauma nurse in the room at the time. Analysis of this information will allow us to see if there is a consistent step where a break in aseptic technique happened so we can focus education on these areas.
PDSA Cycle #3: The third intervention; July 2023-September 2023, will be to implement institutional blood culture ordering guidelines, based on previous publications in this area, to educate via an educational series to PED providers and rotating residents on indications for blood cultures. These guidelines have been created with input from infectious diseases, pharmacy, laboratory, key stakeholders from the emergency department, inpatient pediatrics, critical care, and oncology. Eventually, these guidelines will then be incorporated into a single order set that reminds providers of the indications for ordering a blood culture. If there is not an indication for the blood culture order, the provider will be alerted to this and will then be asked if a blood culture should still be ordered. Subsequently, ordering the blood culture will be at the provider’s discretion.
PDSA Cycle #4: The fourth intervention; October 2023-December 2023, will be to ensure that an adequate volume of blood, based on the patient’s weight, is obtained when procuring a blood culture. This will optimize the sensitivity of blood cultures and bring our institution closer to industry standards.
METRICS (MEASURE AND ANALYZE)
Our primary outcome measures will be total numbers of contaminated blood cultures and of blood cultures obtained. Our process measure will estimate the savings in charges between the observed and expected contaminants and the decrease of total cost to laboratory with decreased blood cultures ordered.
IMPACT/CONCLUSION
This multi faceted approach requires education at all levels of the emergency department from proper aseptic technique to blood culture indications. The sequential PDSA cycles will repeatedly reinforce educational topics for technicians, RN’s, advanced practice providers, and physicians. Order set development will sustain this practice as learners rotate and provide consistent reinforcement of blood culture indications. The PED is serving as a trial for potential institutional changes to reduce the overall blood culture contamination rate within the entire hospital.

A Quality Improvement Project to Improve COVID-19 Vaccination
Rates and Address Barriers to Immunization in
the Pediatric Population
AUTHORS
Primary: Joanna Kramer, DO
Author(s)/Affiliations: Kristen Samaddar, MD; Meggan Roman, DO; Carly Wujek, MD; Jason Abbott, MD; Jennifer Farabaugh MPH; Julia Wise, RN
BACKGROUND
Due to vaccine hesitancy, misinformation and systems barriers, COVID-19 continues to cause significant morbidity and mortality in children despite availability of a safe vaccine. Our quality improvement study aims to increase vaccine availability and minimize barriers to best serve our pediatric patients.
SPECIFIC AIM
To improve the rate of first dose COVID vaccine completion in patients for whom a vaccine order is placed in the Phoenix Children’s Hospital Division of Primary, Complex Care, and Adolescent Medicine outpatient clinic from a baseline average of 44% to >80% within 6 months and sustain for 1 year.
METHODS
Prior to having the vaccine available in our clinic a baseline was established by assessing the proportion of vaccinations ordered versus vaccinations administered at our facility’s drive through vaccine podor other community sites. Subsequently we employed interventions such as establishment of in-office vaccination and providing educational materials through sequential PDSA cycles corresponding to various age groups and dose numbers.
RESULTS
Between September 2021 and August 2022 there were 489 orders placed for Dose 1 of the COVID vaccine. Within one month of offering in-clinic COVID-19 vaccines to eligible patients, our completion rate of ordered first-dose immunizations to patients 5 years and older had increased from 44% to 72% between March and April of 2022. After introduction of our informational newsletter in April 2022, this number (72%) continued to rise to well-above our initial goal of 80% completion, reaching 89% completion by May 2022.
CONCLUSION
These data demonstrate the benefit of offering immediately available COVID-19 vaccines compared to patients’ previous, less convenient option which required them to make an additional appointment at a separate location for administration of the vaccine. It also highlights how providing useful, tangible information can optimize parental and patient comfort with the vaccine. By providing these things, we optimize convenience, transparency, accessibility and likelihood of vaccinations, ultimately resulting in increased protection of our pediatric patients against COVID-19.
Improving Lead Screening and Follow-up in Refugee Patient Populations
AUTHORS
Primary: Brianna Leyden, MD
Author(s)/Affiliations: Robert Lloyd, DO; Emily Manion, MD; Anna Baker, MD, MS; Carlos Vargas, MD; Meghan Cusack, MD; Aaron Heston, MD; Rachel Mardis, MD; Devan Stucki, MD; Meera Devarajan, MD; Jennifer Lemke, MD; Nadia Manivong, MD; Mary Beth Putz, MD, MPH; Kamala Vallabhaneni, MD
BACKGROUND
Elevated lead levels, a public health concern that can be easily screened for with a blood sample, disproportionally affect resettled refugee children compared to children born in the United States. Lead exposure is insidious, even at lower levels, but symptoms can increase in severity even to death. Refugee children have a variety of environmental exposures in their country of origin from soil, dust, cookware, makeup, and food. Even so, the largest risk factor for refugee families is urban housing built before 1978 with deteriorated lead-based paint. As such, children can have continued risk in the United States after resettlement. This exposure stems from environmental and socioeconomic inequality in this population. For this reason, it is vital for lead screening to include a history of risk factors or potential exposures and developmental history. Per CDC guidelines, all children and adolescents younger than 16 years old should be provided an initial lead screening upon arrival from their country of origin, and children younger than 6 should have a repeat screening 3-6 months after their initial test. Adolescents older than 16 years of age should be screened based on clinical suspicion.
A 2019 study found that nearly 1 in 5 refugee children have an elevated blood lead level1. In fact, 17% of children refugees have been found to have blood lead levels (BLLs) of at least 5 μg/dL, and this number nearly doubled by follow-up. Due to their elevated risk, refugee populations should be closely screened to prevent severe neurotoxic effects associated with high BLL. This is especially important in safety-net clinics like Valleywise Comprehensive Health Center. Each year, Arizona welcomes more than 3,000 refugees; last year, approximately 1,900 of which were Afghan in origin. Since the beginning of the refugee resettlement program 30 years ago, over 60,000 refugees from 109 countries have settled in Arizona, creating a larger population that remains vulnerable to slipping through the cracks of our healthcare system2.
SPECIFIC AIM
We aim to improve adherence to CDC lead screening guidelines for our refugee population at the Comprehensive Health Center by:
1. Increasing rate of repeat lead screening in refugee patients 6 months to 6 years of age within 3 to 6 months post arrival from 52% to 60% by end of January 2023.
2. Increasing rate of repeat lead screening in refugee patients 6 months to 16 years of age with initial elevated lead levels within 3-6 months from 59% to 70% by end of January 2023.
DESCRIPTION OF INTERVENTION (IMPROVE AND CONTROL)
Given the influx of Afghan refugees over the last year, the initial patient population was limited to Dari, Farsi, or Pashtospeaking patients seen at the primary site of the Valleywise Health Pediatric Refugee Clinic. Manual chart review was done on patients aged 6 months – 16 years at time of visit between the dates of 3/1/2021-3/1/2022 to determine if repeat lead screening was obtained within 6 months of the initial level. Charts were also reviewed to determine if screening records from the Maricopa County Department of Public Health (MCDPH) were recorded in our system, a standard initial intake process that was disrupted for these Afghan refugees due to the rapid nature of their resettlement. PDSA cycles and QI protocols were used to implement several strategies to improve rates of screening, documentation, and follow-up that included the following: resident and provider education, EPIC shortcuts with dot phrases, and problem list utilization to flag providers. The first intervention was implemented on 10/1/2022 and included education with flyers distributed to the residents and attendings of the continuity clinics. Future interventions were planned upon analyzing the key driver diagram and success of previous interventions.
OUTCOMES MEASURES AND RESULTS
Baseline Data:
A. Rate of repeat lead screening in 3-6 months for 6mo-6yr: 52%
B. Rate of repeat lead screening in 3-6 months after initial elevated screen: 59%
Outcome Measures after first interventions:
A. Rate of repeat lead screening in 3-6 months for 6mo-6yr: 62%
B. Rate of repeat lead screening in 3-6 months after initial elevated screen: 75% Process Measure:
A. Rate of documentation of MCDPH lead levels in our system: 52%
B. Rate of documentation of MCDPH lead levels in our system following implementation of interventions: 48%
IMPACT/CONCLUSION
This project identified several gaps in the intake process for our Afghan refugee patients, including obtaining initial records from the Maricopa County Department of Health and proof of baseline lead screenings. Although the initial aims of our project were achieved, we noted areas of improvement in education and workflow in ensuring adequate followup. Our changes may provide immediate benefit to treating refugee patients, including increasing provider education, developing order sets, and adding lead screening to the problem list and health maintenance tabs to standardize this care like immunization administration. Future goals include expanding these interventions to refugee populations beyond the Dari/Farsi/Pashto speaking group and adapting this model for other clinics that see refugee patients outside of the Valleywise system.
REFERENCES
1. Clelia Pezzi, Deborah Lee, Lori Kennedy, Jenny Aguirre, Melissa Titus, Rebecca Ford, Jennifer Cochran, Laura Smock, Blaine Mamo, Kailey Urban, Jennifer Morillo, Stephen Hughes, Colleen Payton, Kevin Scott, Jessica Montour, Jasmine Matheson, Mary Jean Brown, Tarissa Mitchell; Blood Lead Levels Among Resettled Refugee Children in Select US States, 2010–2014. Pediatrics May 2019; 143 (5): e20182591. 10.1542/peds.2018-2591
2. “Refugee Health Overview.” Arizona Department of Health Services Refugee Health Program, 2022.
Implementation of Fluoride Varnish Application in an Urban Primary Care Clinic: A Tale of Healthier Teeth
AUTHORS
Primary: Kaitlyn Bates
Author(s)/Affiliations: Nisha Issac, Lucia Gonzalez Llanos, Ali Palacios, Riley McCarthy, Stephanie Ringle, Bethany Farretta, Jessica Resnick, Jami Longo, Michael Stephens, Makayla Cox, Ben Severseike, Kristen Samaddar
BACKGROUND
Dental caries are the most common chronic disease of childhood in the United States.1 Caries develop when bacteria break down carbohydrates and create the byproduct of acid. Over time, and with repeat exposures, the acid demineralizes the enamel leading to dental carries.2 To combat this, fluoride is essential for promoting remineralization and inhibiting demineralization, and fluoride varnish has been shown to reduce the incidence of dental carries. According to the CDC (Centers for Disease Control), many young children have not yet seen a dentist (80.2% of 1-year-olds, 49.7% of 2-yearolds). Because of these findings, the USPSTF recommends application of fluoride varnish by primary care clinicians to all patients under the age of 5 following their first tooth eruption.3 In Arizona, fluoride varnish is covered under AHCCCS (Arizona Health Care Cost Containment System) at Well Child Checks (WCC) until 24-months of age and must be applied by a provider.
SPECIFIC AIM
Offer fluoride varnish for >25% of WCC at ages of 12-, 18-, and 24-month at Phoenix Children’s division of Primary, Complex Care and Adolescent Medicine by June 30, 2023.
METHODS
Since fluoride varnish is a new process for our clinic, we had to do several interventions before the varnish was even available for use. In October 2022, we ensured that all faculty physicians were trained through an online module. We created a team workflow utilizing our medical assistants (MAs) to place fluoride in the rooms of the appropriate WCCs. In November 2022, we presented our rationale to the Pharmacy and Therapeutics committee who approved fluoride use in our clinic. In December, we changed the EMR to include documentation of prior dental care, a fluoride procedure note, and check boxes of application or refusal in the plan. Parents were educated on the new process with an informational flier in Spanish and English from the Arizona Department of Health Services. In January, we created a video for residents demonstrating how to apply fluoride varnish, provide after care instructions, and document in the chart. We are still awaiting an automated monthly report at which point we can do further PDSA cycles to overcome additional barriers.
RESULTS
January 2023 data was obtained by manual chart review. We identified 88 potential well-child checks. Of those, 2 were ineligible for fluoride application as they had received it from their dentist within the last 3 months. Families declined application during 9 visits. Of the remaining 77, fluoride varnish was applied for 15 patients, yielding a 19.4% application rate in eligible visits.
IMPACT/CONCLUSION
Applying fluoride varnish in our clinic required approval from pharmacy staff, training of providers and ancillary staff, ordering product, and creation of materials for both families and providers. These initial steps comprised the first six months of this project. Following completion of staff training and establishment of workflow for fluoride varnish application, we reviewed one month of data demonstrating application in nearly 20% of eligible visits, just shy of the initial goal of 25% of visits. Future interventions to exceed the 25% goal will include steps to make fluoride varnish consistently accessible in the exam rooms as well as targeted training for providers with missed opportunities.
REFERENCES
1. Centers for Disease Control and Prevention. (2022, April 6). Children’s oral health. Centers for Disease Control and Prevention. Retrieved March 4, 2023, from https://www.cdc.gov/oralhealth/basics/childrens-oral-health/index. html#:~:text=Cavities%20(also%20known%20as%20caries,speaking%2C%20playing%2C%20and%20learning.
2. Davies, G. M., Bridgman, C., Hough, D., & Davies, R. M. (2009). The application of fluoride varnish in the prevention and control of dental caries. Dental update, 36(7), 410–412. https://doi.org/10.12968/denu.2009.36.7.410
3. US Preventive Services Taskforce. (2021, December 7). Prevention of dental caries in children younger than 5 years: Screening and interventions. Recommendation: Prevention of Dental Caries in Children Younger Than 5 Years: Screening and Interventions | United States Preventive Services Taskforce. Retrieved March 4, 2023, from https:// www.uspreventiveservicestaskforce.org/uspstf/recommendation/prevention of dental caries in children younger than-age-5-years-screening-and-interventions1
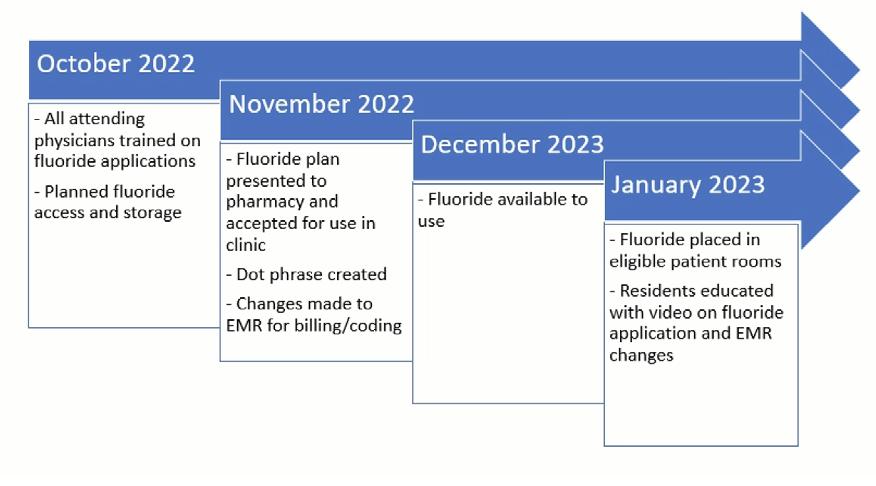
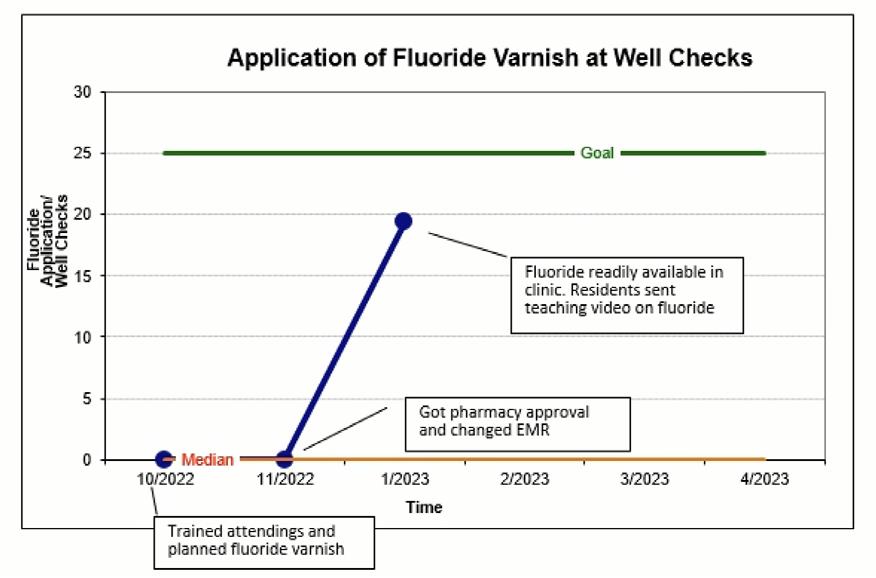
Utilizing Automated Alerts and Encouraging Bundle-Based Care to Improve Sepsis Outcomes at Phoenix Children’s
AUTHORS
Primary: Megan Fields
Author(s)/Affiliations: Vishal Gunnala, MD
BACKGROUND
Approximately 40,000 American children are hospitalized annually for sepsis. Nearly 1 in 8 of these children die, and those who live often suffer significant morbidity. Phoenix Children’s is a member of the Improving Pediatric Sepsis Outcomes (IPSO) collaborative. This is a growing group of nearly sixty children’s hospitals united to improve sepsis mortality by implementing tools for earlier recognition and encouraging a bundle based care approach. Although Phoenix Children’s currently has a sepsis alert to facilitate timely recognition of pediatric sepsis, our institution’s response to the alert, including huddle activation, order set utilization, and time to first antibiotic, currently falls below goals created by the collaborative.
SPECIFIC AIM
With increased education efforts and updating the sepsis alert order set, we aim to increase our huddle activation and order set utilization from 12 to 30% and 36 to 50%, respectively, and to decrease our time to antibiotics from 133 minutes to 100 minutes all by December 2021.
DESCRIPTION OF INTERVENTION (IMPROVE AND CONTROL)
Pediatric interns were the primary targets for initial interventions. New interns were provided an educational session on sepsis definitions and clinical signs and symptoms of sepsis and shock in 2021 and 2022. Instructions for responding to sepsis alerts, documenting, and placing orders were also reviewed. Resident physicians now also have the opportunity to practice assessing and resuscitating septic patients with simulation. In 2021, multiple sepsis-themed cases were added to the inpatient pediatric wards simulation curriculum. These cases stressed the importance of keeping sepsis on the differential and to solidify the presentation of pediatric septic shock.
The Phoenix Children’s sepsis team has also updated the sepsis algorithm to reflect the 2020 Surviving Sepsis Campaign guidelines. The guideline now focuses on a team based approach to care, encouraging a provider huddle and time out to communicate concerns and streamline management. Additionally, the algorithm includes decision points to quickly identify patients in shock and those needing a higher level of care.
MEASURES AND RESULTS
• Outcome measures: 30-day sepsis mortality at Phoenix Children’s
• Process measure: Time to antibiotic (minutes), huddle activation (% completed after alert firing), and order set utilization (% used after alert firing)
• Balancing measure: No balancing measure was included during this PDSA cycle.
IMPACT/CONCLUSION
Algorithm updates and a focus on resident education yielded improvement in order set utilization and huddle activation (36% to 46%, 12 to 25%). Time to antibiotic administration continued to increase (133 to 158 minutes). We did not quite reach our goal for 2021 regarding order set utilization and huddle activation, although we outperformed the aggregate in order set utilization. Additionally, the Phoenix Children’s 30-day sepsis mortality rate has not displayed a statistically significant increase, and we continue to have a steady centerline below the aggregate’s. Currently the order set update is still being finalized by IT, however it has been approved by multiple care teams throughout the hospital. Hospital medicine, ED, hematology/oncology, and the ICU will soon have order sets tailored to their care areas. A unique challenge continues to be how to capture huddle activation.
Time to antibiotic administration has also been difficult to measure. In care areas outside of the ED, recent antibiotic administration may have preceded alert triggering, thus delaying the perceived time to antibiotic measurement. Additional data filtering, including time to new antibiotic administration, is likely needed to determine better processes to effect significant change in this area.
Including a balancing measure is imperative as our team begins the next PDSA cycle with a new order set. Alert fatigue is a common concern with electronic health records and automated alerts. Provider surveys assessing this will be included in future efforts.
REFERENCES
Challenge sepsis change lives. Children’s Hospital Association. Retrieved March 6, 2023, from https://www. childrenshospitals.org/content/quality/product program/challenge sepsis change lives.
Cruz, A. T., Lane, R. D., Balamuth, F., Aronson, P. L., Ashby, D. W., Neuman, M. I., Souganidis, E. S., Alpern, E. R., & Schlapbach, L. J. (2020). Updates on pediatric sepsis. Journal of the American College of Emergency Physicians Open, 1(5), 981–993. https://doi.org/10.1002/emp2.12173.
Weiss, S. L., Peters, M. J., Alhazzani, W., Agus, M. S., Flori, H. R., Inwald, D. P., Nadel, S., Schlapbach, L. J., Tasker, R. C., Argent, A. C., Brierley, J., Carcillo, J., Carrol, E. D., Carroll, C. L., Cheifetz, I. M., Choong, K., Cies, J. J., Cruz, A. T., De Luca, D., … Tissieres, P. (2020). Surviving sepsis campaign international guidelines for the management of septic shock and sepsis-associated organ dysfunction in children. Pediatric Critical Care Medicine, 21(2). https://doi.org/10.1097/ pcc.0000000000002198.
QILM ABSTRACTS
Phoenix Children’s Hospital Quality Improvement, Leadership, and Management Program
Phoenix Children’s in collaboration with the College of Health Solutions at Arizona State University (ASU) has identified key opportunities to support and enhance the quality improvement, leadership, and management skills for Phoenix Children’s physician and advanced practice providers.
The Quality Improvement, Leadership and Management Program (QILM) is rooted in providing Phoenix Children’s clinicians learning opportunities to expand their approach to QI initiatives and develop capabilities that strengthen leadership and management efforts in achieving outcomes through the leadership and development of others. Several of our strongest submissions were among these individuals. Course participants for the last 2 years and abstracts submitted this year.
Anyone interested in taking the course in the upcoming year, please contact Dr. Rick Engel, rengel@phoenixchildrens.com. Many thanks to our sponsors Steve and Michal Castle of the Castle Real Estate Group, whose generosity through the Phoenix Children’s Foundation helped make this possible.
Course Participants
September 2022 – April 2023 Session
Navin Bhopal, MD - Neonatology
Jessica Wickland, MD - Neonatology
Ashley Mancuso, RN - Clinical Nurse Attending
Ben Padilla, MD - Surgery
Vedant Gupta - Hospitalist
Iris Marku, PNP-AC - Neurology
Wassim Ballan, MD - Infectious Disease
Christian Armstrong, PharmD - Pharmacy, Antibiotic Stewardship
Katherine Harrison, NP - CVICU
Anita Bharath - ED
September 2021 – March 2022 Session
Rob Gonsalves, D.O. - Endocrinology
Julie Augenstein, M.D. - ED; Med Dir Quality/Safety
Vishal Gunnala, M.D. - Critical Care
Karen Yeager, D.O. - ED
Kaleo Ede, M.D. - Rheumatology
Joe Mangone, D.O. - Hospitalist; HRU leader
Wendy Arafiles, M.D. - Hospitalist; Med Dir Documentation
Joanna Kramer, D.O. - General Pediatrics
Arie Zakaryan, PhD - Psychology
Ambika Sohal, D.O. - Hematology/Oncology
Richard Engel, MD
Phoenix Children’s
Associate Division Chief, Hospital Medicine
Medical Director, Quality Improvement
Clinical Associate Professor, University of Arizona College of Medicine-Phoenix
2023 Quality Day Finalist
Improving the Rate of Necrotizing Enterocolitis in the NICU
Primary: Navin Bhopal, MD
Author(s)/Affiliations: Amy Brown, MD; Ian Kloehn, MD; Amaris Tapia, MS4; Nisha Patel, RD; Rhonda Kurz, PharmD; Megan Shea, NNP; Nanette Whittington, NNP; Pam Griffiths, MD; Michelle Weller, IBLCE; Mohammed Elkhwad, MD; Gregg Martin, MD
Improving Communication in NICU Post-Operative Handovers
Primary: Jessica Wickland, MD
Author(s)/Affiliations: Kristen Farnsworth, NNP
2023 Quality Day Honorable Mention
A Quality Improvement Project to Improve COVID-19 Vaccination Rates and Address Barriers to Immunization in the Pediatric Population
Primary: Joanna Kramer, DO
Author(s)/Affiliations: Kristen Samaddar, MD; Meggan Roman, DO; Carly Wujek, MD; Jason Abbott, MD; Jennifer Farabaugh, MPH; Julia Wise, RN
2023 Quality Day Accepted Abstract
Standardizing Treatment of Necrotizing Enterocolitis in Infants
Primary: Navin Bhopal, MD
Author(s)/Affiliations: Amaris Tapia, MS4; Ian Kloehn, MD; Christian Armstrong, PharmD; Wassim Ballan, MD; Kim Allred, DNP; Mark Molitor, MD; Rhonda Kurz, PharmD; Nicholas Huggins, MD; Nisha Patel, RD; Megan Shea, NNP; Josienne Prinz, RN; Molly King, PNP; Marisa Sarsoza, RD; Pam Griffiths, MD; Josh Koch, MD; Gregg Martin, MD
Improving Identification and Treatment of Neonatal Late Onset Sepsis in the NICU
Primary: Ashley Mancuso RN, MSN, RNC-NIC
Author(s)/Affiliations: Jessica Wickland, MD
Percent of Correctly Ordered Amoxicillin/Clavulanate at Phoenix Children’s
Primary: Christian Armstrong, PharmD
Author(s)/Affiliations: Wassim Ballan, MD
ACCEPTED ABSTRACTS
Improving Pediatric Critical Care Medicine (PCCM)
Fellows’ Schedule
AUTHOR
Primary: Lauren Schopman
BACKGROUND
The effect of sleep deprivation on performance by physicians-in-training is well documented in the literature. In 2002, the Accreditation Council for Graduate Medical Education published new requirements limiting resident and fellow shifts to twenty four hours, with an additional period to ensure continuity and transfer of care.1 Despite this change, physicians in training continue to report attentional failures and fatigue-related adverse events.2-7 In the intensive care unit, extended work hours are associated with 36% more serious medical errors and 5 times as many serious diagnostic errors.8 In addition, physicians in training are more likely to suffer needlestick injuries and are more likely to be involved in motor vehicle crashes when driving home after more than 24 hours of work.9,10
At Phoenix Children’s, Pediatric Critical Care fellows have historically followed a twenty four hour call schedule, completing extended shifts every four to five days. Fellows reported dissatisfaction with the schedule and concern for patient safety due to fatigue and sub par decision making. They also reported that the schedule was unpredictable and failed to provide adequate continuity of care.
METHODS
Starting in the 2021-2022 academic year, the fellowship transitioned to a day/night schedule, also called a night float schedule. Fellows were assigned exclusively to day shift or night shift for three to seven consecutive days, and extended shifts were dramatically reduced. The aim of the study was to achieve 70% overall satisfaction with the schedule and 70% satisfaction with continuity of care within 12 months of transitioning to the new schedule format. Follow up surveys were sent several times through the year asking fellows about their satisfaction with the new schedule format, and included an area for fellows to leave comments.
RESULTS
Ten out of twelve fellows responded to the first survey, which was sent two months after working with the adjusted schedule. Fifty percent of fellows reported that they preferred the new night float format and 50% were indifferent or felt it was too soon to say (Figure 1). Several fellows commented that transitioning off of night float to an extended weekend shift was challenging, and the schedule template was revised to eliminate this transition (Figure 2). An additional survey was sent five months after working with the adjusted schedule. Nine out of twelve fellows responded. Eighty-nine percent (89%) of fellows reported that they were more satisfied with the night float schedule compared to a traditional 24-hour call schedule.
DISCUSSION
The goal of 70% fellow satisfaction with the new night float schedule was met within several months of the transition. The main reason for the transition to a new schedule was fellows’ dissatisfaction and concern about fatigue related medical errors. Though we were not able to objectively measure the effects of fatigue on attentiveness, decision making, and patient safety, fellows’ overall improved satisfaction with the new schedule indicates a safer environment. Poor continuity of care, which has been associated with preventable adverse events,11 was also improved with the new schedule. The night float format was approved by the Pediatric Critical Care program leadership and continued into the 2022-2023 academic year.
REFERENCES
1. Philibert I, Friedmann P, Williams WT, Education AWGoRDHACfGM. New requirements for resident duty hours. JAMA. Sep 04 2002;288(9):1112-4. doi:10.1001/jama.288.9.1112
2. Barger LK, Ayas NT, Cade BE, et al. Impact of extended-duration shifts on medical errors, adverse events, and attentional failures. PLoS Med. Dec 2006;3(12):e487. doi:10.1371/journal.pmed.0030487
3. Eastridge BJ, Hamilton EC, O’Keefe GE, et al. Effect of sleep deprivation on the performance of simulated laparoscopic surgical skill. Am J Surg. Aug 2003;186(2):169-74. doi:10.1016/s0002-9610(03)00183-1
4. Gaba DM, Howard SK. Patient safety: fatigue among clinicians and the safety of patients. N Engl J Med. Oct 17 2002;347(16):1249-55. doi:10.1056/NEJMsa020846
5. Lockley SW, Barger LK, Ayas NT, et al. Effects of health care provider work hours and sleep deprivation on safety and performance. Jt Comm J Qual Patient Saf. Nov 2007;33(11 Suppl):7-18. doi:10.1016/s1553-7250(07)33109-7
6. Philibert I. Sleep loss and performance in residents and nonphysicians: a meta-analytic examination. Sleep. Nov 2005;28(11):1392-402. doi:10.1093/sleep/28.11.1392
7. Lockley SW, Cronin JW, Evans EE, et al. Effect of reducing interns’ weekly work hours on sleep and attentional failures. N Engl J Med. Oct 28 2004;351(18):1829-37. doi:10.1056/NEJMoa041404
8. Landrigan CP, Rothschild JM, Cronin JW, et al. Effect of reducing interns’ work hours on serious medical errors in intensive care units. N Engl J Med. Oct 28 2004;351(18):1838-48. doi:10.1056/NEJMoa041406
9. Ayas NT, Barger LK, Cade BE, et al. Extended work duration and the risk of self-reported percutaneous injuries in interns. JAMA. Sep 06 2006;296(9):1055-62. doi:10.1001/jama.296.9.1055
10. Barger LK, Cade BE, Ayas NT, et al. Extended work shifts and the risk of motor vehicle crashes among interns. N Engl J Med. Jan 13 2005;352(2):125-34. doi:10.1056/NEJMoa041401
11. Petersen LA, Brennan TA, O’Neil AC, Cook EF, Lee TH. Does housestaff discontinuity of care increase the risk for preventable adverse events? Ann Intern Med. Dec 01 1994;121(11):866-72. doi:10.7326/0003-4819-121-11199412010-00008
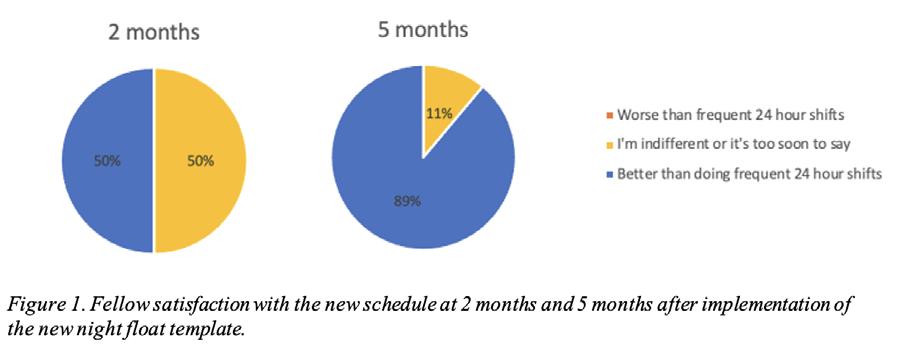
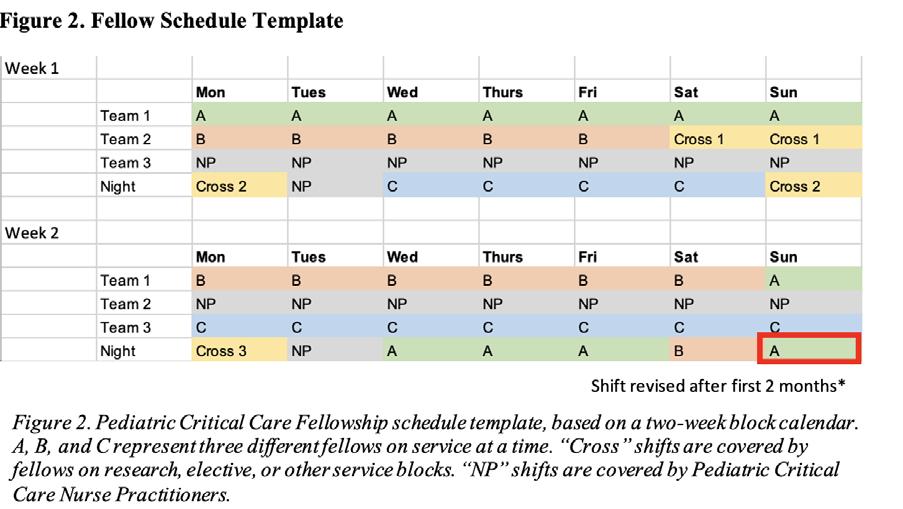
Implementation of an Electronic Medical Record Power BI Dashboard to Improve Inpatient Care for Patients with Adrenal Insufficiency
AUTHORS
Primary: Chirag R Kapadia, MD
Author(s)/Affiliations: Varshini Chakravarthy, MD; Dorothee Newbern, MD; Linda Black, RN; Pierina Ortiz, Data Analyst; Vinay Vaidya, MD; Robert Gonsalves, DO
BACKGROUND
Time to onset of steroid adminsitration for AI patients is critical to ensure inpatient safety of this population. We developed as series of data tools to assist with this. This included an alert in the EMR, a morning email for new AI admits to the Endocrine on call team, and standardized documentation methods.
SPECIFIC AIM
Our primary aim was increase the percentage of patients with adrenal insufficiency (AI) who receive orders for and adminstration of, steroids within 6 hours of admission. Our secondary aim was to increase the percentage of patients with inpatient endocrine documentation for this condition utilizing standardized documentation methods.
METHODS
In collaboration with our IT data analytics team, we developed a PowerBI data dashboard/database to track various metrics in patients with adrenal insufficiency. The metrics were: % with Endocrine note during admission, % with steroids ordered within 6 hours, and % with steroids administered within 6 hours. We then developed an alert in the EMR that appears to each provider involved in the care of the patient, once a week; a once daily morning email to the Endocrine on call team with a list of newly admitted patients with this diagnosis; and a standarized ‘button’ in our EMR that calculates/ fills in stress dose documentation.
RESULTS
In 2021 full year, results were: 42% with Endocrine note, 84% with steroids ordered within 6 hours/63% steroids given within 6 hours of admission.
In 2022 full year, we achieved the following results: 61% with Endocrine note, 88% with steroids ordered within 6 hours/73% steroids given within 6 hours of admission.
When we review the final 6 months of 2022, we see: 69% with Endocrine note, 90% with steroids ordered within 6 hours/ 78% steroids given within 6 hours of admission.
Admission for the purposes of this study was defined as the first point of contact, such as, arrival time in the emergency room.
IMPACT/CONCLUSION
Implementation of a dashboard within our EMR greatly improved our ability to track patient outcomes and led to a significant increase in the percentage of patients with adrenal insufficiency receiving steroids within 6 hours of arrival. PowerBI dashboards, combined with daily email alerts to an on call team generated from this dashboard, can provide an easy to view, actionable data gathering mechanism for many discrete conditions. Given our success and the importance of these outcomes, we are eager to share more about our detailed methods with other divisions should they be interested in taking this approach to other disease states.
Improving
Quality of Care Among Patients with Newly Diagnosed Type 2 Diabetes Utilizing the Combination of a Power BI Dashboard in Addition to Manual Chart Review Efforts
AUTHORS
Primary: Linda A Black
Author(s)/Affiliations: Linda A Black BSN, RN; Maria Silva MHA, RDN, CDCES; Sandra Chmelnik MPH, RDN, CDCES; Yessica Chavez, AOP; Vinay Vaidya, MD; Pierina Ortiz, MS; Stefanie Black, IT Data Reporting; Rob Gonsalves, DO; Chirag Kapadia, MD
BACKGROUND
Complication rates of Type 2 Diabetes Mellitus (T2DM) are extremely high nation-wide with greater than 50% of patients showing complications at 5 years after diagnosis. T2DM in children is often deeply connected to underlying disadvantages related to socioeconomic status. Locally, we saw a more than doubling of new instances of T2DM with the onset of the COVID pandemic, and this has been noted in many pediatric centers in the US. It is thought that a combination of COVID infections (which can affect insulin-producing pancreatic beta cells) and negative impact on lifestyle such as reduced activity and poor diet may have played a role in this occurrence. COVID has also affected the care of our established patients, including a high percentage of patients being lost to follow up. We set out in early 2022 to use both manual and automated data-gathering methods to improve the care for this population. Because the first 2-4 months following diagnosis are the most critical for establishing metabolic control, our primary aim was directed at improving the hemoglobin A1c (HbA1c) of newly diagnosed patients as outlined below. Our secondary aim was directed at re-establishing care with high-risk patients, defined by HbA1c greater than 9.5%, who were lost to follow up.
SPECIFIC AIM
To increase the percent of patients that achieve an HbA1c level below 8.0% within 6 months of diagnosis from baseline of 42% to greater than 60% over a 1-year period from 2022 to 2023.
Secondary aims were directed toward decreasing the number of high-risk patients who have not had a clinic visit within 90 days and had no follow up in place.
DESCRIPTION OF INTERVENTION (IMPROVE AND CONTROL)
A new onset tracking database was created and manually tracked by our Certified Diabetes Care and Education Specialist (CDCES) team within our CARE T2DM Program. This database included tracking of patient appointments and medications over approximately the first 4 months after their diagnosis. Our CDCES team plays a crucial role regarding patient care and communication that begins days after hospital discharge, and this relationship is further fostered at subsequent follow-up visits. We have found patients that attend these visits and continue with CDCES communication have a higher likelihood of continued follow-up and success. We therefore decided to use percentage of patients actively following with a CDCES and provider at the 10-week time point as process measures, as these metrics would indicate that our manual tracking database was working as intended. For established T2DM patients, we created a PowerBI Dashboard (Figure 1) and a monthly report that defined this population by diagnosis code. Once the population was defined, our data tools gave us breakdowns by HbA1c, body mass index, and other patient characteristics. These tools also provided us a list of patients who had not been seen for greater than 90 days and had no additional/new appointments scheduled for the future. From this “Missed Visits List”, we created a subset list which we reached out to monthly to make efforts to get them re engaged with medical care.
OUTCOME MEASURES
• Percent of newly diagnosed T2DM patients with A1c below 8% by 6 months after new diagnosis.
• Number of T2DM patients with HbA1c higher than 9.5% and no visit within the past 3 months.
PROCESS MEASURES
• Percent of patients actively following with our providers at 10 weeks after new diagnosis
• Percent of patients actively following with CDCES at 10-weeks after new diagnosis.
RESULTS
The percentage of patients that achieved an A1c below 8% by 6 months after diagnosis increased from 42% to 80%. The percentage of patients actively following with our providers at 10-weeks after new diagnosis increased from 57% to 72%, and those patients following with our CDCES team 10-weeks after new diagnosis increased from 42% to 76%. Our missed visits for patients with A1c > 9.5% remained unchanged at approximately 50 by year end.
IMPACT
We were able to achieve our primary aim with the use of a manual tracking system that significantly increased follow-ups with our CDCES team and providers. Despite these improvements, one-quarter of our newly diagnosed patients are still lost to follow-up by the 10-week appointment, demonstrating the challenges of caring for this patient population. We will therefore continue directing efforts toward creating and maintaining close relationships at diagnosis. The use of a PowerBI dashboard creates a sustainable way to easily and efficiency identify established patients who were subsequently lost to follow-up. Despite significant effort, it was difficult to re-engage them in medical care after a prolonged period of not being seen. While we will continue to re-engage these patients, next steps will focus efforts on patients with an A1c less than 9.5%, as this population may be more receptive to follow-up.

Introducing Anxiolysis for Patients Receiving
Injection Therapy in the Physical Medicine and Rehabilitation Clinic
AUTHORS
Primary: Sheila Birlin
Author(s)/Affiliations: Nancy Quay MS, RN, CNRN; Jasmine Ng, MD; Lauren Kane MSN, RN, CPN; Ray Stanford, DO
BACKGROUND
Patients in Physical Medicine and Rehabilitation (PM&R) requiring minimally invasive injection therapy, such as Botox for spasticity, have demonstrated fearful and anxious behavior prior the procedure. This has been especially true for patients under age 5, those with intellectual disabilities, and children who require multiple injections (1). In select cases, children with the inability to lie still during intramuscular injection therapy, have had to endure a lengthy perioperative experience to include general anesthesia to safely perform the procedure and avoid harm to themselves, caregivers, and medical staff. Furthermore, patient and family satisfaction scores are also affected because of the emotional and physical discomfort the child experiences during these minor procedures, such as being held down when injecting sensitive areas (especially upper extremities). To improve patient and staff safety, increase patient/family satisfaction, and create high-value care, interventions that include minimal sedation have been implemented within PM&R.
SPECIFIC AIM
The desired outcome for using minimal sedation is to improve patient and staff safety during procedures, decrease patient anxiety and emotional trauma ( therefore, increasing patient satisfaction), and provide high-value care to all sedation eligible patients requiring injection therapy in the PM&R ambulatory setting in a span of 6 months (December 1, 2022- June 1, 2023).
DESCRIPTION OF INTERVENTION (IMPROVE AND CONTROL)
A multidisciplinary team was formed (managers, physicians, nursing, pharmacy, scheduling, IT, and PCMG Clinical Leadership Council) creating a pathway to begin using midazolam in the ambulatory setting:
• Creating an approved policy, specific for the ambulatory setting, for the administration of intranasal or oral Midazolam (Attachment F in the procedural sedation policy)
• Producing an order set for procedure with sedation and weight specific dosing
• Define inclusion and exclusion criteria for safe sedation administration in an ambulatory setting
• Constructing approved educational handouts describing anxiolysis medication, with discharge teaching for parents to take home
• Obtaining all equipment necessary to provide safe environment for minimal sedation.
METRICS (MEASURE AND ANALYZE)
Patients and families have been and will be surveyed about their overall experience with in-office minimal sedation. Using a Likert scale, patients will be asked if the sedation was helpful, were the child’s emotional needs met, would the parent choose sedation again for future injection appointments, and was in-office sedation used in lieu of outpatient surgery. Outcome Measures
• In the months of December and January a total of 6 patients had in-office sedation in PM&R. 2 of the 6 patients would have needed outpatient surgery if in-office sedation had not been offered. Cost and time saving measures were delivered to the patient avoiding surgical fees, anesthesia fees, hospital fees, and a longer hospital visit (several hours vs. 1 hour for in-office) Process Measures
• Screening patients at the injection therapy consult as to whether they would be a good candidate for in-office sedation and explain minimal sedation with midazolam. Balancing Measures
• Since project initiation, there has been one unintended consequence: on-time care delivery. Injection therapy is scheduled for 45 minutes, and the time was not adjusted for patients receiving sedation administration. Appointments take longer to explain the procedure and sedation, administering the medication and allowing time for the sedation to take effect prior to receiving the injections. 3 of the 6 patients that received in-office sedation took longer than 45 minutes to complete the procedure, leading to a disruption in the schedule for patients to follow.
IMPACT/CONCLUSION
Our goal in the 6 month introduction period of offering this service is to provide precise, high quality injection therapy with minimal emotional discomfort to the patient. In our first two months of offering in-office sedation to anxious and fearful patients, results have shown patient satisfaction, increased patient and provider safety and significant cost-saving measures for some families. Measures are already in place to increase provider templates to 60 minutes for those patients who will require in-office sedation.
REFERENCES
1. Fantacci, C., Fabrizio, G.C., Ferrara, P., Franceschi, F., et al. Intranasal Drug Administration for Procedural Sedation in Children Admitted to Pediatric Emergency Room. 2018. European Review for Medical and Pharmacological Sciences. 22:217-222.


Multidisciplinary Daily Safety Huddle to Improve Situational
Awareness
AUTHORS
Primary: Sandra Buttram, MD
Author(s)/Affiliations: Tara Kaleh, RN, BSN; Anacecilia Nolan MSN, RN, CCRN; Jill Haydusko, MBA, MSN, RN, NE-BC, Alumnus CCRN
BACKGROUND
Situational awareness (SA) is the perception of environmental elements within time and space, the understanding and processing of their meaning, and the projection of their status in the near future (Schulz et al, 2013). As a multidisciplinary team in a high reliability unit (HRU), implementing strategies to improve SA are essential for delivering excellent clinical care, reducing medical errors, and improving patient safety. A serious safety event occurred within our organization that would have benefited from improved SA.
SPECIFIC AIM
80% in-person attendance of key stakeholders at daily Safety Huddle (dSH) from June 1 – December 31, 2022.
DESCRIPTION OF INTERVENTION (IMPROVE AND CONTROL)
Develop and implement a dSH that brings multidisciplinary team members together to improve SA by identifying safety concerns. Key stakeholders were identified as necessary in-person attendees including clinical service teams, clinical supervisors, respiratory therapists, and pharmacists. Education sessions for key stakeholders and other invited attendees (dietitian, social work, case manager, child life, etc.) were held and High Fives with points were awarded to education session attendees. A Vocera alarm for key stakeholders was implemented as a daily reminder to attend the dSH. The dSH contains a brief, structured overview of pertinent safety elements such as staff, patients, and supplies. Attendance is logged via QR code scan. A survey was conducted after 3 months to measure effectiveness and participants were entered into a gift card raffle.
METRICS (MEASURE AND ANALYZE)
Elements of the dSH pertinent to SA include patient census and throughput, staffing, supply issues and high-risk patient therapies. Ten education sessions were conducted, and electronic quick tips were provided prior to implementation. Cumulative overall in-person attendance by key stakeholders was 89% and remained over the goal of 80% each month. Overall survey response was 60% (75/124). Of respondents, 79% (59/75) felt the Vocera alarm was helpful. The time and duration of the dSH was “just right” for 75% (56/75) and 81% (61/75), respectively. Elements of dSH that respondents felt were most useful included staffing (60%), family concern (59%), planned admission/procedures (57%) and transfers/ discharges (55%). The information presented improved SA for 78% of attendees (59/75).
IMPACT/CONCLUSION
We successfully developed and implemented a dSH for multidisciplinary key stakeholders in our HRU. Cumulative inperson attendance has remained strong at 89%. We continue to track daily attendance to encourage participation. The elements reviewed at dSH have improved SA for most attendees. Our next step to improve SA is to disseminate patient safety concerns from dSH to the bedside care team.
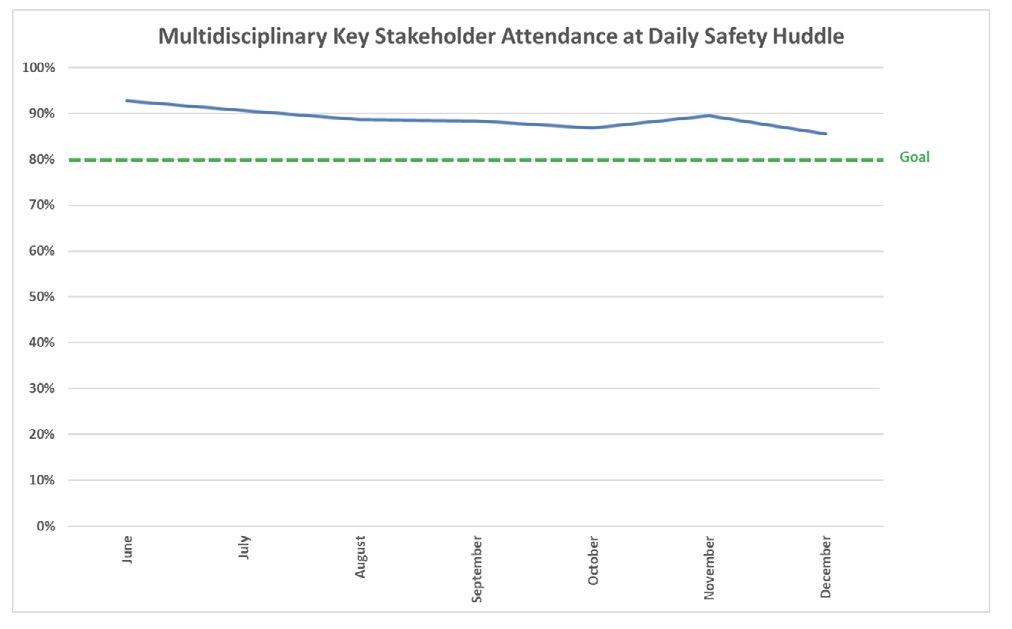
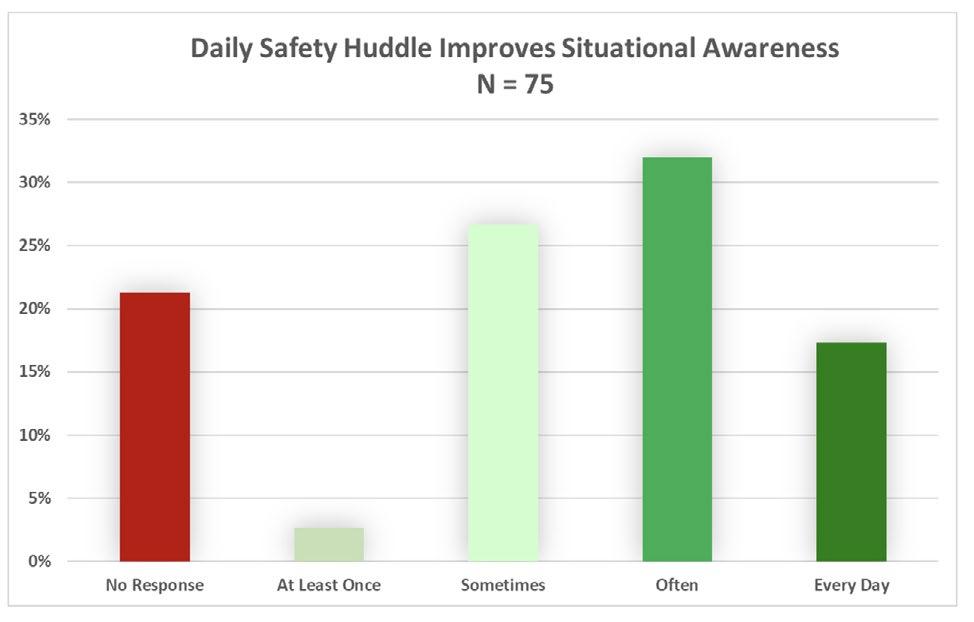
Improved Clinical Pathway Adherence and Perioperative Outcomes Following Implementation of a Quarterly Craniofacial Team Meeting
AUTHORS
Primary: Austin Grove, BS
Author(s)/Affiliations: Hannah Kirsch, BS; Nicole Kurnik, MD; Tom Sitzman, MD, MPH; Davinder Singh, MD
BACKGROUND
Given the complexity of perioperative management for craniosynostosis patients, regimented craniosynostosis clinical pathways have been designed to improve care and guide clinical decision-making. In addition to standardizing transfusion criteria, this pathway was designed to improve postoperative pain control and decrease overall hospital length of stay postoperatively. The adherence to this pathway has been inconsistent given its complexity, particularly with the proper use of peripheral nerve blocks to decrease postoperative pain and opioid use. Prior to any intervention, only 35% of patients undergoing craniosynostosis surgery received nerve blocks in full adherence with the established clinical pathway and over 40% of patients had improper sequencing of lab draws such as complete blood counts or arterial blood gas tests. In October 2020, we formally established a quarterly multidisciplinary craniofacial team meeting with the goal of increasing personal investment in improving perioperative care and increasing adherence to pathways. This retrospective review aims to determine the efficacy of this quarterly meeting in regard to improving adherence to surgical pathways and improving perioperative morbidity for children undergoing craniosynostosis surgery.
SPECIFIC AIM
In the two years following the implementation of our quarterly team meeting (2020-2022), we aimed to improve adherence to our clinical pathway nerve block locations/medications from our baseline of 35% adherence to 100% adherence. Additionally, we intended to significantly decrease use of injectable steroids to a goal of 0% use, decreased time under anesthesia, and to decrease total hospital length of stay.
DESCRIPTION OF INTERVENTION (IMPROVE AND CONTROL)
In October 2020, the Division of Plastic Surgery formally established a quarterly craniofacial surgical team meeting with all involved care providers to discuss the perioperative management of craniofacial patients, with a particular focus on standardizing perioperative care, reviewing the craniosynostosis pathway, provider education, and increasing patient safety and quality of care. To assess the efficacy of this meeting, operative notes and anesthesia records were retrospectively reviewed and analyzed in the two years pre/post the implementation of the quarterly meeting.
METRICS (MEASURE AND ANALYZE)
In total, 191 craniosynostosis surgeries were retrospectively analyzed: 50 frontal orbital advancements and 141 extended suturectomies. Outcome/process measures included adherence to clinical pathway nerve block locations, injectable steroid use, CBC/ABG tests, length of stay postoperatively, time under anesthesia, blood loss, and transfusion rate. Balancing measures included the use of clonidine in the nerve blocks. Statistical analyses were conducted using nonparametric, univariate tests.
For frontal orbital advancement operations, there were a significantly higher number of peripheral nerve blocks used per operation in the two years following the implementation of the meeting (P<0.001). Additionally, the adherence to clinical pathway nerve block locations significantly increased from a baseline of 35% adherence to over 75% (P=0.009). The improper use of injectable steroids (dexamethasone) significantly decreased from a baseline of 35% to 6% of patients (P=0.039), while the use of clonidine increased from 6% of operations to 63%.
For suturectomy operations, the use of injectable steroids decreased from a baseline of 19% of operations and we met our goal of 0% use (P<0.001). Importantly, the adherence to proper peripheral nerve block locations increased from a baseline of 77% to 94% (P=0.003). The proportion of operations that adhered to the pathway for timing of ABG tests intraoperatively increased from a baseline of 59% to over 80% of operations (P<0.005). Additionally, the mean time under anesthesia significantly decreased (P=0.044) and the proportion of patients requiring a blood transfusion intraoperatively decreased to just 28% from a baseline of 51% (P=0.005). The length of stay significantly decreased to 1.3 days from a baseline of 1.8 days (P<0.001).
IMPACT/CONCLUSION
Increasing adherence to clinical pathways is essential to ensuring patient safety, improving outcomes, and better standardizing care. The data in this project quantitively shows that the implementation of a quarterly multidisciplinary team meeting can improve adherence to pathways and improve perioperative care for children at Phoenix Children’s Hospital. The conclusions of this project have been shared internally for quality improvement and to sustain these outcomes. We will further work with our team to increase adherence to the pathway to our goal of 100% adherence to nerve block locations and we will continue to utilize an evidence-based approach to improving perioperative care. We will also look for additional ways that we can improve teamwork and personal investment in other areas in the division.
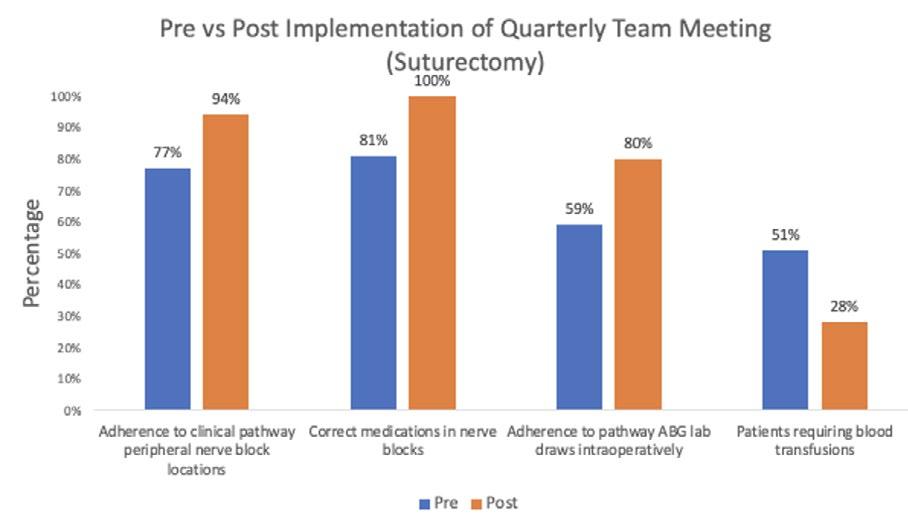
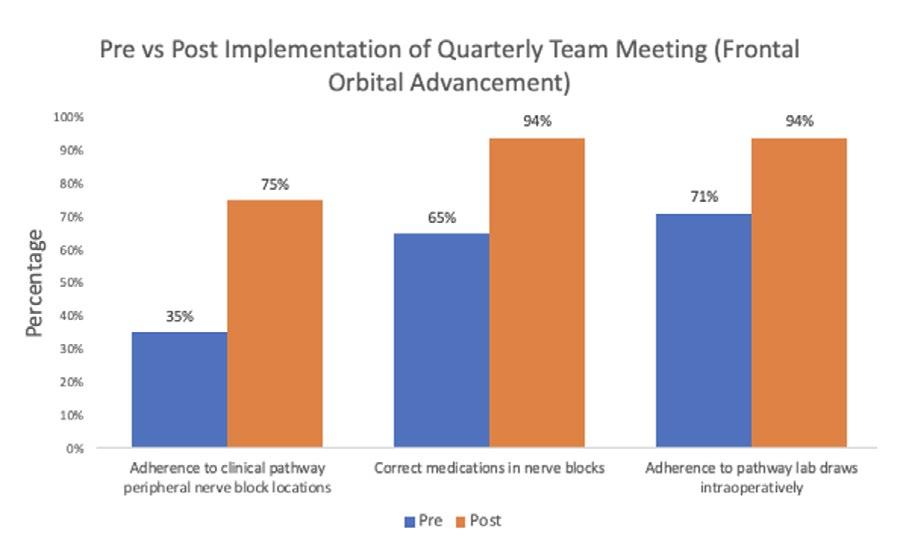
Learning for the Fun of It – The Use of Gamification in Educating Pediatric Perioperative Clinical Staff
AUTHORS
Primary: Karen Johnson, MSN, RN, CNOR
Author(s)/Affiliations: Kayla Haugen, MS, BSN, RN, CPN and Amber Senetza, MSN, RN, CPN
BACKGROUND
Previously, the Perioperative (Periop) Services clinical staff received yearly education on department specific topics and clinical skills. The Periop Educators utilized lecture-based learning activities and hands-on demonstration to reinforce knowledge of pediatric patient care. Staff expressed dissatisfaction with the lecture-based format and reported it was difficult to remember pertinent information with multiple topics presented in one sitting. Limited participation from staff was observed therefore, the Perioperative Education Specialists were eager to find a way to develop “innovative activities to play on fun themes while reinforcing key clinical concepts (Tassemeyer et. al., 2021). Gaming has a positive impact on knowledge retention, confidence levels, motivation, and engagement (Reed, 2020). Gamification is defined as the process of adding game-based elements to training sessions to engage people, motivate action and incentivizes the learner to use critical thinking skills (Kapp, 2012 and Reed, 2020).
SPECIFIC AIM
The Periop Educators introduced gamification to pertinent education topics to improve staff engagement and increase overall comfort level of training sessions over a period of one year. These sessions were developed to help mimic the adrenaline rush associated with real life emergencies in the Periop Setting. Our secondary aim was to create a fun and safe learning environment using gamification.
DESCRIPTION OF INTERVENTION (IMPROVE AND CONTROL)
According to Brull et al., (2017), staff found gamification more enjoyable and retained more knowledge compared to didactic and online modules. To improve staff engagement and comprehension, the Periop Educators designed interactive training strategies that included: Escape Room, Family Feud, Bingo, House of Horrors skills lab and emergency drill relay races. Learning objectives for each training session were established utilizing the revised Bloom Taxonomy (Armstrong, 2010). The Escape room was a timed event where staff had to use clues to identify a Malignant Hyperthermia (MH) crisis and solve puzzles and complete activities to discover the treatment of the MH crisis. Similarly, a Family Feud game was created to review fire and laser safety. Staff were challenged to recall elements of fire and laser prevention strategies, policies, and action plans. Relay Races were created to help mimic the adrenaline rush associated with real code and airway emergencies in the Periop Setting. These relay races allowed staff to simulate manual ventilation, oral airway insertion, identifying rapid sequence intubation supplies, drawing up and administering code dose medications, high quality CPR, and code documentation. Additionally, a BINGO game was created to test staff’s knowledge in recognizing signs and symptoms of MH, treatment, and introducing a new Dantrolene Sodium product purchased for the organization. For House of Horrors skills lab, staff were assigned as ghosts, witches, bats, and skeletons based on their role and rotated through a Haunted House themed skills competency validation. Stations included Central Line Cemetery, Frankenstein’s Laboratory, and Count Dracula’s Blood Bank.
METRICS (MEASURE AND ANALYZE)
Process and Outcome Measures
Pre and post surveys were administered for 4 training sessions. However, only post surveys were administered for an additional 5 training sessions. Surveys were developed utilizing the Likert scale (1-5) to evaluate effectiveness of format, content, and staff’s comfort level of the information presented. Data were statistically analyzed using the Kruskal-Wallis tests. When comparing pre and post surveys there was a significant difference in overall comfort level for all training sessions that had pre and post surveys evaluated (p < 0.01). Additionally, there was a significant difference (p < 0.0001) between all training sessions, with the House of Horrors Skills Lab having the highest Likert score (4.7) and the Whoville Code Simulation having the lowest Likert scale (4.1). Post survey results illustrated gamification was effective regardless of game type. Overall, staff (n=647) preferred the teaching method of gamification (72%), over learning modules (24%) and lecture (29%).
Balancing measure
• Not all training sessions have pre surveys, therefore we discovered early on that we were unable to directly analyze the effectiveness of the trainings without developing pre and post surveys
• Training sessions were opportunities, not mandatory
• A paired analysis could not be done because the pre and post surveys of the participants were not linked
• Not all staff members answered each survey
• Staffing challenges created a barrier for staff to attend
IMPACT/CONCLUSION
According to Reed (2020), gamification has a positive impact on staff knowledge retention, confidence levels, and motivation and engagement. Prior to implementing gamification, staff showed a lack of engagement and dissatisfaction with training methods. Post survey results illustrated gamification was effective, regardless of game type. Periop gamification allowed staff to apply critical thinking skills in a fun and safe environment, further building their confidence and knowledge in Periop emergencies. As a result, the educators have continued to utilize interactive game formats. These innovative activities play on fun themes, while reinforcing key clinical concepts for staff (Tassemeyer et al., 2021).
REFERENCES
1. Armstrong, P. (2010). Bloom’s Taxonomy. Vanderbilt University Center for Teaching. Retrieved Oct. 2, 2022, from https://cft.vanderbilt.edu/guides sub pages/blooms taxonomy/.
2. Brull, S., Finlayson, S., Kostelec, T., MacDonald, R., & Krenzischeck, D. (2017). Using gamification to improve productivity and increase knowledge retention during orientation. JONA: The Journal of Nursing Administration, 47(9), 448–453. https://doi.org/10.1097/nna.0000000000000512
3. Kapp, K. M. (2012). The gamification of learning and instruction: Game-based methods and strategies for training and Education. Pfeiffer.
4. Reed, J. M. (2020). Gaming in nursing education: Recent trends and future paths. Journal of Nursing Education, 59(7), 375–381. https://doi.org/10.3928/01484834-20200617-04
5. Tassemeyer, D., Rowland, S., & Barnason, S. (2021). Building a nursing escape room. Nurse Educator, 46(5), 271–272. https://doi.org/10.1097/nne.0000000000000987

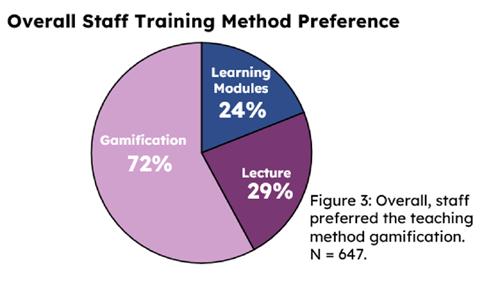
Implementation of a Daily Electronic Symptom Questionnaire to Reduce the Readmission Rate during Initial Treatment for Acute Lymphoblastic Leukemia
AUTHORS
Primary: Laura Retson
Author(s)/Affiliations: Madelyn Kane, BS; Rachel Geiser, MS; Jennifer Hess, DO; Alexandra Walsh, MD
BACKGROUND
Induction therapy for newly diagnosed patients with Acute Lymphoblastic Leukemia (ALL) has significant medical and emotional complications. Caring for a newly diagnosed child at home can be overwhelming. Communication strategies to monitor symptoms at home may readily identify treatment complications and may prevent hospital readmissions. Phoenix Children’s has between 70-90 new ALL patients each year and has historically shown about a 50% readmission rate during induction therapy, with approximately 45% of the readmissions considered likely or possibly preventable.
SPECIFIC AIM
Over a one year period, we aim to decrease readmission rates for newly diagnosed patients with ALL in Induction at Phoenix Children’s by 20% and decrease the self-reported caregiver distress score on NCCN distress thermometer by a value of 2 by the end of Induction by implementing a daily electronic symptoms questionnaire.
DESCRIPTION OF INTERVENTION (IMPROVE AND CONTROL)
We introduced a questionnaire to caregivers of patients with newly diagnosed ALL during Induction about caregiver distress including the NCCN distress thermometer, weekly during induction. This baseline data will be compared with caregivers who have received the daily text asking additional questions regarding symptoms the patient is experiencing. We hypothesize that the daily texting about symptoms will significantly reduce caregiver distress and may also reduce readmission rate.
METRICS
Outcome measures include readmission rates during the 29 possible days at home during Induction, Emergency Department visits, days of readmission, days spent in the critical care setting, NCCN distress thermometer score, care team connection rating, and burden to participant scoring.
MEASURE/RESULTS
For our baseline data, collected from 20 participating families, the average reported distress score (with a maximum score of 10) on Day 8=6.67 (95% CI 5.48-7.86) on Day 15=4.59 (3.03-6.16), on Day 22=4.44 (3.04-5.85), and on Day 29 =4.06 (2.69-5.43).
Six of 18 patients (33.33%) were seen in the Emergency Department (ED) alone during Induction, while 11 of 18 patients (61%) were readmitted for a total of 93 inpatient days, 33% of which were in the Pediatric Intensive Care Unit (PICU) . Two patients of the baseline group were not discharged during Induction, and thus were not able to be readmitted. Phase 2 accrual is ongoing, and we currently have 13 participants who have completed their daily texting surveys for 22 days, and 2 participants are still in Induction therapy filing out the surveys. Of the 294 daily questionnaires, 263 were submitted (89.5% response rate) without secondary prompting.
The average reported distress score (with a maximum score of 10) on Day 8=6.38 (95% CI 4.71-8.05) on Day 15=3.50 (2.65-4.35), on Day 22=3.92 (2.50-5.34), and on Day 29 =2.33 (1.40-3.25). [Figure 1]
Three of the 12 patients (25%) were seen in the ED alone, while only 3 of 12 patients (25%) were readmitted for a total of 22 inpatient days, none of which were in the PICU for the Phase 2 participants. [Figure 2]
One patient in Phase 2 was not discharged during induction.
We have also included counter measures including a question regarding burden of filling out the questionnaires, which was unchanged from the pre intervention and post intervention groups.
IMPACT/CONCLUSIONS
Our intention is for our team to flag concerning responses on the daily questionnaire and interject before medical intervention involving readmission was necessitated. We have shown feasibility of filling out surveys with a non-prompted response rate of daily questionnaires of 89.5% without increase in burden to participants. Although data collection is still ongoing, early data has shown pre-intervention readmission rate of 61% with 33% of the readmission days in the critical care setting and post-intervention readmission rate of 25% with 0% of the days in the critical care setting (p-value for change in readmission rate 0.07). Self-reported distress thermometer values are also decreased with our intervention from 4.06 (SD 2.69-5.43) on day 29 of induction pre-intervention to 2.33 (SD 1.40-3.25, p value 0.0005). Texting questionnaires have the potential for wider use at Phoenix Children’s and beyond, with the potential to reduce readmission rates and caregiver distress among other patients.
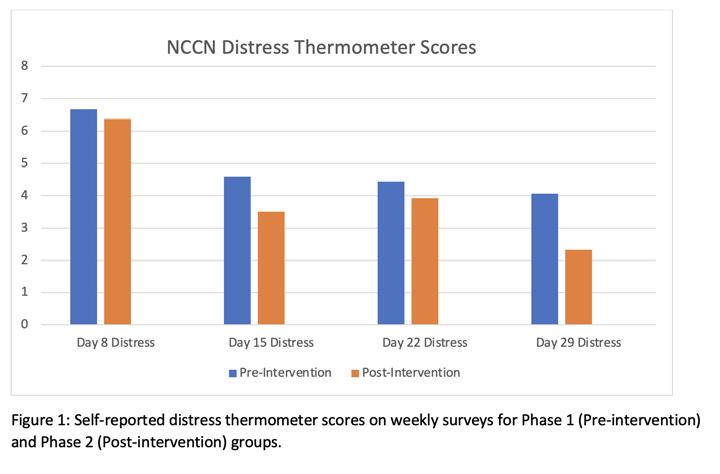
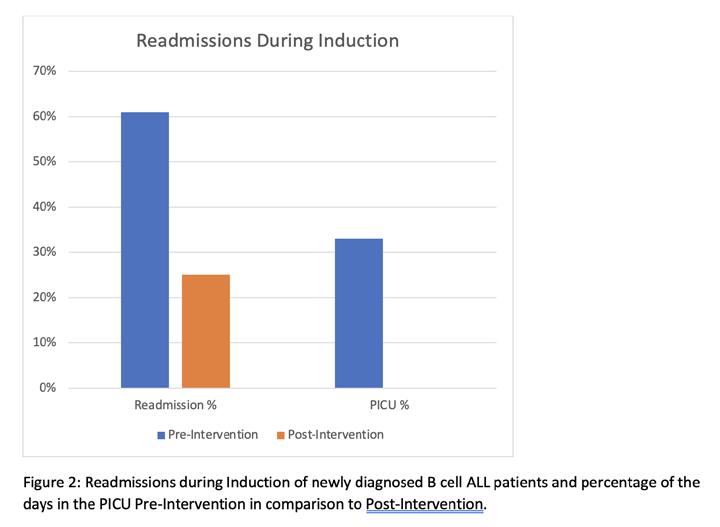
Intubation Algorithm in the Pediatric Intensive Care Unit
AUTHORS
Primary: Kelsey Gladen
Author(s)/Affiliations: Anthony Willyerd, MD; Rachel Marlow, MD; Sandra Buttram, MD; David Tellez, MD
BACKGROUND
Intubation is a high-risk procedure in the intensive care unit (ICU), which can result in life-threatening complications including severe hypoxemia and cardiac arrest (1-3). Phoenix Children’s ICU submits intubation-associated data to the international quality registry National Emergency Airway Registry for Children (NEAR4Kids) which includes a best practice bundle and tracks adverse tracheal intubation associated events (TIAE).
SPECIFIC AIM
Develop and implement an intubation algorithm that defines a standardized approach to determining risk of intubation and first attempt airway provider. We had a goal of >80% compliance with designated first attempt airway provider from July 1 – December 31, 2022.
DESCRIPTION OF INTERVENTION (IMPROVE AND CONTROL)
An algorithm was created to supplement the NEAR4Kids best practice bundle which would match first attempt airway provider with the patient risk for TIAE (4-5). The algorithm was refined by both local providers and national NEAR4Kids leaders. Education for the intubation algorithm and strategies to mitigate risk of TIAEs were provided to nurses, respiratory therapists, and providers in the pediatric ICU prior to algorithm implementation. Data regarding intubation algorithm compliance was collected in addition to standard NEAR4Kids registry data. Paired T-test and Fischer Exact Test were used to compare rate of TIAE pre- and post-algorithm implementation and association of algorithm compliance with TIAE, respectively.
RESULTS
There were 108 intubations of which data was available for 103 (95%) with an overall algorithm compliance for designated first attempt airway provider of 91% (above goal of 80%). Since algorithm implementation, adverse TIAEs have trended down from a mean of 21% to 15% (p=0.22). The number of adverse TIAEs were more common in the non-compliant intubations (33% vs. 14%), but this was not statistically significant (p=0.14).
IMPACT/CONCLUSION
The intubation algorithm was successfully implemented, and thus far, we have achieved good compliance. There has been an associated down trend in TIAE since algorithm implementation. The project is ongoing with the goal to further decrease TIAE to 10% through a multifaceted approach of continued algorithm compliance, and increased use of apneic oxygenation and video laryngoscopy.
REFERENCES
1. Nishisaki A, Turner DA, Brown CA 3rd, et al: National Emergency Airway Registry for Children (NEAR4KIDS); Pediatric Acute Lung Injury and Sepsis Investigators (PALISI) Network: A National Emergency Airway Registry for children: landscape of tracheal intubation in 15 PICUs. Crit Care Med 2013;41(3):874-85
2. Li S, Hsieh TC, Rehder KJ, et al: Frequency of desaturation and association with hemodynamic adverse events during tracheal intubations in PICUs. Pediatr Crit Care Med 2018; 19(1):e41-e50
3. Parker MM, Nuthall G, Brown C 3rd, et al: Relationship between adverse tracheal intubation associated events and PICU outcomes. Pediatric Crit Care Med 2017; 18(4):310-318
4. Miller KA, Nagler J: Advances in Emergent Airway Management in Pediatrics. Emerg Med Clin North Am. 2019;37(3):473-491
5. Graciano AL, Tamburro R, Thompson AE, et al: Incidence and associated factors of difficult tracheal intubations in pediatric ICUs: a report from National Emergency Airway Registry for Children: NEAR4KIDS. J Intensive Care Med. 2014;40(11):1649-69
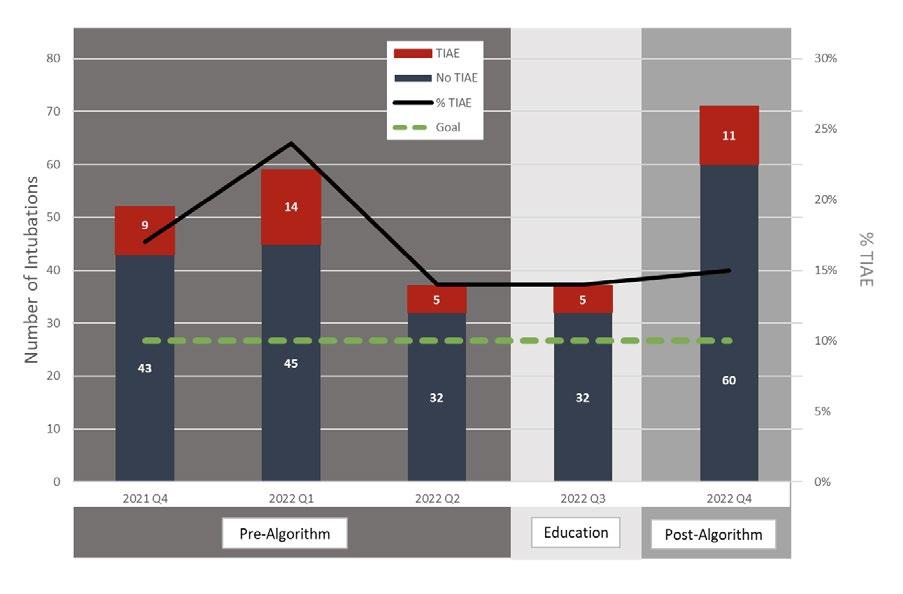
Standardizing Treatment of Necrotizing Enterocolitis in Infants
AUTHORS
Primary: Navin Bhopal
Author(s)/Affiliations: Amaris Tapia, MS4; Ian Kloehn, MD; Christian Armstrong, PharmD; Wassim Ballan, MD; Kim Allred, DNP; Mark Molitor, MD; Rhonda Kurz, PharmD; Nicholas Huggins, MD; Nisha Patel, RD; Megan Shea, NNP; Josienne Prinz, RN; Molly King, PNP; Marisa Sarsoza, RD; Pam Griffiths, MD; Josh Koch, MD; Gregg Martin, MD
BACKGROUND
Necrotizing enterocolitis (NEC) is a potentially life-threatening disease of the gastrointestinal (GI) tract that develops primarily in high risk newborns and infants. The pathogenesis involves bacterial invasion of the intestinal epithelium and a marked inflammatory response. Treatment involves bowel rest, gastric decompression, antimicrobial therapy and potentially surgery in more advanced stages of disease. The selection of antibiotics for NEC treatment is variable from institution to institution or even provider to provider, usually involving gram positive and negative coverage with the addition of anaerobic coverage in select cases. To standardize the work-up and treatment of NEC and guide appropriate antibiotic selection while promoting antibiotic stewardship within the institution, a standardized treatment pathway was developed and introduced in August 2022, which includes an order set in the electronic health record (HER). The pathway also includes guidance on diagnostic work up, initial medical management and recommendations for timing of obtaining surgical consultations.
SPECIFIC AIM
To achieve 70% compliance with the NEC treatment pathway within 1 year, from August 2022 to August 2023.
DESCRIPTION OF INTERVENTION
We gathered baseline data on antibiotic treatment patterns of NEC prior to introduction of the treatment guideline. Charts of patients with NEC seen between January 1, 2020 and December 31, 2021 (pre-guideline time period) were reviewed. Education for the treatment pathway occurred from August to December, 2022. Providers were educated on the pathway at monthly division meetings of key-stake holders (NICU, CVICU, PICU, surgery).
To track compliance with the standardized treatment pathway, collection of monthly data on patients diagnosed with NEC since August 2022 is ongoing.
METRICS (MEASURE AND ANALYZE)
Outcome Measures
• Percentage of appropriate antibiotic selection
• Percentage of appropriate treatment duration Process Measures
• Percentage of EHR Order-Set use when diagnosing and treating NEC
• Percentage of ID consults placed when deviating from NEC pathway Balancing Measures
• Rates of Stage 3 NEC
• Need for surgical intervention
• Presence of complications (strictures, abscess, wound dehiscence)
• Mortality rate
RESULTS
Baseline data
Baseline data of 10 patients was gathered from the pre-pathway time period (January 1, 2020 to December 31, 2021) (table 1). Median gestational age and birthweight were 38.4 weeks and 2660g respectively. Bell staging of NEC for this sample were as follows: Suspected NEC (stage 1) (n=4, 40.0%), Medical (stage IIa, IIb, IIIa) (n=5, 50.0%), and Surgical (stage IIIb) (n=1, 10.0%).
Prior to guideline implementation, treatment of 80% of NEC cases included piperacillin/tazobactam, 20% metronidazole and 10% a cephalosporin (table 2, figure 1). Mean Duration of treatment was 6.7 days +/-1.9 days. 1 case required peritoneal drain placement. Mortality occurred in 40% of historical cases.
Post-Intervention (August 2022 – January 2023)
Since introduction of the NEC treatment guideline in August 2022, there were two cases of NEC in the NICU (table 2). One case was a 35 week female with birthweight 1862g transferred to PC on DOL 37 with an established diagnosis of NEC. Upon admission, she was diagnosed with fulminant NEC totalis. The patient was treated with ampicillin, gentamicin, metronidazole in accordance with the NEC treatment pathway. A 3rd generation cephalosporin was added due to the severity of disease. She underwent exploratory laparotomy and the patient died within a few hours of admission. The second case was a 36 week female who developed stage IIIb NEC at 31 days of life, requiring surgery and extended antibiotic therapy for 21 days due to peritonitis.
IMPACT/CONCLUSION
Prior to the development of the pathway, piperacillin-tazobactam was the mainstay of treatment of NEC at this institution. However, concerns exist over emerging resistance patterns with routine use of piperacillin-tazobactam. Ampicillin, gentamicin +/- metronidazole provide adequate coverage for the treatment of the most common enteric organisms involved in NEC pathogenesis. Using narrower spectrum antibiotics for the shortest duration will ultimately decrease cost, improve antibiotic stewardship, and minimize adverse effects of antimicrobial therapy. For this reason, a standardized treatment pathway was introduced at PC in collaboration with Neonatology, Infectious Diseases, Pediatric Surgery, and the Cardiovascular ICU. Historical controls show a high usage of piperacillin-tazobactam prior to the pathway implementation. Since the guideline was introduced in August 2022, there have been 2 cases of NEC in the NICU. Use of piperacillintazobactam has shifted in favor of ampicillin, gentamicin and metronidazole in accordance with the NEC treatment pathway. While both these patients required surgical intervention, due to the small number of cases in the post-pathway group, we cannot draw any concrete conclusions about outcomes at this time. Data collection is ongoing to evaluate antibiotic selection, treatment days and use of the electronic order set. Balancing measures continued to be evaluated. Education of providers from the NICU, CVICU and Pediatric Surgery divisions is ongoing.
REFERENCES
1. Alganabi M, Lee C, Bindi E, Li B, Pierro A. Recent advances in understanding necrotizing enterocolitis. F1000Res. 2019;8:F1000 Faculty Rev-107. Published 2019 Jan 25. doi:10.12688/f1000research.17228.1
2. Gil, E., Jung, K., Qvist, N., and Ellebaek M.B. Antibiotics in the medical and surgical treatment of necrotizing enterocolitis. A systematic review. BMC Pediatrics. 2022: 22 (66).
3. Cotton, M. Modifiable risk factors in necrotizing enterocolitis. Clin Perinatol 46 (2019) 129–143.
4. Gephart, S. et al. NEC-zero recommendations from scoping review of evidence to prevent and foster timely recognition of necrotizing enterocolitis. Maternal Health, Neonatology, and Perinatology (2017) 3:23
5. Grishin, A. et al. The role of the intestinal microbiota in the pathogenesis of necrotizing enterocolitis. Seminars in Pediatric Surgery 22 (2013) 69–75.
6. Mavis. S. et al. A quality improvement initiative to reduce necrotizing enterocolitis in high-risk neonates. J Perinat Aug 1 2022. https://doi.org/10.1038/s41372-022-01476-5

One Year Later: Decreasing Diagnosis to Operating Room Time for Life or Limb-Threatening Surgical Cases
AUTHOR
Primary: Janelle Novotny
BACKGROUND
Surgical emergencies have the potential to pose a threat to the life or limb of a patient. Per the American College of Surgeons (ACS) Children’s Surgery Verification (CSV) standard, these surgical cases must be brought into the operating room in less than sixty minutes from the time of diagnosis. One year ago, steps were taken to help nurses and providers manage those sixty minutes and deliver patients to the operating room in accordance with the ACS CSV standard.
SPECIFIC AIM
Deliver surgical emergencies, defined as a threat to life or limb, to the operating room in less than 60 minutes.
DESCRIPTION OF INTERVENTION (IMPROVE AND CONTROL)
In 2021, surgical division chiefs were asked to contribute to a list naming all surgical emergencies within their specialty that could pose a serious threat to the life or limb of a patient. The list served to close the gap in emergent procedure descriptions among providers, offering a clear definition of cases that are always considered a threat to the life or limb of a patient. Due to variables in the patient condition, all surgery cases scheduled as urgent or emergent were also considered to be life or limb threatening for the purposes of this project.
In 2022, a process measures group was formed including representation from surgery nursing, emergency room, children’s surgery verification, and information technology departments. The group was able to recognize gaps in the admission-to-disposition process and worked together to find a solution utilizing existing technologies. Qualifying surgical cases were the basis of the development of a tracking mechanism and automated nursing order with the intention of reducing delays that may occur when preparing these highly unstable patients for surgery. The resulting idea was to use the emergency department tracking board and create a new column, counting up from surgery schedule time to communicate to the staff that an emergency surgery was eminent. To further improve efforts, a nursing pre op order set was also created, to be generated when qualifying cases were booked. All cases from the physician driven list and any case booked urgent or emergent triggers the new column and the order set.
RESULTS
With a go-live date in January 2022, Q1 of that year resulted in 54.2% of cases meeting the above-mentioned qualifications reached the OR within 60 minutes of diagnosis. In Q4 of 2022, that number had risen to 59.5%. A drill down of the emergent cases revealed that testicular torsions in Q1 of 2022 were arriving within sixty minutes 66.7% of the time. With the implementation of the clock system, torsions in Q4 of that year reached the OR within 60 minutes 92% of the time.
IMPACT/CONCLUSION
The long-term repercussions of this project indicate a shorter diagnosis-to-OR timeframe, especially in target cases such as testicular torsion. Urgent, emergent, and threat to life or limb cases are being prepared for the OR in a timelier matter, reaching the operating room within 60 minutes or less, and meeting the ACS CSV standard. Relevant
Programmable Shunt Quality Improvement Project
AUTHORS
Primary: Ruth E. Bristol, MD
Author(s)/Affiliations: Vinay Vaidya, MD; Kathleen Klas, CPNP; Steve McCulley, Clinical Data Analyst; Tunu Shum, Enterprise Data Analyst; Christian Manly, PA-C
BACKGROUND
Over the past year, Phoenix Children’s has launched a new, automated alerting system for patients with programmable shunts for treatment of hydrocephalus. Several of the most common programmable shunt valves for hydrocephalus are susceptible to the strong magnetic field of MRI. This results in unplanned changes in setting, which can adversely affect shunt function and therefore patient safety. These patients have required either a shunt x ray or a visit with a provider to confirm shunt setting after MRI.
We have seen patients experience adverse events when their shunt is not properly draining cerebrospinal fluid (CSF) at the appropriate setting. This is typically related to over- or under-drainage of CSF through the shunt system when not reprogrammed properly after an MRI scan. Improper shunt settings can lead to increased intracranial pressure, or conversely can cause extra-axial fluid collections, subdural hematomas, and collapsed ventricles. Unfortunately, due to disparate scheduling systems, as in many hospitals, the radiology scheduling is not linked to Neurosurgery scheduling, and the responsibility of coordinating visits of MRI and a shunt reprogram has previously fallen on the patients and their families. Historically, this has resulted in many missed visits or x rays, occasionally resulting in patient harm.
SPECIFIC AIM
• To eliminate events of missed shunt reprogramming after MRI
• To reduce risk of patient harm after MRI
DESCRIPTION OF INTERVENTION (IMPROVE AND CONTROL)
The Phoenix Children’s Information Technology department has developed a Dashboard Tool that aggregates data from the Electronic Medical Record (EMR) from multiple sources and multiple systems. The project went live in March 2022. The tool displays this data in near real time in a visually intuitive manner that drives action. This data often comes from multiple sources that are typically difficult and time consuming for an end user to sort through and collate. Members of this project did a massive data pull and entry to ensure all patients with programmable as well as non programmable shunts were accurately captured in the Dashboard.
This Dashboard was then paired with a HIPAA compliant text notification system. Once the patient has a significant event noted in their EMR containing the name of the shunt valve, a Vocera notification is sent to the on-call providers as soon as ANY MRI is ordered on that patient.
The Dashboard then searches for a reprogramming note in the patient’s chart after the MRI is completed, and a report is sent to the managing providers on a daily basis to ensure that no vulnerable programmable valve has been missed. Here is an example of the secure daily email that is sent to the Neurosurgery team and MRI staff:
METRICS
1. Identify all patients with an implanted shunt and properly enter them into the Dashboard system
2. Shunts are to be reprogrammed within 48 hours of MRI scan
3. Neurosurgical documentation accurately reflecting shunt adjustment procedure after MRI
Another metric that has been recently implemented is the alert system for any new shunt that is surgically placed. When a patient has a shunt placed at PC, they are flagged with a Dashboard report to make sure a significant event is put into the patient’s chart. This ensures no future patients within PC are missed from the Dashboard.
MEASURE/RESULTS
The new Dashboard has allowed for very quick and accessible measurements of our progress. Reports can be generated for any given time frame to monitor progress and find ways to improve if patients are missed. The neurosurgical team, in partnership with MRI staff, have been able to streamline communication with the daily email reports from the Dashboard to ensure no child is missed.
After implementation of the tool and alert system, the miss rate for programmable shunt valves has dropped from approximately 24% (prior to Dashboard implementation) to 2% over the course of the past 365 days. Over the past year, there have been 392 MRI scans performed on 196 patients.
Of the 392 scans performed on 196 patients in the last 365 days, there have been seven missed shunt reprograms within 48 hours of MRI. For two out of the seven events, the patients had their shunts reprogrammed at 72 hours. The other five events had close neurosurgical follow up either at PC or at their home neurosurgical facility to ensure proper care. Each green bar in the report above represents a single month of data over the past 12 months. After a couple months of fine-tuning the Dashboard with accurate patient data, our missed event numbers are near zero. The Dashboard was able to back-date missed MRI scans in months prior to project launch for comparison. With the miss rate of 2021 being 24% and 2022 being 2%, our miss rate is averaged at 9% over the last two years. The implementation of this Dashboard has markedly reduced the number of missed events and missed shunt reprograms.
The Dashboard can be viewed at any time by any Neurosurgery provider. There are multiple fields that can be searched – such as date, location, and shunt type. Upcoming scan data is also available to enable proper preparation of reprogramming.
IMPACT/CONCLUSION
The implementation of an automated alerting system for programmable shunts that are exposed to MRI has significantly decreased morbidity for our neurosurgical patients. Within the last year, as all children with implanted shunts have been correctly entered into the system, the program has accurately identified all patients with an implanted shunt; the miss rate according to our metrics is near zero as our team set out to do. Moreover, this system relieves the patient and their family of the responsibility for coordinating visits, thus eliminating call backs and multiple trips for shunt reprogramming.
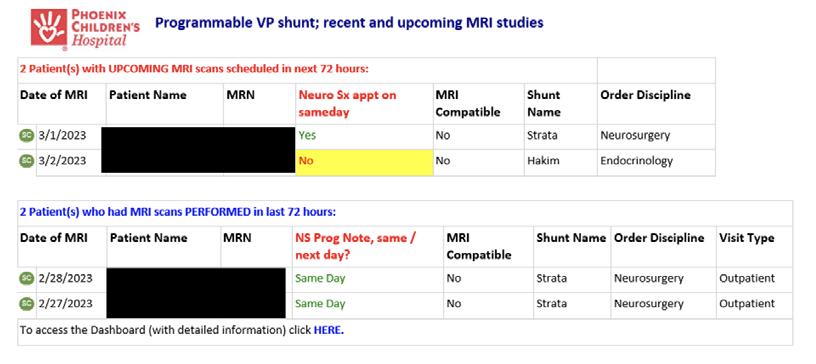
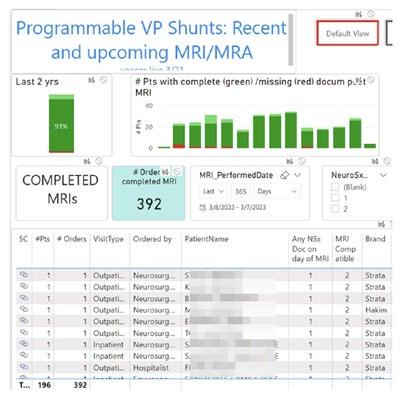
Eliminating Serious Harm: Partnering Clinical Experts with Predictive Analytics
AUTHORS
Primary: Kelly Kelleher, MD
Author(s)/Affiliations: Erin Robinson, DNP, MSN, RN, CPN
BACKGROUND
Phoenix Children’s achieved a remarkable >365 days in between Serious Safety Events (SSE) in 2018-2019. In the years that followed, the organization experienced a dramatic increase in SSEs in the beginning in quarter 4 of 2019. By June 2020, there were seven SSEs in the preceding 9 months, three of which were attributed to deviations that resulted in death. With the support of the executive leadership team, a Call to Action was created with the primary focus of eliminating these most serious harm events from our organization.
SPECIFIC AIM
• Primary Aim: Decrease Phoenix Children’s SSE rate by 50% in 24 months (year end 2022)
• Secondary Aim: Achieve zero SSE 1 events in 2022.
DESCRIPTION OF INTERVENTION (IMPROVE AND CONTROL)
A multidisciplinary action plan was created. Key departments included Quality, Nursing, PCMG, and Information Technology. WATCHER, an AI algorithm designed to identify patients at risk for clinical deterioration, was implemented in January 2021. With the implementation of WATCHER, the organization’s rapid response program was modified. Modifications included implementation of an ‘automated’ rapid response activation for those patients demonstrating clinical decompensation with the intent of bringing a new team to the patient’s bedside to perform an assessment, review the patient’s clinical course and discuss changes needed to the patient’s plan of care. In April of 2021 the nursing division developed and implemented a novel nursing role, the Clinical Nurse Attending (ClNA) in eight of our inpatient clinical care areas. The ClNAs are clinical experts with expert skills in communication and escalation. The ClNA role was designed to focus on patients at risk for the most significant harm – patients at risk for sepsis, those identified by WATCHER, the behavioral health population including suicide ideation patients and patients whose families were concerned about their child’s clinical condition. The ClNAs were incorporated into each unit’s High Reliability Unit Leadership Team as a key safety team member. ClNAs were also utilized as key safety culture change agents. Other interventions that occurred during the 24-month study period included workflow modifications, policy changes, dashboard creation and development of a sustainability plan.
METRICS (MEASURE AND ANALYZE)
Outcome Measures
• Serious Safety Event Rate
• Number of SSE1 events Process Measures
• Preventable code rate outside of the ICU
• Urgent Transfer Rate (PICU)
• Number of Proactive ICU transfers
• Rapid Response Team Activation Rate
• WATCHER huddle compliance (Level 2, Level 3)
• WATCHER alert intervention rate (Level 2, Level 3)
• Urgent Response Note Compliance following a Level 2 & Level 3 WATCHER alert Balancing Measures
• ICU transfer length of stay
• WATCHER level 3 alert PICU transfer rate
• Alarm fatigue – subjective survey data
IMPACT/CONCLUSION
In 2022 there were zero preventable codes in all acute care units and more than 100 proactive patient transfers to the ICU. The SSE rate in 2022 was 0.16, the organization’s lowest SSE rate since we started tracking this work in 2012. The 2022 SSE rate is a >300% decrease from our peak SSE rate in 2020. There were zero SSE1 in 2022.
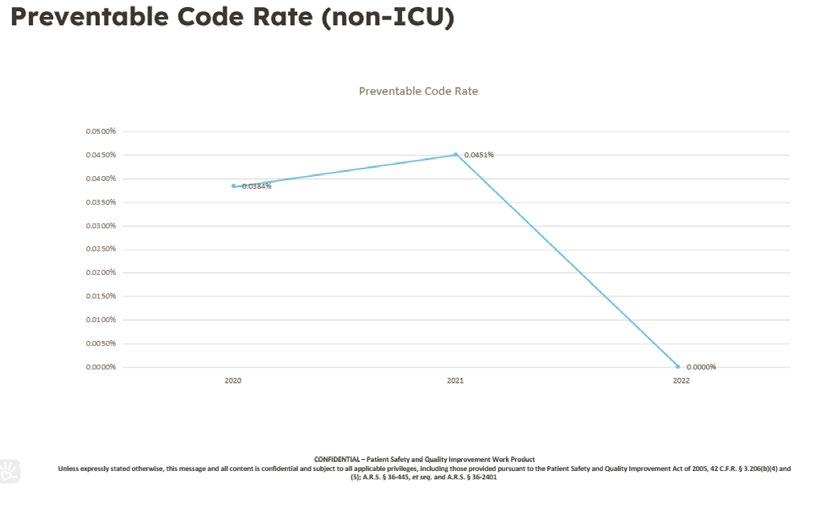

Conversion of Vitamin D Liquid to Unit Dose Syringes
AUTHOR
Primary: Shannon Griffith, PharmD
BACKGROUND
Phoenix Children’s carries two concentrations of Vitamin D oral liquid on formulary: 400 units/mL and 400 units/4 drops. Each of these formulations are utilized for different patient populations so both must remain on the hospital formulary. Given their look alike concentrations, pharmacy implemented strategies to reduce potential mix-ups by utilizing different names (D Vi Sol and Vitamin D) in Sunrise Clinical Manager (SCM) and separating the products during storage. Despite these efforts, these two medications have been mixed up frequently. Since converting to RISE, there have been 36 documented events involving Vitamin D. Due to the high rate of RISE events involving Vitamin D, pharmacy worked to implement additional changes to decrease these events.
SPECIFIC AIM
To decrease wrong medication RISE events of Vitamin D from a baseline of 3 events per month to 0 events per month within 30 days of conversion to Unit Dose (UD) Syringes.
DESCRIPTION OF INTERVENTION (IMPROVE AND CONTROL)
To reduce wrong medication RISE events with Vitamin D, pharmacy implemented different processes for the two medication concentrations in April 2022. For Vitamin D 400 units/mL, UD syringes were prepared in 1 mL volumes and loaded into Omnicell. The UD syringes are available on inpatient units to allow for faster access due to the high utilization. Pharmacy also purchased the 1 mL syringe from a repackaging company to help offset overall workload. The Vitamin D 400 units/4 drops product remained in the pharmacy for patient specific doses.
Due to a large variety of doses of Vitamin D that are prescribed, the 400 units/mL concentration is difficult for patients to tolerate at higher doses. To offset this intolerance and to minimize the total number of syringes needed per dose, the 400 units/mL concentration was restricted to doses of less than or equal to 800 units. The dosing restriction was enforced utilizing a dose range checking (DRC) hard stop and dosing information was added in the dosing info field on the SCM order for both orders.
METRICS (MEASURE AND ANALYZE)
The number of wrong medication RISE events involving Vitamin D was 18 in the pre-intervention time frame of April 2021April 2022. Post-intervention, there were 5 wrong medication events involving Vitamin D from May 2022- February 2023. All the post-intervention events occurred in May 2022.
The number of wrong dose RISE events involving Vitamin D was 18 prior to the intervention, 13 (72%) of them with the 400 units/mL concentration. After the intervention, this number decreased to 7, which occurred exclusively in the 400 units/4 drops concentration.
The number of doses dispensed from pharmacy as patient specific doses between April 2021 and April 2022 was 14,071 of the 400 units/mL and 6,504 of the 400 units/4 drops. After the conversion, there were 11,593 UD syringes of 400 units/ mL dispensed from Omnicell accounting for 10,008 doses and 5,683 doses dispensed from pharmacy as patient specific doses using the 400 units/4 drops concentration. Prior to the conversion, there were no Omnicell stockouts or expirations since the medication was not stored in Omnicell. After the intervention, there were 72 stockouts between May 2022 and February 2023 and 269 UD syringes expired in this timeframe.
IMPACT/CONCLUSION
The conversion of Vitamin D oral liquid to UD syringes decreased the number of wrong medication RISE events in the 10 months since the conversion. While there were 5 wrong concentration events since the conversion, they all occurred in May 2022 and there have been no events since that date. Standardizing the UD syringes to 1 mL has also resulted in an overall decrease in the number of wrong dose events associated with Vitamin D without a change in the total number of doses dispensed from pharmacy
Even though the near misses of wrong medication and dose have improved, there has been an unintended consequence of increased Omnicell stockouts and UD syringes expiring while stocked in the Omnicell. While this has added some workload to the pharmacy, there is an overall safety benefit with having the correct medication and dose leave the pharmacy. The impact of converting one concentration of Vitamin D to UD syringes has positively impacted patient safety. This highlights the need to assess other medications for potential conversion to UD syringes.
Implementation of an Electronic Discharge Checklist to Improve Critical Transition from Hospital to Home
AUTHORS
Primary: Deborah Tom
Author(s)/Affiliations: Christina Haneghan, BSN, RN; Jami Johnson, BSN, RN; Tracey Bullock, MS, M.Ed
BACKGROUND
Phoenix Children’s has a 45-bed level 4 NICU. All patients are out-born and averages 27 discharges a month. Disorganized discharges were reported on parent and staff discharge surveys. Staff surveys revealed 54.8% are confident in the items needed for discharge and 21.5% felt confident the parents were prepared for discharge. In May 2021, a paper discharge checklist was implemented to streamline multidisciplinary discharge tasks, teaching, and communication. Audits revealed a 31.5% baseline average of up-to-date paper checklists. Barriers to using the checklist were double charting and the requirement to gather/pull information from multiple locations. Our goal was to create an electronic version (EHR) with as many auto-populations as possible, to improve efficiency in documentation, organize teaching, and to further facilitate the standardization of the discharge process.
SPECIFIC AIM
• Updated EHR discharge checklists will increase from the paper baseline average of 31.5% to a goal of 60% by June 2023
• Staff confidence in parent preparedness for discharge will increase from a paper baseline of 46.8% to goal of 60% by June 2023
DESCRIPTION OF INTERVENTION (IMPROVE AND CONTROL)
The paper checklist with all mandatory discharge items, was integrated into electronic version designed with auto populations to pull patient data from the existing chart. Mandatory staff education was completed and super users identified. Rollout was communicated through huddles, emails, and super-users. A review checkbox was also added in EHR to serve as a reminder to update the discharge checklist and to also monitor accountability. Monthly audits continued and results were shared with staff/leadership. Parent surveys and monthly audits continued to monitor the new process.
METRICS (MEASURE AND ANALYZE)
Outcome Measures
• Percentage of staff that feel confident that parents are prepared for discharge Process Measures
• Percentage of discharge checklists that are up to date
IMPACT/CONCLUSION
Implementing the standardized discharge checklist into the EHR and adding auto-populations positively impacted the organization of NICU discharges. Compliance with using the discharge checklist improved when moving from a paper checklist to an electronic version by ~18% (31.5% to 50%). Additionally, staff confidence/knowledge in mandatory items needed for discharge increased from 68% to 80.5%. There was also an increase seen in how confident the staff felt parents were prepared for discharge after EHR implementation from a paper baseline of 46.8% to the current 73%. Ongoing parent surveys revealed a smaller increase in parent confidence for discharge preparedness with the introduction of an EHR checklist, from 64% to 71%. A sustainability plan will include ongoing monthly audits with communication of outcomes to nursing leadership and staff to identify potential barriers. Continued collaboration with IT to add additional auto-populations will help further improve efficiency and organization of discharges.

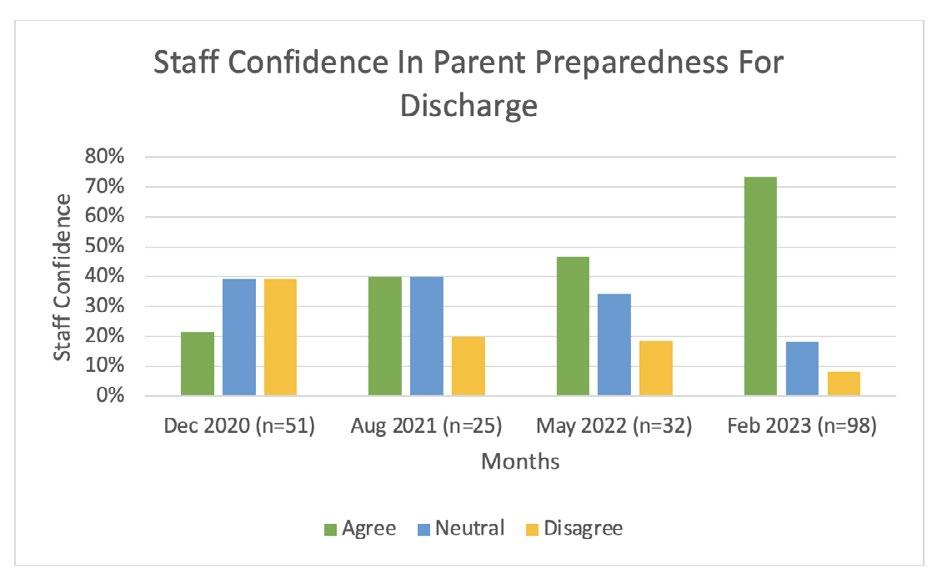
The Use of an Electronic Laser Safety Audit Form
AUTHORS
Primary: Kayla Haugen, MS, BSN, RN, CPN
Author(s)/Affiliations: Kristie Marnelos, BSN, RN and Harper Price, MD, FAAD, FAAP
BACKGROUND
Lasers are used regularly in the operating room (OR) setting for various procedures in both adults and children. Several safety checks are required prior to using a laser device, and a safety component may be easily overlooked. To help reduce near misses or errors, AORN recommends using a laser safety checklist to ensure that the OR implements appropriate safety checks before each laser procedure (AORN, 2022). Additionally, to uphold to these regulatory safety standards, health care facility and equipment safety audits should be conducted at least yearly and to the discretion of the laser safety officer (LIA, 2018). On review, our Laser Safety Committee (LSC) found that audits were not being completed consistently throughout the organization. Safety concerns discovered included lack of updated biomed inspection stickers, damaged equipment, and utilization of incorrect laser warning signs. The LSC developed an electronic audit tool to pilot in the Aerodigestive Surgery Center (ADSC), in hopes of increasing overall completion of the health care facility and equipment safety audits. Baseline data from ADSC showed that only 30% of paper audits were completed in the year of 2021. Therefore, we propose that providing an electronic audit tool will assist in making these audits easily accessible to all individuals in the OR and increase overall compliance with required safety audits.
SPECIFIC AIM
To increase the completion rate of the healthcare facility and equipment safety audits after the implementation of the electronic audit tool from a baseline of 30% (paper audits) to over 50% (electronic audits) within 8 months.
DESCRIPTION OF INTERVENTION (IMPROVE AND CONTROL)
Health care facility and equipment safety audits were transitioned from paper forms to an electronic form using Smartsheet. The electronic form was accessed through a website link, which was used to create a QR code. For convenience, QR codes were placed on the laser devices, laser equipment carts, OR computers, and badge buddies. Education on how to perform the new electronic audit tool was reviewed with all individuals in the OR. These electronic forms were filled out by the laser auditors with every laser procedure by visiting the website or scanning the QR code with a cellphone. Once the electronic form was submitted, the information from the audit automatically collected into a Smartsheet spreadsheet. Hence, the LSC gained easier access to data collected from the audits, which allowed for more rapid identification of safety concerns.
METRICS
Outcome and Process Measures
• This audit tool has proven to be convenient and easily accessible for OR staff to perform the laser safety audits. Prior to implementation, the completion rate of paper audits was only 30% (n = 43). After implementing the electronic audit tool for 3 months, the audit completion rate increased to 66% (n = 41), and then maintained at 66% after 8 months (n = 119). Overall, the completion rate of the electronic health care facility and equipment safety audits more than doubled (30% vs 66%, p 0.001) when compared to the previous paper audit form.
Balancing Measures
• Staff reluctance to use the QR code on a personal cellphone
• Completing the audit in real time, not after the case is completed
• Accountability in staff members to complete the electronic audits
IMPACT/CONCLUSION
• Implementing the electronic health care facility and equipment safety audit tool significantly improved completion of laser safety audits. Individuals in the OR reported the QR code and website link to the electronic audit tool more convenient. Making the audit tool more accessible has improved staff workflow with laser procedures in the OR. The process of collecting the data through Smartsheet has allowed a more convenient way to access and analyze data by the LSC. Additionally, these preliminary findings have assisted with identifying safety issues that may have otherwise been missed and allowed for timely intervention and process improvement when needed. Although we strive to continue to improve the overall audit completion rate, these findings support implementing the electronic audit tool throughout our health care organization in the future.
REFERENCES
1. Association of periOperative Registered Nurses (AORN). (2022). Laser Safety. In Guidelines for perioperative practice (pp. 457-478). Denver: AORN.
2. Laser Institute of America (LIA). (2018). Safe use of lasers in healthcare. In ANSI Z136 Standards (pp. 1-105). Orlando: LIA.
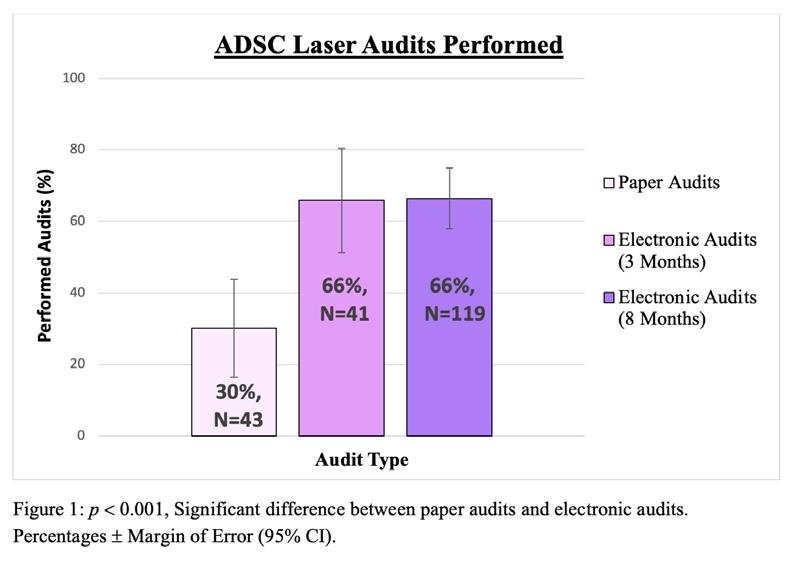
Child Passenger Safety Measurement of Car Seat Knowledge and Student Growth
AUTHORS
Primary: Blanca Villasenor, CPS-I
Author(s)/Affiliations: Liz Perez, CPS-I; Gabriela Aguayo, CPS-T
BACKGROUND
Bringing a Child Passenger Safety program out to the community is a key component in keeping children safe. In Arizona, the lack of seat restraint was the number one risk factor for motor vehicle crash deaths among children in 2021. The Child Passenger Safety program at Phoenix Children’s is designed to educate parents and caregivers about the importance and correct use of car seats, booster seats and restraints. Phoenix Children’s hosts free car seat classes and car seat checks to help families who cannot afford a car seat for their child. The class and car seat inspections are done by a National Certified Child Passenger Safety Technician. Families who attend the class complete a pre and post survey to measure attendee’s car seat knowledge before and after receiving car seat education.
SPECIFIC AIM
The Child Passenger Safety team was interested in comparing pre and post car seat knowledge of parents/caregivers attending a 2 hour car seat class followed by vehicle installation.
DESCRIPTION OF INTERVENTION (IMPROVE AND CONTROL)
Car seat classes are offered in English and Spanish by a National Certified Child Passenger Safety Technician. In the 2 hour class, families learn about rear facing car seats, forward facing car seats, booster seats and seat belts regardless the type of car seat that will be provided to the family. Attendees complete a 12 question survey testing car seat knowledge prior to starting the class and immediately after completing the class. Demographic questions such as education level, relation to child, and prior car seat experience were also collected. Vehicle installations were performed after posttest completion and inspected by certified staff.
METRICS (MEASURE AND ANALYZE)
In 2022, a total of 201 parents/caregivers participated in a 2-hour car seat class and completed a pre- and post-survey. The results of pre and post surveys only included completed surveys.
Car seat knowledge increased after attending a 2 hour car seat class that includes hands on practice from average pre-score 5 out of 12 to post score 10 out of 12 questions. Moreover, scores increased by each section (Rear-facing Car Seats, Forward-Facing Car Seats and Belt-Positioning Booster Seats). It was also noted that 44% (n=90) of the parents/ caregivers installed their car seat correctly after 1 attempt, 49% (n=99) of the parents/caregivers installed their car seat correctly after more than 1 attempt, and 6% (n=12) of the parents/caregivers did not install the car seat and needed additional assistance.
More than half of the class participants had not previously attended a car seat class, 77% (n=154), while only 23% (n=47) had previously attended a car seat class. Finally, 24% (n=48) of parents/caregivers had not installed a car seat before while 76% (n=153) had installed a car seat prior to this class.
IMPACT/CONCLUSION
The collection of pre and post data to evaluate car seat knowledge after completing a car seat class improved instruction teaching methods and measured the consistency of delivered information. Vehicle installation portion of our program helped us analyze how many attempts it takes a parent/caregiver to install a car seat correctly.
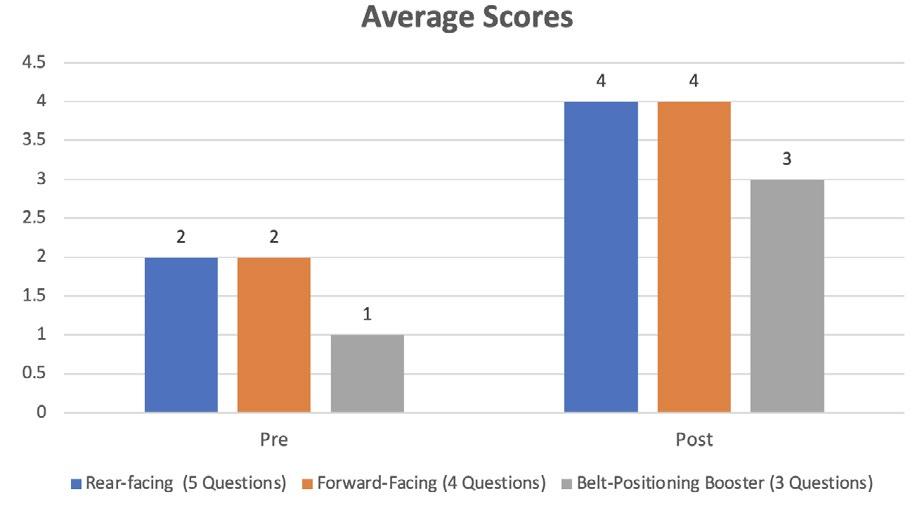
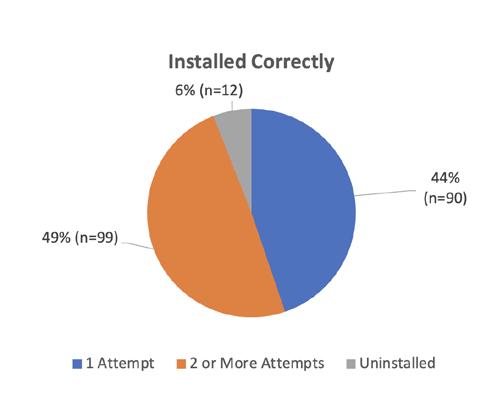
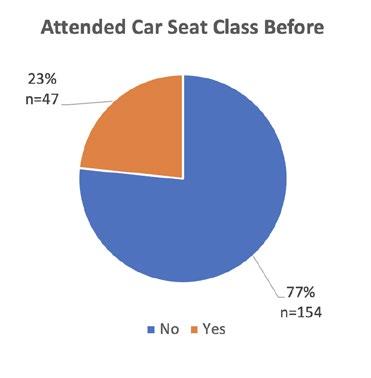
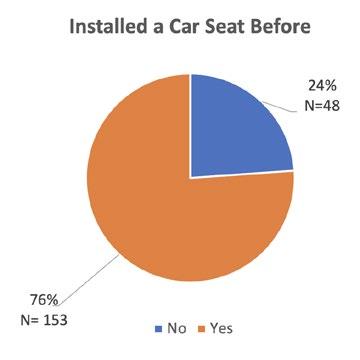
Promoting Continuity of Care Amongst Pediatric Resident Physicians in Continuity Clinic at Phoenix Children’s
AUTHORS
Primary: Parambir Bhatti
Author(s)/Affiliations: Erica Barin, DO; Benjamin Fife, MD; Michael Mooney, MD; Jake Anderson, MD; Erica Chang, MD; Candace Engelhardt, MD; Tatiana Jerome, MD; Riya Kulkarni, DO; Gabi Moros, MD; Meghan Nedic, MD; Cynthia Nino, MD; Rasa Tiano, DO; Angela Valdez-Huizar, MD; Sara Vivatson, DO
BACKGROUND
Continuity of care (COC), where the same primary care physician (PCP) cares for the child from infancy through young childhood is one of the American Academy of Pediatrics’ seven defining pillars of a medical home.1 Continuity is an important aspect of primary care, leading to improved patient-physician relations and patient outcomes.2 Studies have shown an association between higher COC and decreased emergency room visits, redundant testing, and redundant hospitalizations, as well as higher rates of well visit adherence with increased preventative screening.3 COC is especially important in primary care residency teaching clinics, where the next generation of PCPs is shaped. Within the context of residency, however, COC can be challenging to achieve. Residents work in both inpatient and outpatient settings, as well as across multiple subspecialities to meet basic Accreditation Council for Graduate Medical Education requirements. Many programs have sought to improve COC within their residency primary care clinics with varying levels of success. The Phoenix Children’s Pediatric Residency is one of the largest pediatric programs in the country and has three separate resident continuity clinics. Our focus was on improving continuity amongst categorical pediatric residents whose continuity clinic is at the Phoenix Children’s Division of Primary, Complex and Adolescent Medicine clinic. This was achieved by implementing an X+Y scheduling system, educating residents about assigning themselves as primary residents, and ordering follow up appointments with primary resident providers specifically. We followed the cumulative number of patients assigned to each primary resident and the cumulative number of continuity visits with said provider. Our aim was to increase COC amongst residents by an average of two patients annually. All three classes demonstrated improvement in both the number of primary resident assignments and continuity visits compared to baseline data with class to class variability in degree of improvement.
SPECIFIC AIM
Our aim is to increase COC amongst residents at the Phoenix Children’s Division of Primary, Complex, and Adolescent Medicine clinic from a baseline average of zero COC patients annually to at least two COC patients annually.
DESCRIPTION OF INTERVENTION (IMPROVE AND CONTROL)
Interventions used to meet our aim included (1) implementation of an X+Y scheduling system, where residents have one dedicated week monthly for continuity clinic, (2) utilizing tutorials to educate residents on how to assign themselves as primary residents, and (3) utilizing tutorials to educate residents on appropriate follow-up appointment orders. Our group also met with the scheduling team for the Phoenix Children’s Division of Primary, Complex, and Adolescent Medicine clinic to better understand the barriers in scheduling COC patients to primary resident physicians. Potential solutions to these problems were implemented within the tutorials provided to residents.
METRICS (MEASURE AND ANALYZE)
Data collected for analysis included the average number of times pediatric resident physicians assigned themselves as primary resident to patients they had seen previously and the average number of continuity visits patients had with their assigned primary resident provider. For reference, the X+Y scheduling system was implemented in July 2022. The tutorial on how to assign oneself as primary resident was provided in September 2022. An additional tutorial on how to order and/ or schedule follow-up appointments with COC patients was provided in November 2022.
IMPACT/CONCLUSION
Preliminary data collected within the first six months of the academic year already shows improvement in COC visits across all three residency classes, and it is anticipated that this improvement will continue to grow throughout the rest of this academic year. Variations between classes are expected, particularly as senior residents have had more time to establish COC with patients from previous years of their training. Additionally, limitations negatively impacting our results have already been identified, like the X+Y system being newly implemented with its own troubleshooting issues that prevent appointment slots for resident physicians being available in a timely manner to schedule follow up appointments.
Our group intends to continue working with the scheduling staff to address these limitations with hopes of achieving our initial objective.
We have also considered other potential next steps, such as assessing patient and parent satisfaction with COC amongst resident physicians. This can be further extended to assessment of the association between higher COC and rates of well visit adherence and its impact on emergency room visits and hospitalizations as well. It may also be worthwhile to conduct a longitudinal study with a focus on this year’s PGY-1 class to assess how COC is impacted by the interventions we have implemented. In doing so, a more standardized method in achieving continuity can be created that could also be utilized at the other two resident continuity clinic locations at St. Joseph’s Hospital and Valleywise Health Medical Center.
REFERENCES
1. American Academy of Pediatrics. (n.d.). What is Medical Home? Medical Home Overview. Retrieved from https:// www.aap.org/en/practice management/medical home/medical home overview/
2. Van Walraven, C., Oake, N., Jennings, A., & Forster, A. J. (2010). The association between continuity of care and outcomes: A systematic and Critical Review. Journal of Evaluation in Clinical Practice, 16(5), 947–956. https://doi. org/10.1111/j.1365-2753.2009.01235.x
3. Shortell, S. M. (1976). Continuity of Medical Care. Medical Care, 14(5), 377–391. https://doi.org/10.1097/00005650197605000-00001

Improving Communication in the Pediatric Intensive Care Unit (PICU)
AUTHORS
Primary: Morgan Neale, DO
Author(s)/Affiliations: Elizabeth Zorn, MD; Tara Kaleh, BSN, RN; Jill Haydusko, MBA, MSN, RN, NE-BC
BACKGROUND
Challenges in communication between nurses and providers are well documented in medical literature and often contribute to patient safety events1,2. Literature has shown frequent discrepancies in the perception of communication between nurses and providers in the intensive care unit,1,2 with one study suggesting that verbal miscommunications between nurses and physicians account for up to 37% of human errors in the ICU3. We sought to develop a structured communication tool able to be used in a variety of clinical scenarios to ensure efficient and thorough communication of clinical concerns.
SPECIFIC AIM
Increase the perceived effectiveness and completeness of communication between nursing and providers in the PICU and increase satisfaction with these communications by 10% over a six-month period.
DESCRIPTION OF INTERVENTION (IMPROVE AND CONTROL)
Feedback from nursing and physicians was solicited to craft a structured communication tool to address the concerns raised by each group. Using the SBAR framework, communication tools for nursing and providers were created based on the feedback provided (figures 1-2). System specific examples that demonstrated potential use of the communication tool were provided for several of the most common complaints in the PICU (figures 3-5). The tool was reviewed by nursing leadership, physician collaborators, and at the Unit Based Council with opportunities for modification prior to implementation.
Copies of both tools and the system-specific samples were posted throughout CA-6 at nursing touchdowns, hallway alcoves, and all three PICU provider team rooms. All nursing and providers received electronic copies of the tools.
MEASURES
Baseline Survey
Nurses and providers were asked to recall a recent communication about a patient’s clinical change and consider whether they felt all relevant information was provided and done in an efficient manner. They also reported satisfaction with the outcome of the conversation. If respondents recalled multiple communication scenarios, the survey answer was based on their perception of a typical encounter. All surveys were anonymous.
Post-Implementation Survey
The post implementation survey was completed after the structured communication tool had been in use for 1 month. Comments and feedback regarding the tool were actively solicited. The baseline survey demonstrates a clear discrepancy between the assessment of typical communication between nursing staff and providers.
On follow up, 50% of responding providers had utilized the tool and heard nurses utilize the nursing portion of the tool, and only 18% of the nurses surveyed initially had used the structured communication tool. Of those who had utilized the tool, very few responded to the written post implementation survey.
When asked about poor adoption of this tool, the majority reported they felt the tool to be tedious and redundant; many reporting they preferred the standard SBAR tool or their own communication model. Many nurses stated the tool limited their ability to communicate and felt that the provider response script was demeaning. Few providers responded formally, but their overall satisfaction with the script was completely favorable. The trial was discontinued.
IMPACT/CONCLUSION
The discovery that there is critical difference in the perception of efficient and complete communication between nursing staff and providers in our PICU was eye-opening. The tool that was developed to improve effective communication was rejected by nursing staff, who found the tool too restrictive, in sharp contrast to the perception of providers, who responded with complete satisfaction. Possible explanations for this sentiment include perception of the tool as a strict
script, rather than a conversational guide, particularly by experienced staff who have strong existing relationships and frequent discussions with PICU providers. Given the criticality of communication in PICU, future attempts to address communication remain important. Specific focus on subsets of nurses (new to profession or new to PICU environment), focused application of communication examples for those nurses and physicians motivated to participate, redesign of the tool to address objections, or utilization of a different approach such as individual coaching or interdisciplinary simulation based on actual examples of flawed communication could all be areas of future investigation.
REFERENCES
1. Milisa Manojlovich, Barry DeCicco; Healthy Work Environments, Nurse-Physician Communication, and Patients’ Outcomes. Am J Crit Care 1 November 2007; 16 (6): 536–543. doi: https://doi.org/10.4037/ajcc2007.16.6.536
2. Thomas EJ, Sexton JB, Helmreich RL. Discrepant attitudes about teamwork among critical care nurses and physicians. Crit Care Med. 2003;31(3):956-959.
3. Donchin Y, Gopher D, Olin M, Badihi Y, Biesky M, Sprung CL, Pizov R, Cotev S. A look into the nature and causes of human errors in the intensive care unit. Crit Care Med. 1995 Feb;23(2):294-300. doi: 10.1097/00003246-19950200000015. PMID: 7867355.

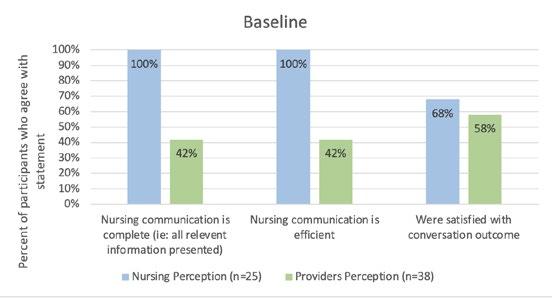
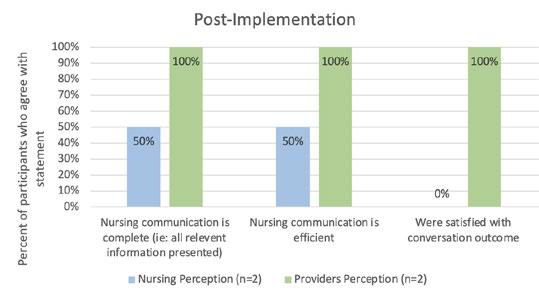
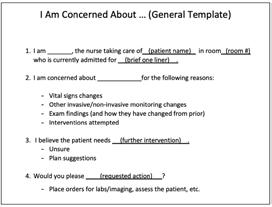
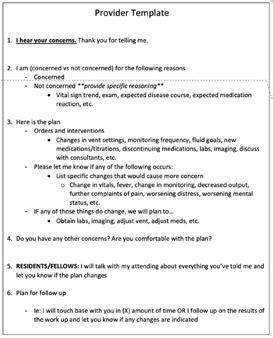

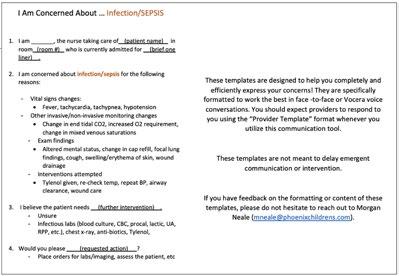
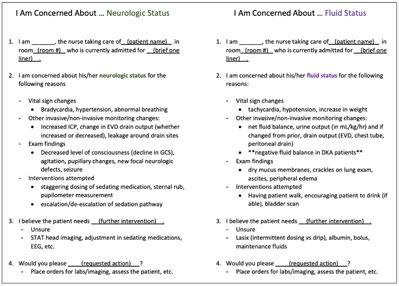
Improving Resident Preparedness in Code Blue and Rapid Reponse Events in Pediatric
Hematology and Oncology Patients
AUTHORS
Primary: Amit Rajaram, DO
Author(s)/Affiliations: Clayton Long, MD; Ross Mangum, MD; Apurvi Patel, MD, Center for Cancer & Blood Disorders
BACKGROUND
Acute patient decompensation requiring Code Blue or Rapid Response events are a frequent occurrence on the pediatric hematology oncology inpatient service. Proper execution of these emergent events requires a multi disciplinary team of physicians, nurses, and other allied healthcare professionals to successfully assess patient acuity and rapidly determine the appropriate level of intervention. Pediatric residents are integral members of this process during their time on the Red Team rotation as 2nd and 3rd year trainees. There is currently no formal educational curriculum regarding the management of Code Blue and Rapid Response events on the Red Team rotation.
SPECIFIC AIM
Improve the knowledge and preparedness of 2nd and 3rd year pediatric residents at carrying out Code Blue and Rapid Response events on the hematology-oncology inpatient service by 50% over a 12-month period.
DESCRIPTION OF INTERVENTION (IMPROVE AND CONTROL)
While rotating on the hematology-oncology inpatient service, pediatric residents participate in a mock code simulation highlighting multiple high yield cases. Clinical presentation, key labs, and evolving vitals are provided in real time by a moderator who leads group case discussion. Trainees are encouraged to ask questions, develop a management plan in response to changes in patient clinical status, and provide rationale for their clinical decisions. Debriefing session held post simulation with moderator to review key learning points from each case.
MEASURES AND RESULTS
At the beginning of each hematology oncology rotation, residents are provided with a questionnaire testing baseline knowledge of and preparedness for Code Blue and Rapid Response events in specific hematology-oncology scenarios. The mock code simulation occurs during the resident’s time on the hematology oncology rotation. At the completion of the rotation, the residents are again provided the same questionnaire as well as additional survey questions, assessing the utility and efficacy of the mock code curriculum at increasing resident knowledge and preparedness for Code Blue and Rapid Response events.
PDSA Cycle #1: September 2022-mid December 2022
Residents were provided with the baseline questionnaires at the beginning (average score 8/10, n=15) and end (average score 7.25, n=15) of the hematology-oncology rotation without undergoing the mock code simulation.
PDSA Cycle #2: Mid December 2022- March 2023
The same pre and post rotation questionnaires were provided to residents. Mock code simulations were conducted during the rotation during this cycle. In addition to assessing changes in resident knowledge and preparedness for these emergent events, the post rotation questionnaire also included additional survey questions soliciting subjective feedback on the perceived quality and usefulness of the mock code simulations in this setting. Average pre simulation score was 6/10 (n=4) and average post simulation score was 8.25/10 (n=4). Subjective evaluation of the helpfulness of the mock code simulations and how much they enriched the educational experience rated as 9/10 for both metrics on resident surveys.
CONCLUSIONS
The introduction of the mock code curriculum on the hematology-oncology rotation appears to be a potentially beneficial addition to the resident educational experience. Though the number of questionnaires completed is insufficient to make any statistically significant conclusions, the preliminary data coupled with the residents’ subjective evaluation of the simulations suggests that the addition of a formal mock code curriculum would be a valuable addition to the Red Team rotation.
Improving Identification and Treatment of Neonatal Late Onset Sepsis in the NICU
AUTHORS
Primary: Ashley Mancuso RN, MSN, RNC-NIC
Author(s)/Affiliations: Jessica Wickland, MD
BACKGROUND
We identified a delay in recognizing signs and symptoms of late onset infection and sepsis in the neonatal population through a cluster of cases with sepsis related morbidity and mortality. A lack of communication of changes in clinical symptoms, inconsistency in laboratory studies ordered, and delay in time to administration of antibiotics were found to be common barriers leading to delayed treatment.
SPECIFIC AIMS
Global Aim
Improve identification and treatment of neonatal late onset sepsis in the NICU Smart Aim
Administer antibiotics within 60 minutes of order placement of a sepsis evaluation >50% of the time in Phoenix Children’s NICU by June 2023.
DESCRIPTION OF INTERVENTION (IMPROVE AND CONTROL)
Several cases were presented through a protected case review identifying an opportunity to recognize and treat sepsis more efficiently. This led to the development of an action plan outlining the need for a standardized order set and treatment guideline. A multidisciplinary work group was initiated to implement this project. The workgroup created the Neonatal Late onset infection guideline (Fig1.)
METRICS (MEASURE AND ANALYZE)
Outcome Measures
Include, ordering the correct dose of gentamicin for the patient’s age and corrected gestation more than 75% of the time. Process Measures
Include the utilization of the NICU sepsis evaluation order set 75% of the time when a septic work up is ordered. Balancing Measures
Include monitoring for an increase in antibiotic drug resistant organisms and an increase in the number of sepsis evaluations ordered. The first intervention in January 2023 was providing education on the new Late Onset Infection Guidelines (Fig 1), and availability of the NICU Sepsis Order Set (Fig 2) containing all common antibiotics with appropriate doses and default to “STAT” status. The second intervention was the creation of a nursing communication prompt to improve communication between nursing staff and providers on concerns for changes in patient status. The third intervention was case based education on identification of a patient with sepsis for all NICU staff February and March 2023.
RESULTS
Baseline data collection showed antibiotics were only administered within one hour 20% of the time, the order set was only utilized 20% of the time, and the correct dose of gentamicin is ordered 55% of the time. Additional data tracking following the interventions are being collected.
CONCLUSIONS/IMPLICATIONS
Early identification and treatment of late onset infection will lead to improved outcomes for neonates. Areas for future intervention include feedback or notification of providers who are not using the NICU Sepsis Order Set and evaluation for additional barriers to antibiotic administration, such as IV access.
FIGURES/TABLES
See Attached. Figure 1 is the Neonatal Late Onset Infection Guideline and Figure 2 is the NICU Sepsis Evaluation Order Set.
REFERENCES
1. Magers J, et al. Safety and efficacy of nafcillin for empiric therapy of late onset sepsis in the NICU. Pediatrics. 2022; 149(5): e2021052360
2. Cantey, JB and Lee JH. Biomarkers for the diagnosis of neonatal sepsis. Clin Perinatol. 2021; 48:215-227.
3. Srinivasan, L., et al. (2022). Clinical pathway for evaluation and treatment of suspected sepsis in N/IICU patients. Retrieved from www.chop.edu/clinical-pathway/sepsis-niicu-clinical-pathway
4. Jensen, K (2020). Neonatal Sepsis. Retrieved from www.pedscases.com/neonatal-sepsis
5. Weiss SL, Peters MJ, Alhazzani W, et al. (2020). Surviving sepsis campaign international guidelines for the management of septic shock and sepsis associated organ dysfunction in children. Pediatric Critical Care Medicine 21: e52–e106. doi: 10.1097/PCC.0000000000002198
6. Dong, Y. & Speer, C. P. (2015). Late-onset neonatal sepsis: recent developments. Archive of Disease in Child Fetal Neonatal Edition 100(3): F257-63. doi: 10.1136/archdischild-2014-306213


Bypassing ED to ED Transfer for Pediatric Appendicitis Transfer Cases:
Evaluation of the FAST (Floor Admission
to
Surgery Team) Protocol
AUTHORS
Primary: Richard Scott Eldredge, MD
Author(s)/Affiliations: Brielle Ochoa, MD; Tony Ferrantella, MD; Tiffany Zens; MD; Zeb Hunteman; Janelle Novotny; Jennifer Hamilton; Todd Nickoles, MBA, BSN, RN, CPN, TCRN; Robert Yniguez, MD; Craig Egan, MD; Jamie Harris, MD; Dorothy Rowe, MD; Justin Lee, MD
BACKGROUND
A multidisciplinary collaborative transfer protocol, entitled the Floor Admission to Surgery Team (FAST) was developed with emergency department, radiology, and surgical service. The protocol triaged transfer cases of acute appendicitis to direct admission, bypassing ED-to-ED transfer. With pediatric appendicitis being one of the most common pediatric surgical conditions, this protocol can assist in limiting cost to patients for ED admissions and preserving ED space.
SPECIFIC AIM
To increase the rate of direct admission for acute appendicitis cases in accordance with the FAST protocol across the years of 2021 and 2022 through resident education, quarterly reports, and a quality initiative announcement.
DESCRIPTION OF INTERVENTION (IMPROVE AND CONTROL)
Residents were educated on the implementation of the FAST protocol, quarterly reports on the direct admission of acute appendicitis cases were given at each division meeting, and protocol compliance was announced as a division wide quality improvement project.
METRICS (MEASURE AND ANALYZE)
Outcome Measures
Protocol compliance rate, expressed as change in the direct admission transfer rate. Retrospective review of all appendicitis cases was performed using pediatric NSQIP data and institutional electronic health record. The FAST protocol included transfer cases with imaging proven diagnosis, on call resident to sending ED discussion, and review of imaging findings prior to transfer. Overall, protocol compliance rate increased from 68.3% to 87.6%. Most common reasons for ED-to-ED transfer were not meeting diagnostic imaging criteria followed by alternative diagnoses and COVID positivity.
IMPACT/CONCLUSION
Our study demonstrates that a direct admission transfer protocol for pediatric appendicitis is feasible with appropriate pretransfer diagnosis. Multidisciplinary collaboration and sharing the goal of completing a division wide qualitative improvement project significantly improved protocol compliance and implementation.
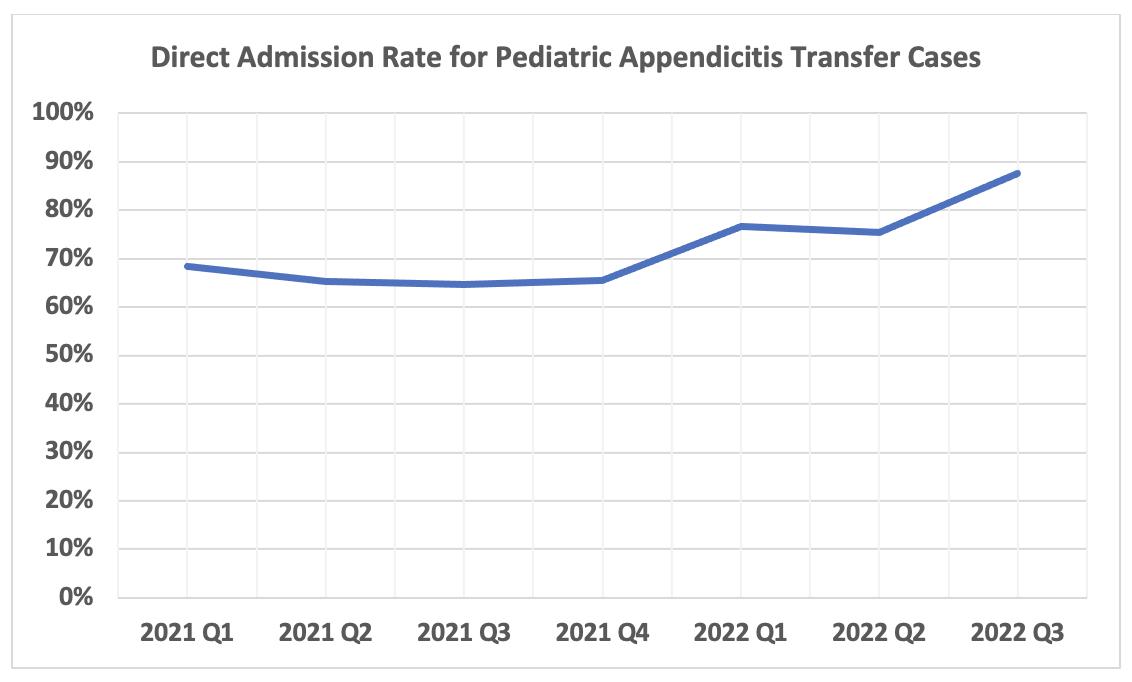
Increasing Parent Education to Decrease Serious Pediatric PIV Infiltrates
AUTHORS
Primary: PIVIE Core HAC Team
Author(s)/Affiliations: Nima Desai, Andrea Polach, Gretchen Schwindt, Melinda McLaughlin, Megan Morgan
BACKGROUND
Serious peripheral intravenous line infiltrates and extravasations (PIVIE) is a hospital acquired condition (HAC) that is monitored and reported to the Solutions for Patient Safety (SPS) network. Phoenix Children’s (PC) developed a PIVIE committee to prevent the serious PIVIEs among hospitalized children. The PIVIE committee is comprised of nurses, providers, quality consultants, and parent volunteers working together to prevent harm from peripheral intravenous (IV) catheters. When the committee re-structed two years ago, PC was above the centerline for serious PIVIEs. As a group, the committee analyzed data to detect risk factors and demographic characteristics common among pediatric inpatients increasing their risk for moderate and serious PIVIE events. The team determined children with developmental delay and those who cannot communicate verbally were at highest risk for harm related to PIVIE. The team also reviewed bundle compliance and patient education and determined there was an opportunity to improve the quality of patient and family teaching. Commonly, a family member is at the bedside of a patient in the acute and critical care departments, and they are uniquely attuned to subtle changes in their child’s comfort level. Patient discomfort is an early symptom of PIVIE. The child may complain of pain or burning sensation at the site (INS, 2021). For this reason, the team designed an intervention to increase the patient and family’s engagement in the bundle compliance process. The SPS (2019) recommended element for PIVIE prevention is teaching patients and families to watch for PIVIE symptoms and educating them on the nurse’s peripheral IV assessment method.
ENTER BASELINE DATA
East Tower serious PIVIE rate = 0 serious PIVIE/1000 patient days
PROCESS
The PIVIE committee, in collaboration with the Emily Center and Business Information Systems, created a family engagement video to educate patients and families about peripheral IV catheters, infiltration prevention, concerning symptoms, and when to contact a nurse or a provider.
STUDY/MEASUREABLE GOAL
Decrease Serious PIVIE by 10% in 5 months.
ACTIVITY
Through the Patient To-Do’s platform, we sent a video link via text message to the patient’s legally authorized representative (LAR). Patients included in the study were admitted to the East Tower inpatient unit located in floors 2, 3, and 4, and had an active order for a peripheral IV catheter.
DATA/MONITOR PROGRESS
The PIVIE team monitored the Serious PIVIE rate before and after the introduction of the family engagement video. The team collected process measures including the number of video To Do’s assigned, percent of video To Do’s completed, and LAR feedback on the quality and effectiveness of the patient education offering.
UNKNOWN VARIABLES
During the PDSA cycle, the SPS changed the definition of a serious PIVIE which resulted in the reclassification of the East Tower serious PIVIE events reported in the baseline data.
OUTCOME
During the study, there were zero serious PIVIEs and the total PIVIE rate decreased by 13.8%. Additionally, the family’s responses to the engagement video were overwhelmingly positive. As a result, the PIVIE team plans to spread the family engagement video intervention to all pediatric inpatients in the acute and critical care departments. This study also demonstrated the need for diverse education methods among hospitalized inpatients. Healthcare team members should carefully assess the patient and LAR’s learning preferences and avoid over-relying on one method to engage children and families in hospital safety practices and HAC prevention.
REFERENCES
1. Infusion Nurses Society. (2021). Infusion therapy standards of practice. Retrieved from https://www.ins1.org/ publications/infusion therapy standards of practice/
2. Solutions for Patient Safety. (2019). Peripheral IV infiltrations and extravasations (PIVIE) prevention bundle 1.0. Retrieved from https://portal.solutionsforpatientsafety.org/CookieAuth.dll?GetLogon?curl=Z2F&reason=0&formdir=23

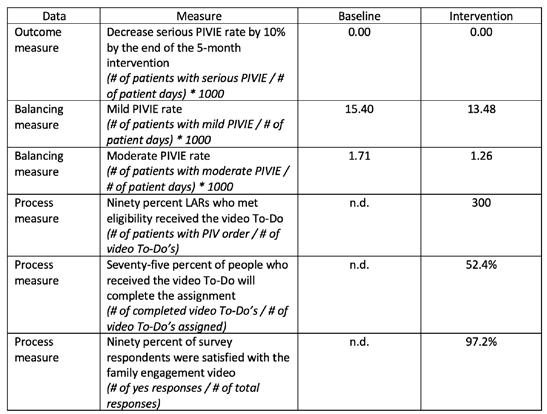
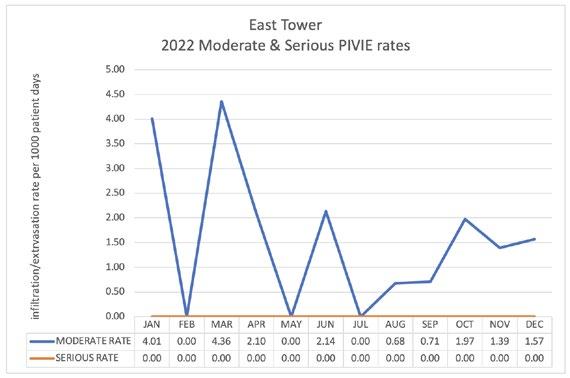
Percent of Correctly Ordered Amoxicillin/Clavulanate at Phoenix Children’s
AUTHORS
Primary: Christian Armstrong
Author(s)/Affiliations: Wassim Ballan, MD
BACKGROUND
Amoxicillin/clavulanate is a beta lactam/beta lactamase inhibitor that is used to treat a wide variety of infectious conditions. There are currently 7 formulary options at varying ratios of amoxicillin to clavulanate available on the formulary at Phoenix Children’s. Selection of the proper formulary agent and proper dosing frequency depend on the site of the infection, age of the patient, ability to take tablets vs suspension and body weight. Dosing of the amoxicillin portion ranges anywhere from 15 to 90 mg/kg/day depending on the indication, but one must also consider the beta-lactamase inhibitor, clavulanate. In pediatric patients, it is recommended that the clavulanate portion be dosed between 5 – 10 mg/ kg/day to obtain appropriate inhibition of the beta lactamase produced by bacteria and avoid adverse effects associated with doses of clavulanate > 10 mg/kg/day. Given the various dosing recommendations based on indication, varying frequencies of administration, numerous formulary options to choose from, dosing that must select the correct ratio of amoxicillin:clavulanate to deliver the correct amount of medication, it is easy to see the propensity for dosing errors that could lead to undertreatment or greater adverse effects.
A medication use evaluation (MUE) was performed to assess the dosing of amoxicillin/clavulanate at Phoenix Children’s. From January to June 2022, a total of 285 orders of amoxicillin/clavulanate were assessed for appropriate dosing based on the infection being treated. The primary outcome showed a total of 59% of orders were dosed inappropriately leaving our patients at risk for repeat infections and increased risks of adverse effects.
SPECIFIC AIM
Increase the correct prescribing practices of amoxicillin/clavulanate by 40% within one year of implementation of educational and Phoenix Children’s institutional dosing recommendations.
DESCRIPTION OF INTERVENTION (IMPROVE AND CONTROL)
Initial interventions were primarily education of the medical residents and pharmacists at Phoenix Children’s that included:
• Education of fourteen pharmacists on June 6, 2022, describing the appropriate dosing of amoxicillin/clavulanate
• Daily education to point of care pharmacists on the General Pediatrics floors in July 2022.
• Presentation of MUE findings to the pharmacy department on September 14, 2022.
• Email education on amoxicillin/clavulanate dosing to the medical residency program at Phoenix Children’s on October 18, 2022.
METRICS (MEASURE AND ANALYZE)
Primary Outcome
Percentage of amoxicillin/clavulanate orders that are prescribed correctly. Definition of correct prescribing includes:
• Suspensions
Respiratory tract infections (Concern for Streptococcus pneumoniae): 90 mg/kg/day
Otitis media: Twice daily dosing with a max dose of 2 grams
All other infections: Three times daily dosing with a max dose of 1 gram
Non-respiratory tract infections: 15 to 50 mg/kg/day
Bite wound prophylaxis and neonatal dosing: Twice daily dosing
All other indications: Three times daily dosing
Clavulanate dosing: 5 – 10 mg/kg/day
• Tablets: For patients taking whole tablets and weighing > 20 kg:
For patients 20 - 39 kg: One tablet twice daily
For patients > 40 kg: Can take one tablet three times daily
Clavulanate: 5 – 10 mg/kg/day
For patients > 50 kg okay to have a clavulanate < 5 mg/kg/day
Secondary Outcomes
• Identify most frequent dosing errors
• Frequency of dosing based on formulation
RESULTS
Since initiation of education in the pharmacy department and medical residents, there has been an increase in the amount of correct prescribing practices of amoxicillin/clavulanate (Figure 1). We have seen an initial increase in the correct ordering by approximately 20%. The root cause of most of the incorrect prescribing patterns follows under one of the three items (Figure 2):
1. When to use twice daily dosing compared to three times daily dosing
2. Selecting the correct product that will deliver the correct amount of amoxicillin and clavulanate
3. Confusion of when to use high dose vs low dose amoxicillin
The top three formulations prescribed during the study period included the following and account for approximately 85% of all orders:
• Amoxicillin 600 mg – clavulanate 42.5 mg/5 mL suspension
• Amoxicillin 400 mg – clavulanate 57 mg/ 5 mL suspension
• Amoxicillin 875 mg – clavulanate 125 mg tablet
The 2:1 and 4:1 tablet formulations of amoxicillin:clavulanate were used in low numbers and only accounted for 3.5% overall use.
IMPACT/CONCLUSIONS
Education of the pharmacy department and medical residents has helped to initially increase the amount of correct prescribing of amoxicillin/clavulanate. The MUE has raised awareness of the confusion surround amoxicillin/clavulanate dosing at Phoenix Children’s. To further sustain our efforts, we have proposed the removal of all the 2:1 and 4:1 amoxicillin: clavulanate formulations. Dose range checking will be set on individual formulations to provide alerts to providers when they order incorrect doses based on the formulation being prescribed. Upon ordering we will also have dosing information on each formulation to help the prescriber to the correct mg/kg/day of amoxicillin and the correct frequency. A dosing algorithm has also been proposed and accepted by the Pharmacy and Therapeutics committee in February 2023 to standardize dosing at Phoenix Children’s.
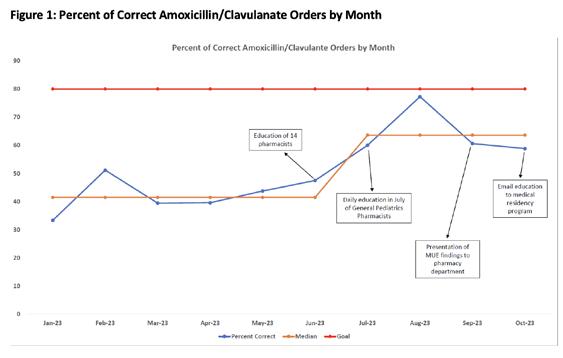
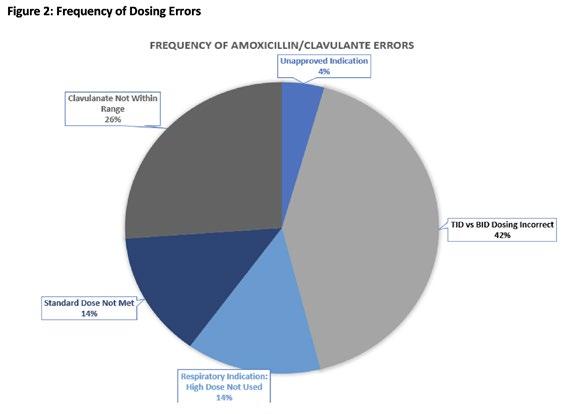
Implementation of an Evidence-Based Checklist and Effective Implementation Modalities in Pediatric Colorectal Surgery
AUTHORS
Primary: Brielle Ochoa, MD
Author(s)/Affiliations: Richard Scott Eldredge, MD; Tony Ferrantella, MD; Tiffany Zens, MD; Jared Carmichael, BS; Janelle Novotny, BSN, RN; Jennifer Hamilton, MSN, RN, CPN; Todd Nickoles MBA, BSN, RN, CPN, TCRN; Dorothy Rowe, MD; Justin Lee, MD
BACKGROUND
Clinical bundle checklists have been shown to decrease surgical site infections (SSI) in pediatric colorectal surgery, and our institution is part of the National Surgical Quality Improvement Program Pediatric (NSQIP Pediatric). In order to report data and evaluate pediatric surgical complications, such as SSI, for quality improvement purposes, we needed to be able to easily capture action items that surgeons perform before, during, and after colorectal surgery. A clinical bundle including evidence-based checklist items was implemented in 2021 and monitored for checklist compliance through 2022.
SPECIFIC AIM
To analyze compliance with checklist completion for colorectal surgeries performed by pediatric general surgeons during different checklist implementation phases from 2021 to 2022, and to analyze individual checklist item completion.
DESCRIPTION OF INTERVENTION
Retrospective review of pediatric colorectal procedures was performed using pediatric NSQIP data and institutional electronic health record (EHR). Compliance with checklist items was evaluated for each strategy. Implementation strategies of the clinical bundle checklist included division meeting announcements, paper checklists, and automated EHR operative note dotphrase (Figure 1).
METRICS (RESULTS)
59 cases were identified with case distributions of 10 during the division meeting announcement phase, 20 during the paper checklist phase, and 29 during the EHR operative note dotphrase phase. With regards to our primary outcome measure, compliance with checklist completion increased significantly across phases from 41.5% to 78.4% to 94.5% (Figure 2). For our secondary outcome measures, we evaluated individual checklist items. Across all cases for individual checklist items, high compliance items included 24-hour postoperative antibiotic duration (100%), wound check within 48 hours (94.9%), and anastomotic leak test (86.4%). Low compliance items were use of dedicated clean closure tray (59.3%), glove change prior to closure (59.3%), and umbilical cleansing (69.5%). For our process measures of the study, compliance significantly improved during the study period: dedicated clean closure tray (0% to 93.1%), glove change prior to closure (0% to 89.7%), and umbilical cleansing (10% to 89.7%).
IMPACT/CONCLUSION
Implementation of a clinical bundle checklist for pediatric colorectal surgery is feasible, and high compliance was achieved with EHR dotphrase implementation. Overall compliance with checklist completion and individual checklist item completion improved during the study period. Quality initiatives using various implementation strategies can help identify and improve low compliance items. EHR use is an ideal implementation strategy for checklists given that all surgeons must enter operative notes and we have the capability of having this built into the EHR note template. Future study is needed to evaluate consistency in completion of checklist items going forward and to evaluate how checklist items are related to the incidence of SSI at our hospital and how our outcomes fare in relation to national averages.
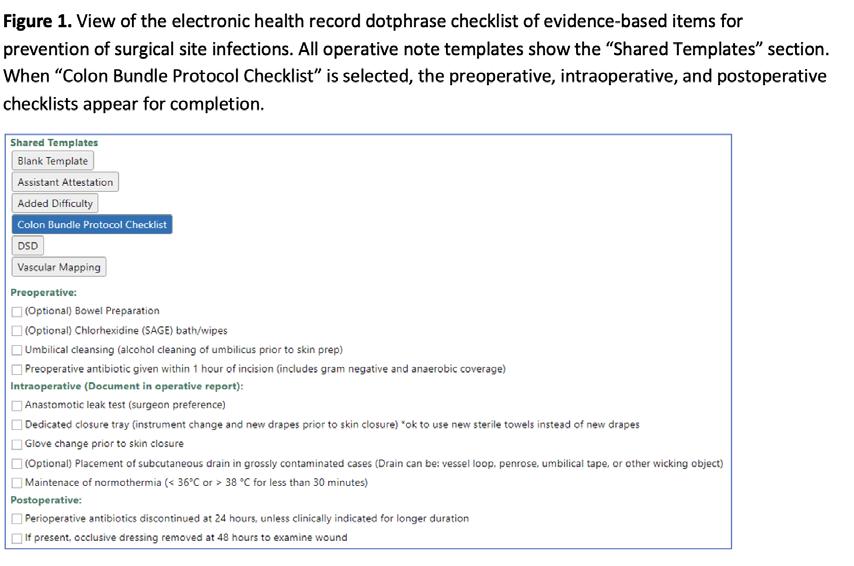
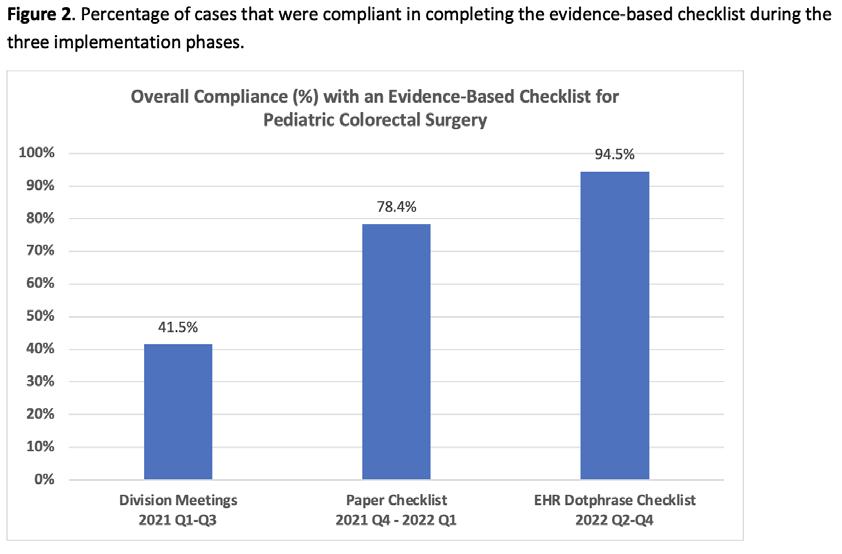
Improving Nursing Comfort Level with Screening for Chemotherapy-Induced
Neurotoxicity (CIN) of High-Risk
Hospitalized Hem/Onc/BMT Population
AUTHORS
Primary: Bri Best MSN, RN
Author(s)/Affiliations: Iris Marku PNP-AC, Kristen Beebe PA-C, Lynnette Acosta MSN-ED, RN, CPN, Heather Betts FNP, Aimee Bucci DNP, CPNP-AC
BACKGROUND
Patients with hematological/oncological disease receiving chemotherapy medications are at high risk for acute neurological compromise. In 2021, the highest rate of “Code Blue” in our hospital outside of the ICU occurred in the hematological/oncological population with acute neurological decline (RRT data, 2021).
Chemotherapy induced neurotoxicity is an alteration in a patient’s normal nervous system activity, ranging from mild cognitive deficits to fulminant cerebral edema, stroke, seizures, and death (Bhojwani et al., 2021; Cordelli et al., 2017). The literature demonstrates that early identification and communication of neurologic decline in high-risk hospitalized Heme/Onc/BMT pediatric populations leads to better patient outcomes. Patients receiving neurotoxic chemotherapy are at high risk for neurological compromise and should be screened routinely for early clinical changes, offering an opportunity for communication and clinical intervention.
Through a needs assessment, a multidisciplinary APP team identified a lack of standardized nursing neurologic assessment tools and knowledge of CIN symptoms as a modifiable factor in delayed recognition of patients’ neurological decline. The goal of the current intervention is to increase the comfort level and knowledge of inpatient Heme/Onc nurses of CIN symptoms by implementing standardized neurotoxicity screening tools (NST) through clinical treatment pathways. Cornell Assessment of Pediatric Delirium (CAPD) and Immune Effector Cell encephalopathy (ICE) scores have been validated in children for screening and grading of chemotherapy-related encephalopathy. These tools are age-specific and will be performed by the bedside nurse Q shift starting prior to, during, and post exposure to a medication.
Acute care Heme/Onc/BMT nurses (n=37) received education and participated in the pre/post-education surveys. The most frequent pre-education comfort level was 3 or somewhat comfortable (n=13), with an improvement to 4 or very comfortable (n=21) for the post-education comfort level. Results of the two-tailed Wilcoxon signed rank test for the pre and post-education comfort levels were significant based on an alpha value of .05 and p < .001. The average nurse score for the pre-education formative assessment was a 76.7%, compared to 86.66% for the post-education formative assessment.
PURPOSE
The purpose of the quality improvement (QI) project is to increase nursing comfort level and knowledge related to chemotherapy-induced neurotoxicity (CIN) in high-risk hospitalized patients through the implementation of pathologyspecific education series for inpatient nurses. The goal is to increase early recognition of CIN symptoms, improve communication with providers, and promote early intervention, to ultimately improve patient outcomes, safety, and patient/family satisfaction.
DESCRIPTION OF INTERVENTION (IMPROVE AND CONTROL)
A multidisciplinary team identified best practice parameters for screening and monitoring for CIN for high-risk hospitalized patients through a literature review. Eight high-risk therapies have been highlighted based on neurotoxicity prevalence and severity. A standardized workflow has been developed to include routine nursing screening for CIN by age-specific neurotoxicity screening tools for predetermined highly neurotoxic medications. A target goal of 140 Heme/Onc/BMT nurses have been identified to receive an educational intervention.
A multidisciplinary team, including an Arizona State University (ASU) Doctor of Nursing Practice (DNP) student, nursing educators, nursing leadership, and advanced practice providers (APP) from neurocritical care and Heme/Onc/BMT were assembled to develop a nursing CIN education module and pre- and post-education survey questions. The pre- and post-education surveys included a Likert-type scale to assess comfort level with using the NSTs, followed by formative assessments to examine knowledge. The education module included unit guidelines for using and documenting NSTs and appropriate times for communication. All Heme/Onc/BMT nurses in attendance received the education and were able to participate in the pre- and post-education surveys willingly and anonymously. The DNP QI project has received approval
from Arizona ASU Institutional Review Board, Phoenix Children’s Quality Project Review Board, and Phoenix Children’s Nursing Practice Council. Additionally, the APPs on the multidisciplinary team are creating a provider education module to help increase provider awareness of CIN.
BMT-certified nurses have received education on CIN by using previously implemented NSTs. This initiative is expected to expand to the remaining Heme/Onc nurses by the end of 2023.
SPECIFIC AIMS
Increase nursing comfort and knowledge of neurotoxicity screening tools to ultimately improve recognition of chemotherapy-induced neurotoxicity (CIN) of high-risk hospitalized Heme/Onc/BMT population. Outcome Measures
• Increase rate of inpatient nurses caring for high-risk Heme/Onc/BMT patients verbizing comfort level with recognizing CIN from 50% (already educated BMT nurses) to 80% (BMT nurses and Heme/Onc nurses without BMT cert.) within 12 months.
Process Measures
• Percentage of Heme/Onc/BMT nurses who completed the educational intervention.
• Percentage of Heme/Onc/BMT nurses completed post-education surveys.
Balancing Measures
• Nursing time- education and survey completion
IMPACT/CONCLUSION
We have concluded that nursing comfort and knowledge of screening for CIN increased with education intervention. Therefore, this education will continue to expand to all Heme/Onc nurses who are expected to care for high risk patients. As standard implantation of CIN screening pathway is being introduced to clinical practice, future processes are being developed to evaluate how these interventions translate into patient outcomes.
REFERENCES
1. Bhojwani, D., Bansal, R., & Wayne, A. S. (2021). Managing therapy-associated neurotoxicity in children with ALL. Hematology, 2021(1), 376–383. https://doi.org/10.1182/hematology.2021000269
2. Cordelli, D. M., Masetti, R., Zama, D., Toni, F., Castelli, I., Ricci, E., Franzoni, E., & Pession, A. (2017). Central nervous system complications in children receiving chemotherapy or hematopoietic stem cell transplantation. Frontiers in Pediatrics, 5, 105–105. https://doi.org/10.3389/fped.2017.00105
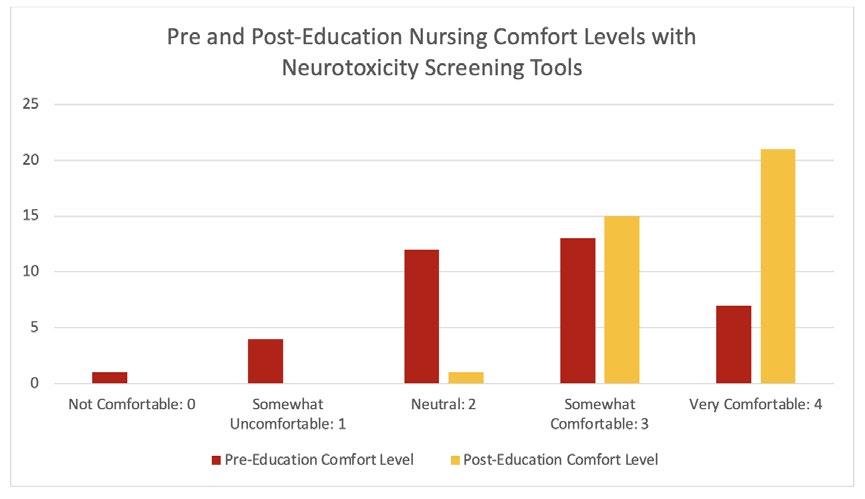
Improving Accuracy of Length Measurements for Infants with
Bronchopulmonary Dysplasia in the NICU
AUTHORS
Primary: Pamela Griffiths
Author(s)/Affiliations: Kim Maryniak, PhD, RNC-NIC, NEA-BC; Nisha Patel, RD; Aasma Hasan, RN; Sarah Lee Hegre, RNC-NIC, MSN-L; Kasey Bowles, RN; Karina Smith, RN; Jenna Lee, RN; Tara Kaleh, BSN, RN
BACKGROUND
Growth is important for the long-term respiratory and developmental outcomes for infants with bronchopulmonary dysplasia (BPD). Weight measurements may not be reflective of overall growth status for multiple reasons, including excess fluid accumulation and abnormal utilization of nutrients. Linear growth, however, is more reflective of overall wellness and has been correlated with improved respiratory function and developmental outcomes1. Linear growth trends are an important factor considered in the plan of care for infants with BPD and may lead to changes in nutritional intake or composition, ventilator support, and medication exposures. Obtaining accurate lengths is important to ensure these decisions can be made appropriately2. Length boards are the most accurate method for measuring length and are standard of care3
In the Phoenix Children’s neonatal intensive care unit, while length board use is the recommended method of measurement, it is inconsistently done. Also, there is a significant degree of variability in the measured lengths. There are several barriers identified that lead to low compliance with use of length boards (see driver diagram).
SPECIFIC AIM
• Improve compliance with using length boards for infants with Grade 2 and 3 BPD from baseline (estimated <50%, not documented) to 75% within 3 months
• Increase compliance with using length boards for infants with Grade 2 and 3 BPD from baseline (estimated <50%, not documented) to 95% within 6 months
• Decrease variability of length measurements in infants with Grade 2 and 3 BPD from baseline (1.9%) to less than <1.5% within 6 months
• Demonstrate a 25% improvement within 3 months from pre- to post-survey of staff responses regarding the question “Why is a reliable assessment of growth patterns in early postnatal life important?”
DESCRIPTION OF INTERVENTION (IMPROVE AND CONTROL)
This project will introduce one intervention at a time and assess measurements.
• Administer survey to assess baseline knowledge and barriers
• Length board campaign created, including education on importance of length measurements and how to use length board
• Identify location in SCM to document length board use when taking the measurement and educate nurses on how to document
• Add length, with reminder, to white board to emphasize the importance to family and nurses, and assist with tracking trends related to previous measurements
• Add signs on scales as a reminder to use length board when weighing
• Plan for deliberate extra help for Sunday nights to be an extra set of hands for measuring length, especially with intubated patients
• Encourage family to be present to participate
• Ensure house supervisor aware that Sunday night helper is priority
• Discuss of lengths on rounds
METRICS (MEASURE AND ANALYZE)
This project is currently in process. Following education and project aims met, the measures that will be tracked with this project are:
Outcome Measures
• Variability in length measurements
• Survey results - pre-education and post-education
• Any triggers indicated for re measuring
Process Measures
• Percent documentation of length board use Balancing Measures
• Unplanned extubation related to length measurement
IMPACT/CONCLUSION
At the conclusion of this the project, there will be increased awareness of the importance of accurate length, and a standardized process in place for using length boards in patients with severe BPD. Variability in measurement will be reduced, and there will be more informed decision-making for individual patients. Barriers to accurate length measurements in BPD patients will be identified and addressed, which can then be applied to the entire unit population. A unit-specific policy will be created on growth measurements to sustain improvements from this project.
REFERENCES
1. Sanchez-Solis M, Perez-Fernandez V, Bosch-Gimenez V, Quesada JJ, Garcia-Marcos L. Lung function gain in preterm infants with and without bronchopulmonary dysplasia. Pediatr Pulmonol. Sep 2016;51(9):936-942.
2. Thornton, J. (2021). The impact of a growth measurement training program on the use of length boards in a newborn intensive care unit (thesis). Indiana University. https://scholarworks.iupui.edu/bitstream/handle/1805/26338/ THORNTON_Thesis_Final_6.22.21.pdf?sequence=1
3. Flaherty-Hewitt, M. (2021). Nutrition and growth measurement technique. https://emedicine.medscape.com/ article/1948024-technique?icd=login_success_email_match_norm
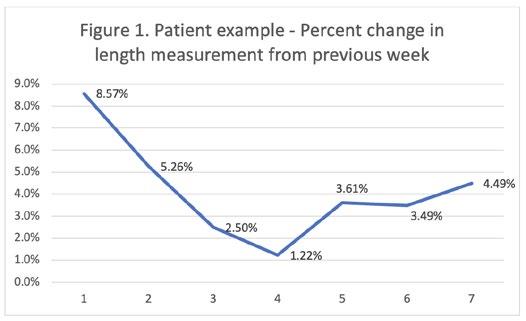

Creation of a Pre-Flight Plan Checklist
for Admissions to CVICU to Improve Efficiency and Preparedness of the Team
AUTHORS
Primary: Katherine Harrison
Author(s)/Affiliations: Josh Koch, MD
BACKGROUND
Patients admitted to the CVICU are often in various stages of recovery following a procedure or operation. Often times, they arrive to CVICU and need immediate intervention from the care team, whether that is sedation, volume resuscitation, titration of vasoactive medications, or blood products. With the turnover in our more experienced RN staff, as well as varying levels of providers in the CVICU (residents, fellows, senior fellows, APPs, and attendings), it has been challenging to quickly intervene on these patients due to lack of needed items at the bedside. Currently in the CVICU, we have roughly 80% of our RN staff with under 2 years of experience. Data has shown that the more experienced the RN staff in the CVICU, the better the outcomes. Historically, nursing schools do not adequately prepare the new graduate RN to care for critically ill patients.
SPECIFIC AIM
• Decrease handoff times by 10% from baseline within 3 months of implementation.
• Improve RN confidence by 25% in their ability to safely care for our high-acuity population within 3 months of implementation.
• Improvement in provider confidence in the ability of the bedside team to care for the patients within 3 months of implementation.
• We will have at least 75% compliance with doing this pre-flight plan for all admissions within 6 months of implementation.
DESCRIPTION OF INTERVENTION (IMPROVE AND CONTROL)
Create a standardized template to help improve the efficiency and preparedness of the team caring for patients admitted to the CVICU. The pre-flight plan will consist of the entire care team (RN, RT, medical provider team) coming to the bedside prior to the arrival of the patient, briefly discussing the patient’s physiology, potential complications, anticipated needs (medications, ventilator etc), and likely status of the patient upon their arrival.
METRICS (MEASURE AND ANALYZE)
• Pre and post surveys of CVICU RN and provider staff, assessing their comfort with caring for the patient (RN), comfort with RNs level of preparedness to care for the patient (provider), and having the necessary equipment and other items needed at the bedside.
• Pre and post measurement of the length of time needed to complete handoff of the patient from the OR/Cath lab/ IR/CT scan/MRI. Theory is that if RN and team are better prepared to receive the patient they will be more efficient in handoff.
IMPACT/CONCLUSION
By better preparing the bedside team to adequately care for our critically ill patient population, we hope to improve outcomes and efficiency of the team. Having a bedside team that is better prepared and more comfortable to care for a patient will improve overall job satisfaction and grow the skill level of our very junior nursing staff in the CVICU.
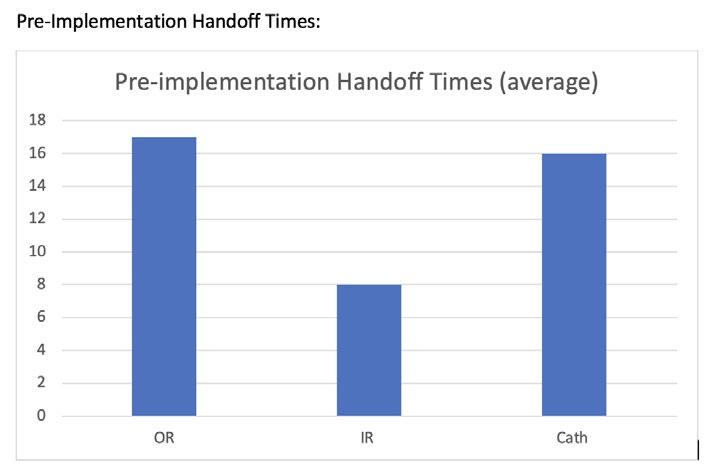

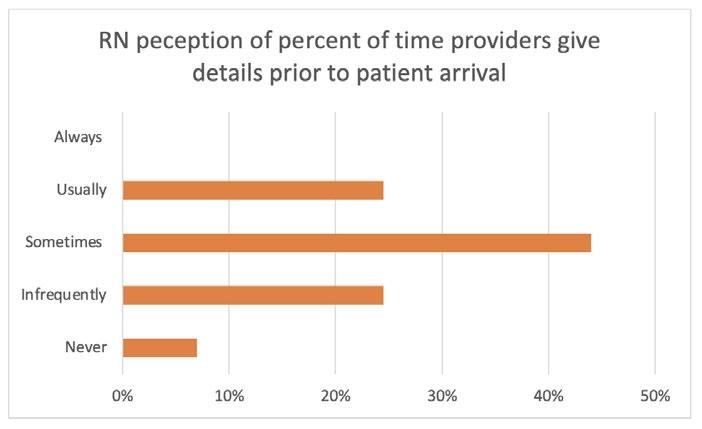
Implementation of an Electronic Medical Record Power BI Dashboard to Improve Care for Patients with Congenital Hypothyroidism
AUTHORS
Primary: Rob Gonsalves
Author(s)/Affiliations: Linda Black, BSN, RN; Vinay Vaidya, MD; Pierina Ortiz, MS; Chirag Kapadia, MD
BACKGROUND
The incidence of congenital hypothyroidism (CH) is about 1 in 2,000 newborns. Thyroid hormone is critical for brain development in the first few months and years of life; therefore, it is imperative that these patients are closely followed in clinic with frequent lab monitoring. US News and World Report (USNWR) also reviews parameters including patient visits per year and number of normal thyroid stimulating hormone (TSH) levels in this population, all of which directly affect our institution’s rankings.
As such, our division has been working on improving methods to track and better care for these patients. Prior methods involved manual review of IT-generated reports followed by multiple nurses entering orders and contacting patients. With this approach, 75% of our CH patients aged 3 months to 3 years had at least 2 normal TSH values in 2021. We attempted to optimize this process with the help of a Power BI Dashboard in 2022.
SPECIFIC AIM
To increase the percentage of CH patients aged 3 months to 3 years with 2 or more normal thyroid stimulating hormone (TSH) values from 75% in 2021 to 90% or higher in 2022.
Our secondary aim was to ensure all patients identified by the dashboard had a follow-up appointment scheduled.
DESCRIPTION OF INTERVENTION (IMPROVE AND CONTROL)
We developed a Power BI data gathering dashboard designed to pull data from our electronic medical record (EMR) system to identify CH patients with the age range specified above (Figure 1). Searchable data within the dashboard included number of clinic visits, date of last clinic visit, time until next clinic visit, and TSH lab values. It also displayed a one year total and year to date list of our primary outcome, allowing us to track progress in real time. A single endocrine nurse reviewed the dashboard weekly and directed efforts toward patients with less than 2 normal TSH values and/or less than 2 visits over the past year. Efforts included placing and communicating lab orders with patients, as well as communicating lab results, dose adjustments, and appointment needs with the primary endocrine provider. We continued to reach out to patients who did not respond to initial requests. A text-messaging feature built into our EMR that also included an electronic scheduling link aided with communication and scheduling.
OUTCOME MEASURE
Percent of CH patients with the age range specified above with 2 or more normal TSH values in 2022
PROCESS MEASURES
• Percentage of labs ordered on patients identified to have less than 2 normal TSH values identified via our dashboard.
• Percentage of follow-up appointments scheduled for patients with less than two visits in 2022.
METRICS
We chose percentage of patients with 2 or more normal TSH values for our outcome measure, as this directly relates to our primary aim. The process measures were chosen to ensure our system of identifying patients and ordering labs and follow ups was working appropriately.
RESULTS
At the completion of 2022, there were 91 patients with CH at the age range specified above with 2 or more clinic visits. 83 patients (91%) had at least 2 normal TSH values by the end of 2022. Of the 8 patients who did not, 5 had persistently elevated TSH requiring dose adjustments and 3 neglected to get labs done. Labs were ordered for all patients with less than 2 normal results. Follow-up was arranged for all 11 patients who had only been seen once in 2022.
IMPACT
Implementation of a Power BI dashboard within our EMR greatly improved our ability to track patient outcomes and lead to a significant increase in the percentage of patients with 2 or more normal TSH values from 75% in 2021 to 91% in 2022. Having a single nurse act as a liaison between patients and their primary endocrinologist helped overcome the logistical challenges of a condition that requires frequent lab draws and follow up. This did not only improve patient care, but also aligns with our institutional goals of improving USNWR scores in this category. We achieved both our aims for 2022, and for 2023 we hope to increase to over 95% of patients with 2 normal TSH values.
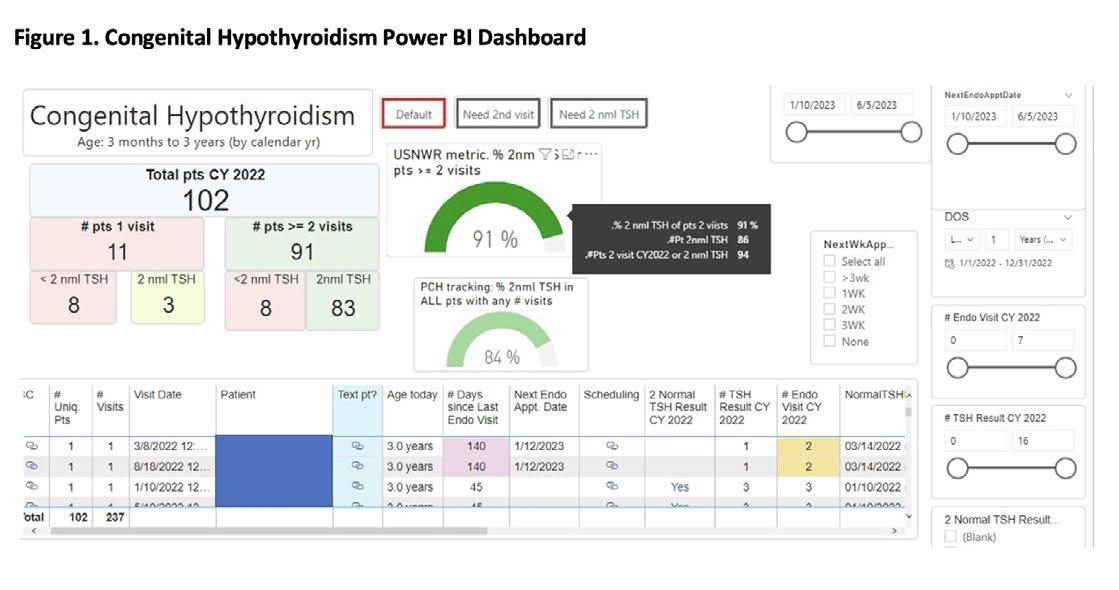
2023 Judges
Julie Augenstein, MD
Vasudha Bhavaraju, MD
Rick Engel, MD
Deon Hobbs, RN
Kelly Kelleher, MD
Joanna Kramer, DO
JUDGES
Regi Ramanathan, MD
Erin Robinson, DNP, RN
Kristi Samaddar, MD FAAP