MASTER IN ADVANCED COMPUTATION FOR ARCHITECTURE AND DESIGN


2021
Thesis Studio MAT-MAP
Urban Material Data Visualization
MASTER IN ADVANCED COMPUTATION FOR ARCHITECTURE AND DESIGN
MAT-MAP
Urban Material Data Visualization

Check your city’s material capacity
THESIS PROJECT TITLE: MAT-MAP (Urban Material Data Visualization)
FACULTY: Gabriellea Rossi
STUDENT : Kyunghwan KIM
DURATION : 2021.07 - 2021.09
DATA + MAP...
INTRO
This project was done for the Master thesis of MADAD (Master in Advanced Computation for Architecture and Design) program of the Institute for Advanced architecture of Catalonia. The period of the thesis project was about 9 weeks which is quite short to deepen a thesis’s subject. Nevertheless, my interest in the seriousness of construction (or demolition) waste and circular economy brought me to pose a question of the necessity of visualizing data on a map for various stakeholders to achieve circular economy altogether.
ABSTRACT
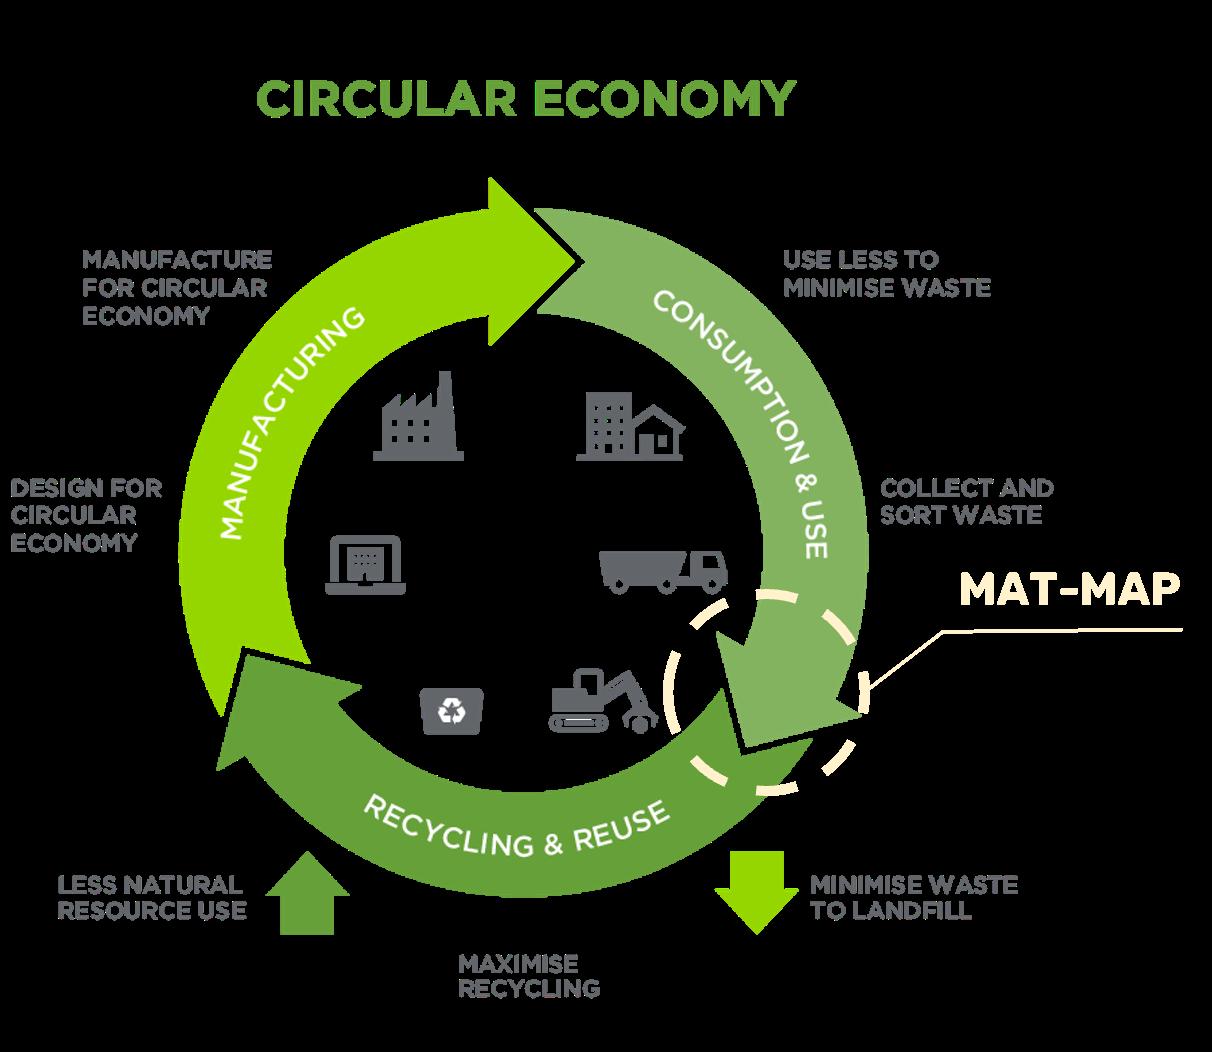
Construction waste is increasing every year. New buildings are often constructed with new materials and demolished building materials have been wasted without separating them by their categories. However, not only that we see that the recycling market and material research field are growing, but also some metropolitan governments make mandatory regulations for better separating and recycling the maximum amount of materials. In this project, instead of thinking about what and how to recycle the materials, the project is focused on how we could use and create data for people to be aware of the materiality of each city and the capacity of the resources.
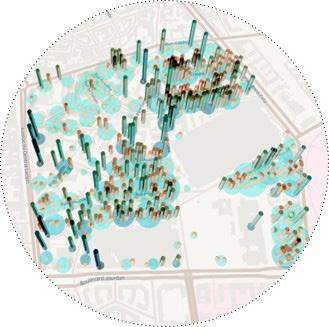
At this thesis project, called ‘MAT-MAP’, there are two versions of maps with 2 different datas. The first version of MAT-MAP visualizes open source data from Paris’s open source data. In this map, 3 different building data are combined into one map by showing each building information of Paris and its roof material. In the second version of the map, we could get information of different facade materials of two test site areas (borough of 13th and 14th) in Paris with various visual effects options.
Through this Web App, ‘MAT-MAP’, users could have a visual experience to see the existing building’s material in Paris by comparing other areas or buildings. In the future, we hope that this map informs clearly on the urban resources with precise quantities. But also, this could be a stepping stone to help users to give more ideas for their project and create the circular economy.
ABSTRACT I. CONTEXT 01. CONTEXT 02. CASE STUDY OF UPCYCLING 03. PROBLEM ANNOUNCEMENT 04. STAKEHOLDERS 05. HYPOTHESIS 06. OBJECTIVES 07. WHAT IS THE ‘MAT-MAP’? 08. METHODOLOGY II. WEB APP DEVELOPMENT : Mat-Map V.1 01. WORKFLOW 02. CASE STUDY SITE 03. DATASET 04. APP OPERATION III. DATASET GENERATION 01. OBJECT DETETION 02. WORKFLOW 03. 1st TEST IMAGES GROUP 1) DATASET 1) DATA TRAINING RESULTS 2) TEST IMAGES RESULTS 04. 2nd TEST IMAGES GROUP 1) CASE STUDY SITE
DATASET
TARGET ELEMENTS / FEATURES
DATA TRAINING RESULTS
TEST IMAGES RESULTS
EVALUATION
DATA VISUALIZATION : M-Map V.2 01. WORKFLOW 02.CASE STUDY SITE 03. DATASET 04.TARGET ELEMENTS / FEATURES 05. SCORE RULE 06. DATA ANALYSIS & REPRESENTATION 07. WEB DEPLOYMENT & OPERATION 08. EVALUATION
CONCLUSION
INDEX 0.
2)
2)
3)
4)
5)
IV.
V.
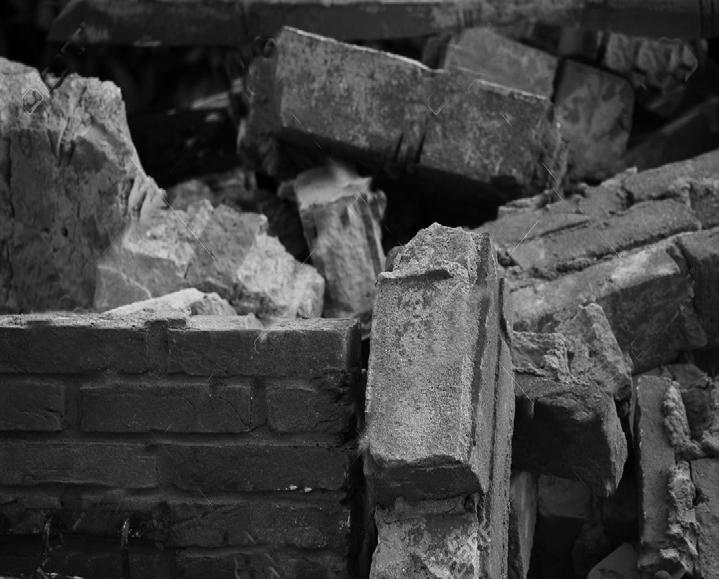
Source : https:/ /www.dreamstime.com/
Source : https://climate.nasa.gov/effects/
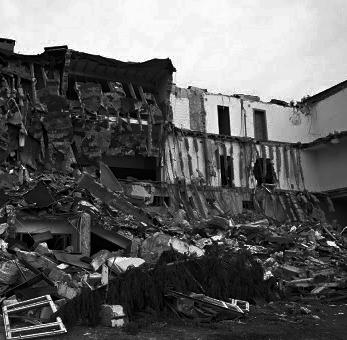
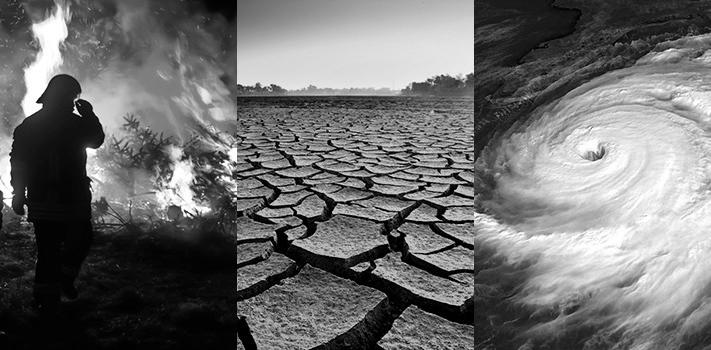
CONTEXT : Situation
Today, climate change that is caused by emitted greenhouse gases from human activities impact all over the world. Building construction and demolition are taking a part of CO2 emission and pollution. Consummation of new raw material increase every year, wasting demolished building material is also increasing at the same time.
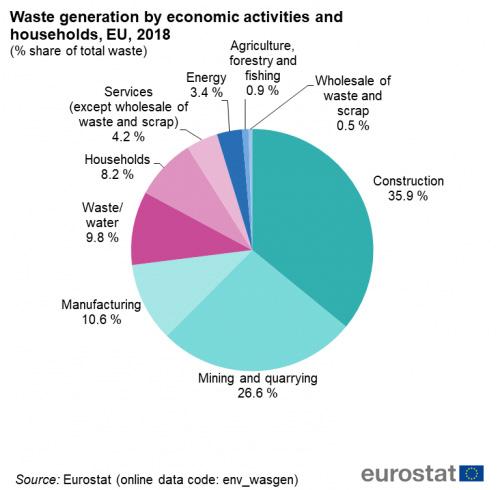
In 2018, 35.9% waste generated from construction sector in EU countries (fig1). In france, building industry produces 46 million tonnes of waste compared to 30 million tonnes from households.
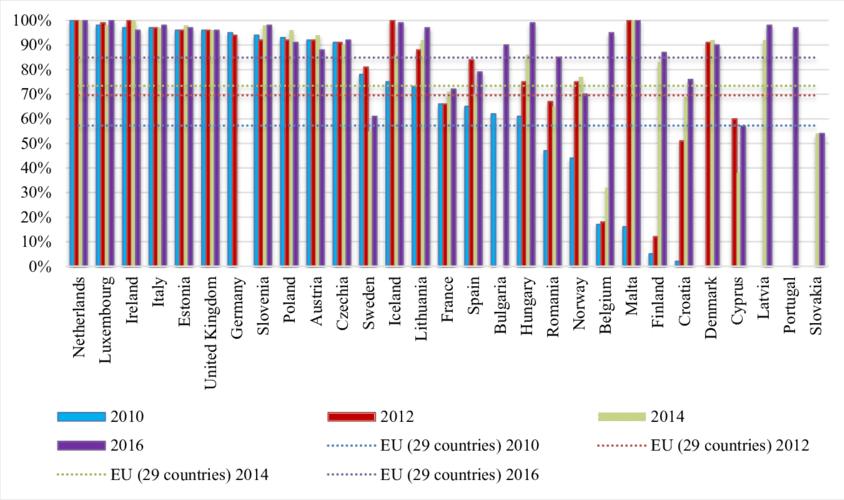
In this graph, we can see that overall countries’s construction waste are increasing since 2010. (fig.2)
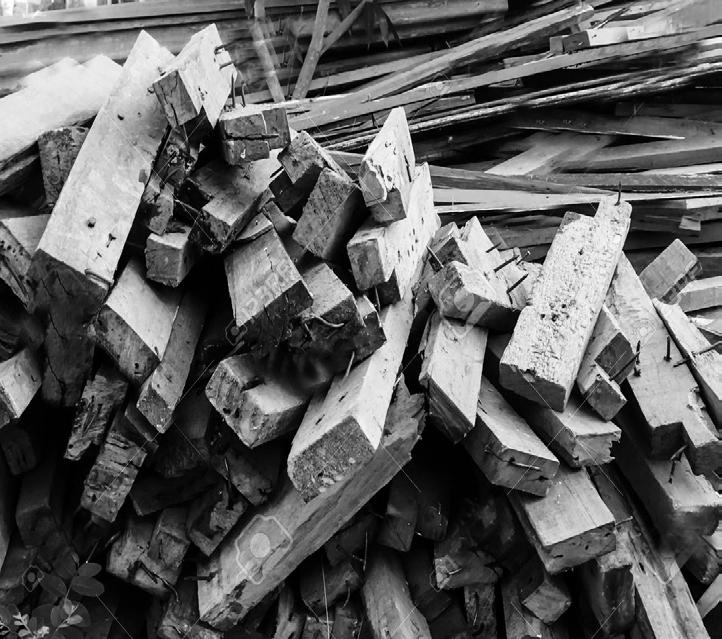
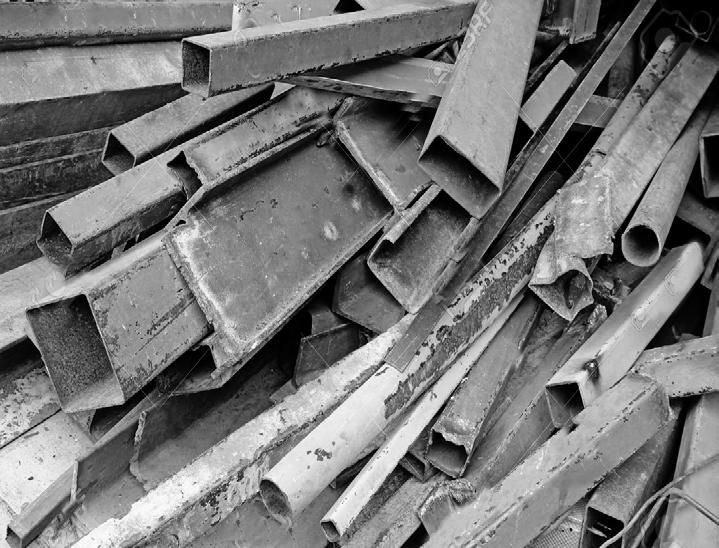
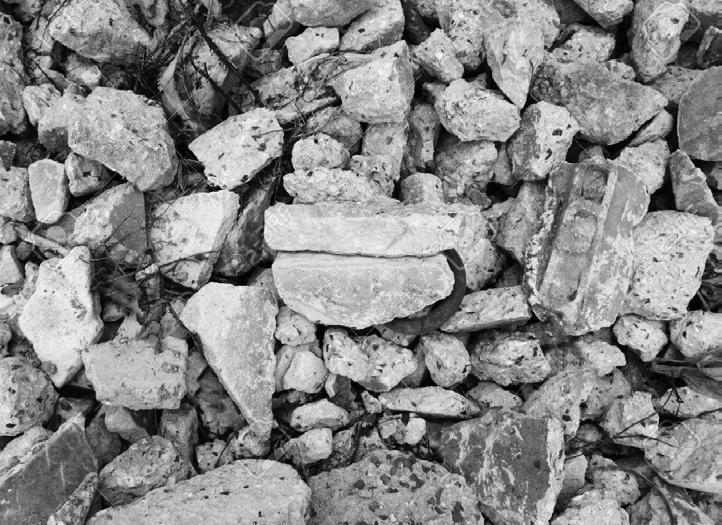
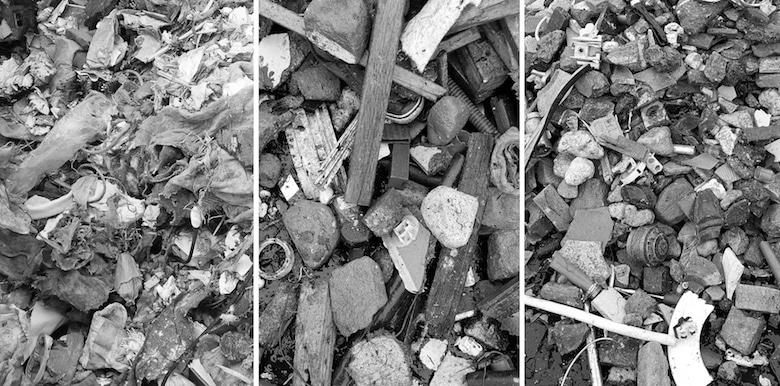
While the most profitable materials are recycled, large quantities of wood, plaster, carpet and glass cannot easily be reused. Polluting waste such as asbestos , glue and paint are almost impossible to recycle. (fig.3)
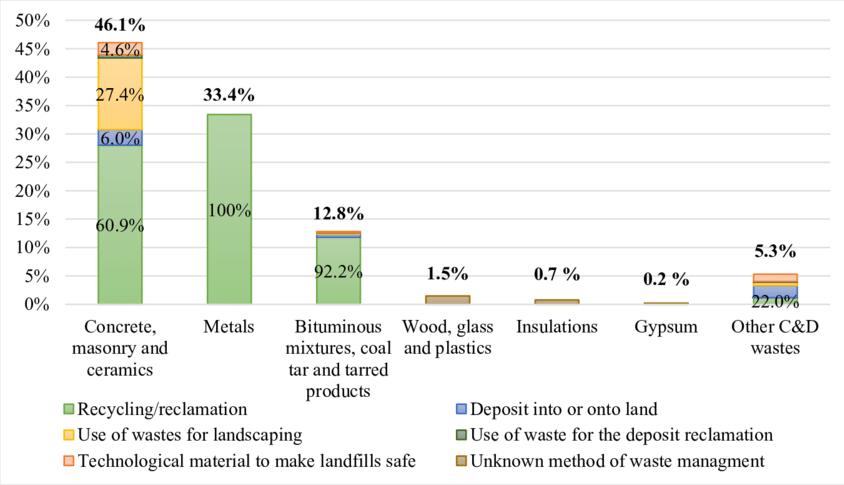
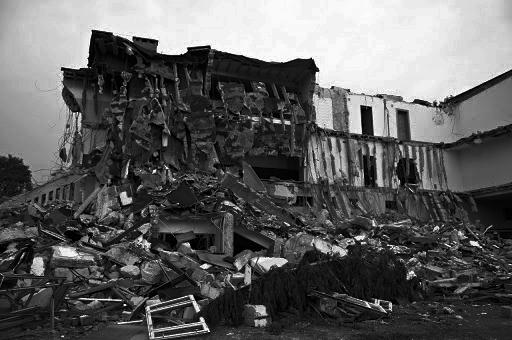 fig.1) Waste generation by economic activities and households, EU, 20181
fig.2) Recovery rate of construction and demolition mineral waste in the EU2
fig.3) The weight percentage of material categories in construction and demolition waste and their further use3
fig.1) Waste generation by economic activities and households, EU, 20181
fig.2) Recovery rate of construction and demolition mineral waste in the EU2
fig.3) The weight percentage of material categories in construction and demolition waste and their further use3
Mandatory recycling of construction waste + Mandatory dismantling at the time of demolition
More than 500m2, construction waste must be divided into 14 types to be disassembled and discharged. Based on 500m2, 91% of public buildings in Seoul are subject to classification and dismantling.
Also these are mandatory for the projects ordered by public institutions, and they should use recycled aggregate in order to fundamentally reduce the generation of construction waste, which is on the rise, and maximize recycling.
The continuous increase in the amount of construction waste generated in Seoul.
: (2010) 25,472 ton / day
→ (2014) 25,525 ton / day → (2019) 35,493 ton / day
Against the construction waste issue, there are some governments who make mandatory regulation for new construction and demolition.
For instance, the Seoul metropolitan government announced that more than 500m2 of construction waste must be divided into 14 types to be disassembled and discharged. Also building orders by public institutions should use recycled aggregates in order to reduce construction waste.
CONTEXT : Mandatory regulation
<Construction & demolition waste recycling market by region4>
<Construction & demolition waste recycling market by source5>
Europe holds a dominant position in 2019 & Asia-Pacific is expected to grow at a highest rate during the forecast period. (fig.4)
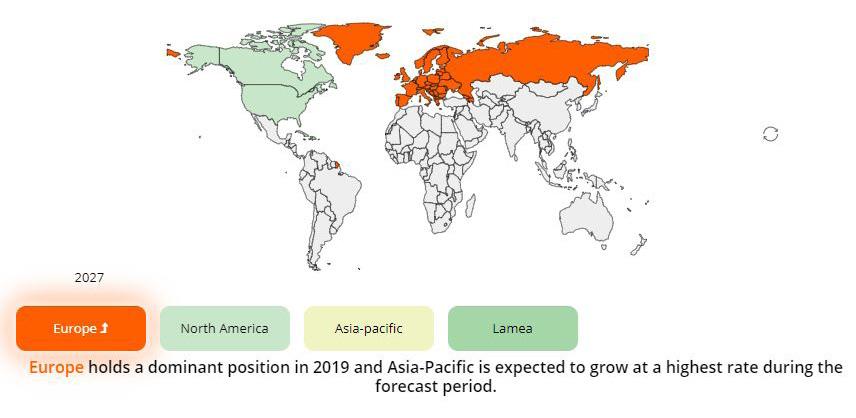
The size of the global demolition and construction waste recycling market is valued at about 126,897.2 million dollars in 2019. By 2027, it is expected to reach 149,190.9 million dollars.
CAGR (Compound Annual Growth Rate) of 2.7% from 2020 to 2027. (fig.5)
(www.alliedmarketresearch.com)
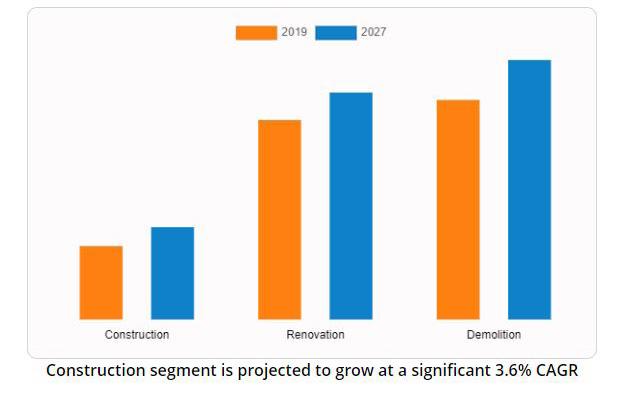
CONTEXT : Market growing
Source : https://kr.123rf.com
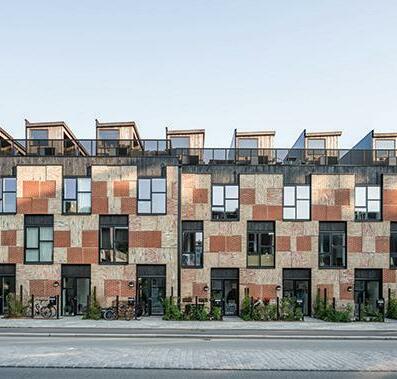
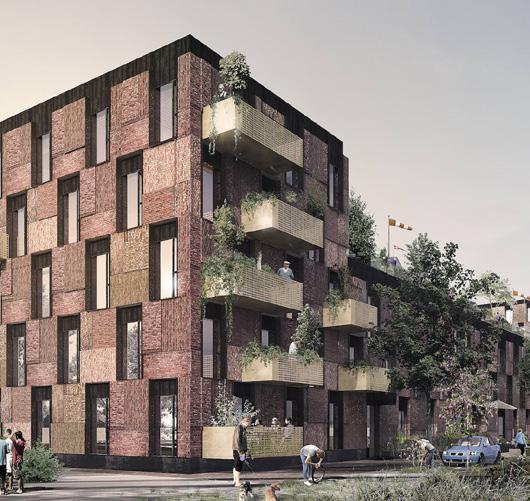
“By reusing waste wood and the walls from abandoned buildings as new facade elements, we save CO2 and virgin materials, while also getting a new building with history and character.”
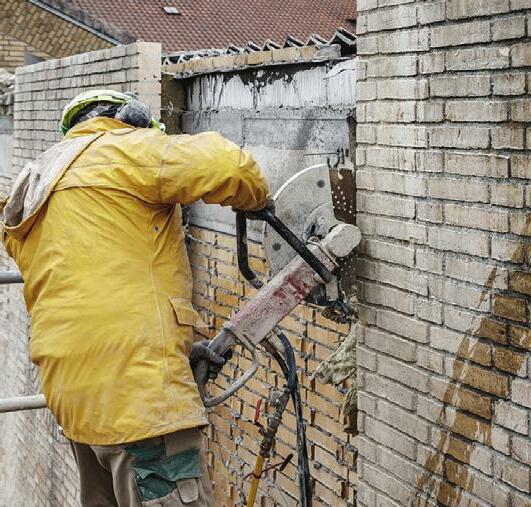
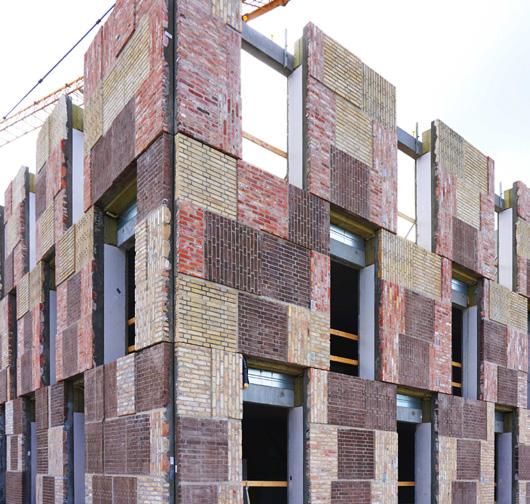
THE RESOURCE ROWS PROJECT
_Lendager Arkitekter
Source : https://lendager.com/
CASE STUDY : Material upcycling
Source https://lendager.com/
Source https://lendager.com/en/architecture/resource-rows
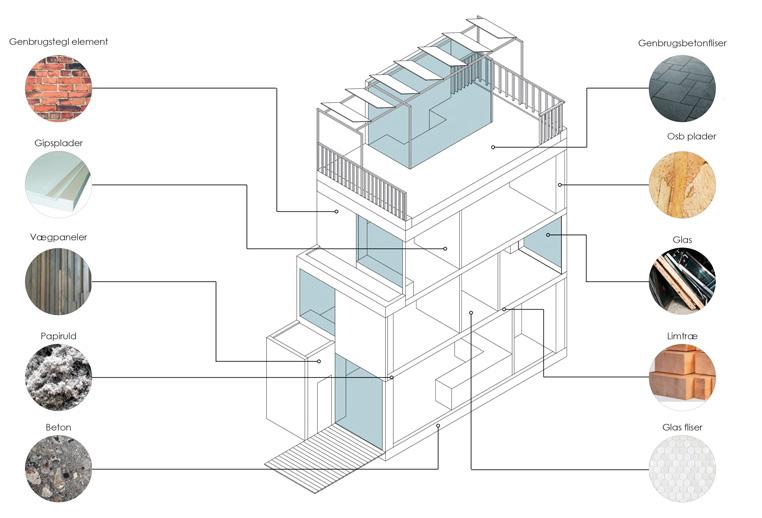
Lendager architecture office reuse waste wood and the walls from abandoned buildings as new facade elements. Through this upcycling process, they are eager to save CO2 and consumption of raw materials.
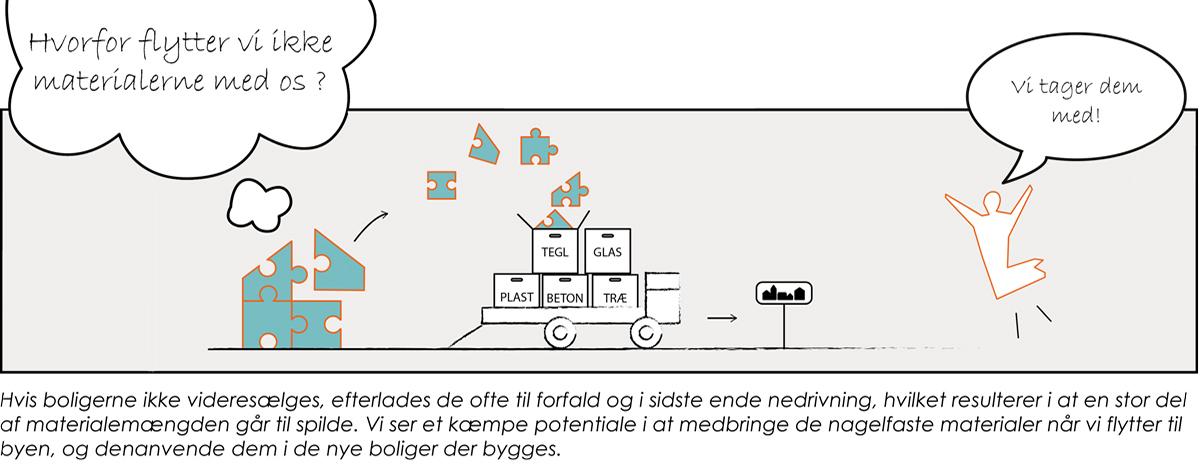
Existing buildings = Future resource + Key for urban sustainability
So, there is an intervention by the government to control waste separation by categories and a growing market for recycling construction waste. But where is data or resources of the waste and existing building materials ?
The idea of making an open source map is started from a term of ‘urban mining’. Existing buildings are the future resource for the circular economy and it is a key for urban sustainability. Not only is this recycling market growing, but also, many recycling material researches are ongoing. Nevertheless, we have narrow and limited quantity data for the future stakeholders.
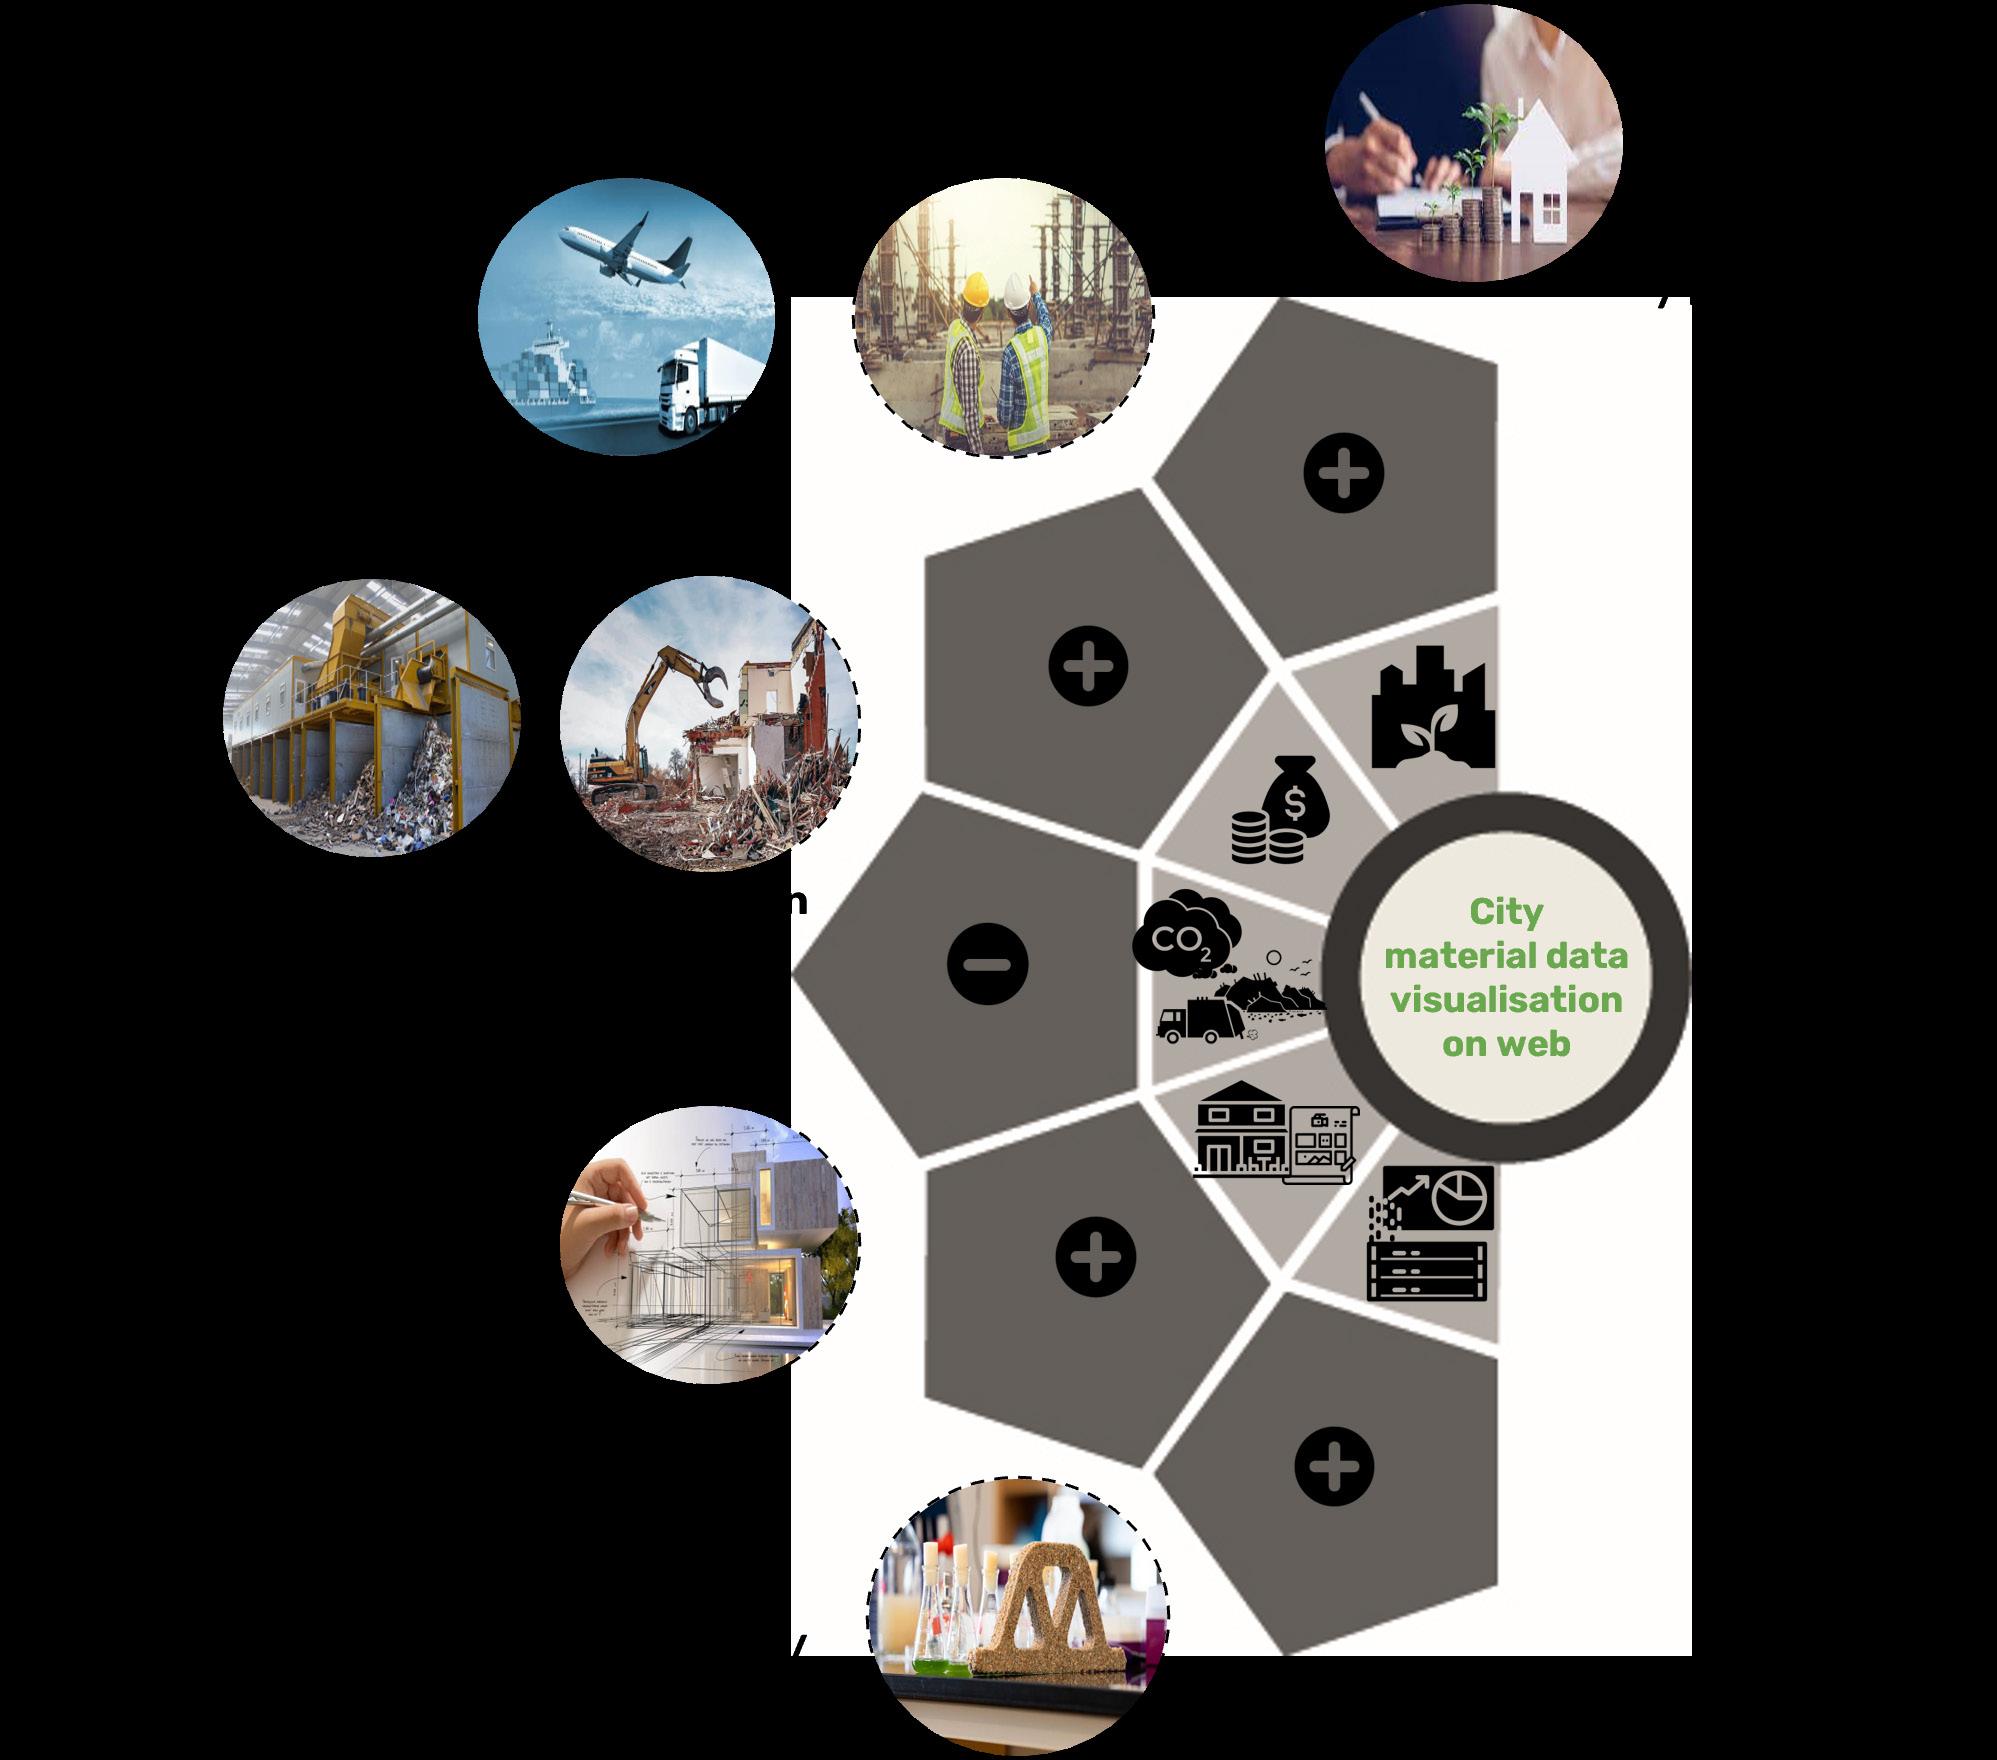
Who benefits from our map-app? The stakeholders are in various sectors. People from the sector of management, logistics, construction industry, demolition, recycling and architecte could reduce construction cost with a strong social responsibility by participating in a movement of reducing CO2. But also, many young researchers are interested in a new material by recycling existing matter. As we all have a social responsibility to slow down climate change, the public also could get information and experience of their urban materiality with understable graphics in our app.
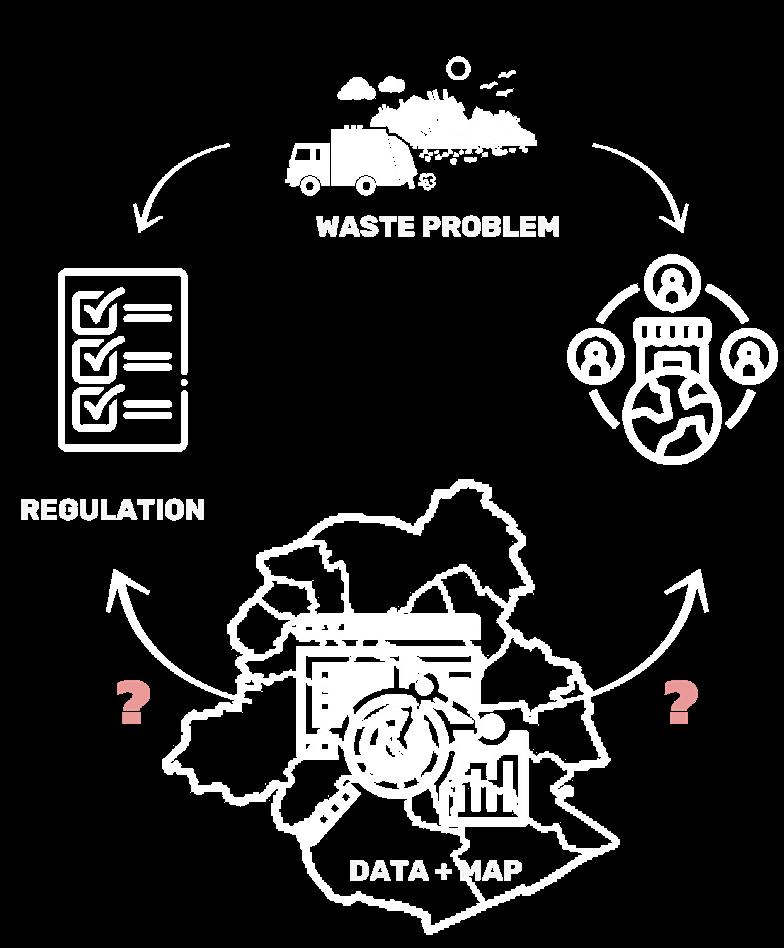
PROBLEM STATEMENT STAKEHOLDERS
‘URBAN MINING’ : the process of reclaiming raw materials from spent products and waste.
<Stakeholders from Mat-Map6>
Open source maps for the future stakeholders will give more accessibility for their ideas or business models for their projects.
How could we identify different materials from existing buildings?
What kind of open source/data could we use to analyse existing buildings instead of taking pictures ourselves?
What kind of tools could we use to extract features from building images and visualize those data more clearly?

How can we generate a dataset quickly? Can we use Google Street Map images as input images to extract features?
Produce existing building materials data of Paris + Data visualization on the web
Objective is city materiality data visualization. In other words, produce existing building materials data of Paris then, visualize those data on the web for future stakeholders who are eager to make a circular economy. This open source map would facilitate the understanding of material capacity of the city before starting recycling waste.
I call this as MAT-MAP project. It is an Open source map application to inform the materiality of existing buildings.
Through this Web App, ‘MAT-MAP, user could have a visual experience to see the existing building’s material in Paris by comparing other area or building. In the future, we hope that this map informs clearly on the urban resources with precise quantities. But also, this could be a stepping stone to help users to give more ideas for their project and create the circular economy.
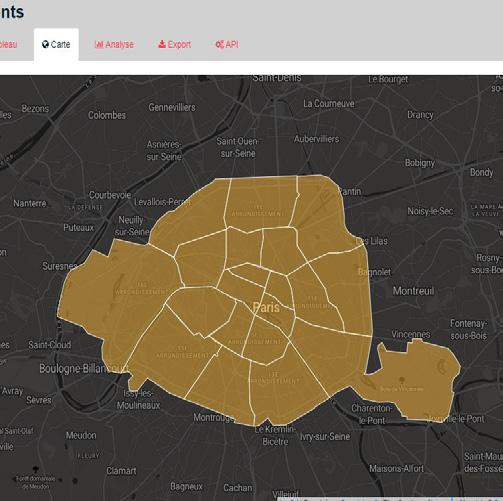
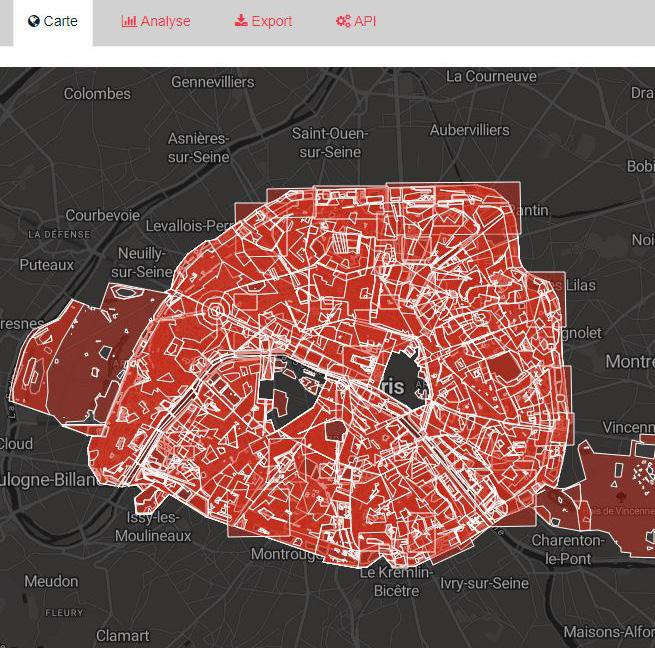
At this thesis project, there are two versions of maps with 2 different datas. The first version of MAT-MAP visualizes open source data from Paris’s open source data. In this map, 3 different pieces of building information are combined into one map by showing each building’s information of Paris and its roof material.
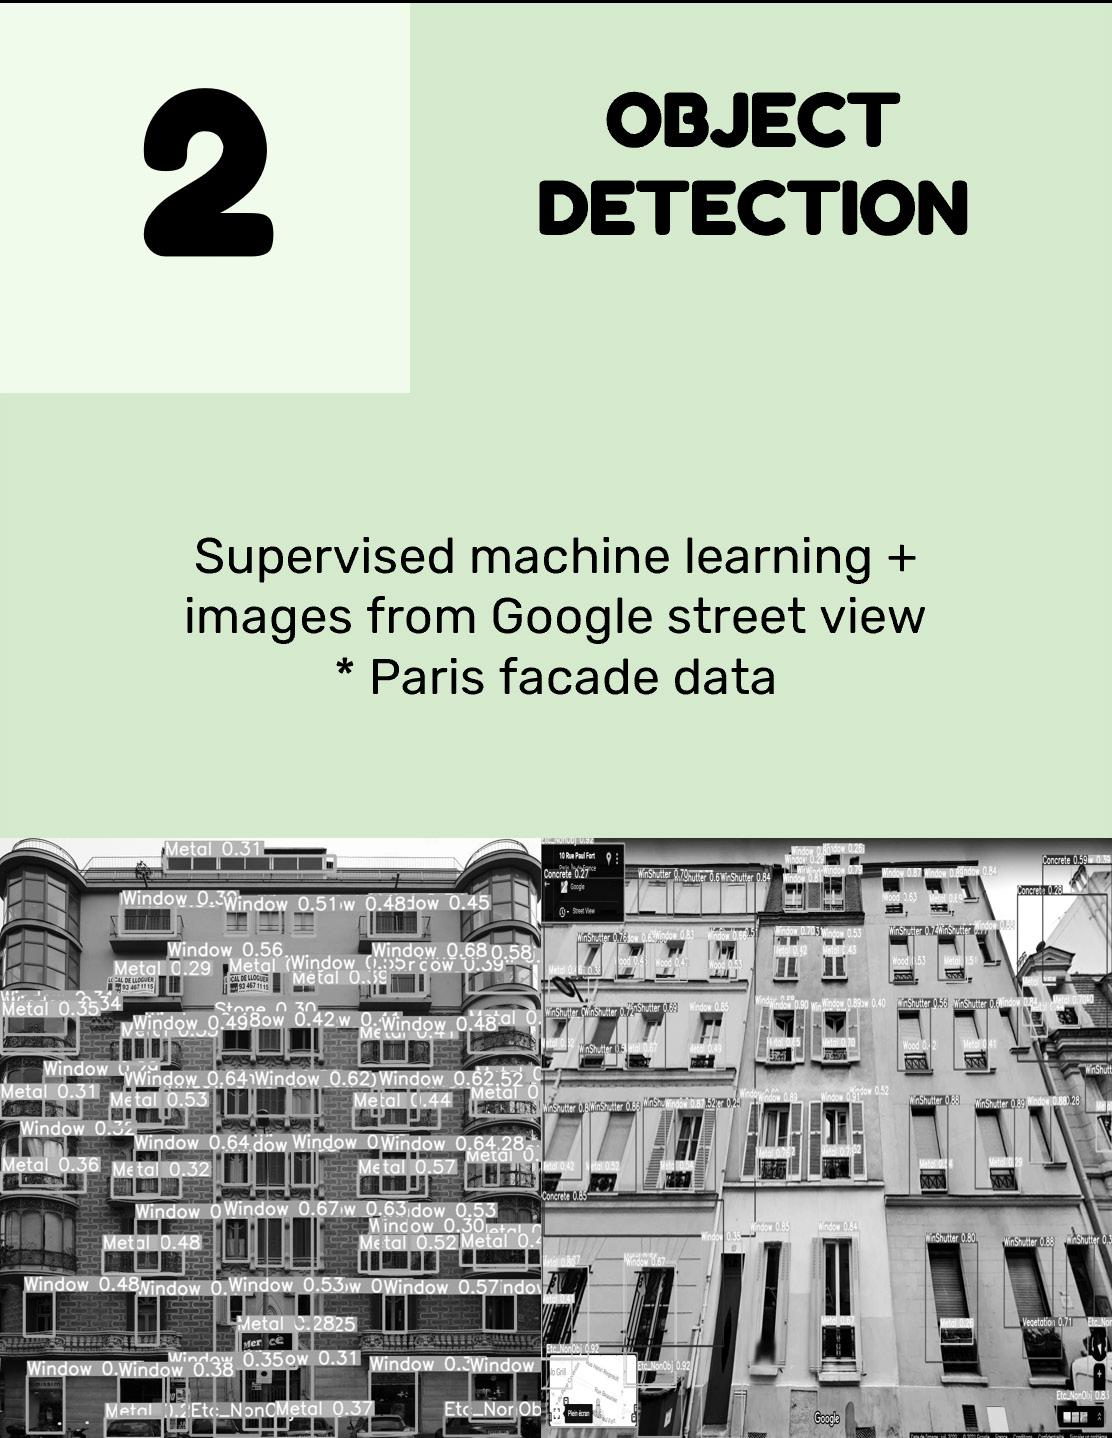
In the second version of the map, we could get information of different facade materials of two test site areas (borough 13 and 14) in Paris. In order to detect existing facade material, the object detection method uses a supervised machine learning algorithm. Then the detected data was modified to visualize on a web map that has various visual effects options on the platform of ‘Kepler’.
HYPOTHESIS METHDOLOGY OBJECTIVES
Source : https://recyclinginside.com/
Flow of resources in the Future Recycling waste and resource recovery system (resource https://www.futurerecycling.com.au/)
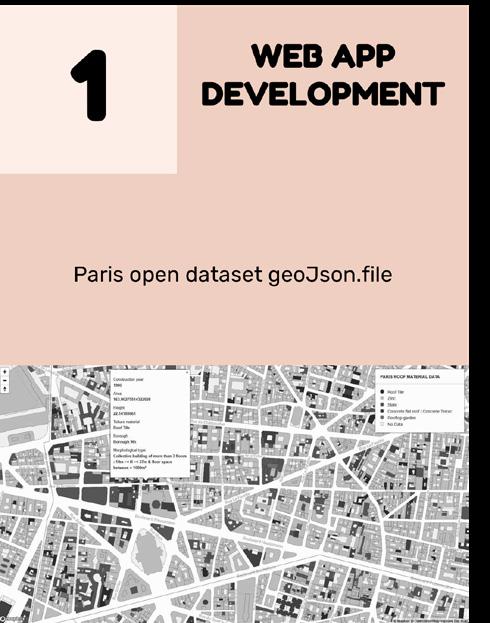
The first version of Mat-Map is made by using existing data of geoJson.files from the website of Opendata.paris.fr. Those 3 different data files are opened in ‘QGIS ‘which is a geographic information system software to visualize it. At the QGIS software, we edit the data in order to simplify it and reduce its size. Since the data visualization on the ‘Mapbox’ platform is limited to publish on the web, we used ‘Heroku’ which is a platform for building and operating applications entirely in the cloud. For the operation on the cloud, data was rebuilt for its visualization through the ‘Visual Studio Code’ tool, then all of the code was published in GitHub that is linked with Heroku.


WORKFLOW
https://commons.wikimedia.org/
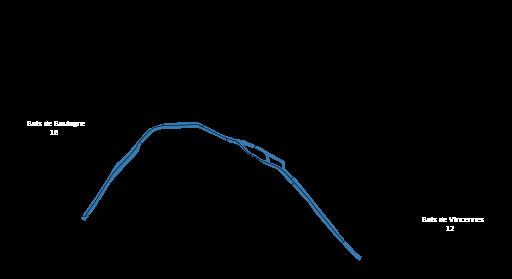
Entire boroughs of Paris
The data of Opendata.Paris has almost all of the building’s information of Paris for instance, construction year, roof material, surface and boundary of land etc. so that this first version of map could represent the whole city of Paris.
CASE STUDY STIE
Borough. Geojson


Building volume (+ Roof Material). Geojson
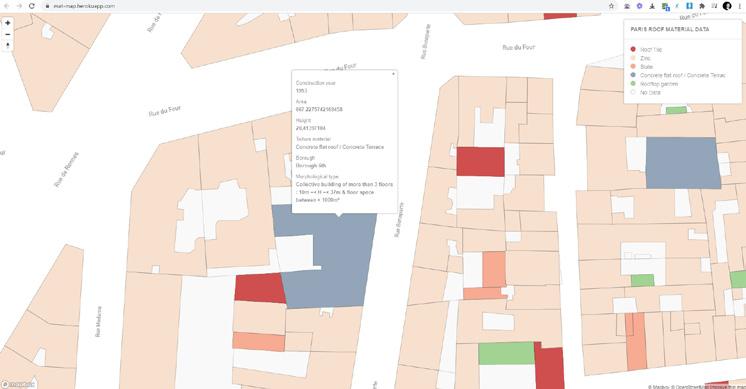
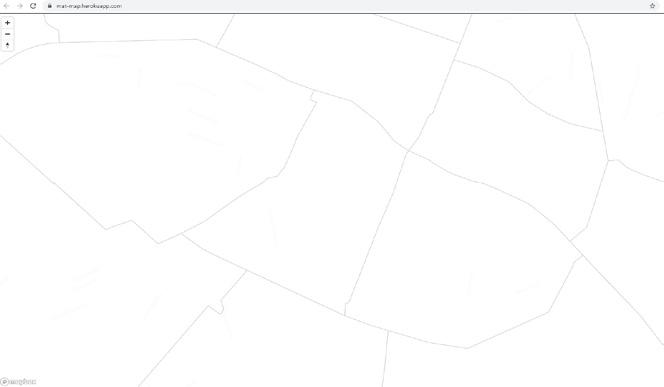
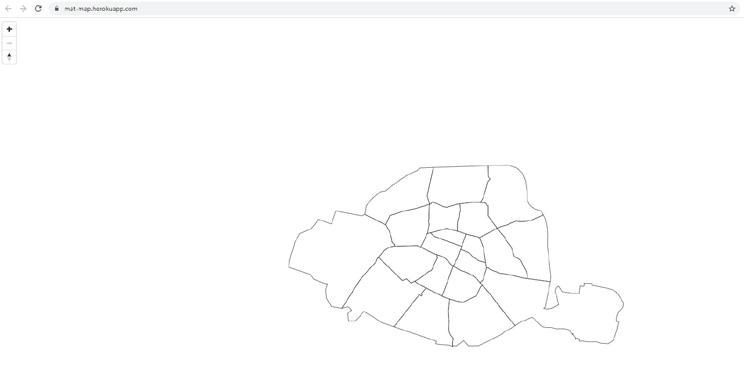
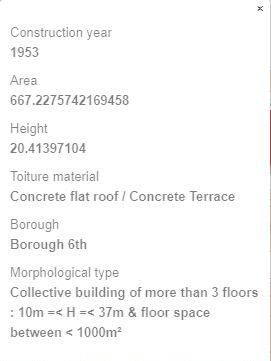
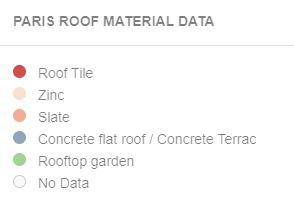
This is the first version of ‘Mat-Map’ which use existing data from ‘Opendata.Paris.fr‘. 3 differents GeoJson files are used to visualize roof materials of Paris by giving information of each building information such as volume, surface, construction year etc.
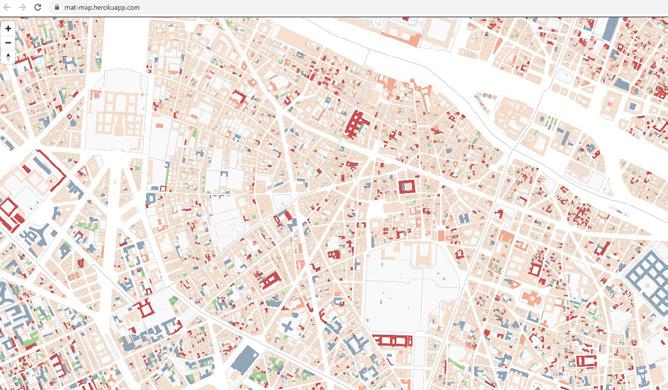
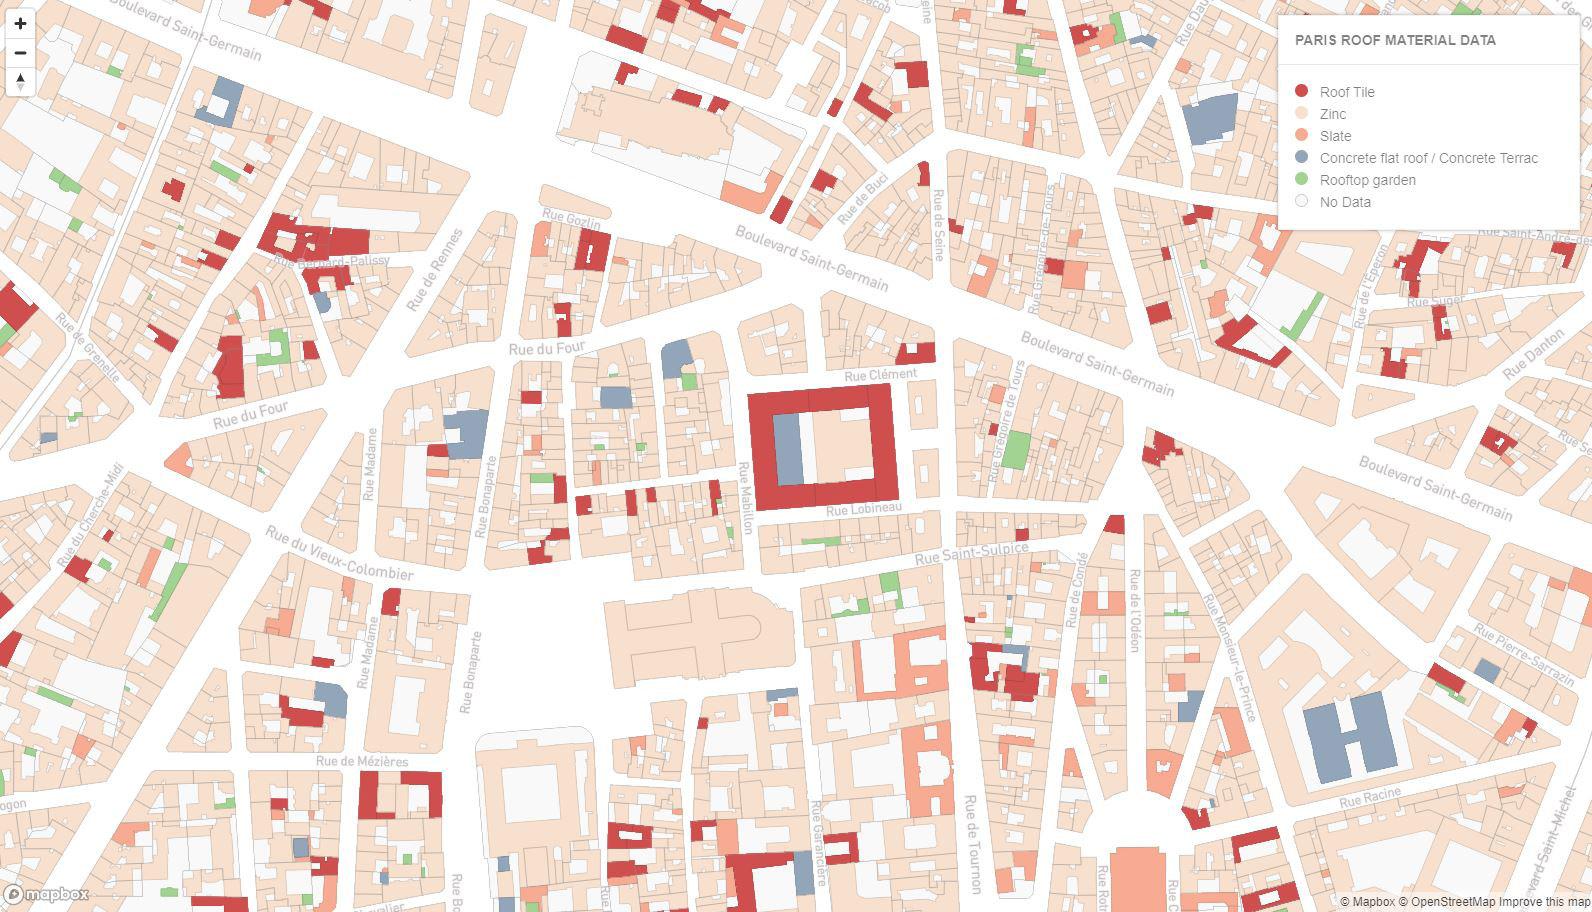
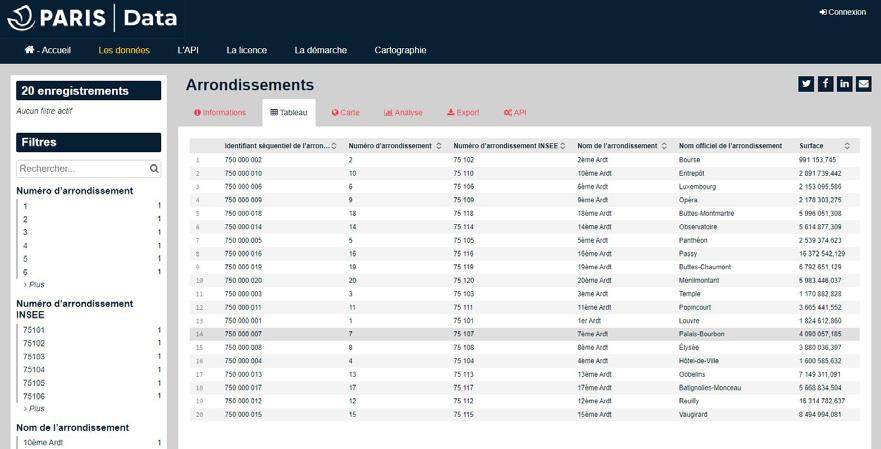
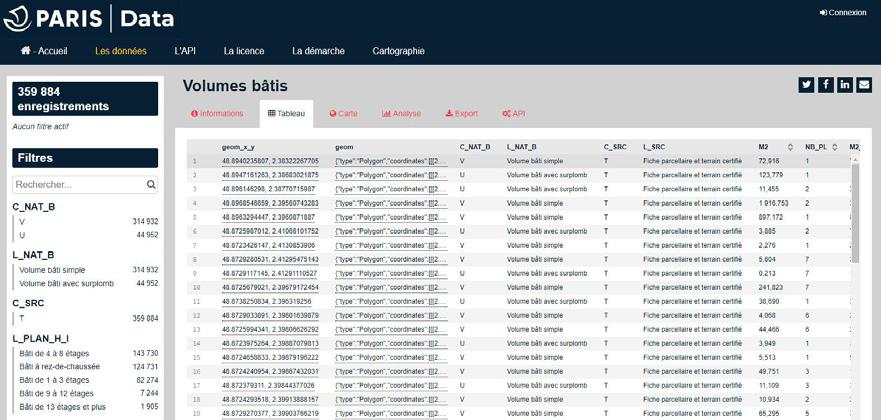
Opendata.paris.fr. is the website where we can find many of dataset regarding the city of Paris. For the Mat-Map web app(first version), we used, first of all, borough.Geojson file for the boundary of each borough line and second of all, we used a cadastral map for each building’s boundary. In the end, we added building data. All these files are big and contain unuseful data so we clean these dataset in QGIS then re-export as a format of geoJson.file.
Website to explore the Mat-Map : https://matmap185132459.wordpress.com/
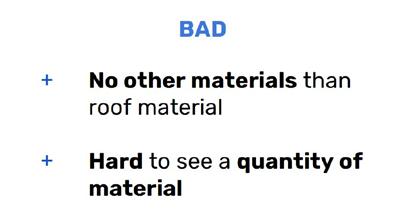
Evaluation :
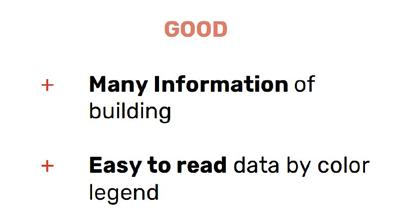
Although the quality of the dataset is a high level and we can easily develop it on the web. However, there is no other material than roof material and it is hard to capture the quantity of material to compare with other buildings.
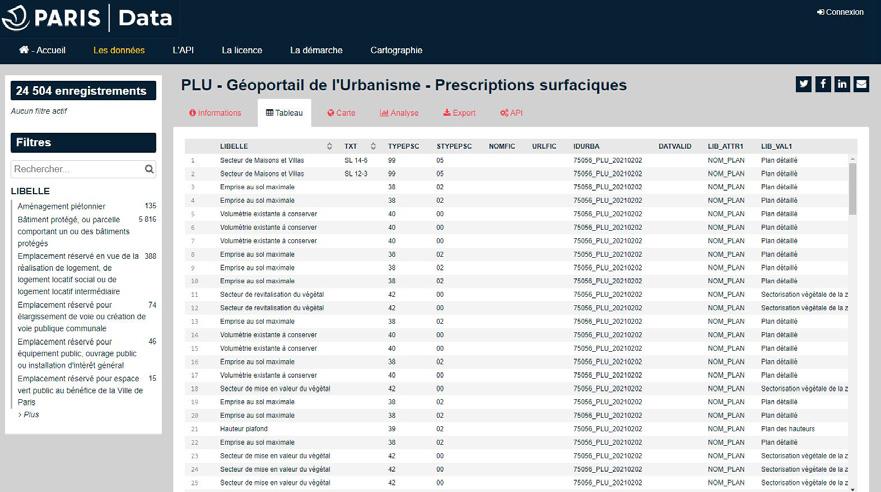
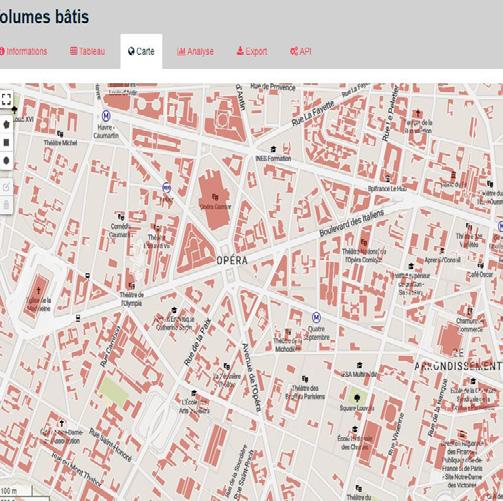
(From www.opendata.paris.fr)
MAT-MAP V.1 OPERATION DATASET
Cadastral plot. Geojson
zoom zoom zoom
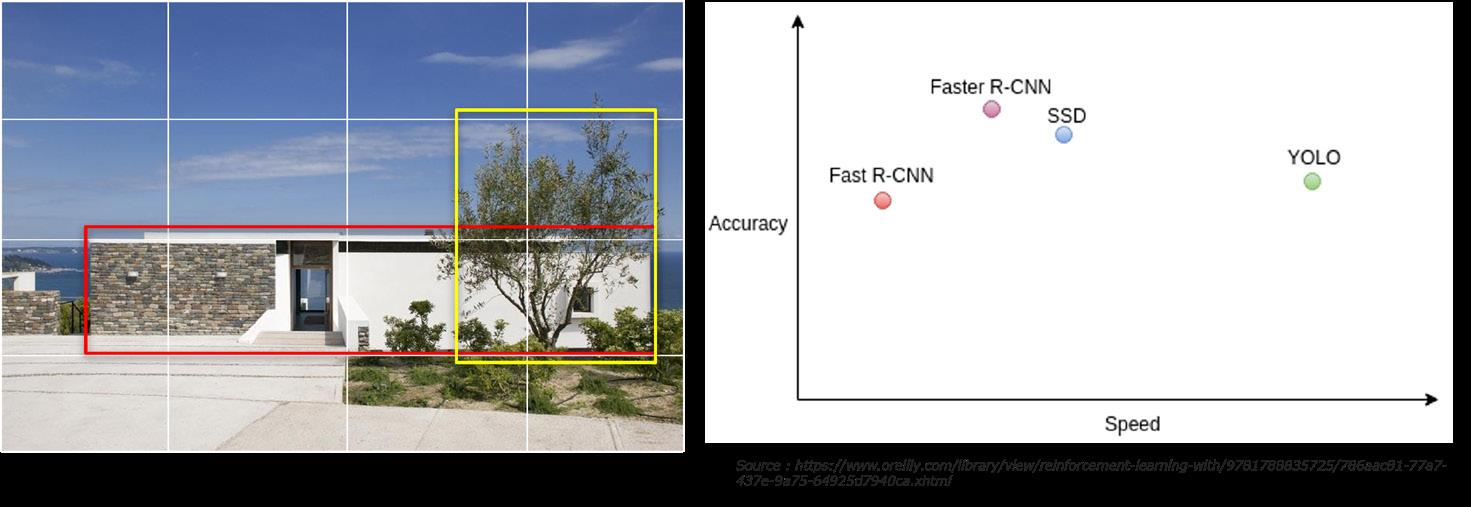
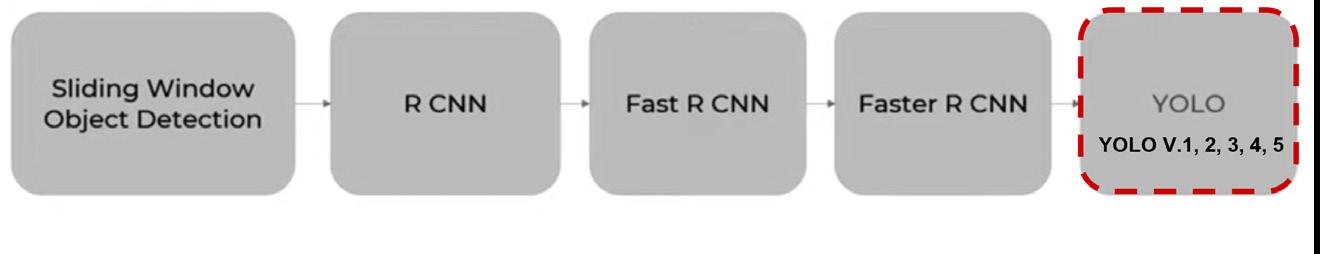
Image classification decides if the image is of a house or not with a simple neural network saying house is equal 1. In contrast, object Detection is, first of all, for multiple objects in one image. In object detection, it gives us the information of an object but also tells us the bounding box or the position of an object within the image. There are several types of detector; Sliding window object detection, RCNN, Fast RCNN, Faster RCNN and YOLO from V.1 to V.5. R-CNN uses 2-stage detectors because they propose regions first and then perform classification and regression. So non-Yolo models send over thousands of divided images into their model so that it takes more time. Yolo uses ‘one-stage’ detectors; they perform predictions(classification & regression) directly from feature maps. Their method is to divide images in grids and each grid will predict a fixed amount of bounding boxes with confidence scores and class scores.This is why we call this Yolo , which means “You only look once”. In the result, Yolo is the fastest detector with high accuracy.
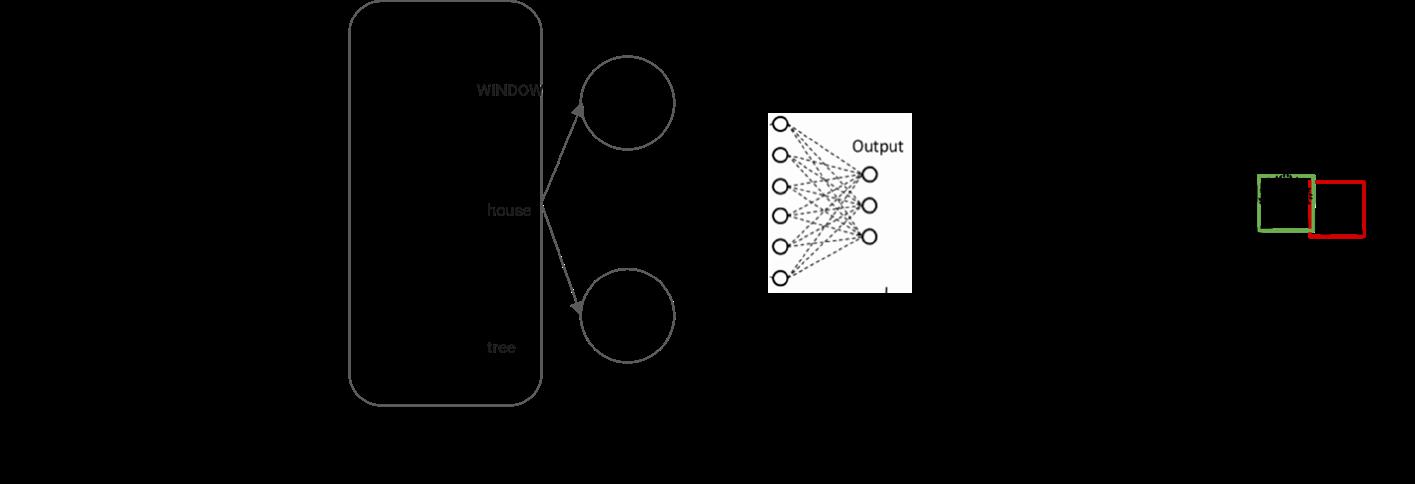
Conventional methods required manual labeling of images to generate the training dataset and validation dataset, so manual labeling for training and validation images was required. Then, Yolo learns itself based on the given training dataset. The more accurate the labeling, the more good results we will get.
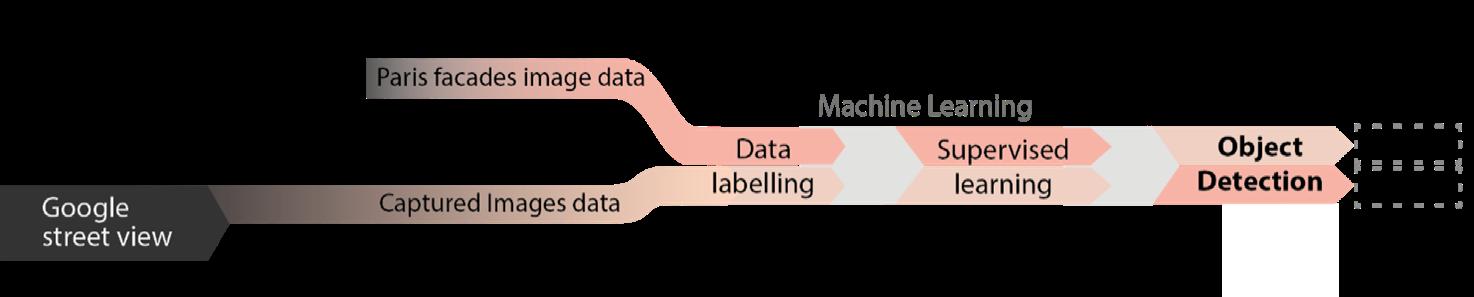
YOLO V.5 WORKFLOW OBJECT DETECTION & YOLO V.5
YOLO... ?
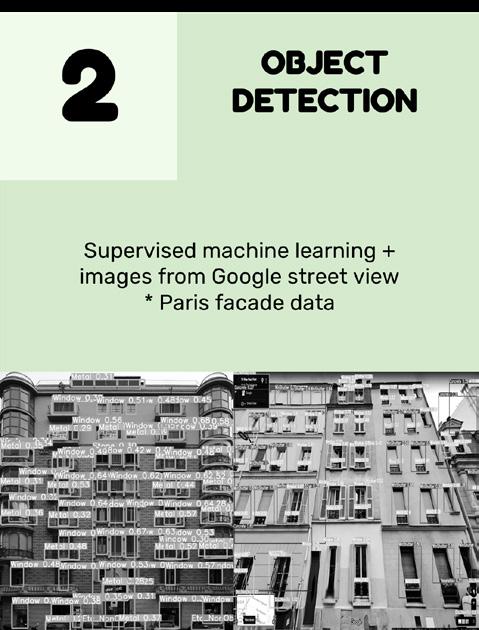
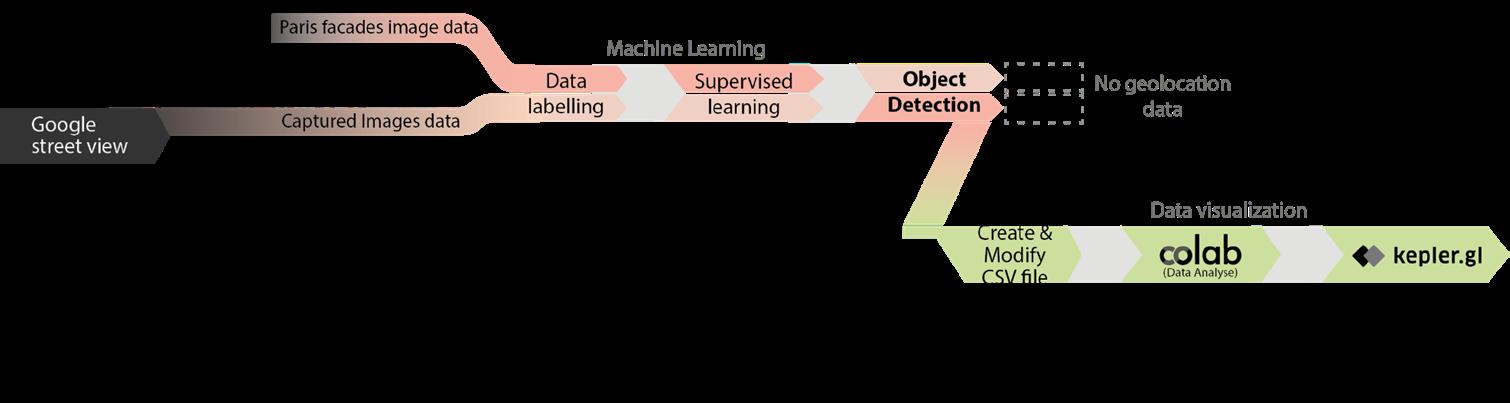
After the first version of MAT-MAP, we decided to generate our own dataset of facade materials data from existing buildings. At this step, we did two tests to see how facade images are detected by Yolo V.5. Instead of taking pictures of every building in Paris, we decided to use the existing Paris facade image dataset for test1, then we captured facade photos from Google Street Map for test2 in order to save time.
WORKFLOW
*Paris facade data (source : http://vision.mas.ecp.fr/Personnel/teboul/data.php)
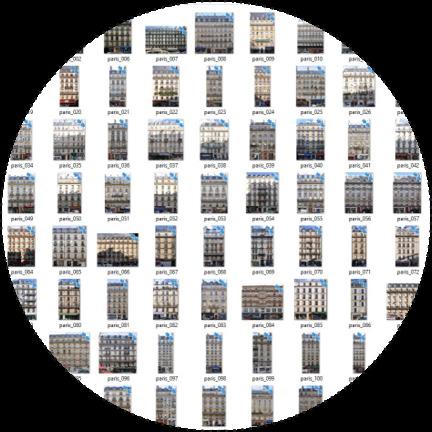
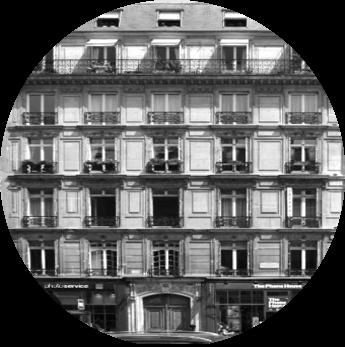
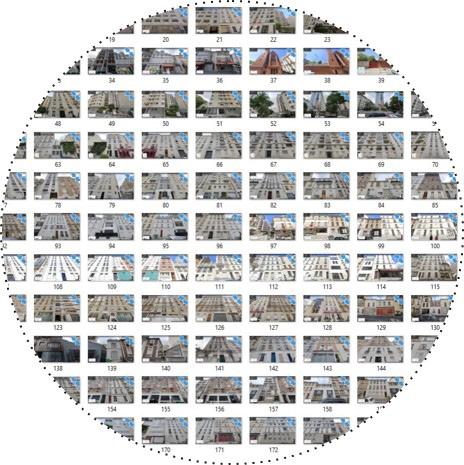
For the test 1, ‘Ecole Centrale Paris Facades Database’ data created by Olivier Teboul in 2008 was used. Only facade images were used for labeling elements and materials and testing it to detect corresponded features. In total, 212 facade images data were labeled and trained for testing new images.
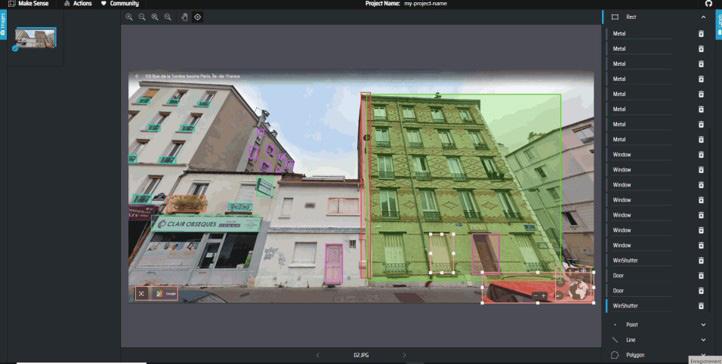
Thanks to the data labeling website, MAKE SENSE (https://www.makesense.ai/), the manual labeling work which was for making a training and validation dataset became easier. On this website, we make labels as much as we want to, then we set a range of an element by selecting a corresponding label.
TEST1 DATASET TEST1 TRAINING RESULT
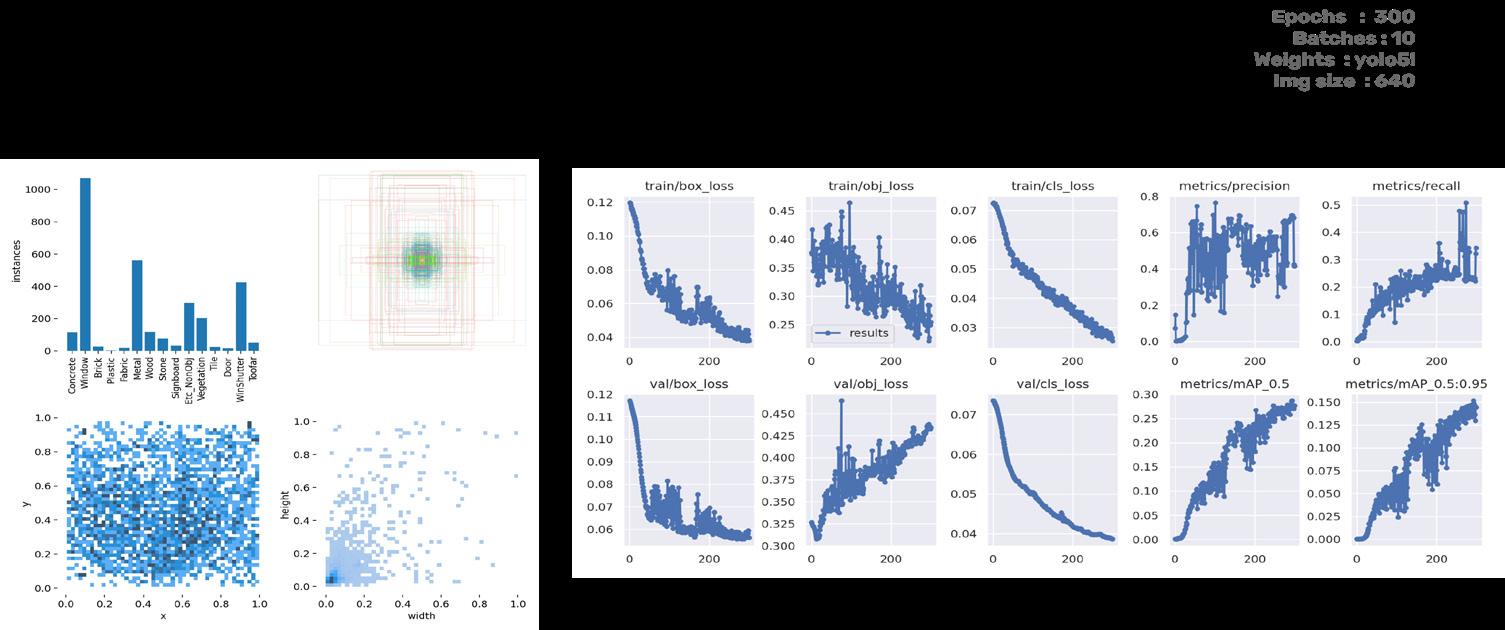
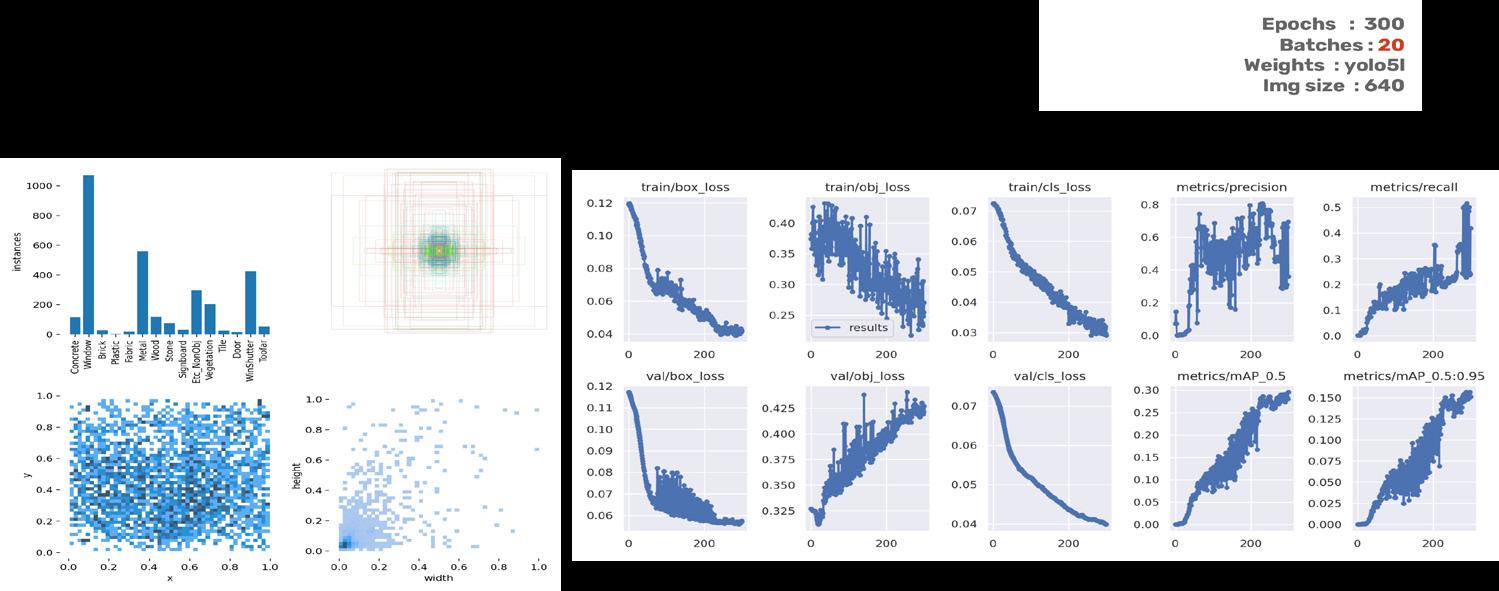
The training dataset is used for YoloV.5 in the Google Colab. After the training, this graph and plots (left) represents the number of boxes(named ‘instances’) depends on labeled materials, and the size of boxes.
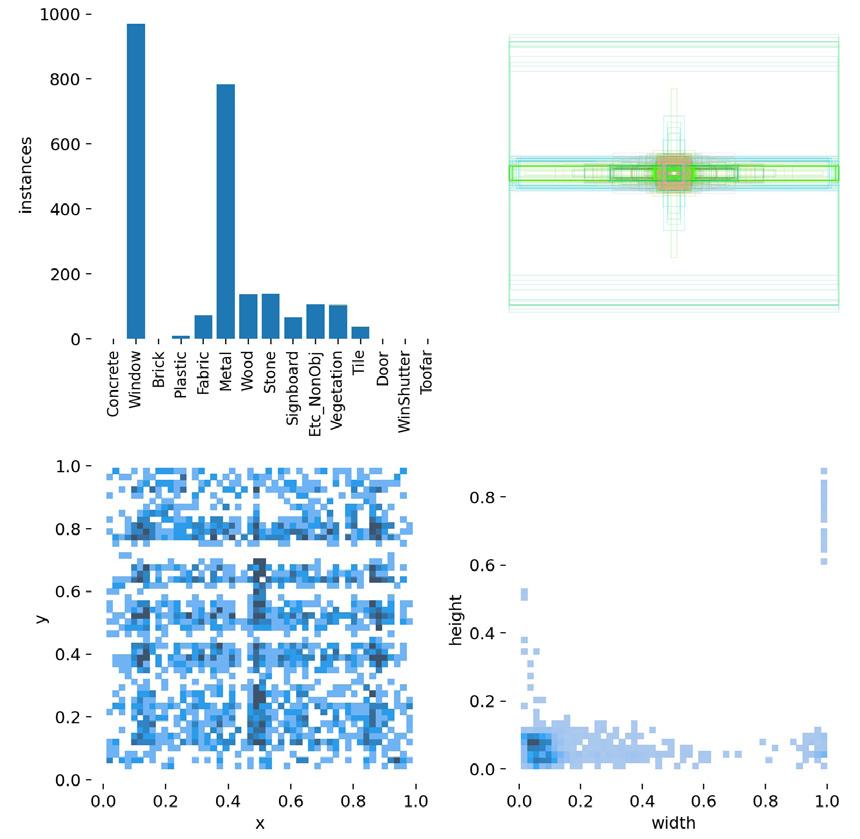
LABELING
212 Facade Images data
Epochs : 300
Batches : 20
Weights : yolo5l
Img size : 640
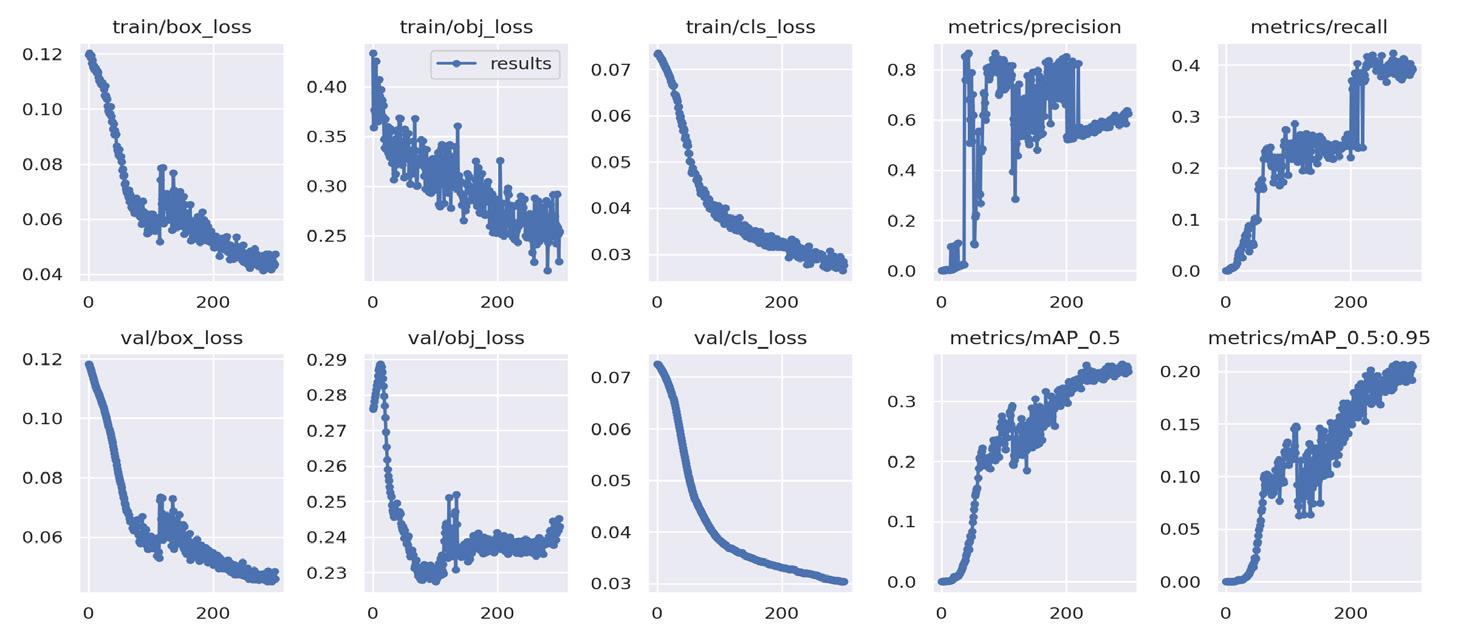
The epochs was 300 and batches size was 20. The weight of Yolo was ‘l’ which is more precise then ‘s’ and ‘x’ models. As we can see on the graphs above, loss value is decreasing which is good but the ‘val/obj_loss’ is unstable in the end. For the ‘metric/precision’ and metrics/mAP_0.5 values are increasing which is normal. But the precision and recall values fluctuate at the epochs of 200.
Epochs : 300
Batches : 20
Weights : yolo5l
Img size : 640
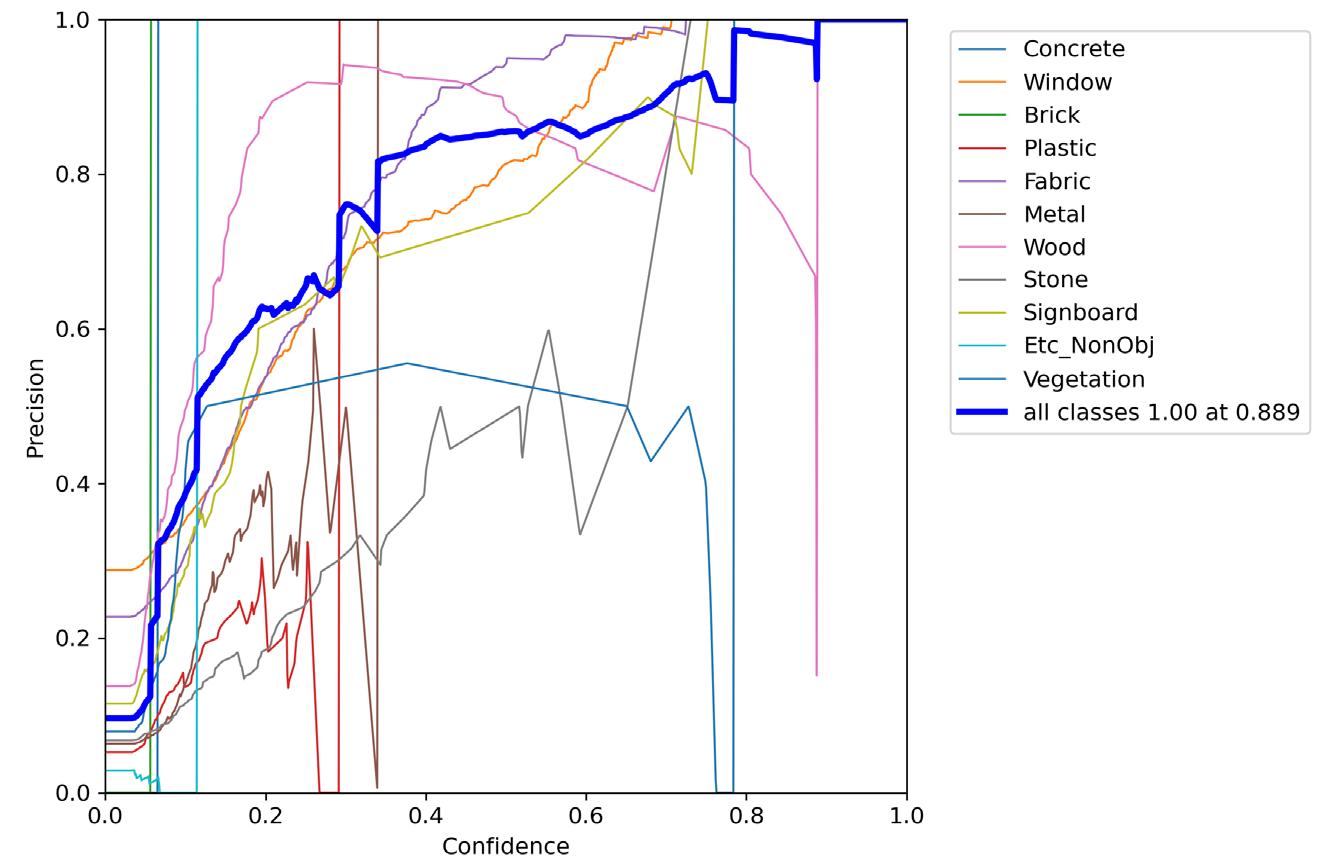
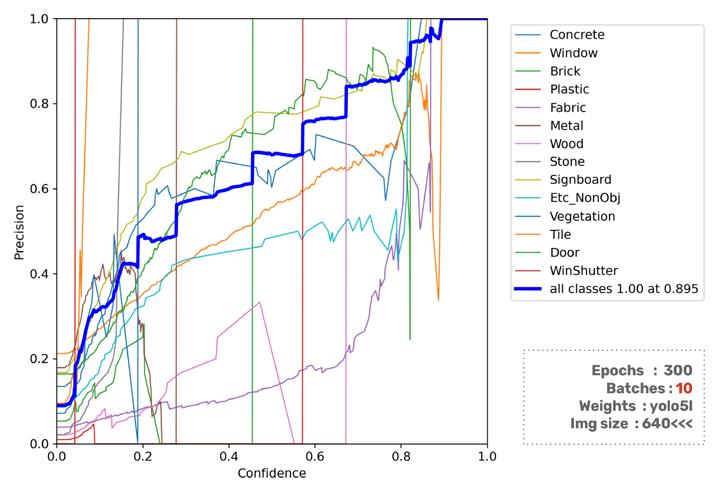
P-curve graph represent the relation of precision and confidence values for each materials. Plastic, Metal, Concrete and Wood especially fluctuate. It is doubtful of the precision of those materials.Generally, all classes values increase with high confidence value in the end. I guess that if we increase the number of training dataset, the fluctuation will be partially resolved with better precision.
As we saw in the graph before, the result of concrete and stone is relatively ambiguous. Nevertheless, the result is highly accurate, considering the number of used training dataset. A disadvantage is that they don’t have geo-location information and it takes too much time to take a photo at this angle.
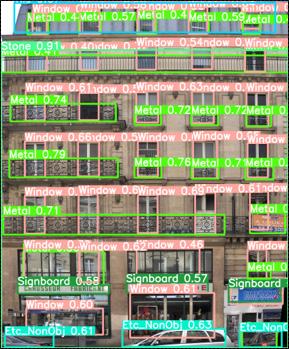
TEST1 TRAINING RESULT TEST1 RESULT
 P-CURVE
https://commons.wikimedia.org/
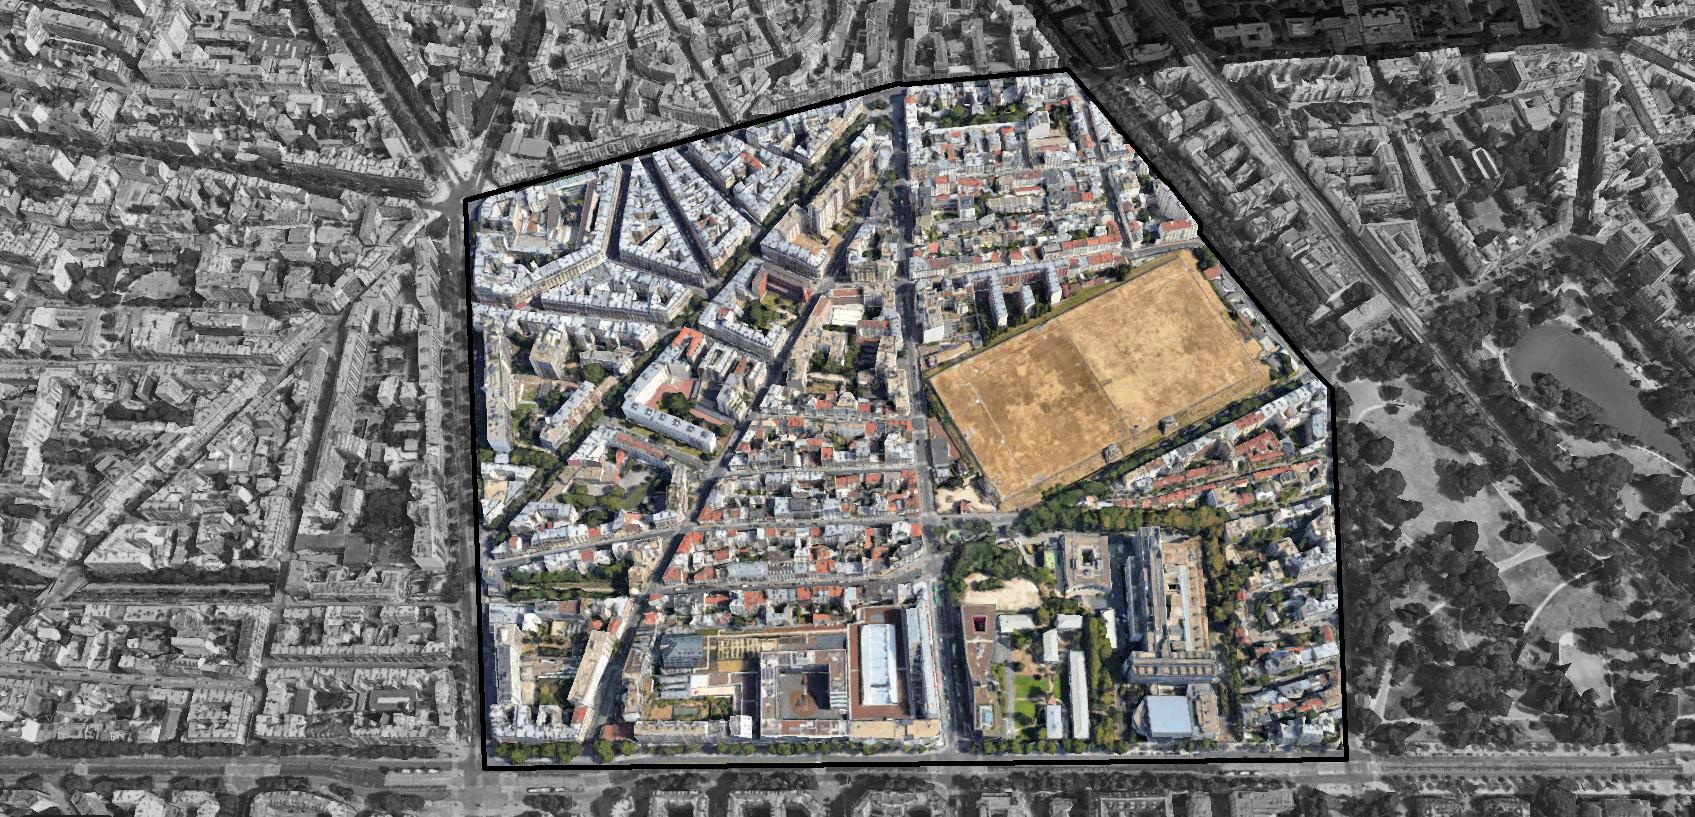
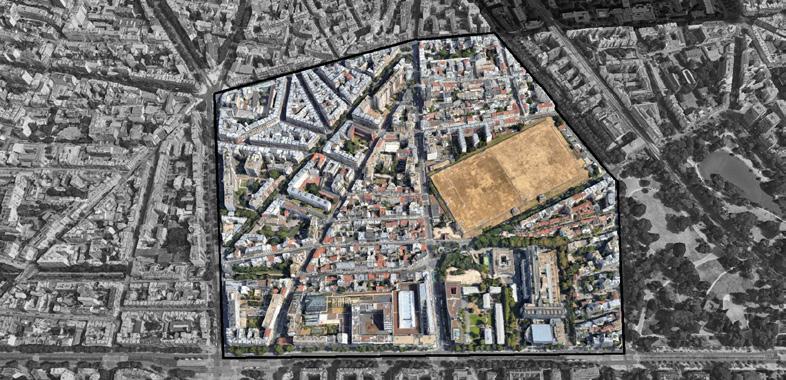
14th Borough (Area Montsouris), Paris
15 features including materials and elements were labeled. If some buildings are too far to recognize, we trained it as a ‘Too Far’ feature in order to avoid confusing backgrounds.
TARGET ELEMENTS
Since we need to generate a dataset in a short time, we selected Google Street Map for capturing images of the facade. It has a good advantage that Google Street Map has already a large amount of data by certain years. We may detect different materials by different years.
We pick an area in the 14th borough to test the captured images from the Google Map.
There are 193 images in total, and we used about 80 images for making training and validation dataset. As the angle point of the Google Street Map is deformed, there would be three issues that may occur. The first is that material can be understood differently by different angles although it is the same material. The second issue would be that different intensities of light may affect the material resolution. The last is that the bounding box from detection is not straight up like the test1 because of camera angle.
CASE STUDY SITE _ TEST2
TEST2 DATASET
193 Facade Images data
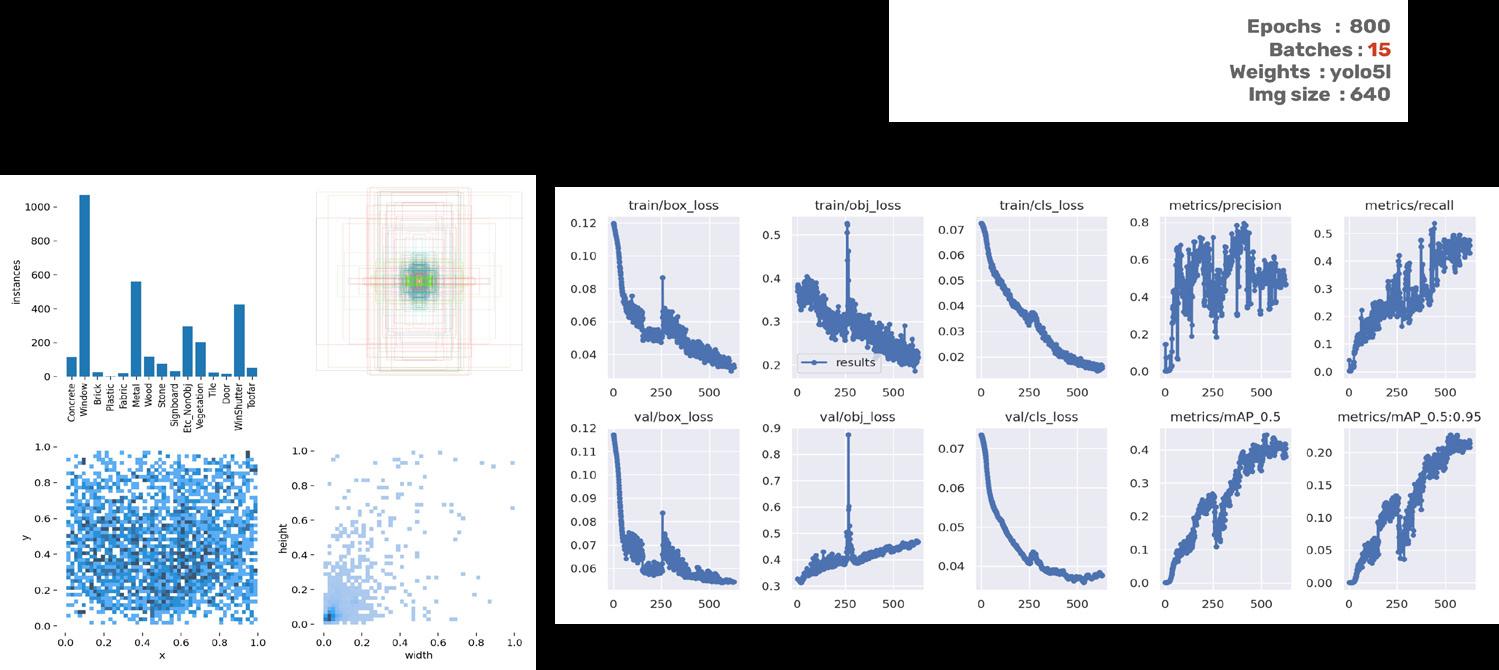
TEST2 TRAINING RESULT
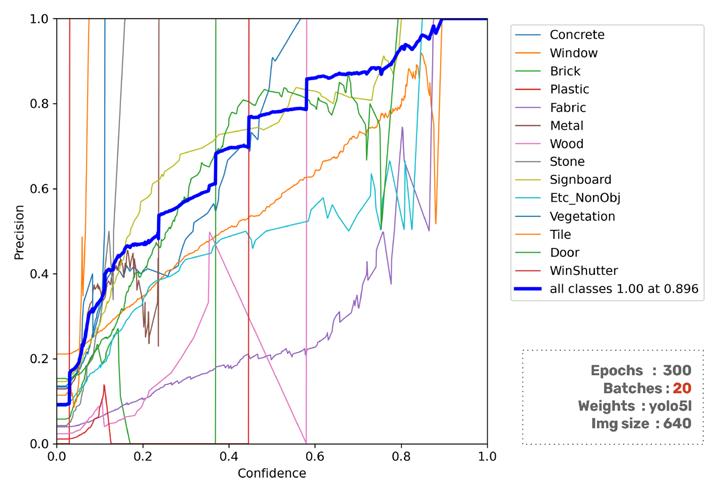
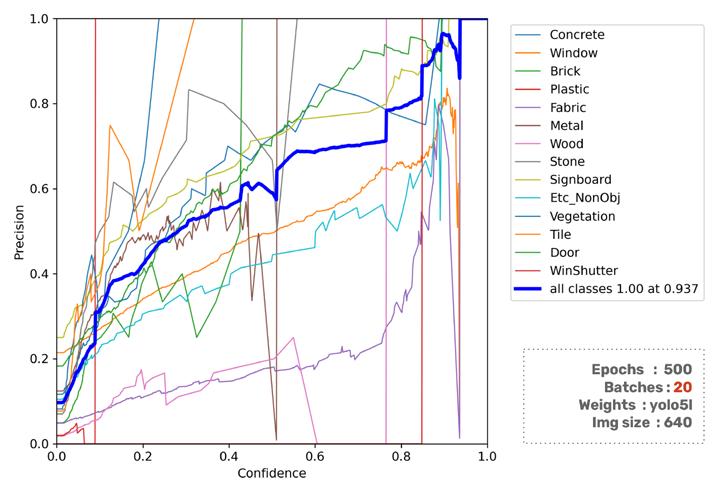
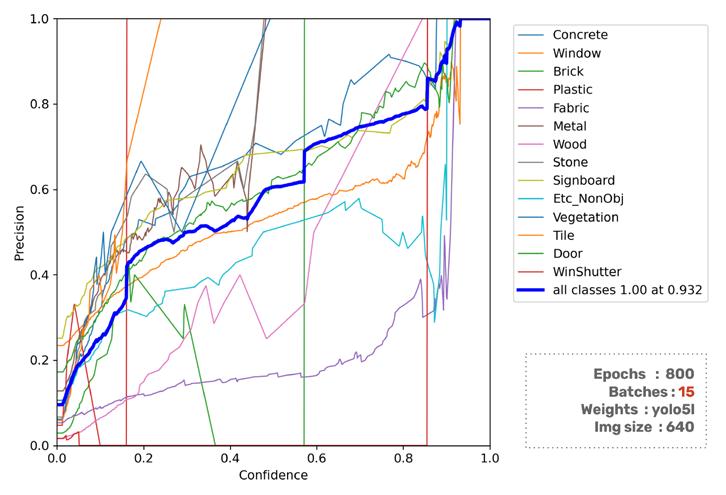
4 different training sessions were executed by changing Epochs and batch values to improve the precision and loss value. From epoch300 to 500, those values were improved, but with epoch 800, except some parts, it went worse than before.
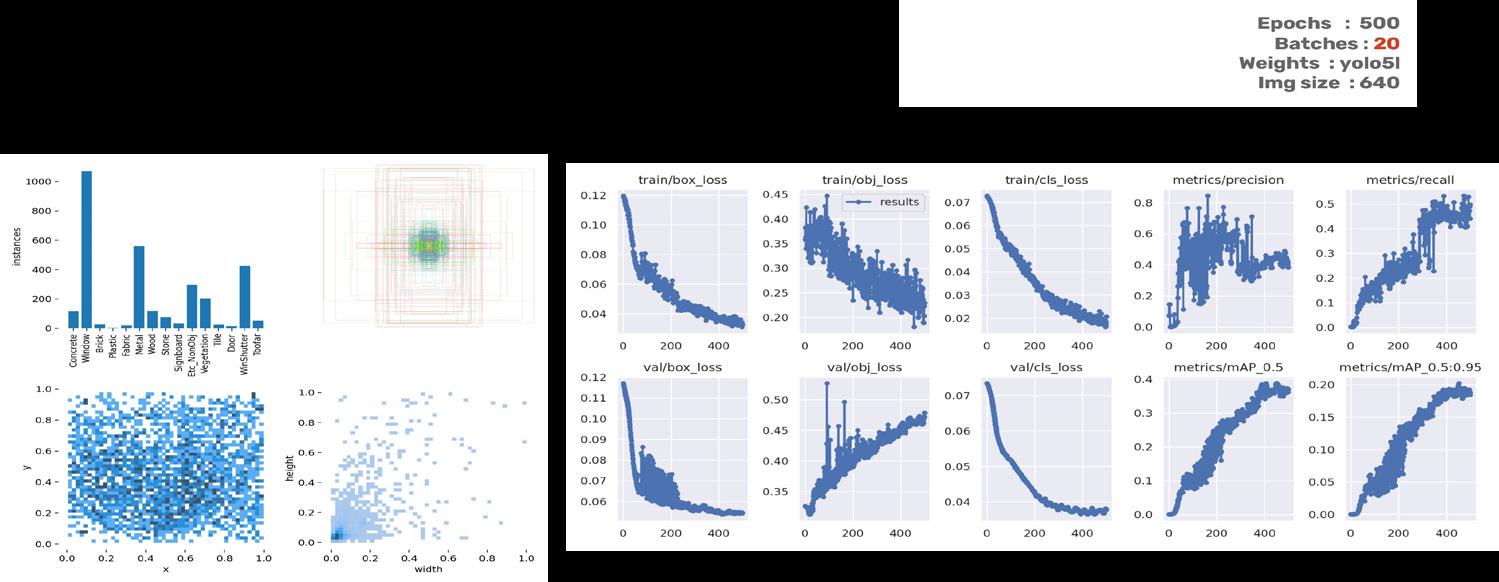
At the P-Curve graphs with 4 different epochs and batches, it seems like that epochs 300 and batches 20 model is the most stable although its confidence value is lower than two other graphs of epochs 800 and 500. Here, the all classes value(dark thick bleu) of the epoch 800 is slightly better than the ones of epoch 500.
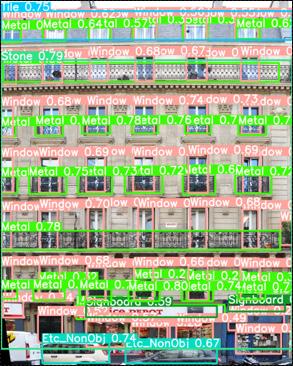
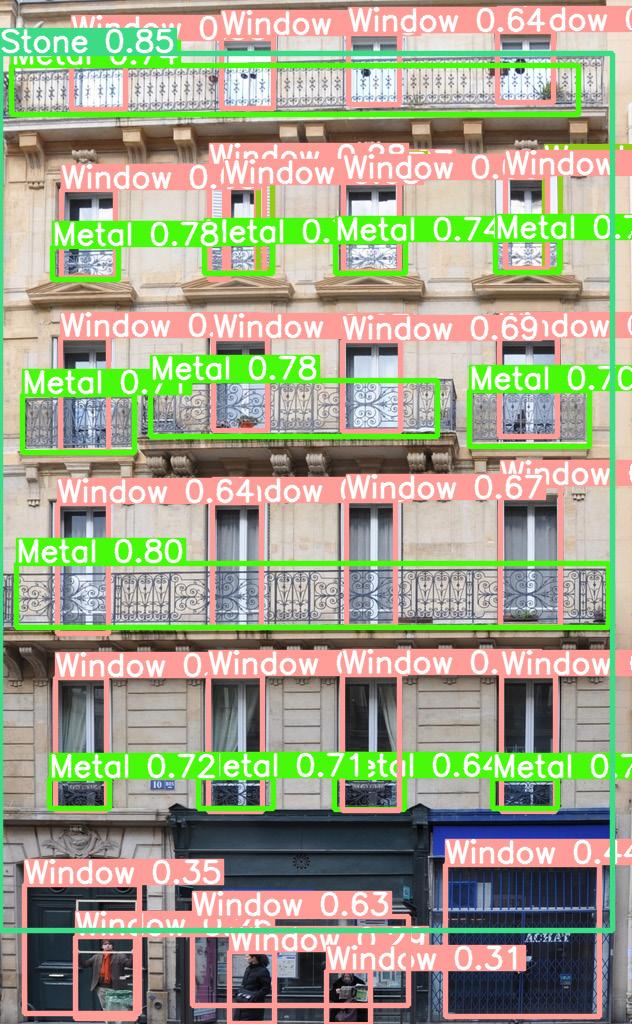
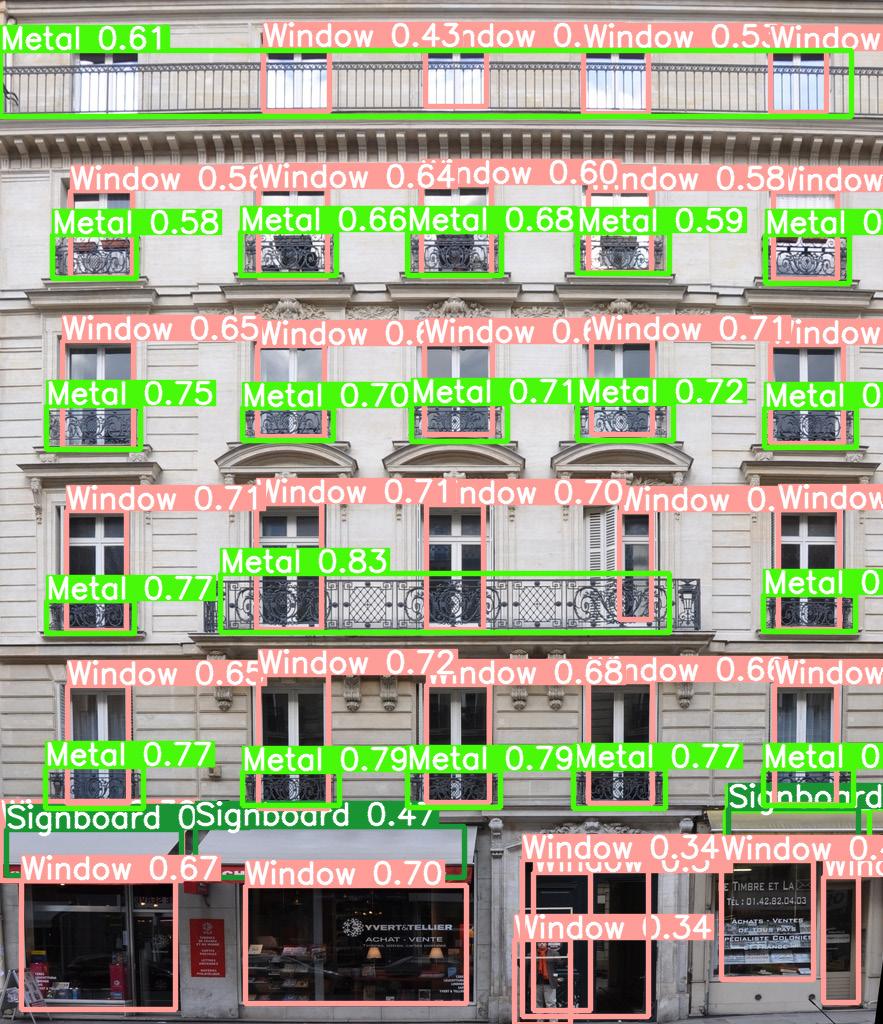
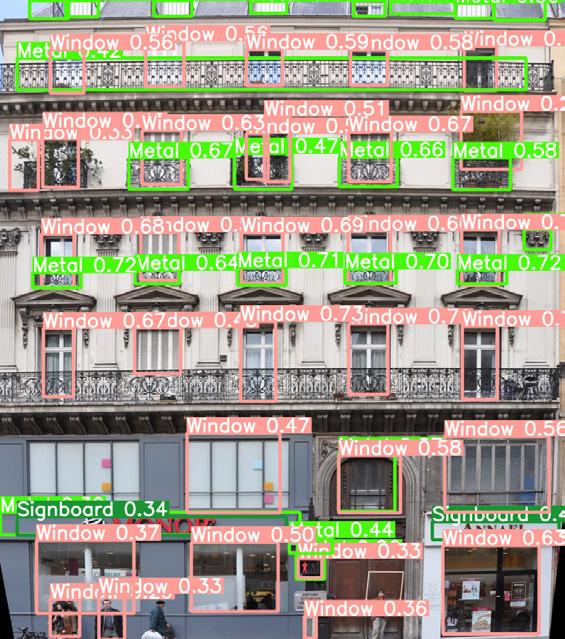
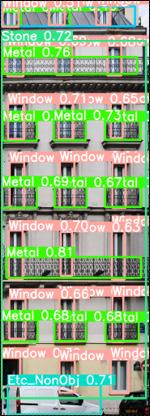
Two images were tested by different epochs and batches conditions. Similar to the previous graphs, the epochs 500 and batches 20 model is relatively accurate. Epochs 300 models are missing some elements. In contrast, epochs 800 model detects little too much so that some instants are overlapping.
In the second test image, the green part which is wood material with painting on its surface wasn’t well detected. It is because painting on a material makes it confusing to capture for A.I what is the original material.
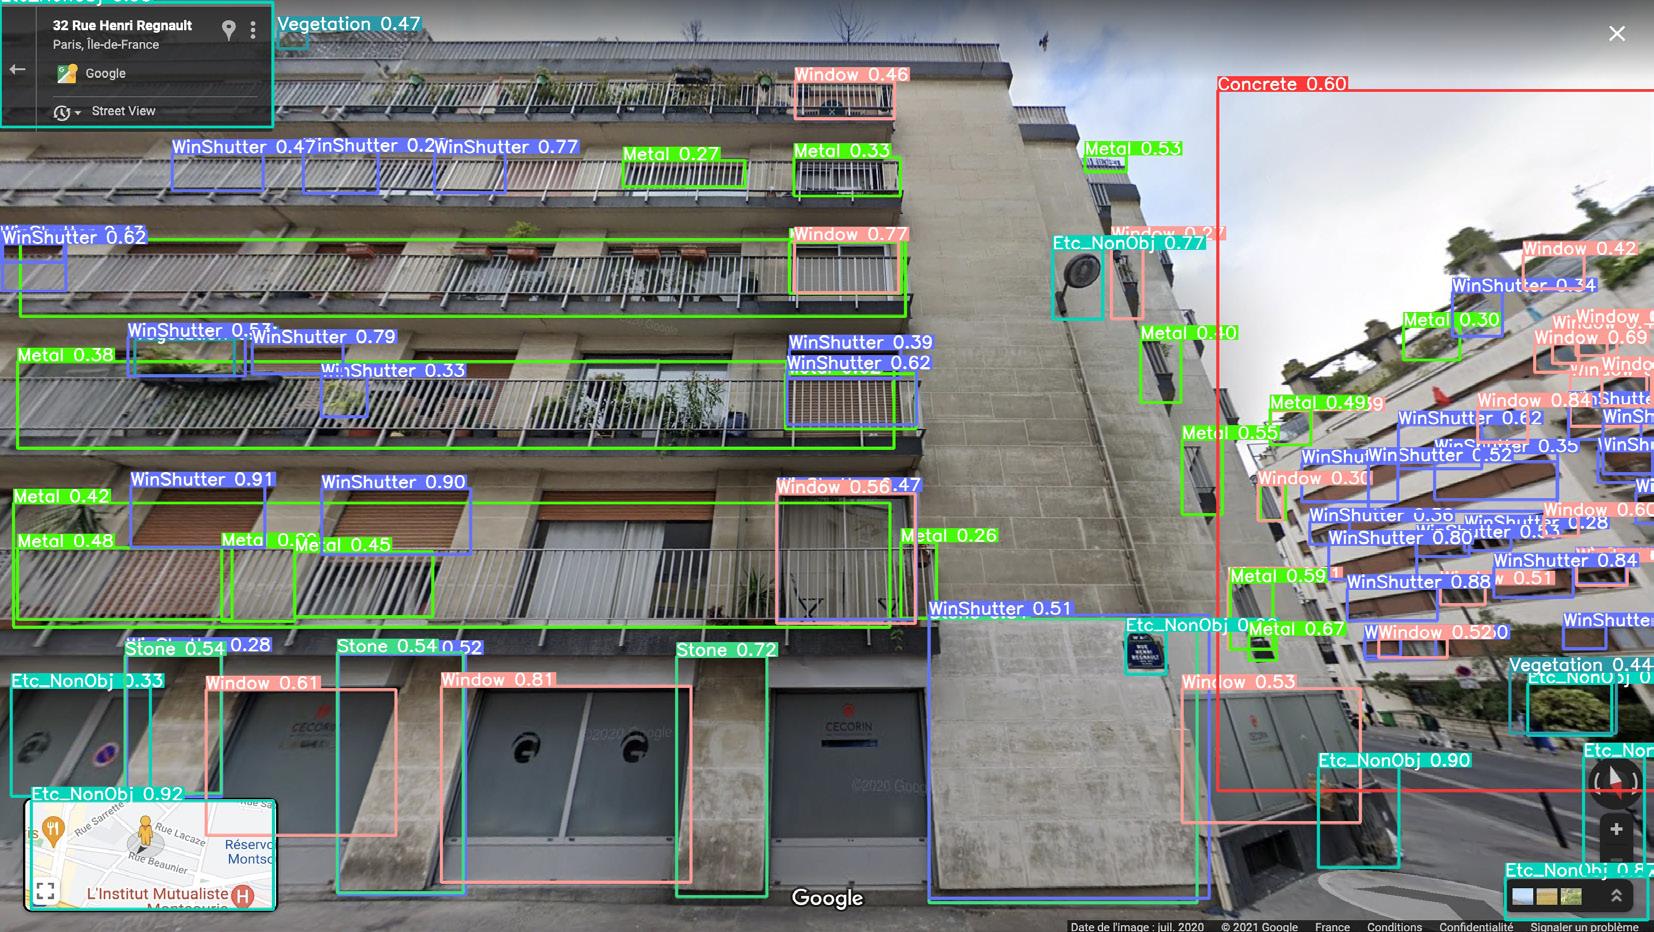
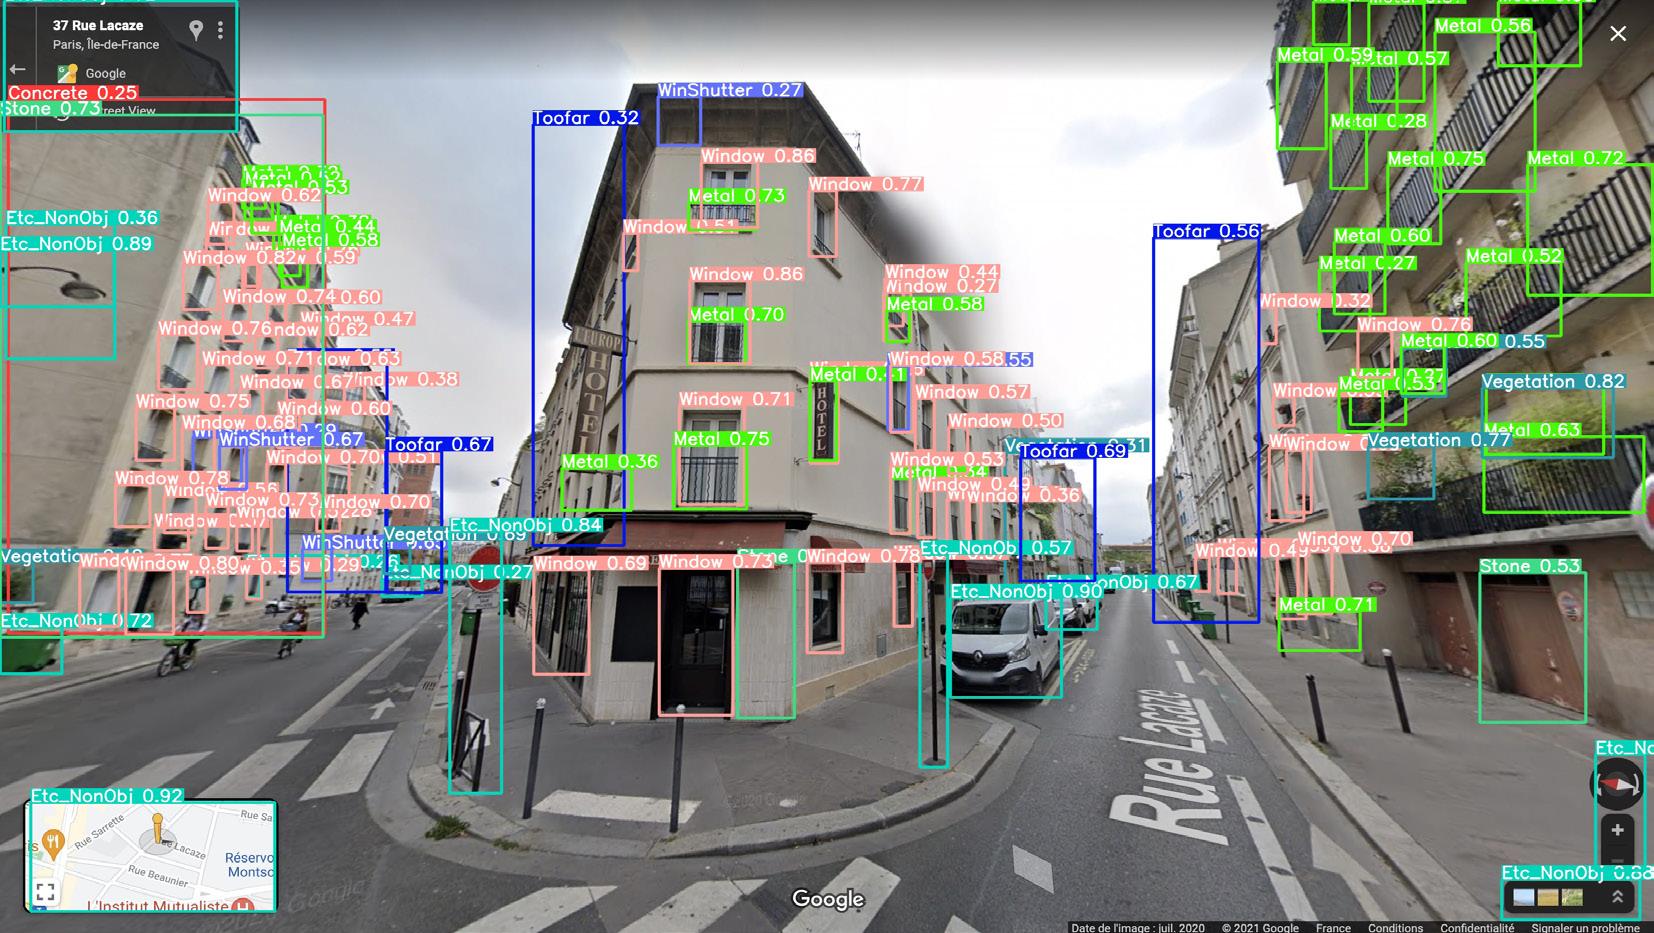
The first image on the top is showing that the object detector is catching although the angle is changed. But also we can see that there are ‘Too far’ boxes to avoid too much complexity of the observed image. In the second image, we can see many errors. For example, the stone facade was neither concrete nor stone. It seems like the metal part and window shutter part are also conflicting with each other
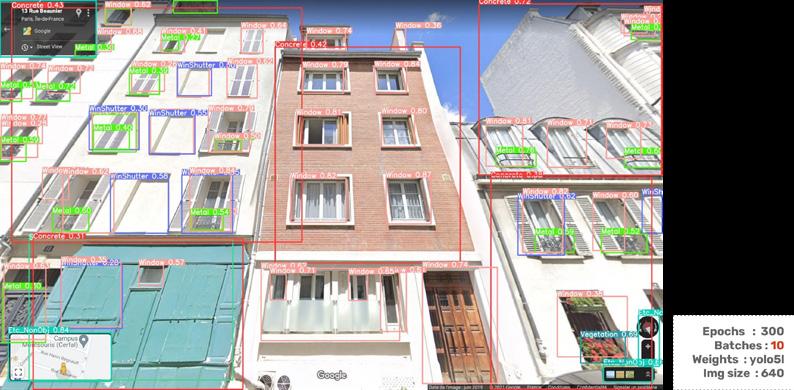
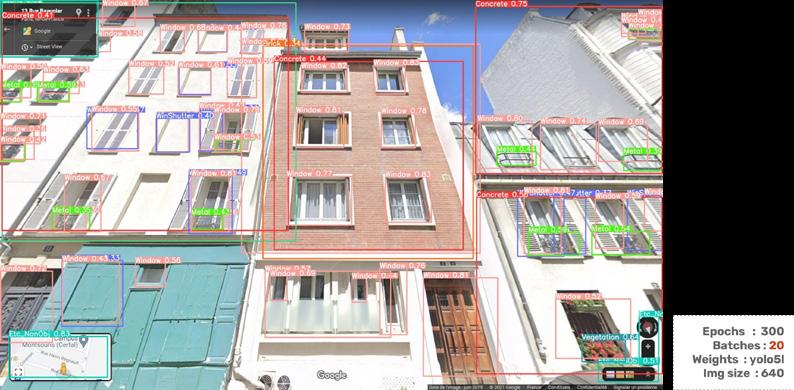
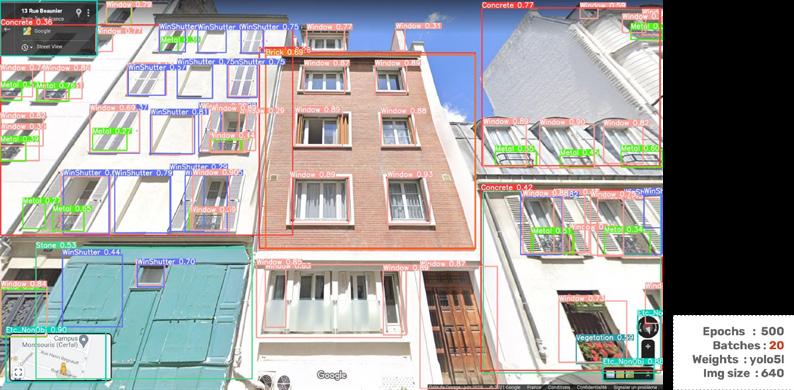
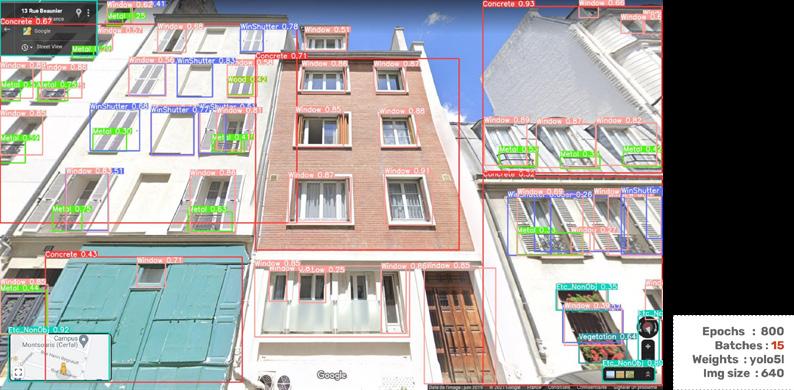
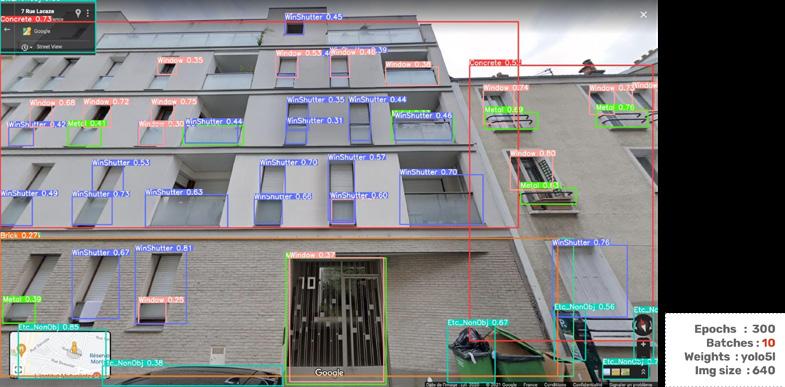
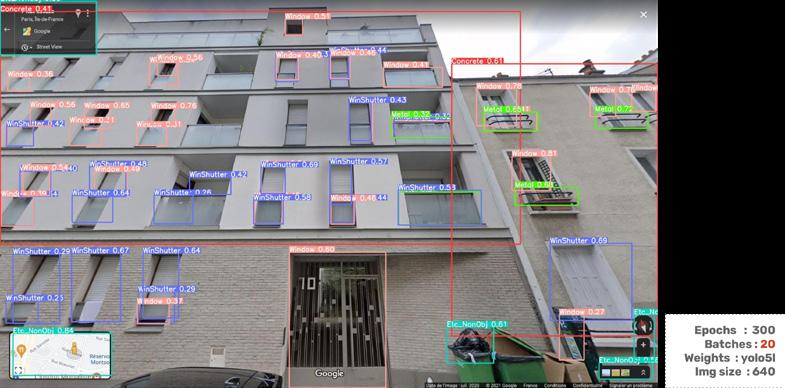
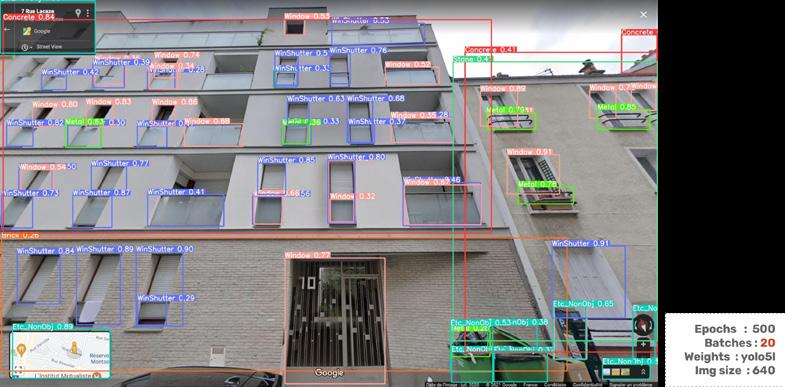
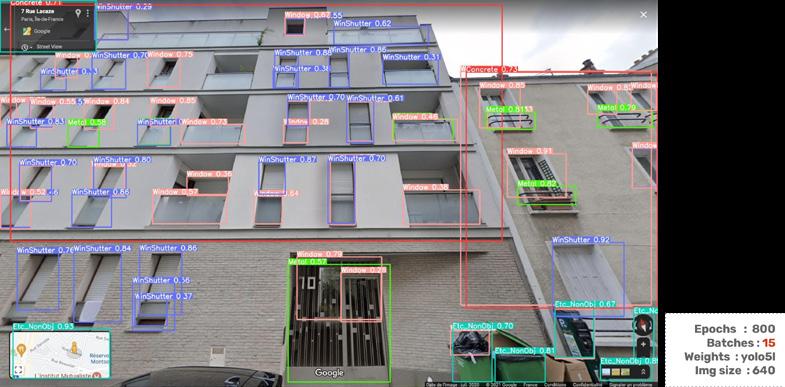
TEST2 RESULT
As we saw earlier, P-curve and precision graphs and test images show us that there is confusion for machine learning algorithms. We may guess few reasons as below :
- Painting material cover original material
- Impossible to detect all the materials especially for not aligned building
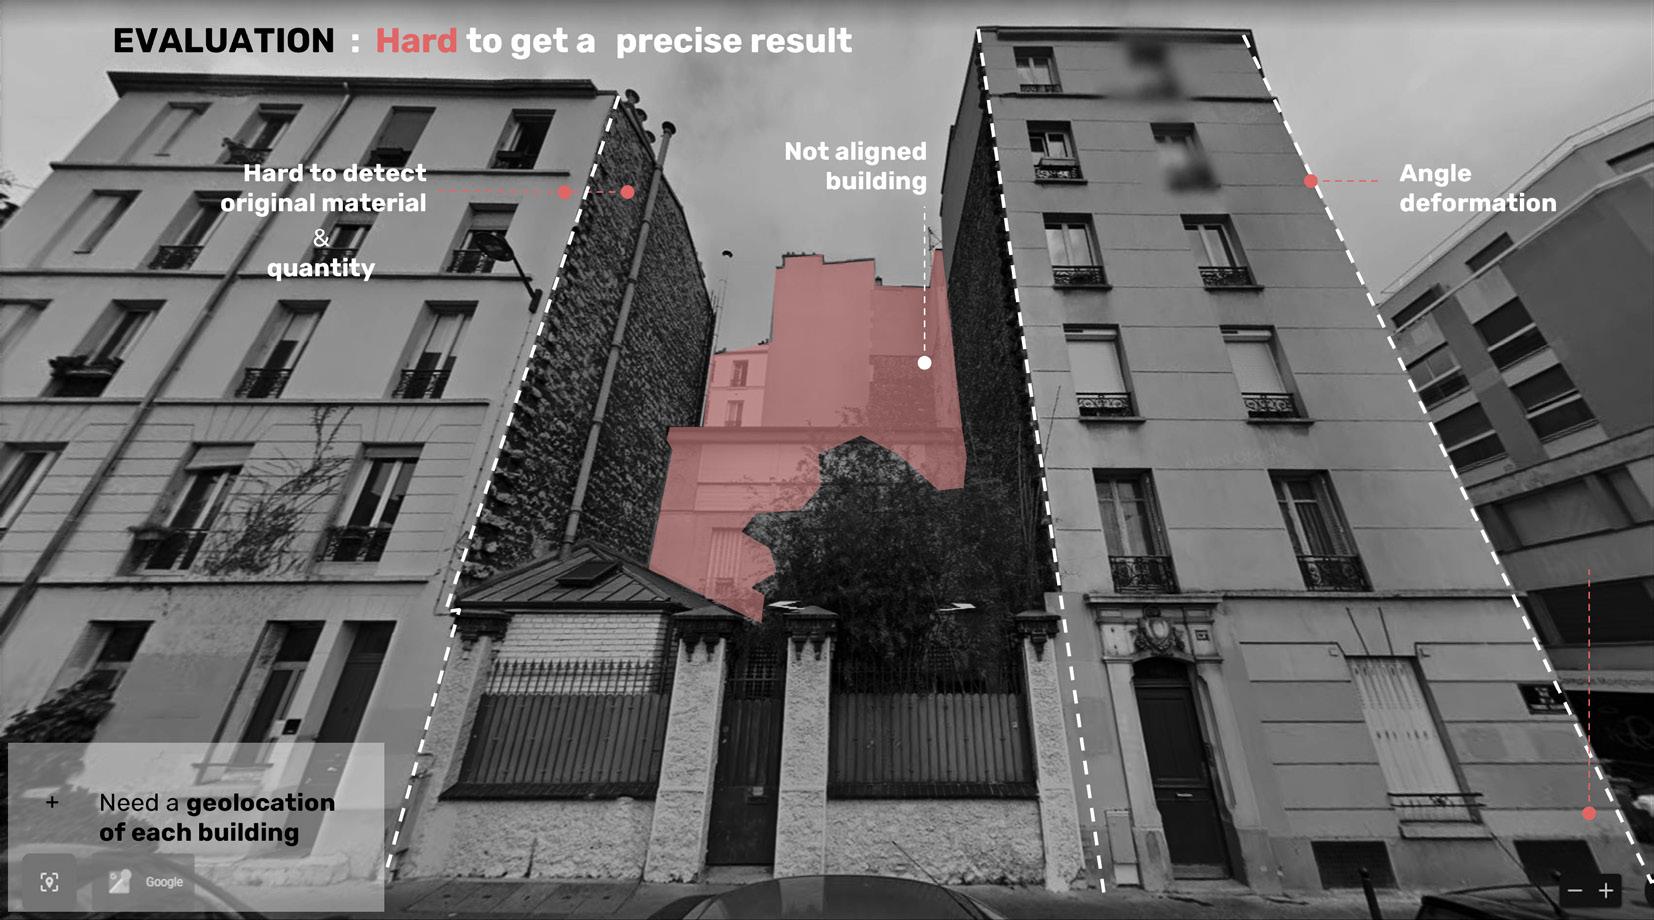
- Deformed camera angle
- Image quality
- Number of training dataset
But also, there isn’t, roof material and geo-location data for this test. In the next chapter, we will, first of all, Correct manually all the errors of building datasets to visualize the data.
EVALUATION
Image quality
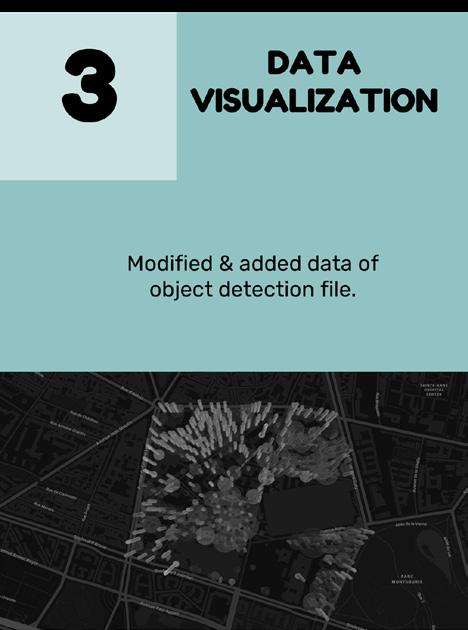
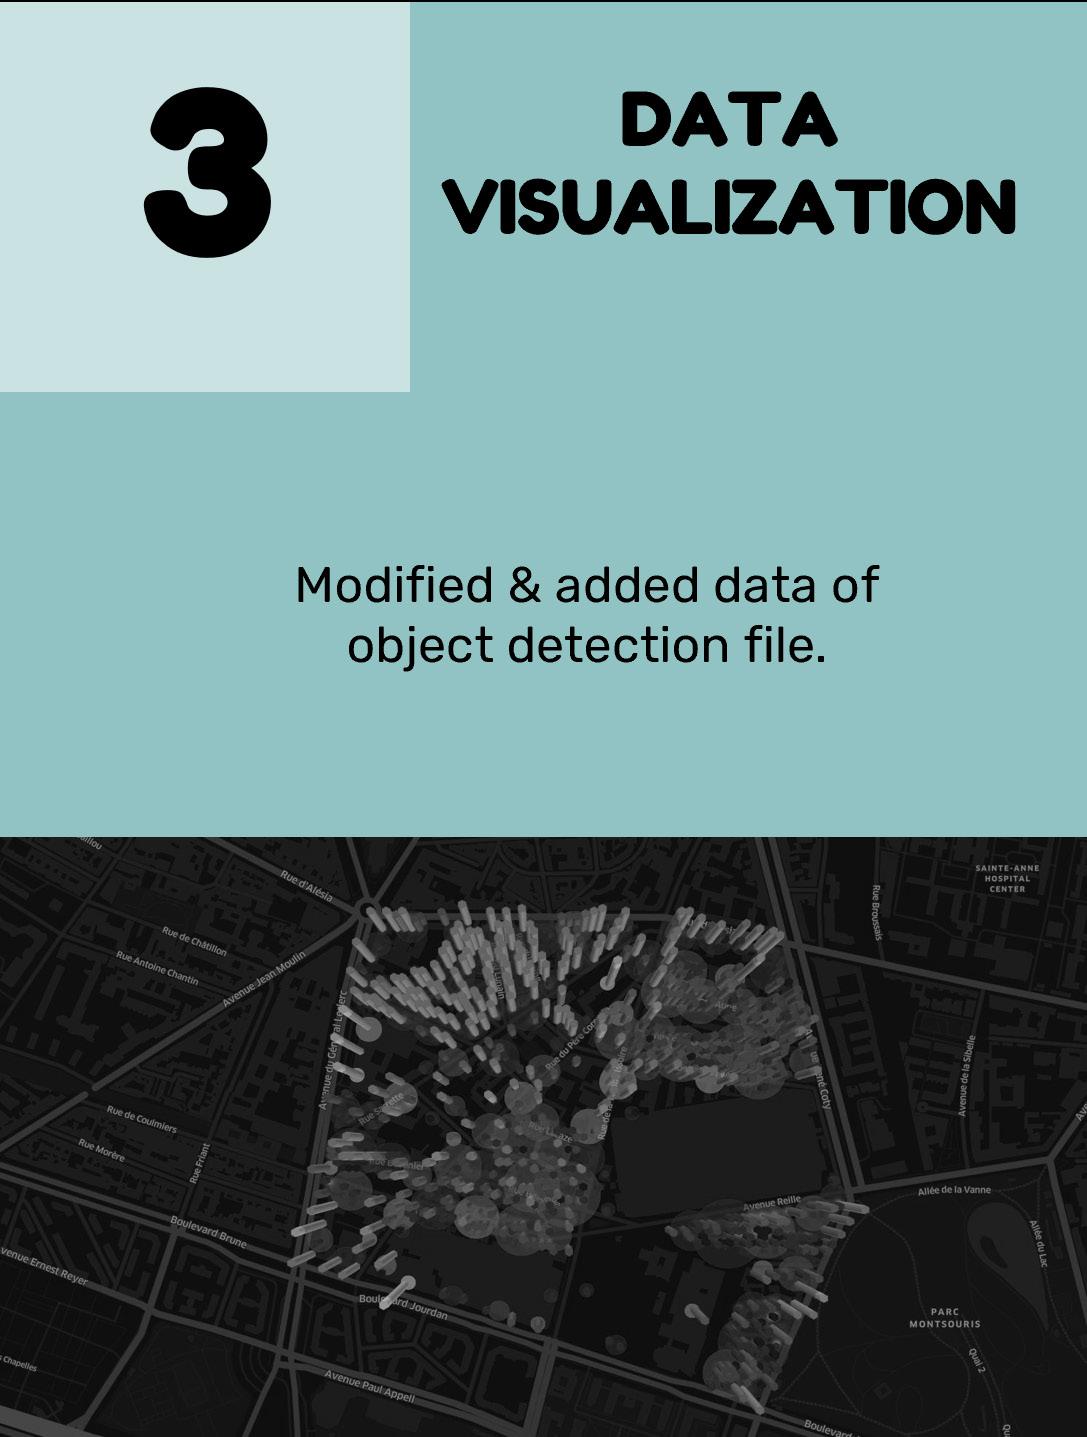
To correct errors from previous data, we had to check and modify all the data and compare all buildings of the site in Google maps to check before visualize the data. Then, we analyse and plot data to understand the structure of our dataset. Finally, we visualize it in the open source web maps platform, ‘Kepler.gl’.
WORKFLOW
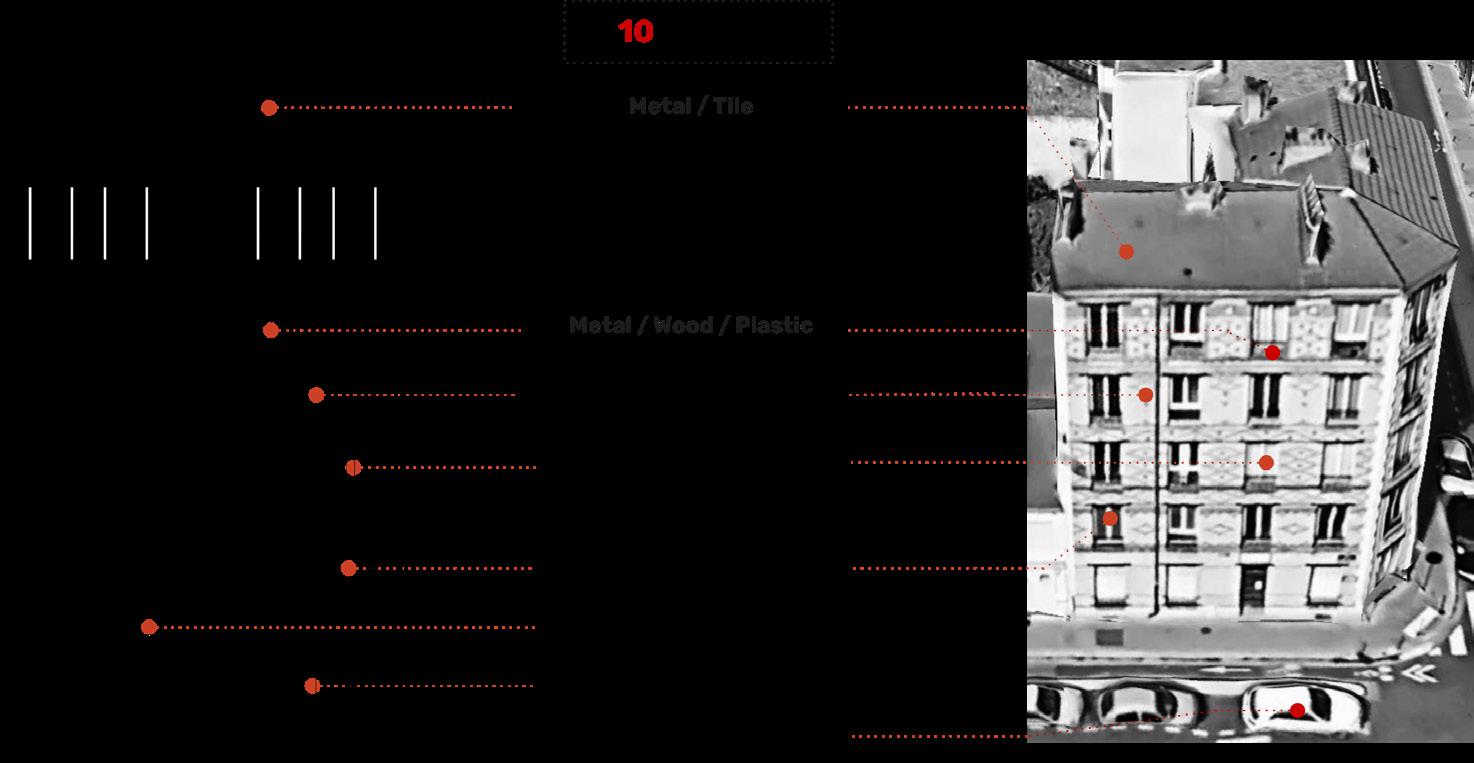
For the dataset, we reduced features to 10 features by rearranging only material based features except window and window shutter which has too many variations and it has the advantage to reuse it without other complex treatment ). Then, we also add roof material, geological data and constructed year to show different material composition in the site by time.
14th Borough (Area Montsouris), Paris
https://commons.wikimedia.org/
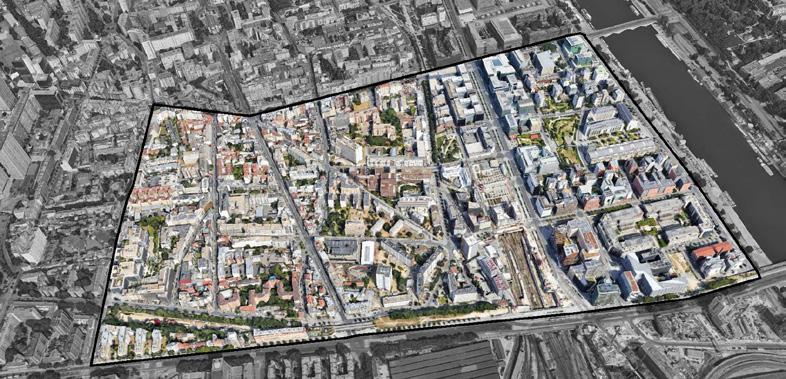
One more sector for the test site was added. This sector has been developed a lot with new construction buildings which is an advantage to show the variation and development of materiality by time.
13th Borough (Area Campus Grands Moulins), Paris
TARGET ELEMENTS SCORE RULES
In order to compare material quantities, there are score rules by the proportion of each feature. Minimum value is 0 then 0.1 and the maximum score is 1.5.
CASE STUDY SITE
This is the final dataset in the form of csv.file with geo-location of latitude and longitude. It is composed of 10 material classes and 7 other features. Google Street map was taken photo for this area for 3 times ; 2008, 2014, 2020
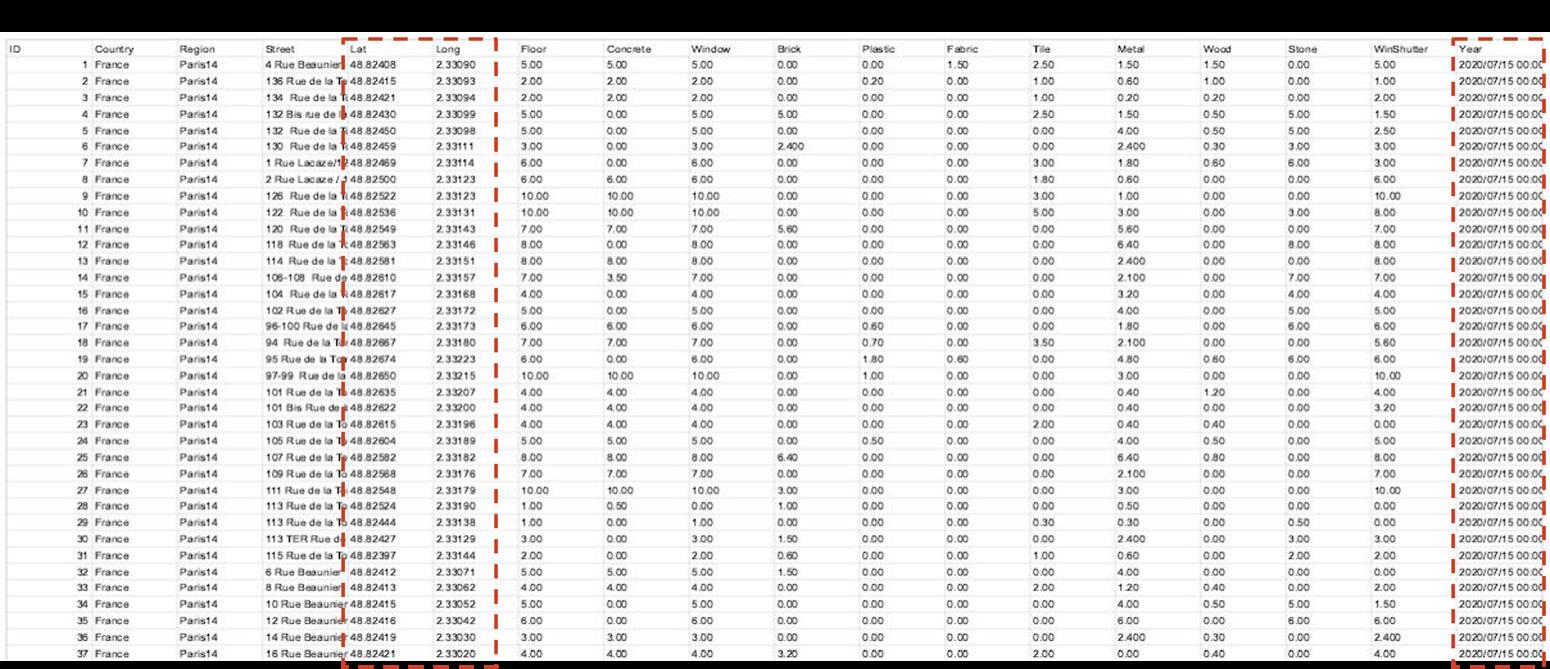
DATASET
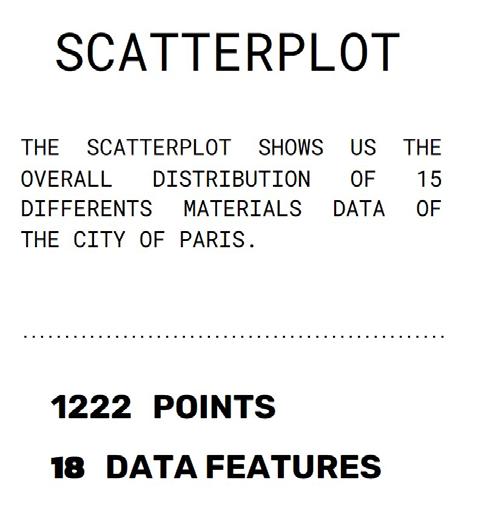
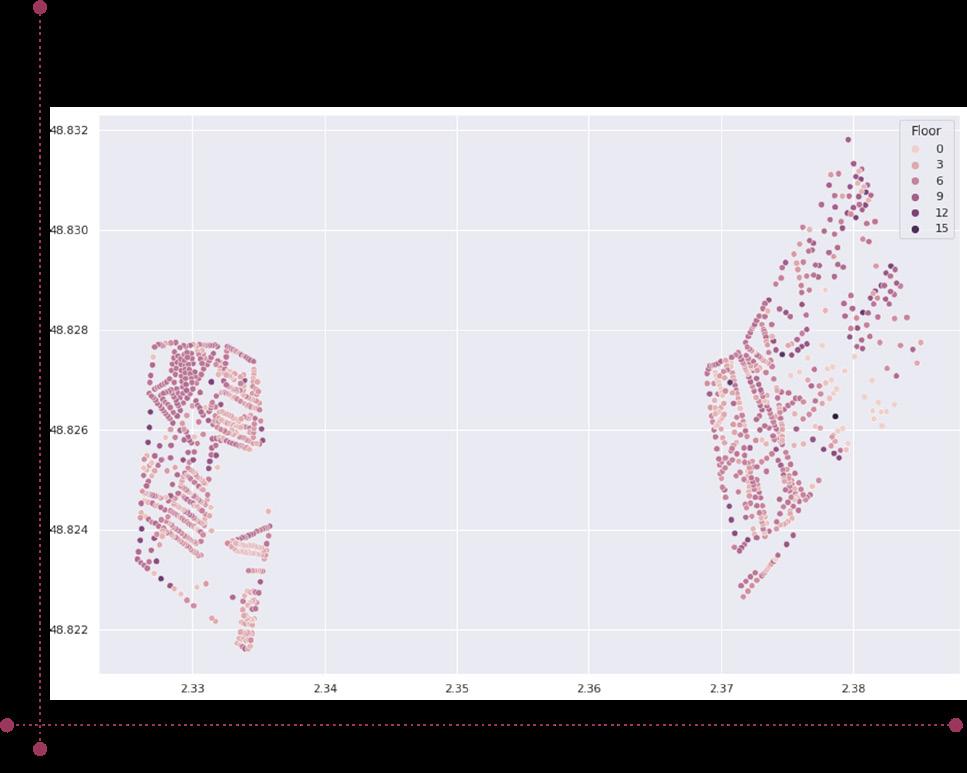
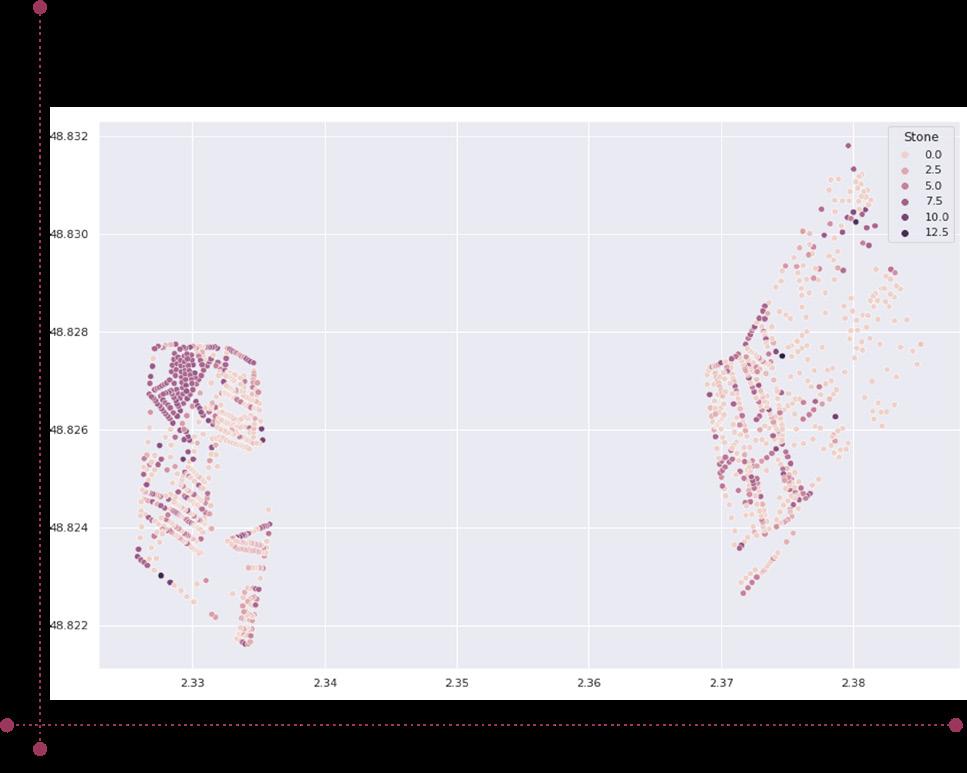
These plots also represent the relationship between construction year, floor and other materials such as concrete, brick and stone. But many of the plots are overlapping so that it is unreadable.
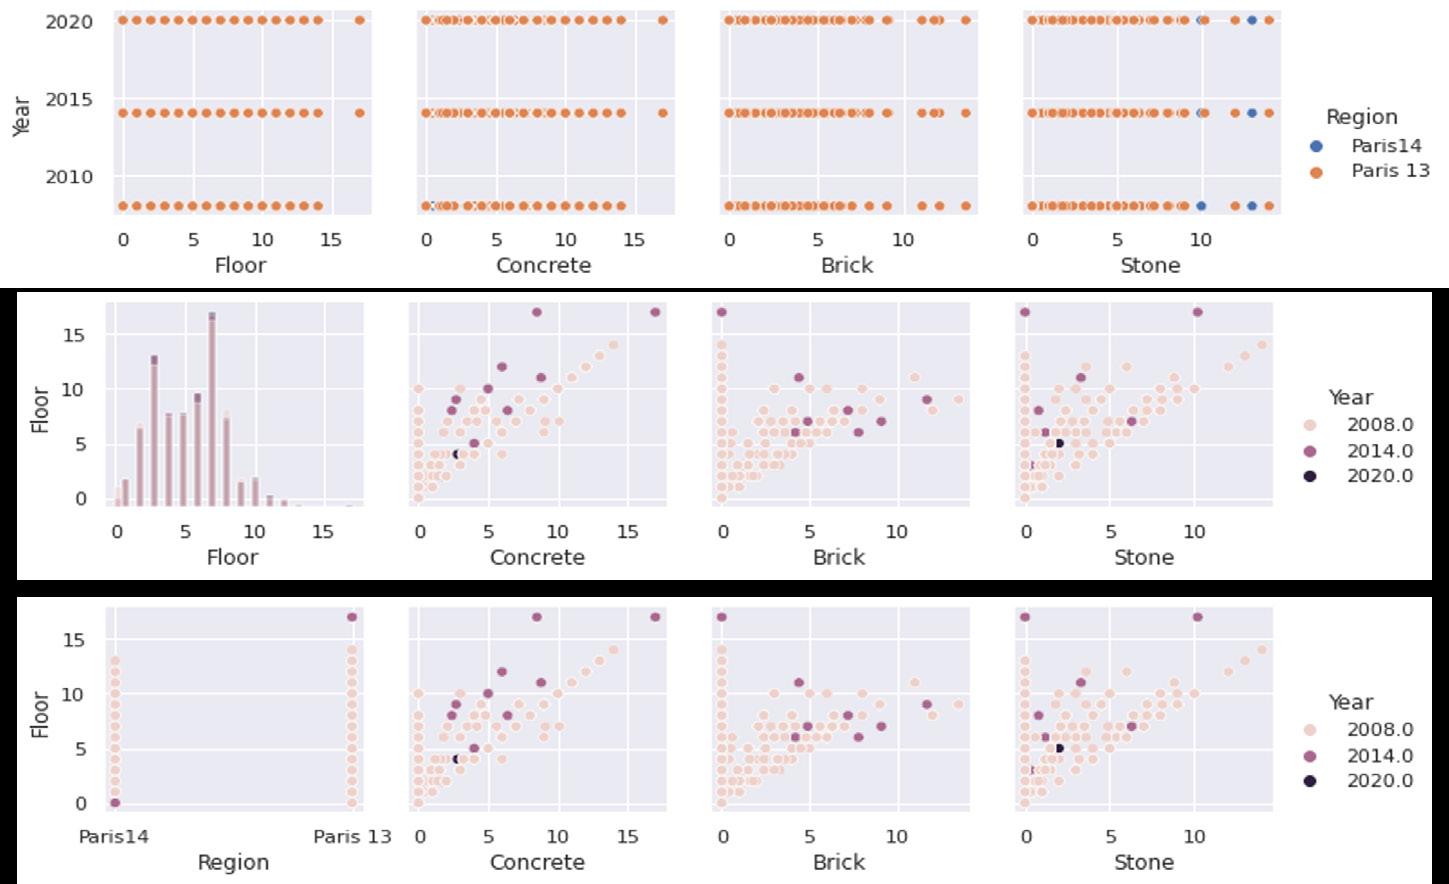
REGION
On the left graph, we can see that Paris 13 has higher buildings and a little bit more new buildings than Paris 14th borough. On the Right graph, there are many apartments built by stone in Paris 13th borough compared to the Paris 14th borough area.
DATA
DATA ANALYSIS
REPRESENTATION
FLOOR STONE
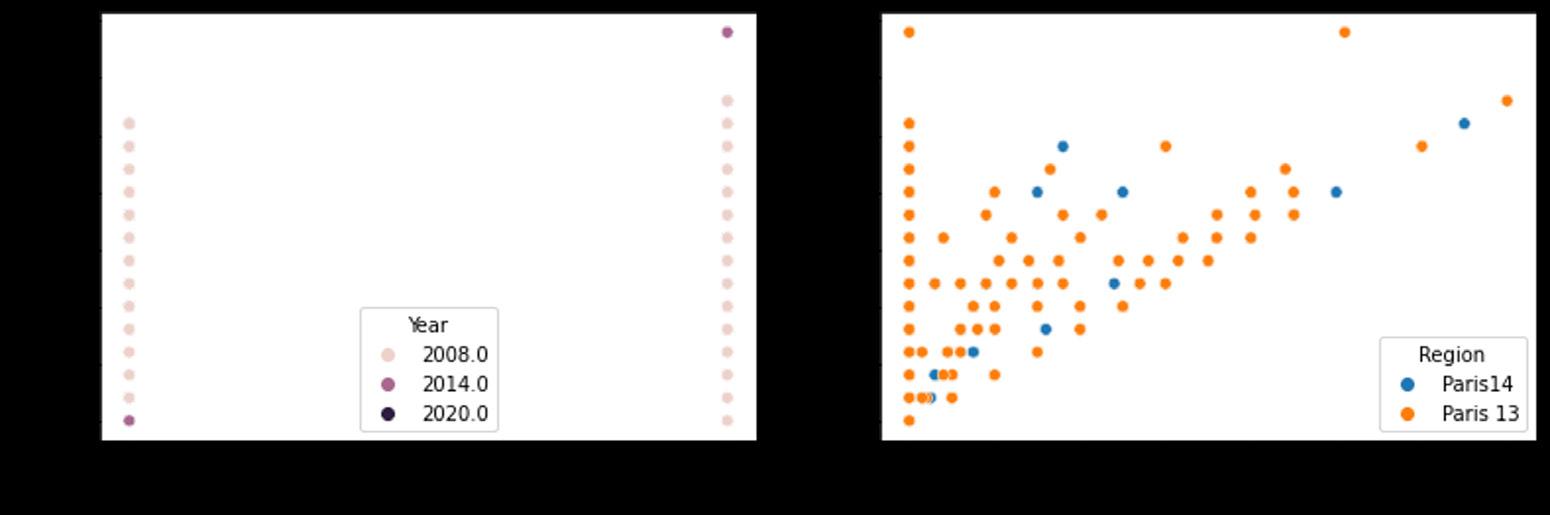
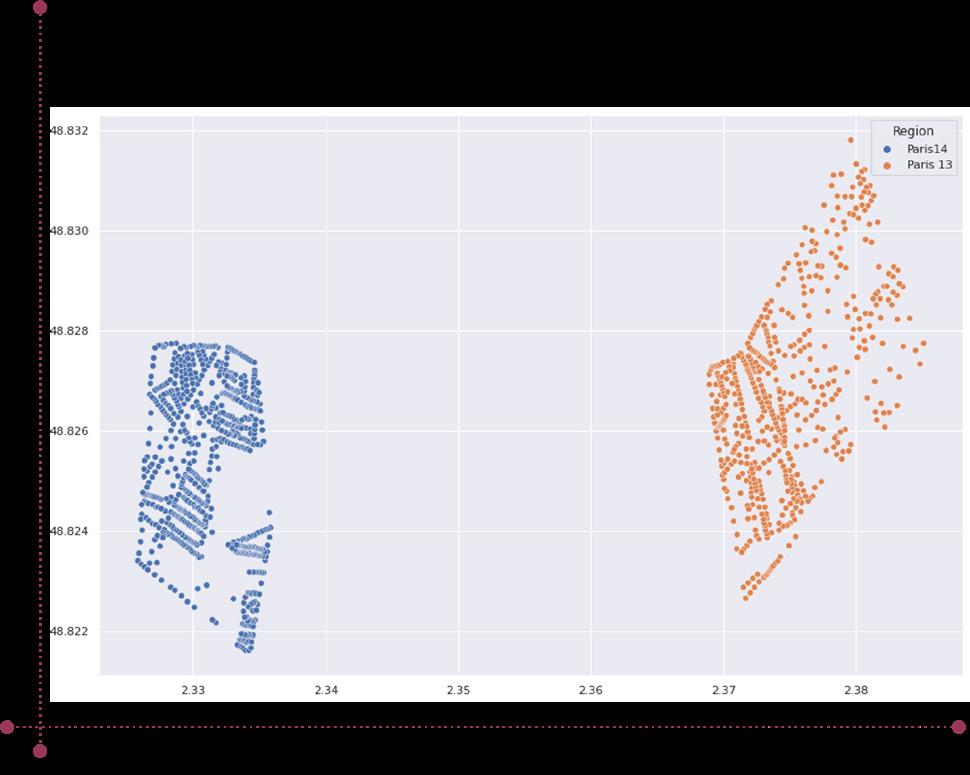
These scatter plots are similar as previous ones but it represented with geo-location data so that we understand better the position and color of plots.
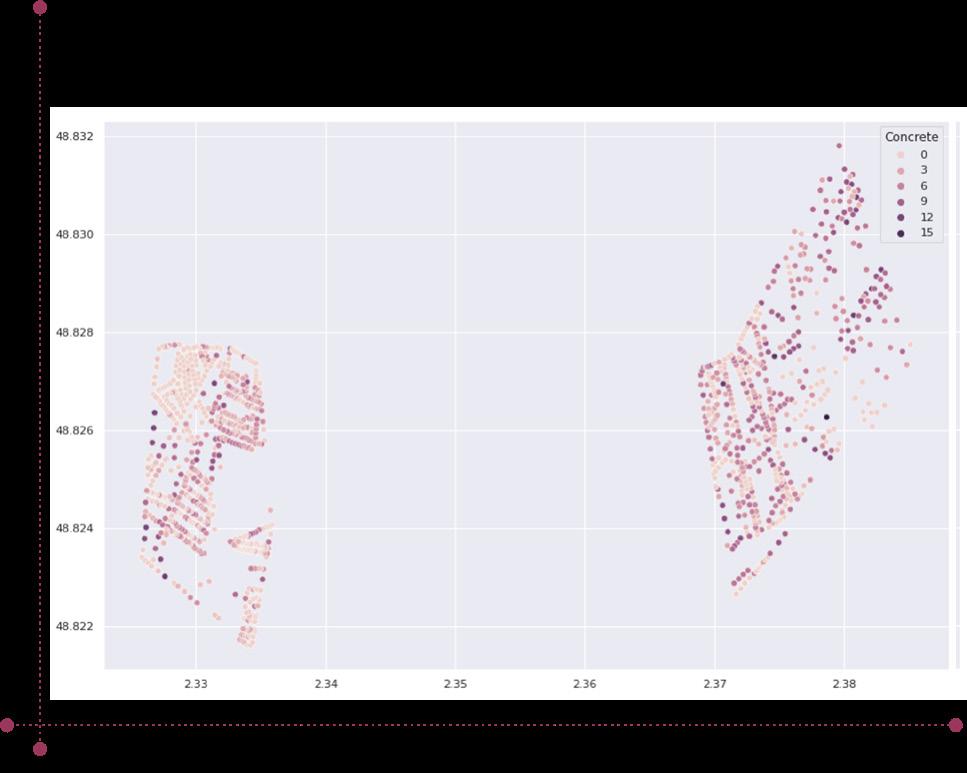
CONCRETE
Website to explore the
: https://matmap185132459.wordpress.com/
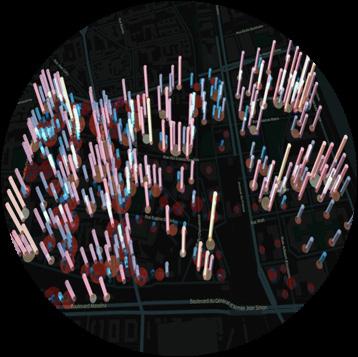
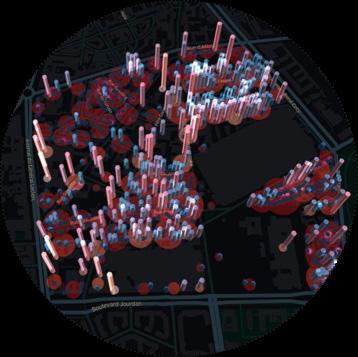
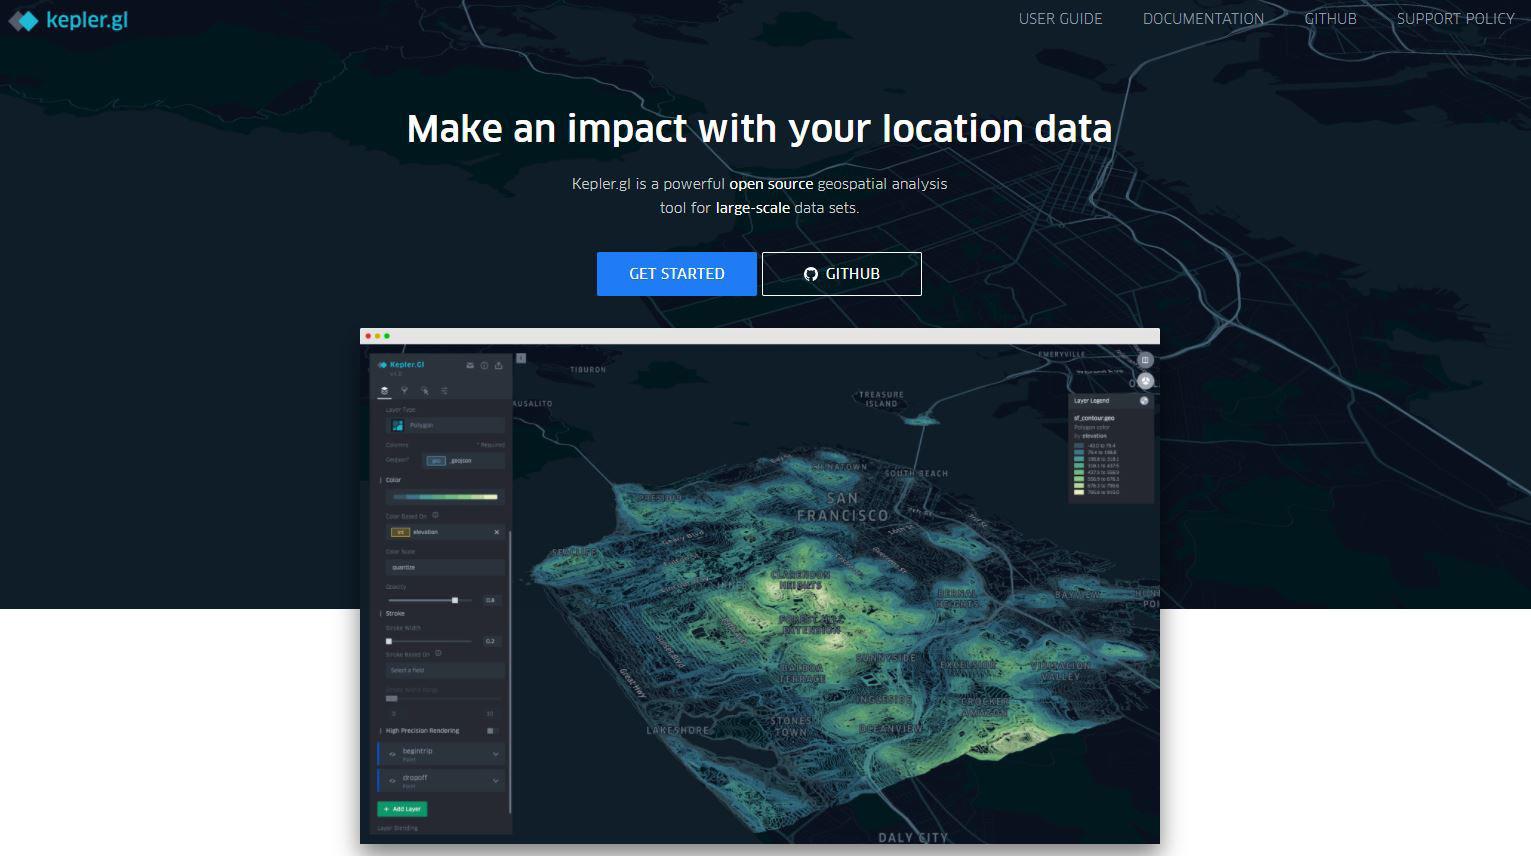 “Kepler.gl is a data agnostic, WebGL empowered, high-performance web application for geospatial analytic visualizations.”
Mat-Map
14th Borough (Area Montsouris), Paris
13th Borough (Area Campus Grands Moulins), Paris
“Kepler.gl is a data agnostic, WebGL empowered, high-performance web application for geospatial analytic visualizations.”
Mat-Map
14th Borough (Area Montsouris), Paris
13th Borough (Area Campus Grands Moulins), Paris
MAT-MAP V.2 WEB DEPLOYMENT
Source : www.Kepler.gl
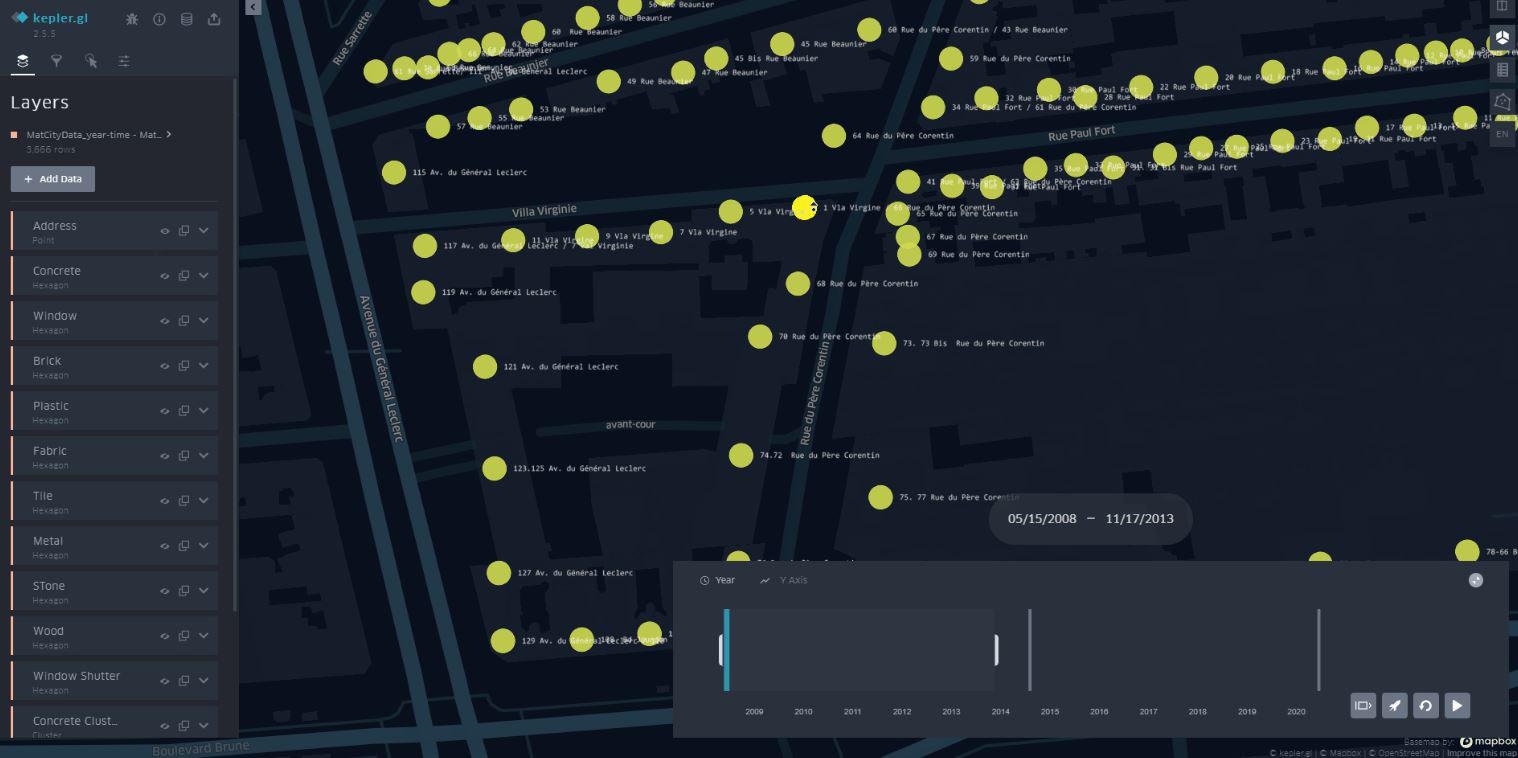
If we zoom, user can see the building address

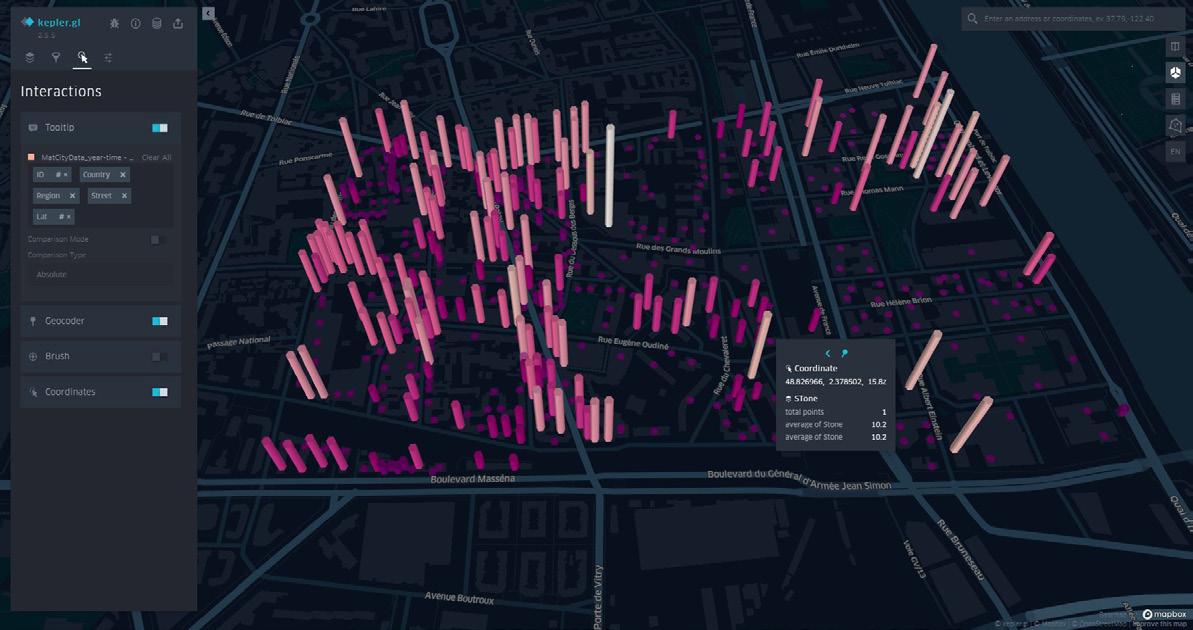
User can add, delete or hide coordination and building informations
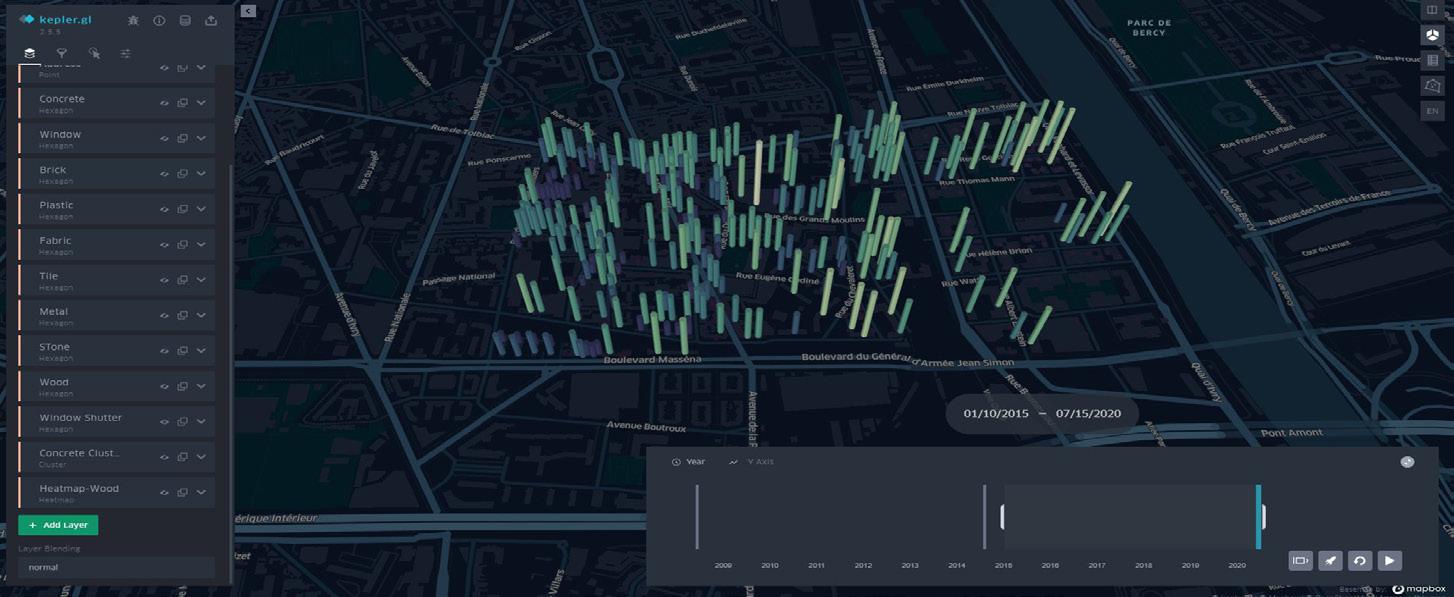
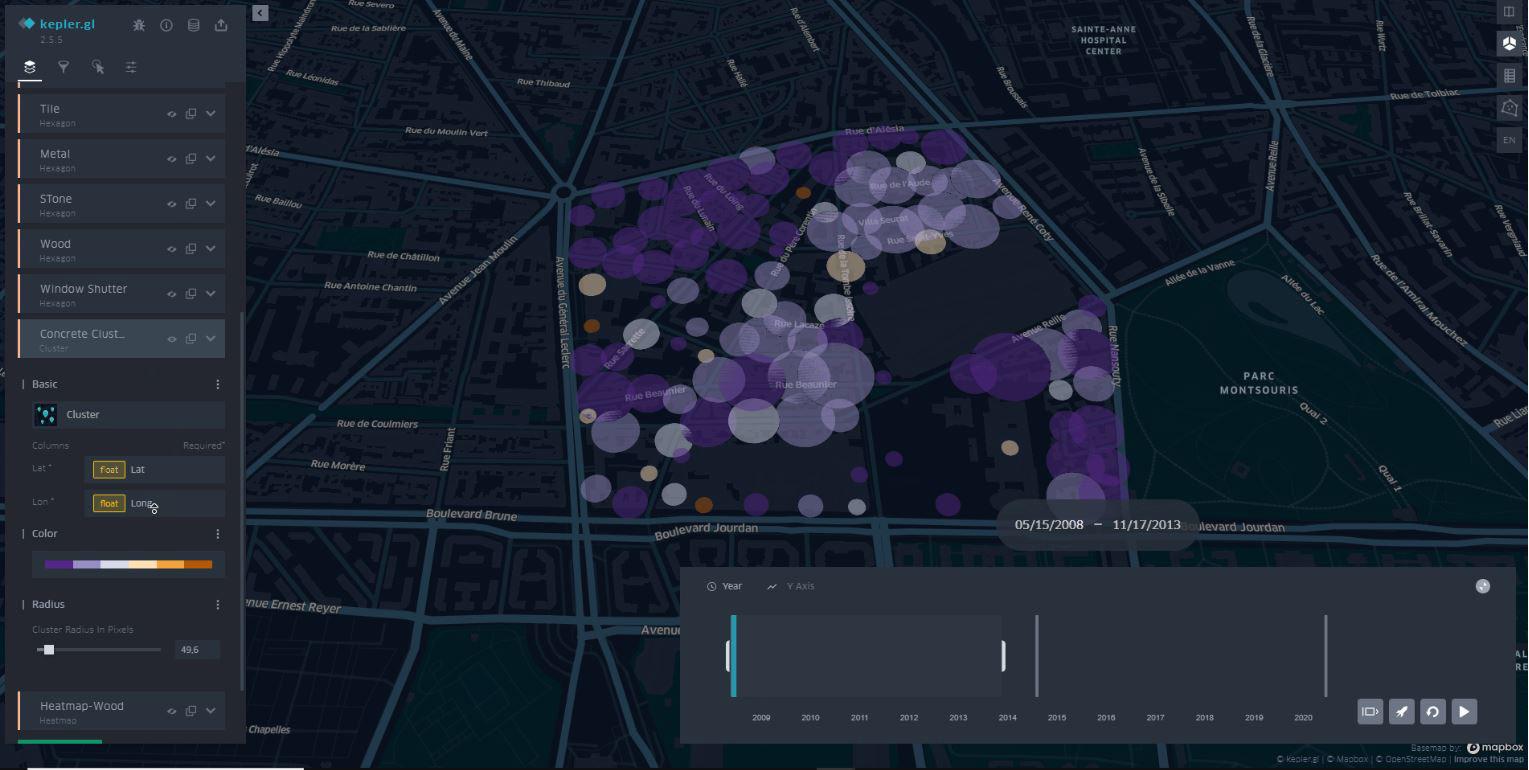
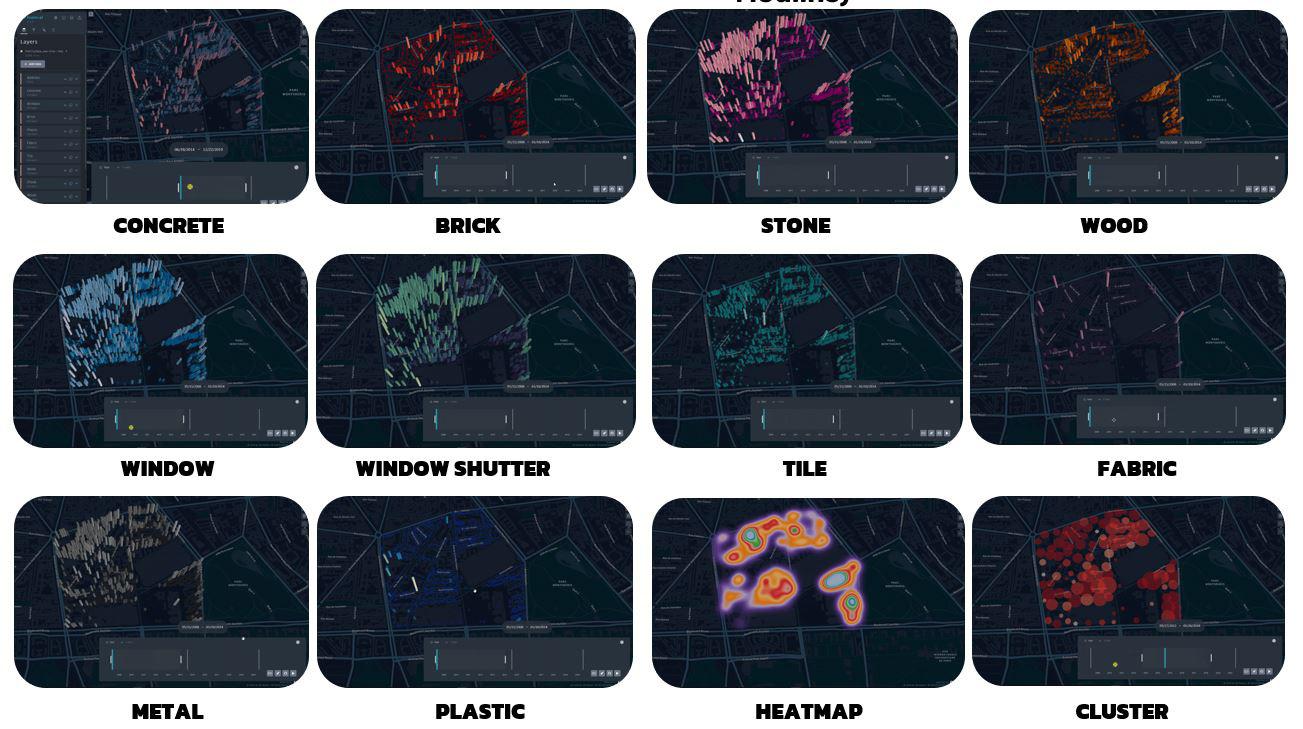
Users can see in cluster mode and change colors. By controlling radius bar, cluster range change
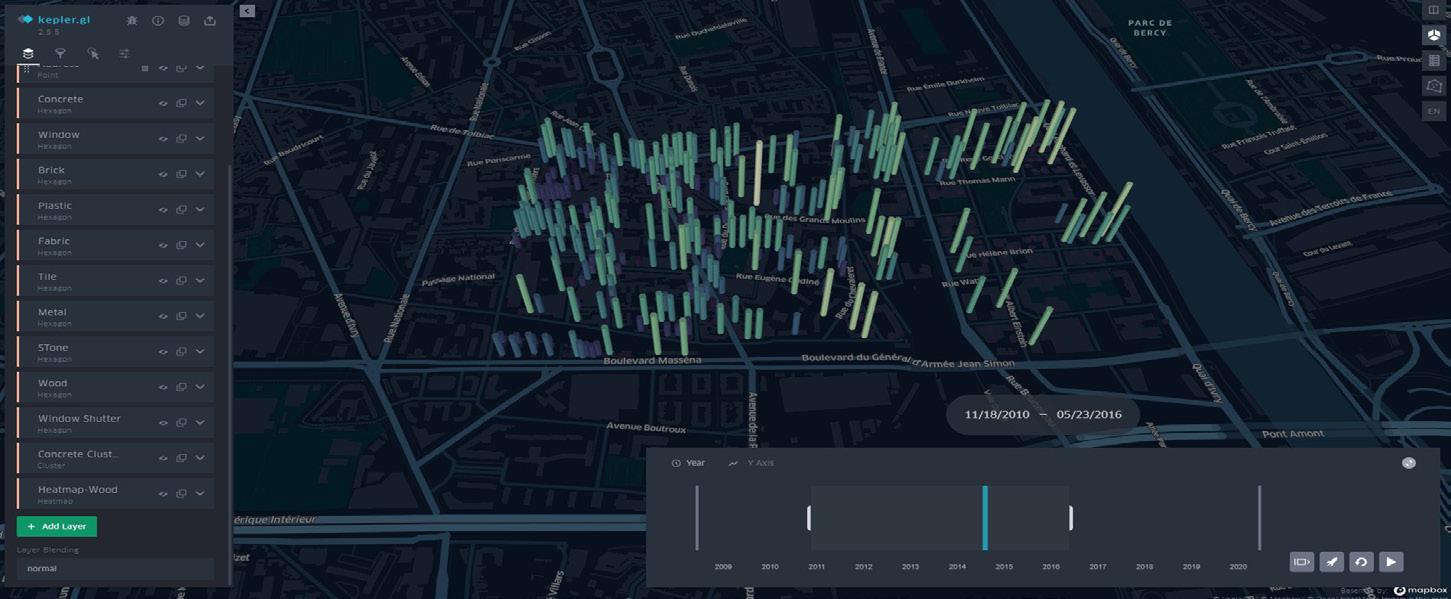
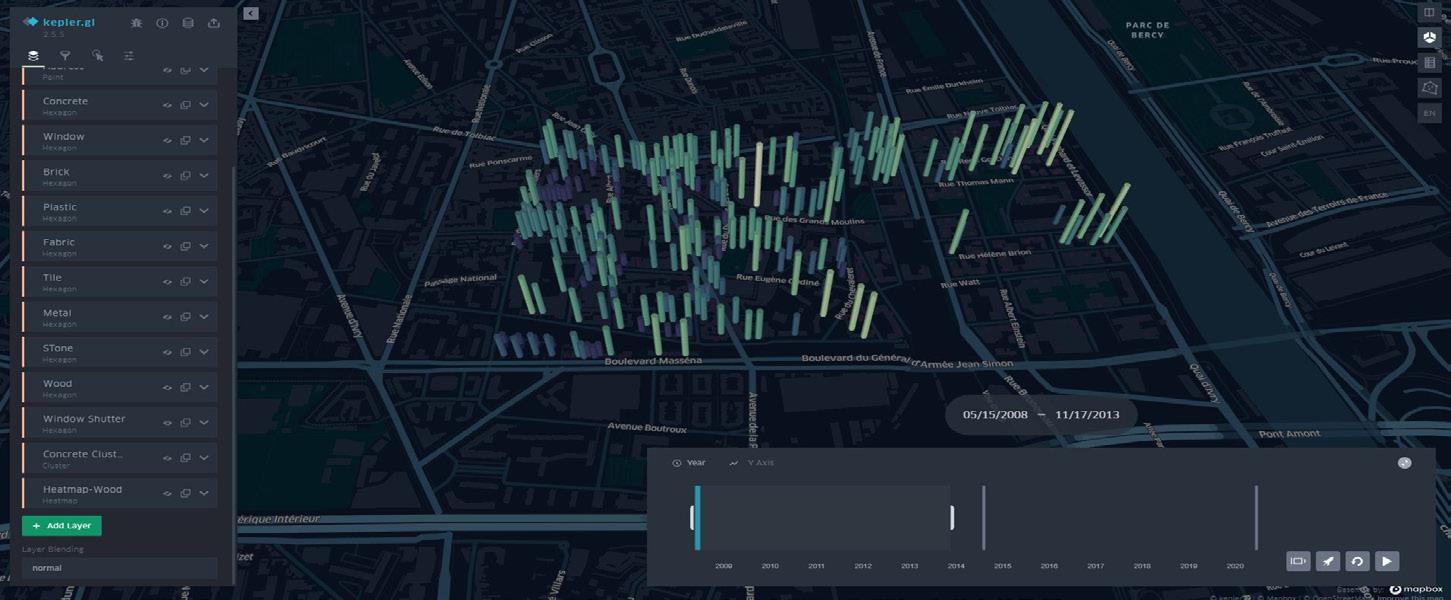
MAT-MAP V.2 (Main Functions)
Example of window shutter by different timelines, 2008, 2014, 2020. The timeline bar can be hided.
MAT-MAP V.2 (13th Borough)
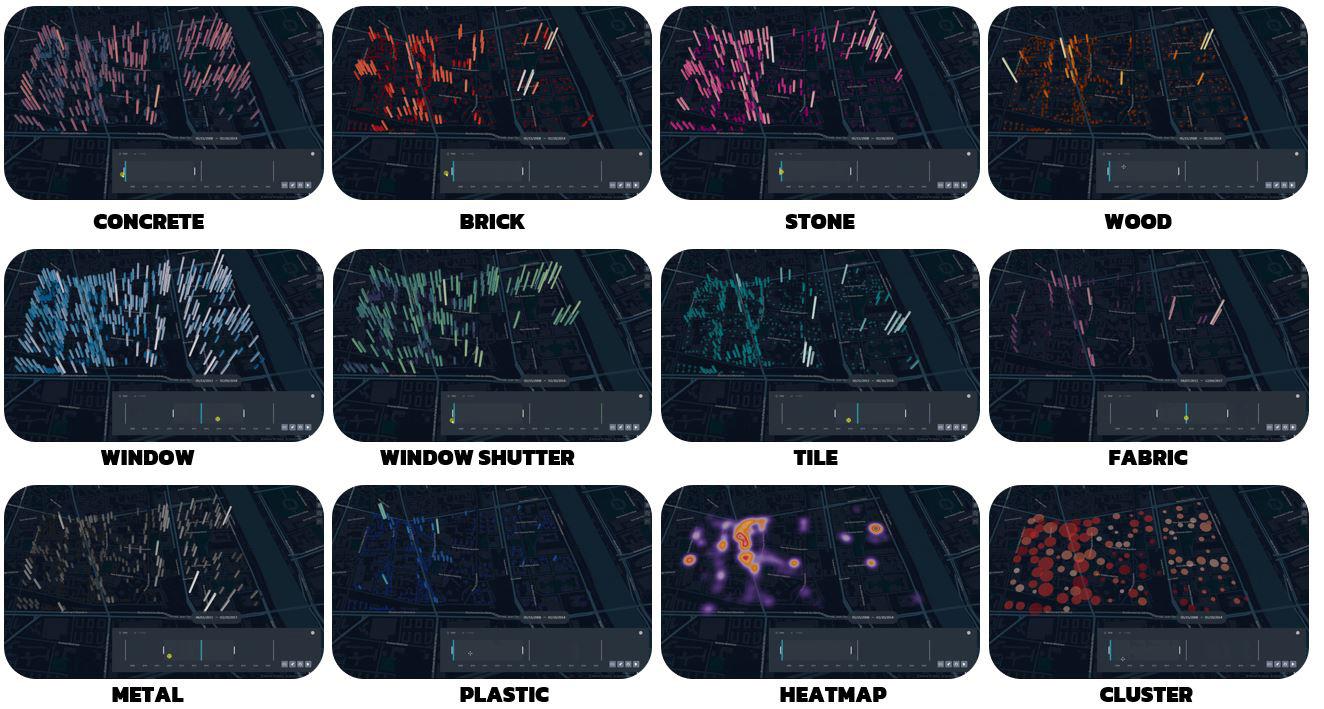
V.2 (14th Borough)
MAT-MAP
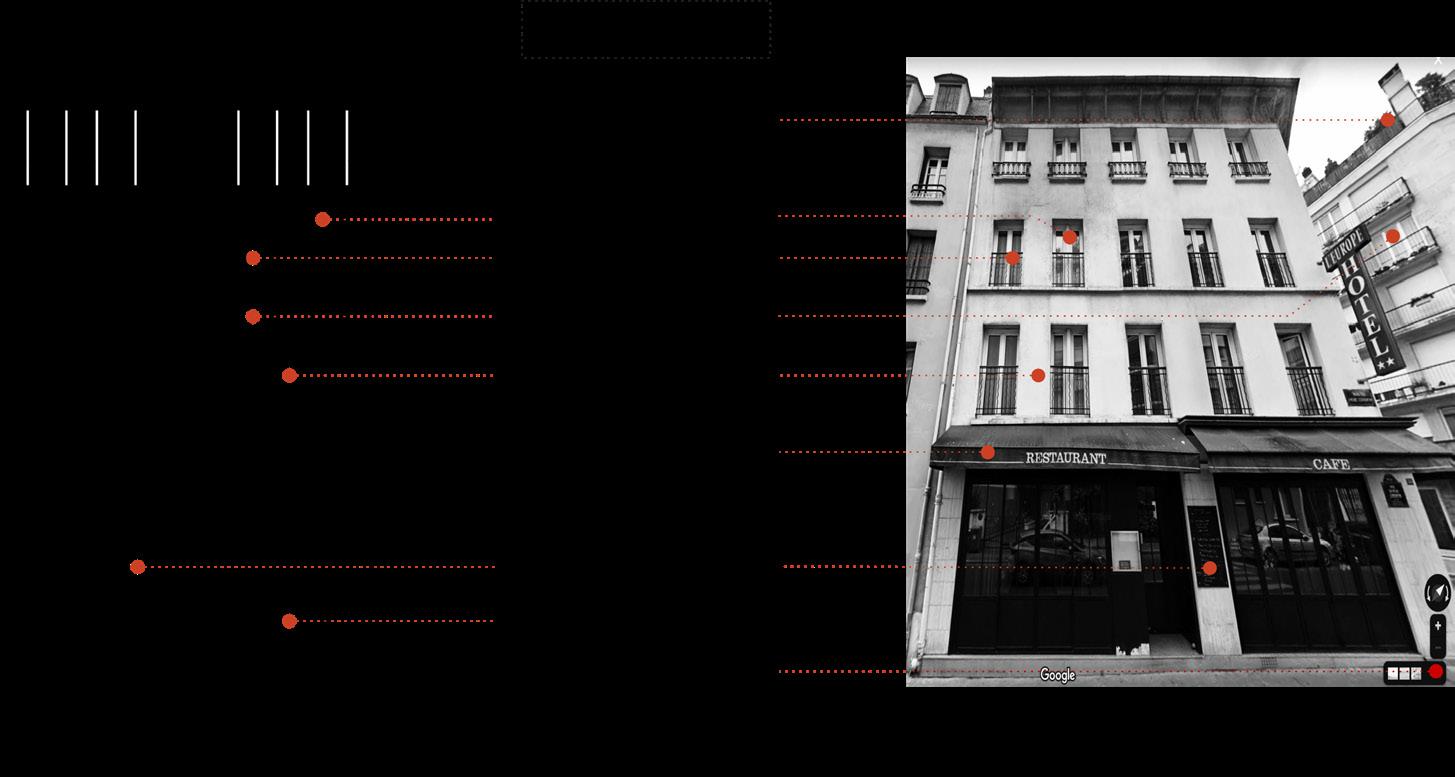
It was kind of fast to using images from Google Street map. But there are few issues to resolve. First of all, it would be a more confidential data map if we could have exact quantities of existing building materials. Second, since the Google Street Map takes photos near the street, it is hard to get building data in the middle of a block (red pointed circle). How can we detect or get building information about an entire building?
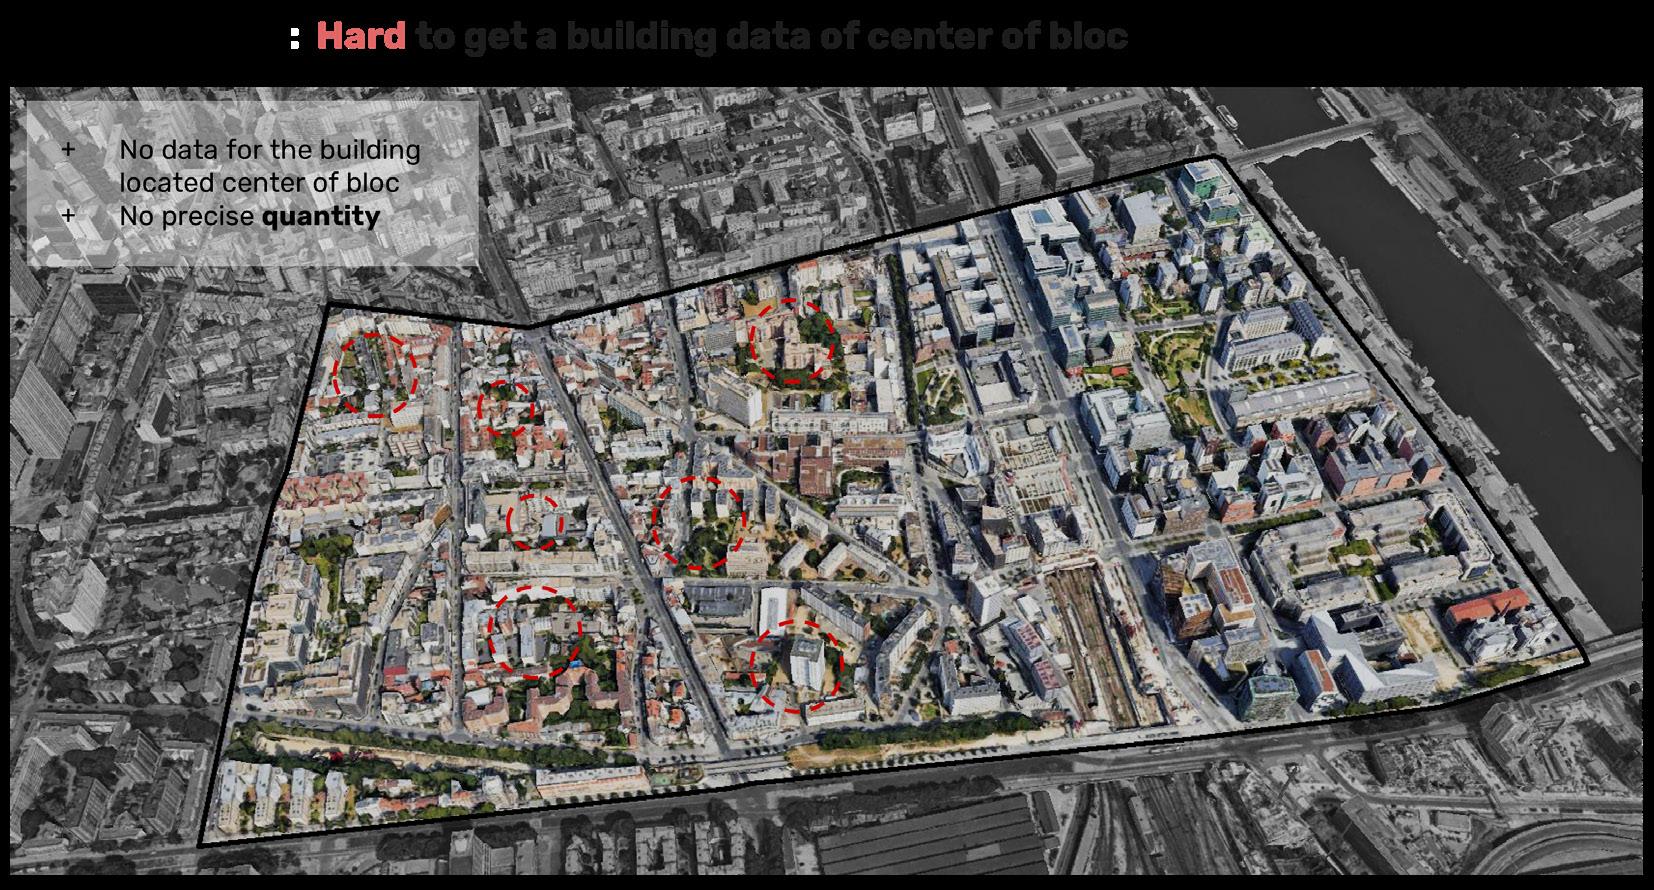
EVALUATION


Bibliography
1 https://ec.europa.eu/eurostat/statistics-explained/index.php?title=File:Waste_generation_by_economic_activities_and_households,_EU-27,_2018_(%25_share_of_total_waste).png&oldid=526878
https://www. mdpi.com/
https://towardsdatascience.com/
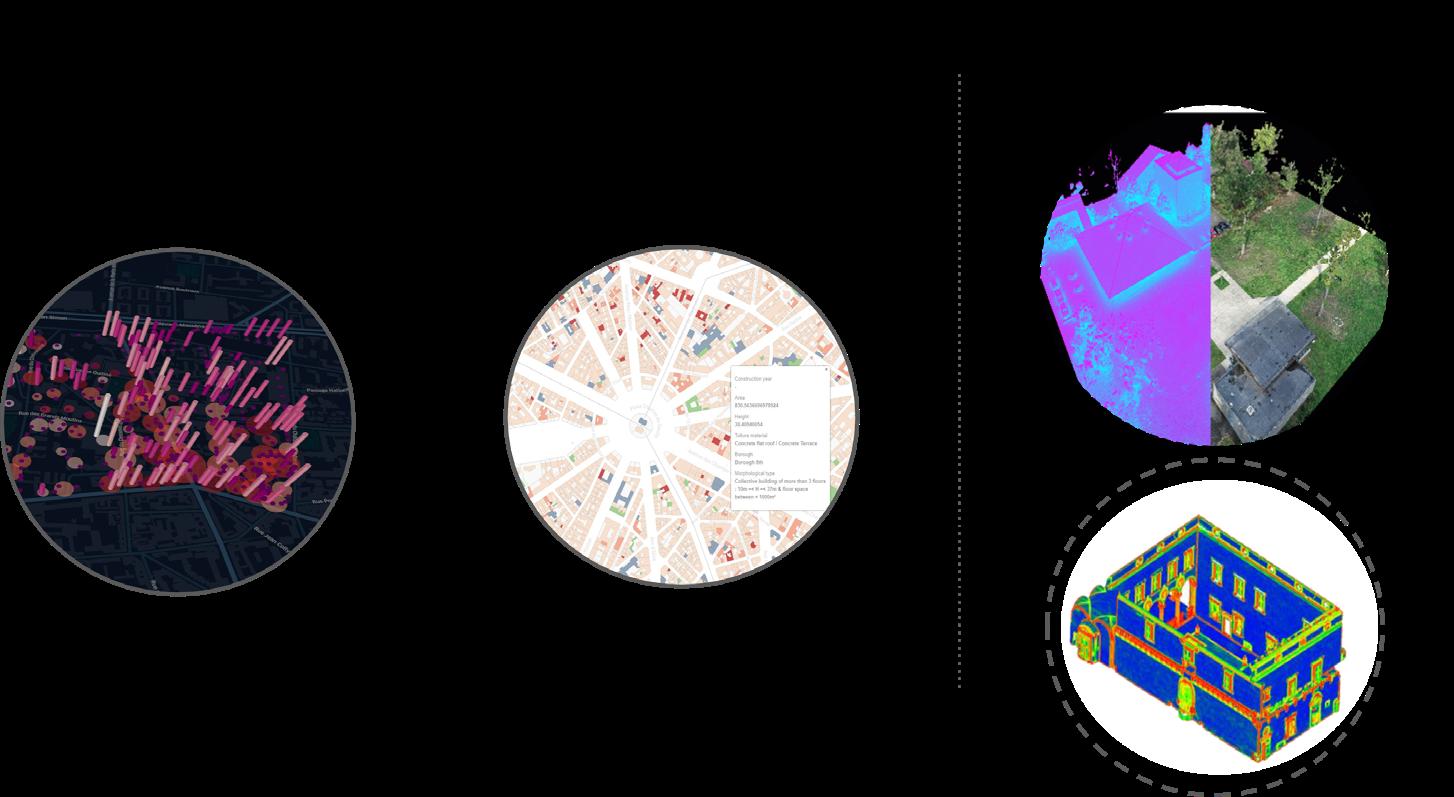
Data generation was the tricky part in this project. The existing data of Paris had limited material information. Generating data with the Yolo object detection has a great advantage of accuracy and speed. However, perspective view point in the Google Street Maps and unclearance of material, photo quality disturb the precision of the detection. In my opinion, the 3D point cloud scanning with drone and object labeling for classification could be another method to improve those problems. Disadvantage of this method is the complexity of data treatment and expensive equipements. On the other hand, this project can also be developed with a digital twin for future construction building. Since the digital twin model has a 3D model, the quantity of all of the material and tracking material recycling or treatment are possible.
2 <Catalogue of Construction Products with Recycled Content from Construction and Demolition Waste>, T Pavlů, J Pešta, M Volf and A Lupíšek, University Centre for Energy Efficient Buildings of Technical University in Prague, Třinecká 1024, Buštěhrad, Czech Republic
3 <Catalogue of Construction Products with Recycled Content from Construction and Demolition Waste>, T Pavlů, J Pešta, M Volf and A Lupíšek, University Centre for Energy Efficient Buildings of Technical University in Prague, Třinecká 1024, Buštěhrad, Czech Republic
4, 5 Construction & Demolition Waste Recycling Market : https://www.alliedmarketresearch.com/construction-and-demolition-waste-recycling-market-A06246
6 Image sources :
- architecture image : https://tomorrow.city/a/transparent-wood-building-material
- logistic : http://southwestlogistics.in/
- constuction industry : https://www.build-review.com/2018-major-changes-for-the-construction-industry/
https://news.seoul.go.kr/env/archives/512074
https://www.metabolic.nl/news/urban-mining-and-circular-construction/
European Commision - europa.eu
https://www.alliedmarketresearch.com/construction-and-demolition-waste-recycling-market-A06246 http://circularconstruction.eu/documents/
https://komptechamericas.com/industry-leader-insights-construction-demolition-recycling-association/ https://www.france24.com/en/20200221-down-earth-building-industry-france-deconstruction-waste-notwant-not
https://www.mdpi.com/2220-9964/9/6/379/htm
https://towardsdatascience.com/guide-to-real-time-visualisation-of-massive-3d-point-clouds-in-python-ea6f00241ee0
https://www.cdrecycler.com/article/construction-sector-industry-outlook-2019/
https://www.santafenewmexican.com/news/local_news/final-verdict-delivered-for-old-courthouse-demolition/article_ba9ca033-2683-507e-a7e2-310e5ab5a8f6.html
+ Recycling material data center in virtual world where user watch materials and see and buy it
+ Testing other method for data generation
+ ‘MAT-MAP’ update as 3D model based map
CONCLUSION NEXT STEPS
https://www.bluelinepm.com/what-does-a-property-management-company-do/?sfw=pass1630332480
https://www.kiverco.com/en/products-solutions/plant-solutions/construction-demolition
https://www.shinbatblog.com/2019/06/shipping-and-logistics-companies.html
https://www.advancedsciencenews.com/scientists-create-living-concrete-from-bacteria-and-sand/
https://www.futurerecycling.com.au/sustainability/circular-economy/
Thank you for all the faculties of the MACAD program at the IAAC, Barcelona, Spain and especially, for Gabriellea Rossi. But also, I appreciate for all the support from my family. 2021.09.27
MASTER IN ADVANCED COMPUTATION FOR ARCHITECTURE AND DESIGN


Thesis Studio MAT-MAP 2021
