A Scalable Workflow For Building Reconstruction And Window Detection For Urban Building Energy Modeling
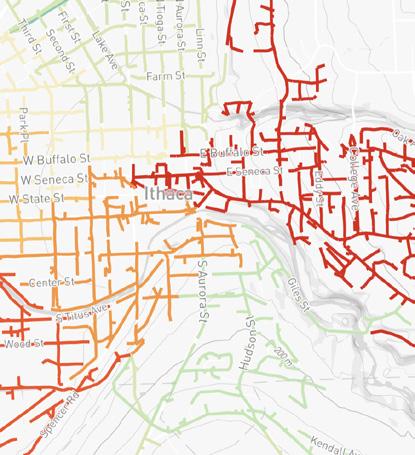
Urban Building Decarbonization Map
ENABLING RAPID AND DYNAMIC COMPARISONS OF DECARBONIZATION STRATEGIES
V1: Individual Work / V2: Collaboration with Nick Cassab
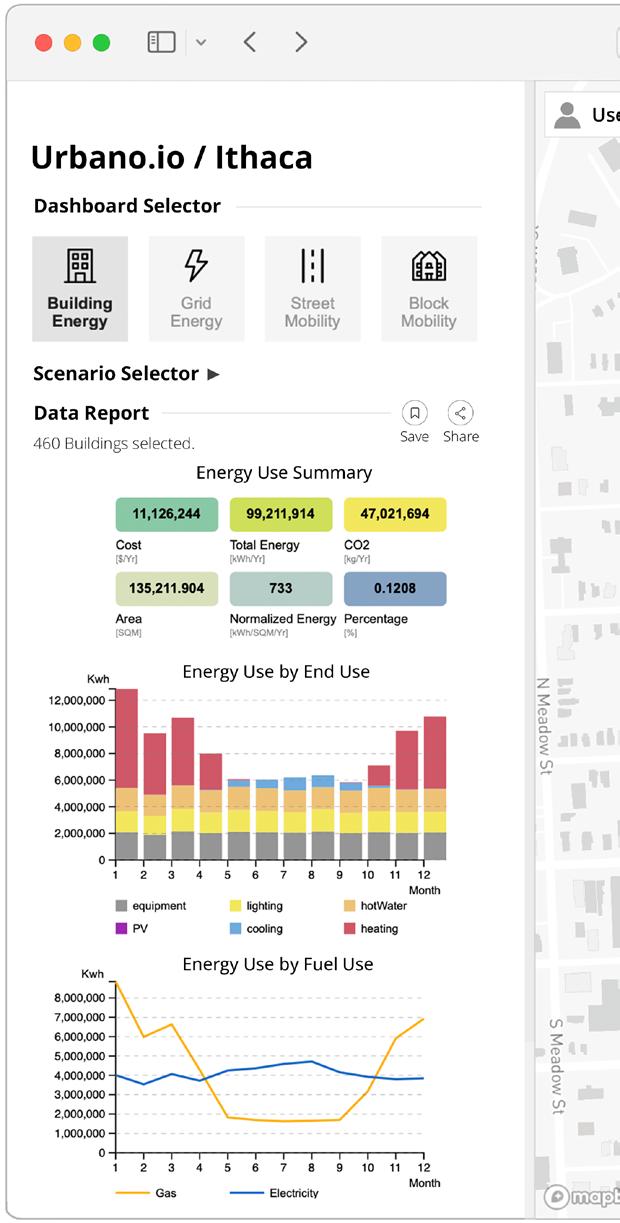
This project involved developing a web-based interactive map for the Town of Ithaca and Avangrid to support the ‘Green New Deal’ initiative, enabling rapid comparisons of decarbonization strategies. It featured dynamic visualizations to explore energy usage scenarios and a data dashboard for efficient storage and management. The platform incorporated iterative UX research and UI design to balance functionality with aesthetics, ensuring a user-friendly experience. By providing clear insights into energy scenarios, the project enhanced decision-making processes and advanced local sustainability efforts.
WORKFLOW
Graphical Data Visualization Geospatial Data Visualization
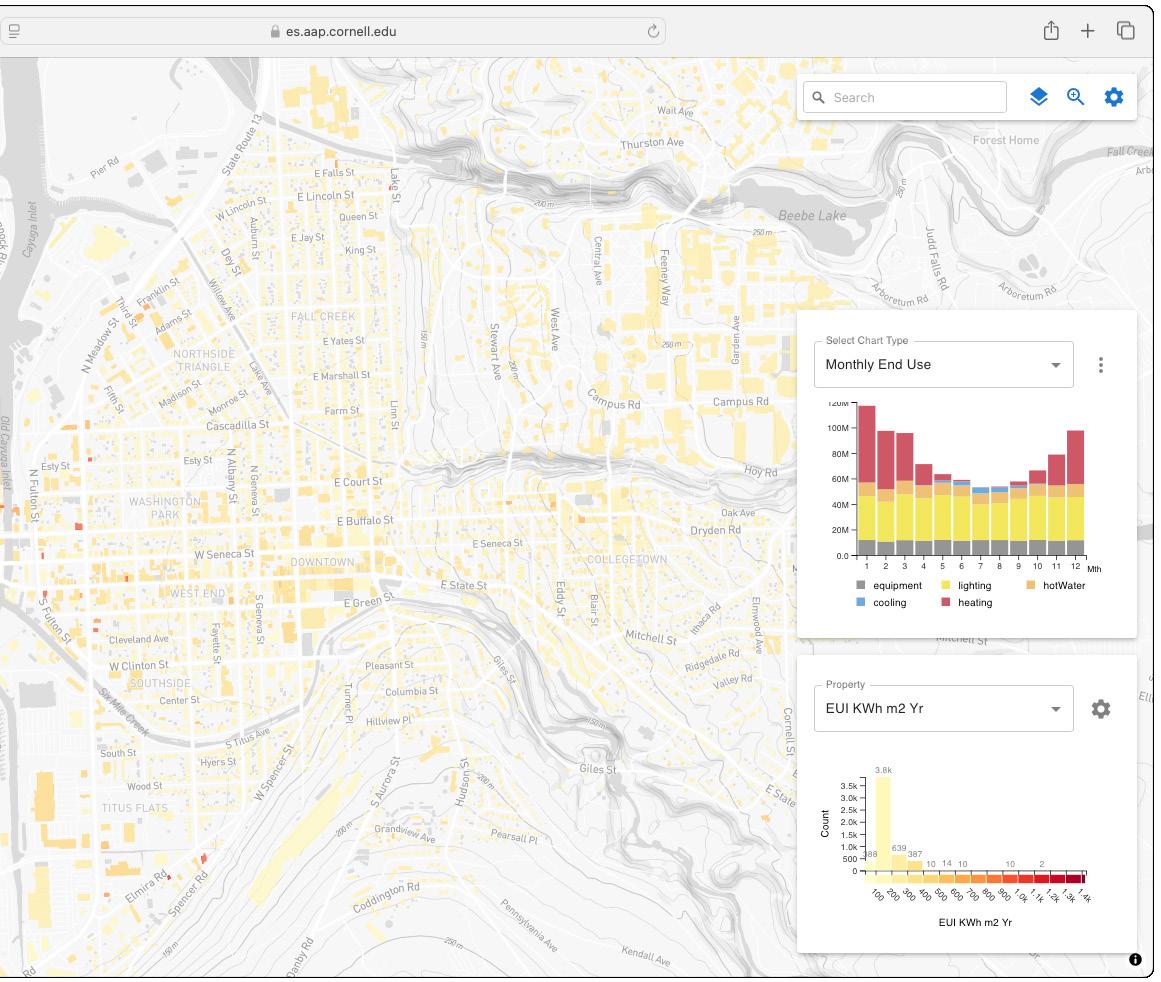
DATA INTERACTION
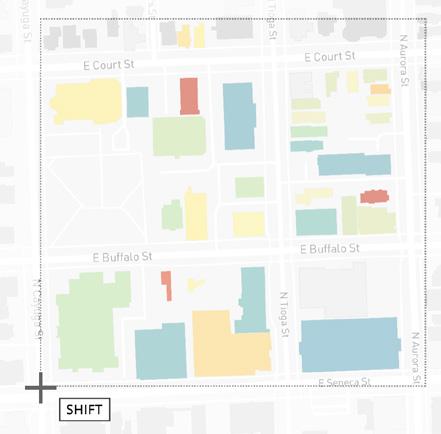
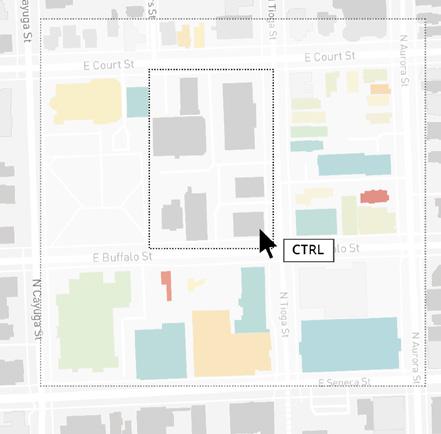
User interaction relies on selection: manually selecting objects geospatially or using filters to specify data ranges. Without selection, graphs display citywide data; with selection, they show specific data through diagrams. Filter selection focuses on objects meeting chosen criteria, enabling precise, data-driven exploration without requiring spatial interaction.
DATA CALIBRATION
Compared to traditional methods like directly reading the GeoJSON file or using text-based tools, visual examination of the map, legend, and graphs proves to be a more efficient way of identifying potential errors.
Therefore, user can upload a GeoJSON file into our dataset, automatically transforming it into graphical and geospatial visualizations for calibration purposes.
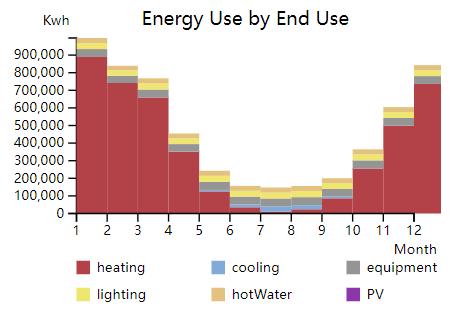
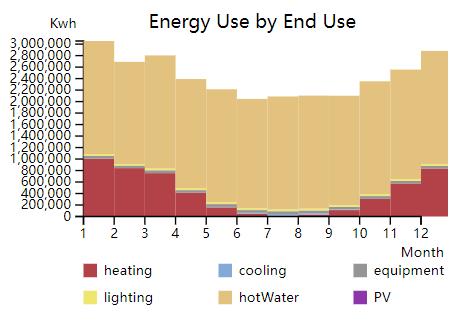
Uncommon “hotWater” values is observed in graphs, which indicates the potential mistake in energy template development.
GeoJSON
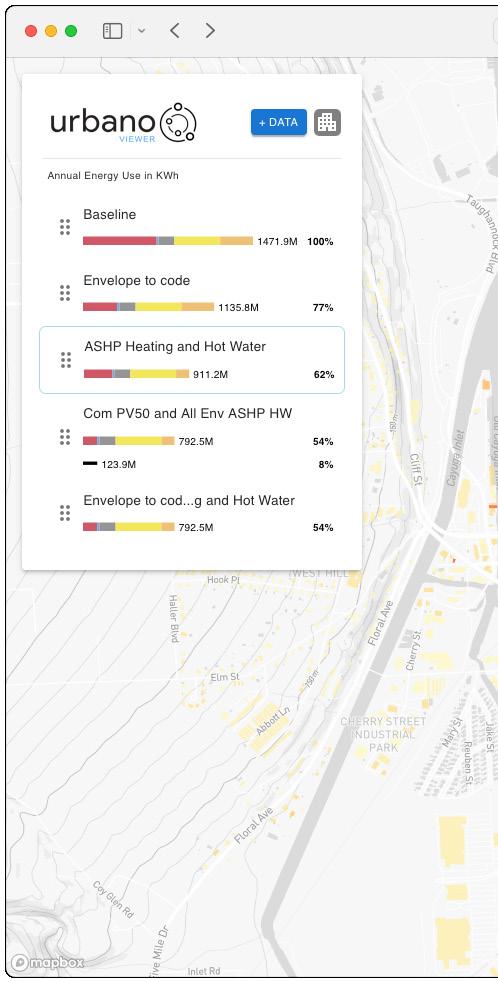
DATA COMPARISON
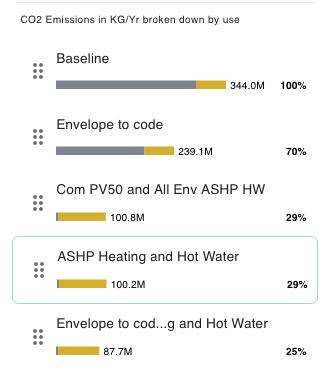
If user is interested in the CO2 Emission Distribution
If user is interested in the Energy End Use Breakdown
When importing multiple urban datasets, users can choose to explore the details of individual datasets or analyze multiple datasets together. Each dataset is reformatted and displayed across different dashboards for enhanced clarity.
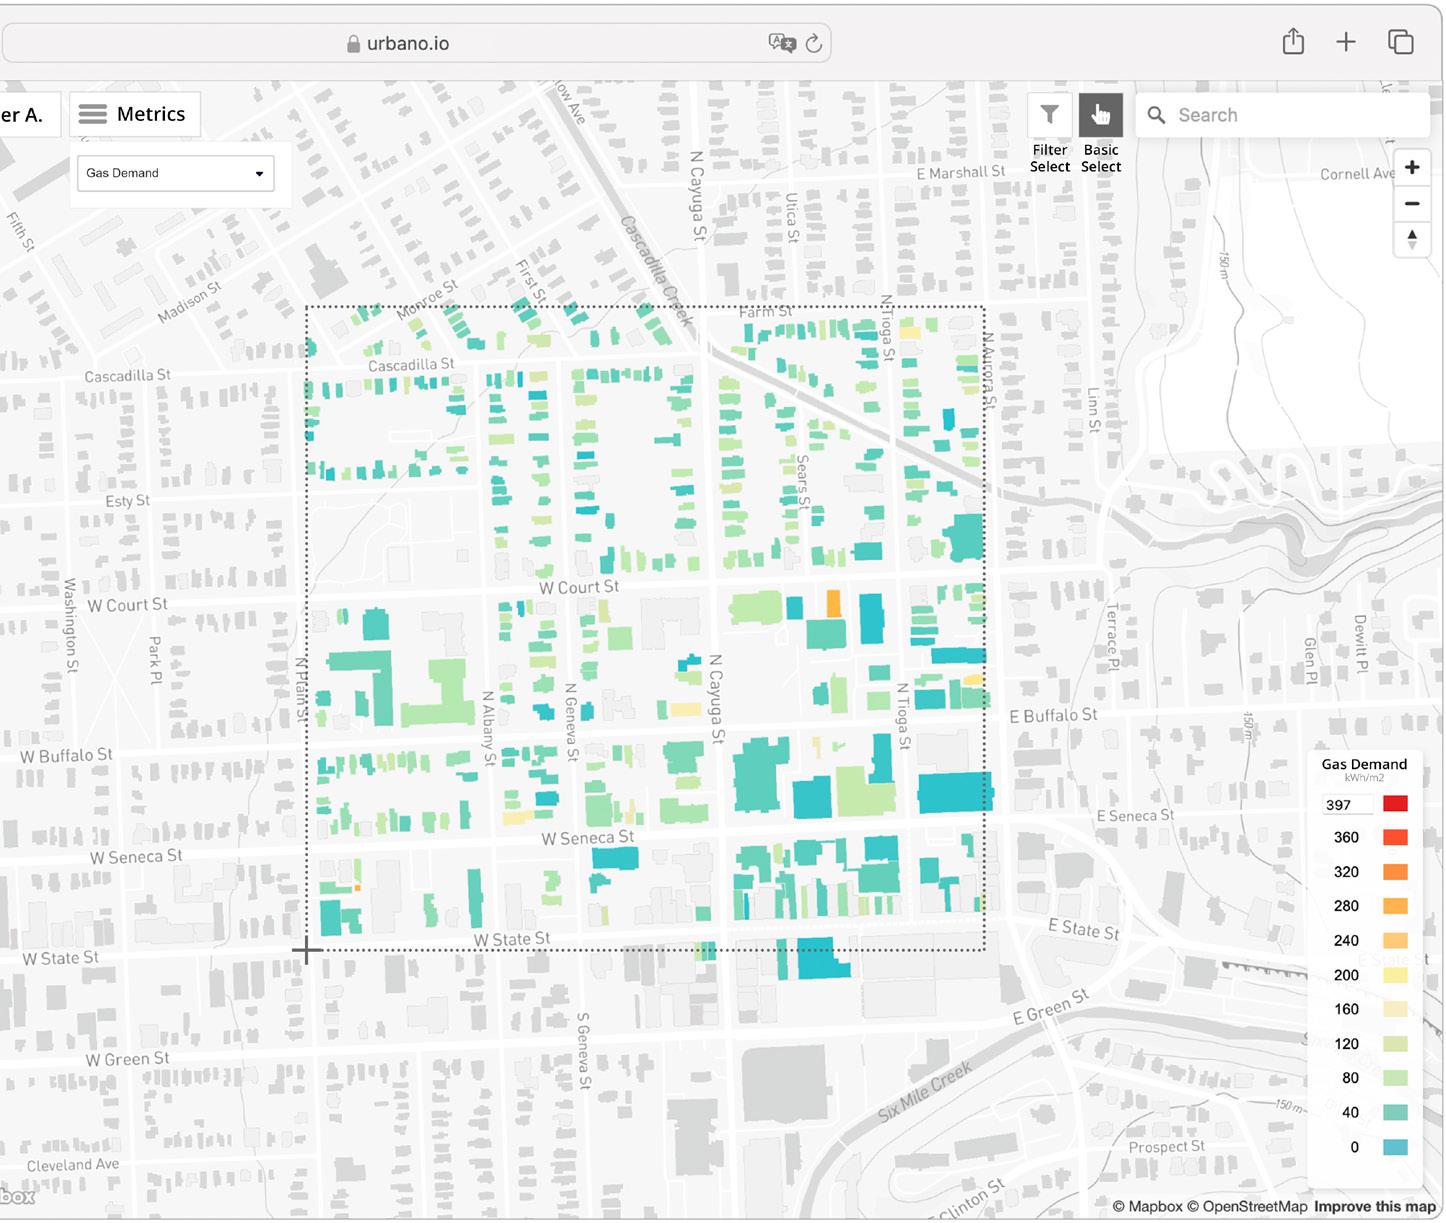
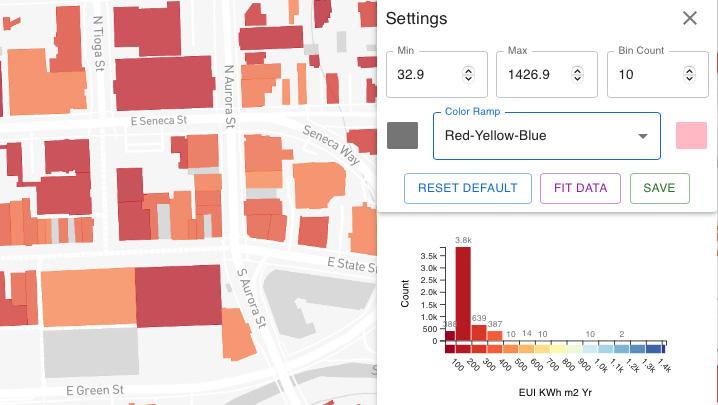
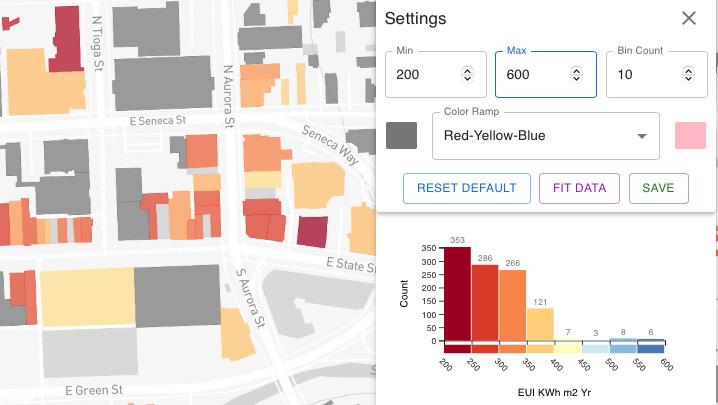
DATA FILTRATION & DYNAMIC LEGEND
The value range of the selected dataset is analyzed, and a histogram legend dynamically generated. Users can adjust minimum and maximum values to focus on specific data ranges, streamlining exploration and enhancing insights within single or multiple datasets.
How different maximum value settings influence the data visualization.
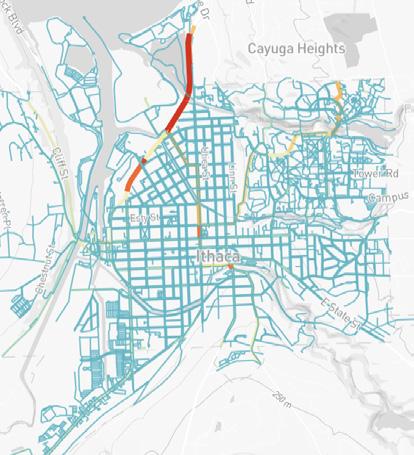
VISUALIZATION ALTERNATIVE
Various types of city data visualizations are available in the map, including mobility data presented on streets and electricity data displayed on grid lines. Furthermore, alternative visualization types, such as heatmaps and cluster points, could be utilized to provide a comprehensive analysis of the data from different zoom levels and perspective.
Scan-to-Model Indoor Comfort
Viewer
SIMPLIFYING THE PATH TO COMFORT-FOCUSED INDOOR SIMULATIONS
Group Project for AEC TECH Hackathon 2024
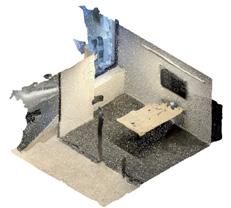
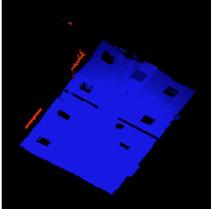
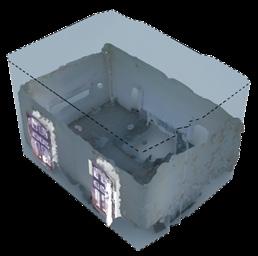
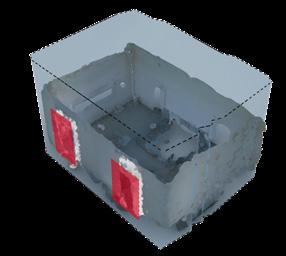
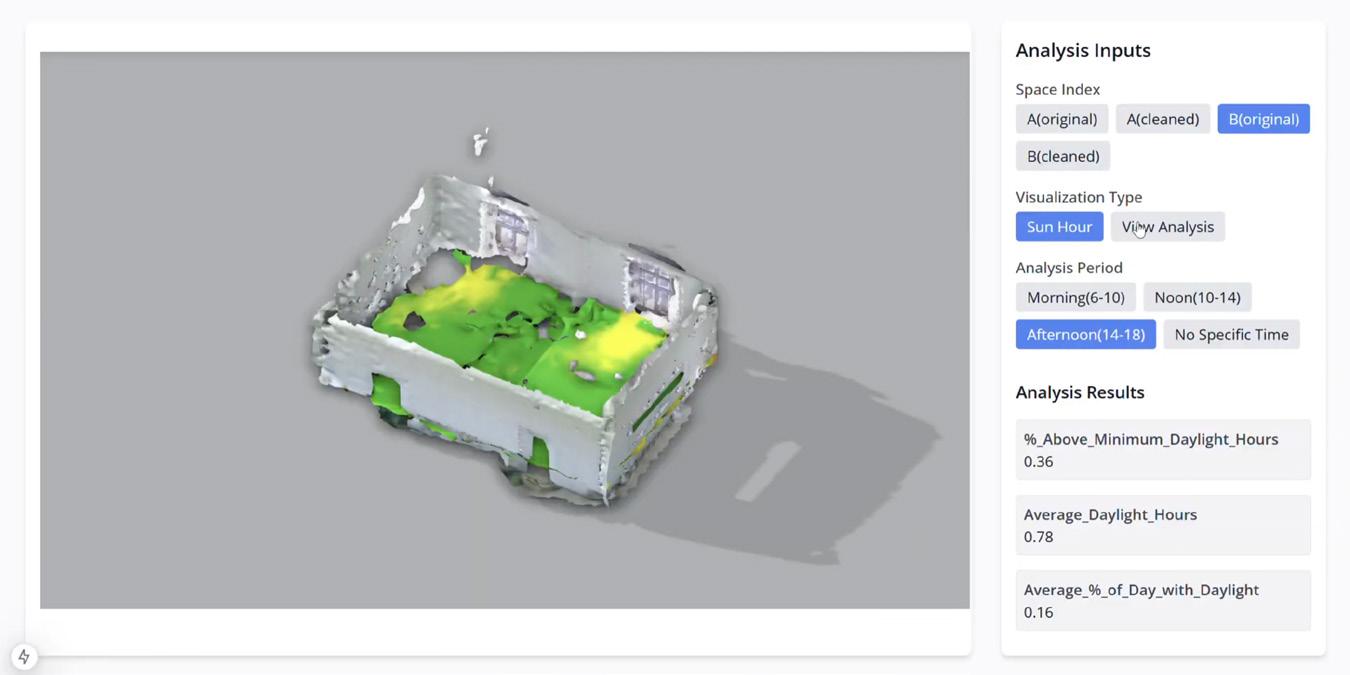
This project converts iPhone-scanned raw point cloud data into editable 3D models for advanced indoor comfort analysis. Users scan their homes, upload the data to a server, and receive 3D models enhanced with simulations, such as daylight analysis across various time periods.
The platform aims to integrates scanning, modeling, and analysis into a seamless workflow, with results displayed on a user-friendly web interface. It aims to empower residents with an accessible tool for improving indoor living conditions through quick digital twin exploration, making indoor comfort insights more actionable and personalized.
DATA PROCESSING
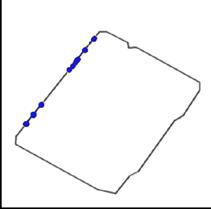
Phone-scanned Point Cloud Data
Rhino & Grasshopper OpenCV Open3D
Ladybug Tools
Shape Diver & Next.js
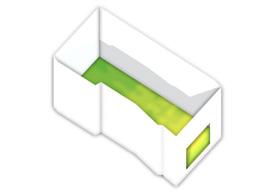
Cleaned 3D Model with Interactive Indoor Comfort Analysis Results
RESULTS
Phone-scanned
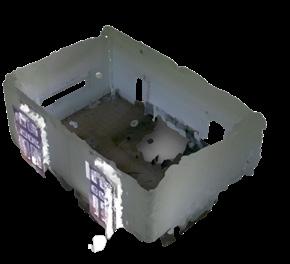
Point Cloud Model
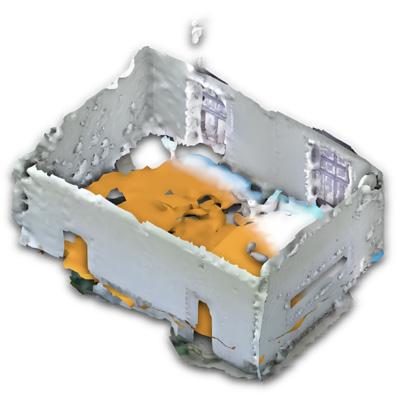
Direct Sun Hour Analysis
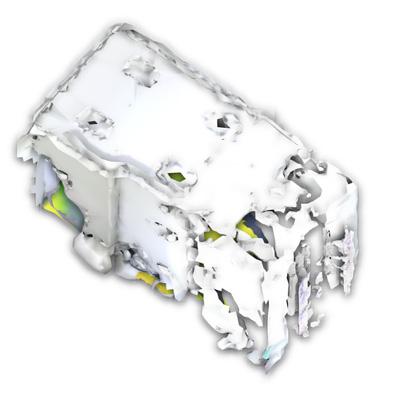
View Analysis
Urban Outdoor Comfort Dashboard
STREAMLINING SCENARIO COMAPRISION FOR EARLY STAGE URBAN DESIGN
Individual Work
This project streamlines early-stage urban design by creating a dashboard system for evaluating outdoor comfort across various design scenarios. Designers often explore combinations of building elements, but analyzing each variation is time-consuming and limits efficient decision-making.
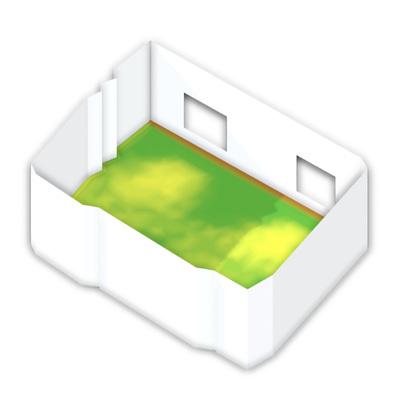
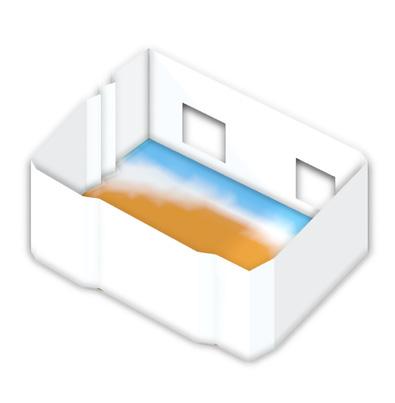
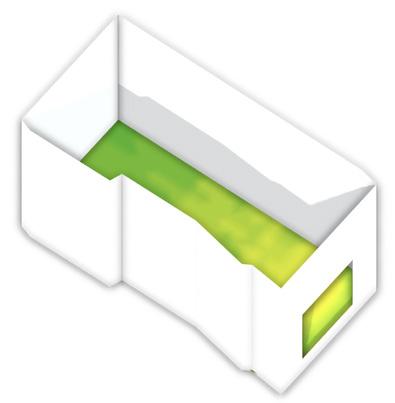
Our dashboard preruns all possible scenarios, enabling users to compare and select optimal designs without delays. Results are presented through static graph series and a dynamic model viewer. By simplifying data organization and comparison, this tool empowers designers to make informed, efficient, and sustainability-focused decisions for urban planning.
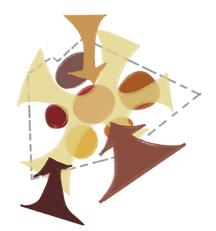
MOTIVATION
WORKFLOW
Gather Urban Design Input Request from Design Team meeting
Run Analysis Series in Grasshopper through Ladybug Tools and Colibri
Refine the Design Input Request & Enlarge dataset
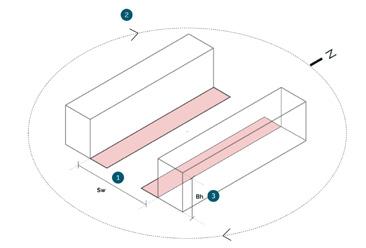
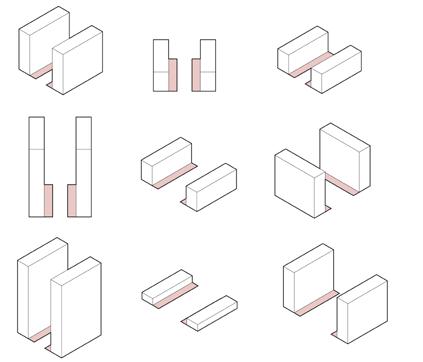
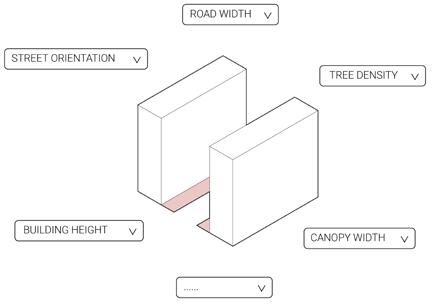
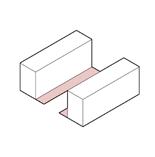
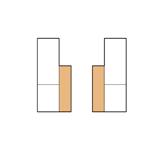
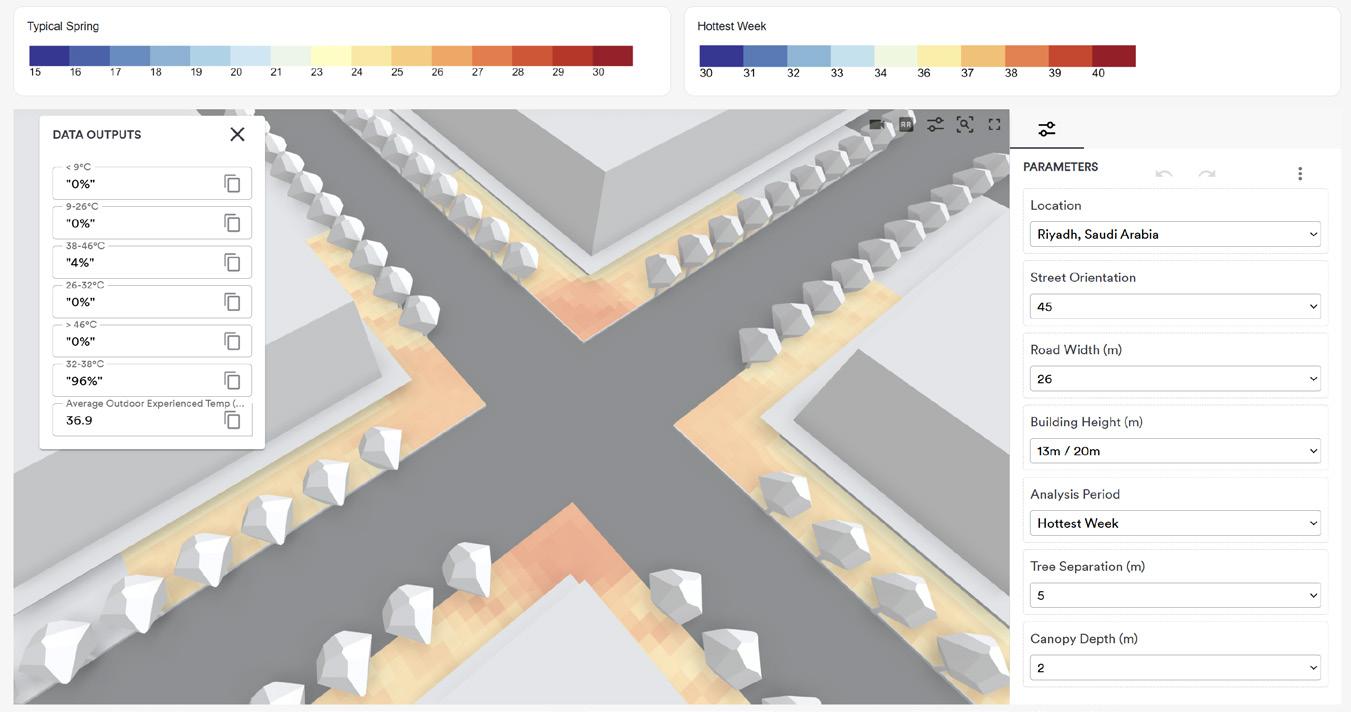
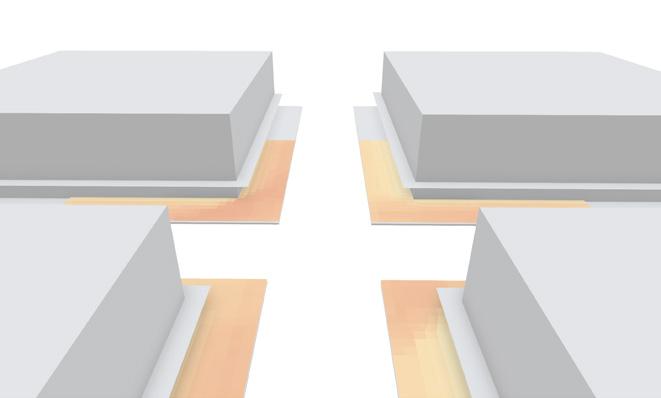
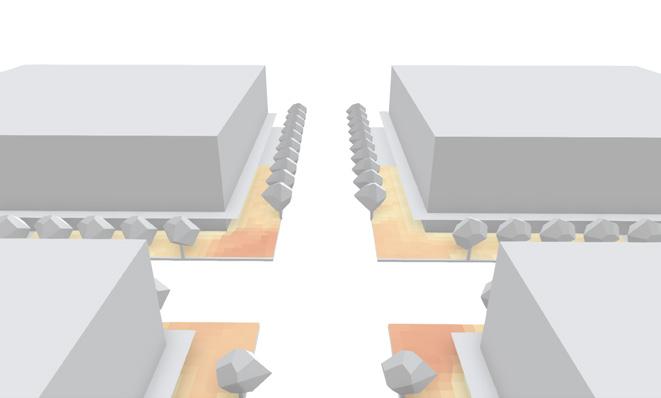
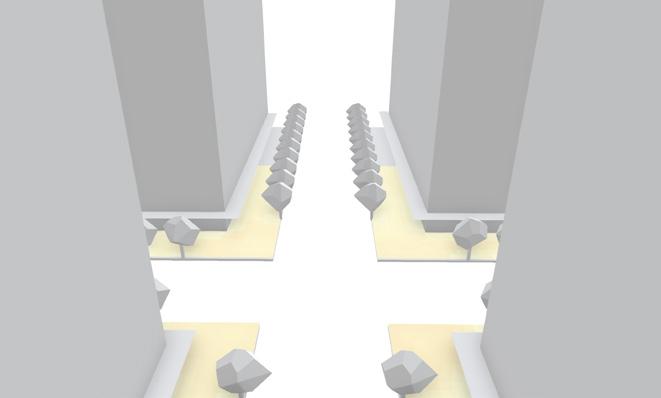
Urban designers often explore various combinations of street width, orientation, building height, and features like canopies or trees to optimize outdoor experience.
However, conducting sustainability analyses for every variation is time-intensive, complicating data management and comparison, limiting optimal scenario identification.
Therefore, our dashboard preruns all scenarios, allowing users to rapidly compare and select optimal designs through static graphs and dynamic model viewers.
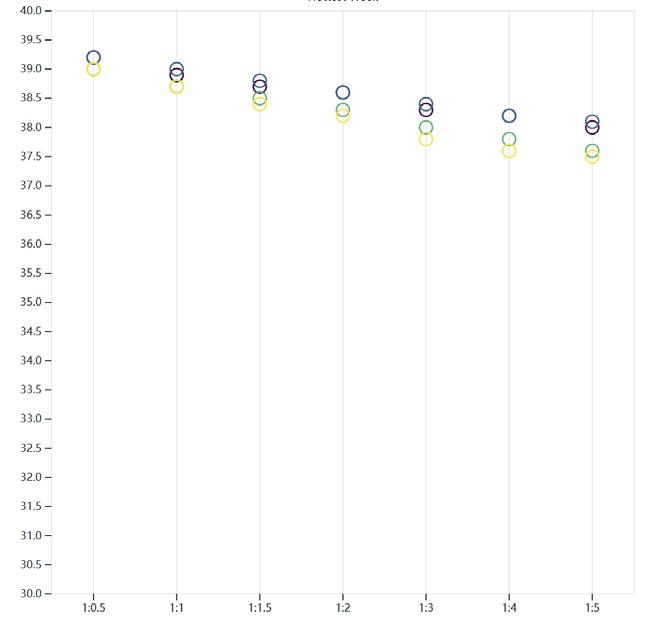
DASHBOARD: SUMMARY GRAPHS
Avg. Experienced Temp(°c)
View Analysis Result with Interactive Graph / Geometry Viewer through ShapeDiver & Observable Framework
Street Orientation
Road Width: Building Height
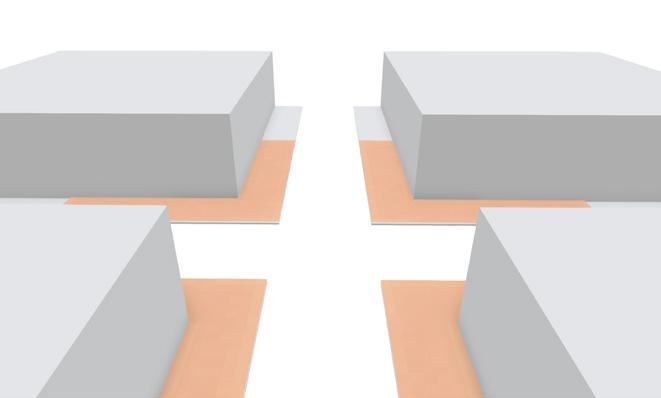
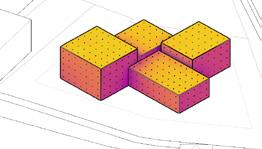
USAGE SAMPLES
Scenario 0: Base Case
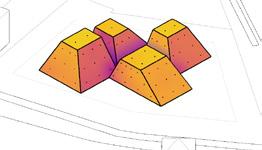
Scenario 1: With Canopy
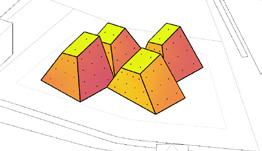
Scenario 3: With Canopy + Tree
Scenario 4: Taller Building With Canopy + Tree
Facade Scanner
A Scalable Workflow For Building Reconstruction And Window Detection For Urban Building Energy Modeling Group Work with Ann Ren, Jiayu Su Instructor: Timur Dogan
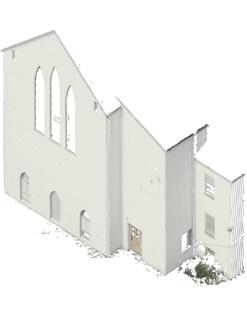
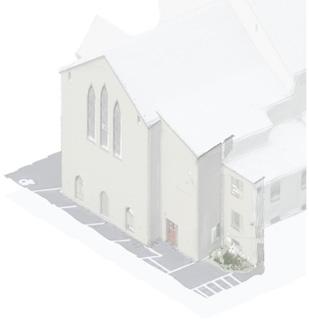
Creating energy models for neighborhoods and cities is vital for decarbonization strategies, yet urban-scale building geometries and parameters like window-to-wall ratio (WWR) are often unavailable. To address this, we introduce a scalable, automated façade reconstruction and window detection method using drone-captured photogrammetry model. Our procedural framework combines a custom-trained image segmentation model with post-segmentation optimization and a large-scale vision model. The workflow has been tested on diverse urban environments, demonstrating reliable performance for building geometry reconstruction in Urban Building Energy Modeling (UBEM).
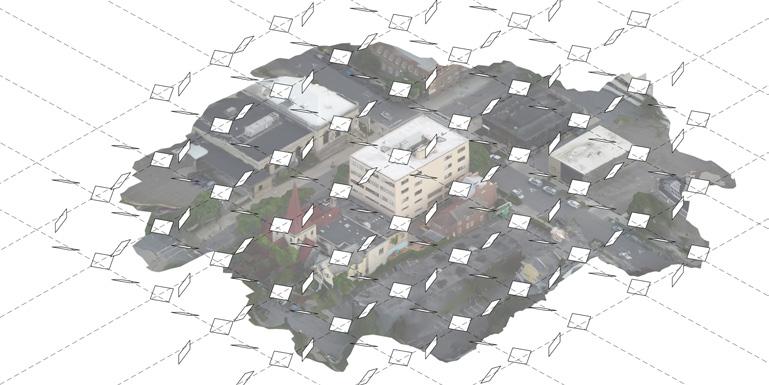
1. Photogrammetry Model Generation
i.Aerial Building Image Capture Using Drones
Drone-captured photogrammetry models outperform open-source urban models in resolution and accuracy, enabling efficient building separation for editing and operations. Using a DJI drone with Pix4D, the automated double-grid flight captures expansive areas, including façades inaccessible from the ground, with perspective accuracy and minimal distortion.
Automated drone flight planning
Drone flights can be planned at various scales, make data collection more efficient and reduce manual work. Using a double-grid capture method ensures accuracy.
Imagery Data Processing
Double-Grid Drone Capture
The collected data is processed as a georeferenced 3D mesh with texture. To cover an area of 10,000 square meters (100×100m), this typically requires 300 images in the format of 5472 × 3648 pixels with 72 ppi.
Photos/videos source -> “dense cloud-mesh-texture” -> photogrammetry model
1. Photogrammetry Model Generation
WORKFLOW
2. Model Optimization and Validation
3. Machine Learning for Window Detection
4. Window-to-Wall Ratio Calculation
Rhino & Grasshopper
TensorFlow
Metashape
2. Model Optimization & Validation
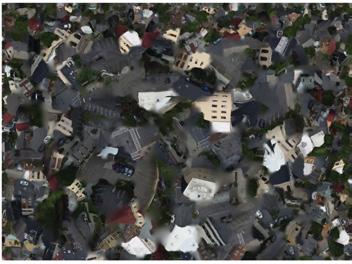
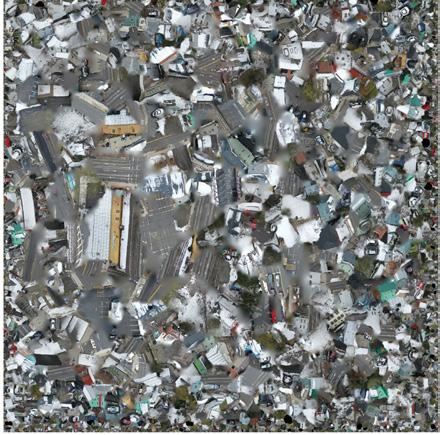
i. Texture Map Optimization
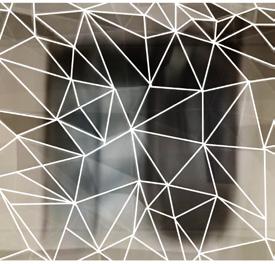
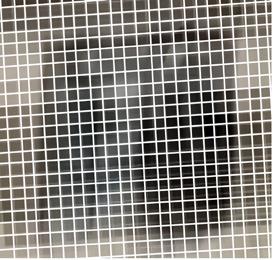
In the original texture map, triangular surfaces are distributed randomly across the model’s surface, resulting in a texture map that appears disordered and lacks structure.
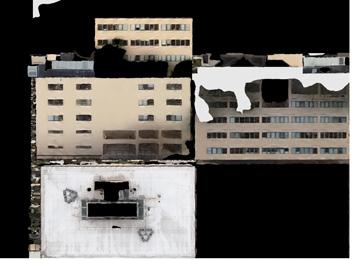
Quad Remesh
Rebuild UV Mapping
Blender Bake New Texture
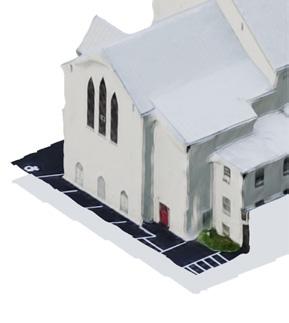
The optimized, evenly-distributed surfaces are easier for future model clearance. The clean structured texture is easier for labeling and machine learning.
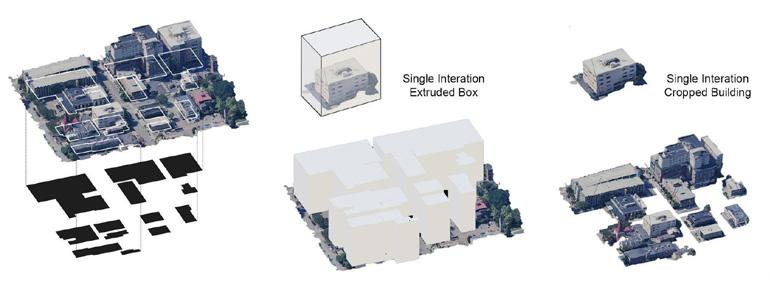
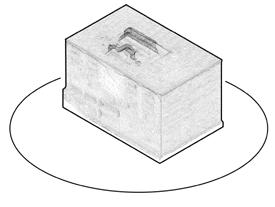
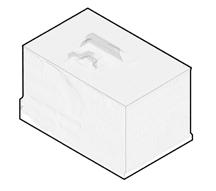
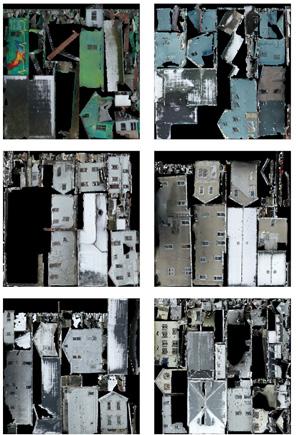
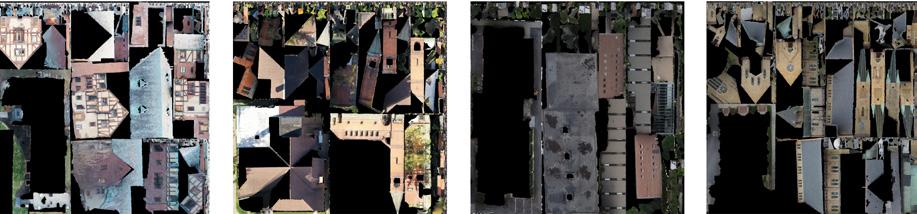
ii. Building Isolation
Unlike other methods that process rectified images of individual facades separately, our approach combines the entire building envelope into a single texture map.
Our drone captures entire building blocks instead of individual buildings, making data collection more efficient. Separating multiple buildings is done using straightforward model isolation components, which enhances the efficiency of our data processing.
iii. Validation through LiDAR-based point cloud
To ensure the accuracy of our photogrammetry models, we conducted verification using a Leica BLK360 laser scanner to capture high-resolution LiDAR point clouds of building façades. This verification process allows us to assess the geometric accuracy of our photogrammetry models and evaluate the overall feasibility of our modeling approach.
Building isolation
Original model with triangular surfaces and unrecognizable texture map
Processed model with evenlydistributed surfaces and readable texture map
Texture Map Optimization
Original texture map of the entire city block
Processed texture maps of each building
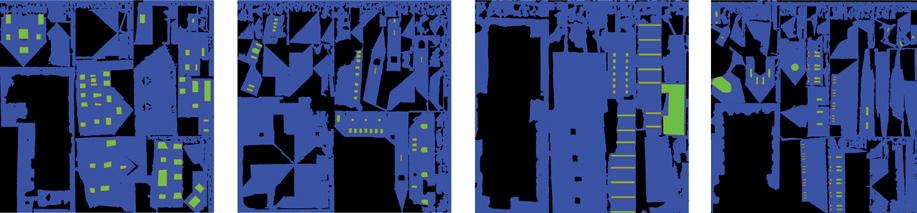
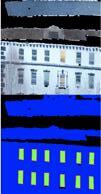
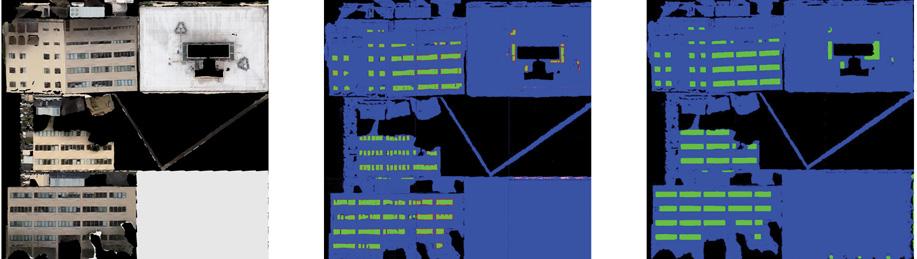
3. Machine Learning for Window Detection
i. Pix2pix Training Data Preparation
We train the pix2pix model using our custom datasets, which consist of pairs:
Input: Building texture maps
Ground Truth: Labeled images
This training equips the model to automatically detect windows in the texture maps by learning the complex image structures and patterns.
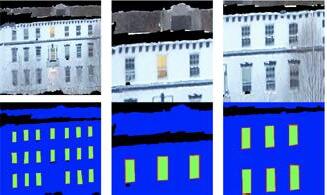
ii. Data Augmentation & cGANs Segmentation
To address the limited original dataset, we use OpenCV to augment our training data. We apply random scaling (1.0 to 3.0) and rotation (0 to 10 degrees) to each image pair, creating 50 variations for each pair.
This boosts the dataset from 45 to 2250 texture map pairs, enhancing our model’s performance and dataset diversity, ultimately improving the machine-learning model’s robustness and accuracy.
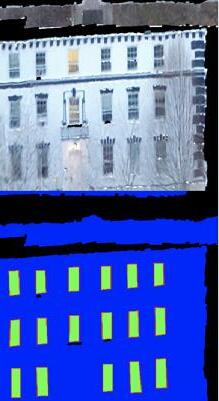
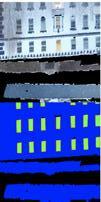
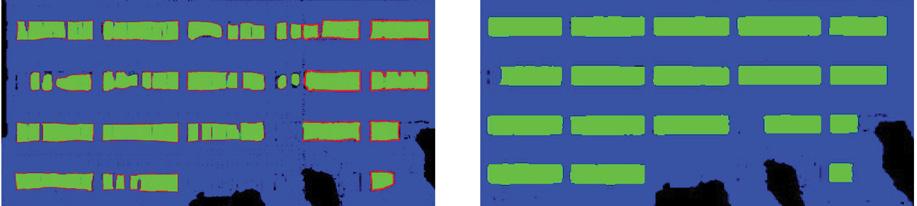
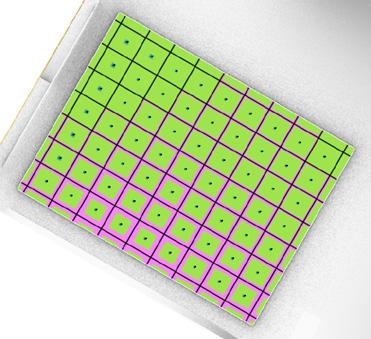
iii. SAM Optimization
While our GAN model identifies window locations in texture maps, it can generate blurry boundaries due to limited training data.
To address this with effciency, we use the Segment Anything Model (SAM) without additional training. SAM optimizes segmentation using GAN-identified window bounding boxes, compensating for the GAN’s limitations in edge definition.
Scaling (1.0 to 3.0)
Rotation (0 to 10 degrees)
Detail of SAM Image
Detail of Pix2Pix image Original Texture Map
Original Texture Map
Labeled Image for Training Window Window Edge
1 original dataset
50 distinct datasets
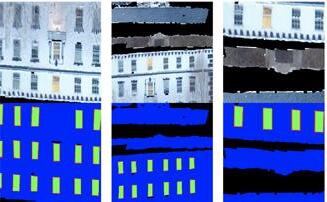
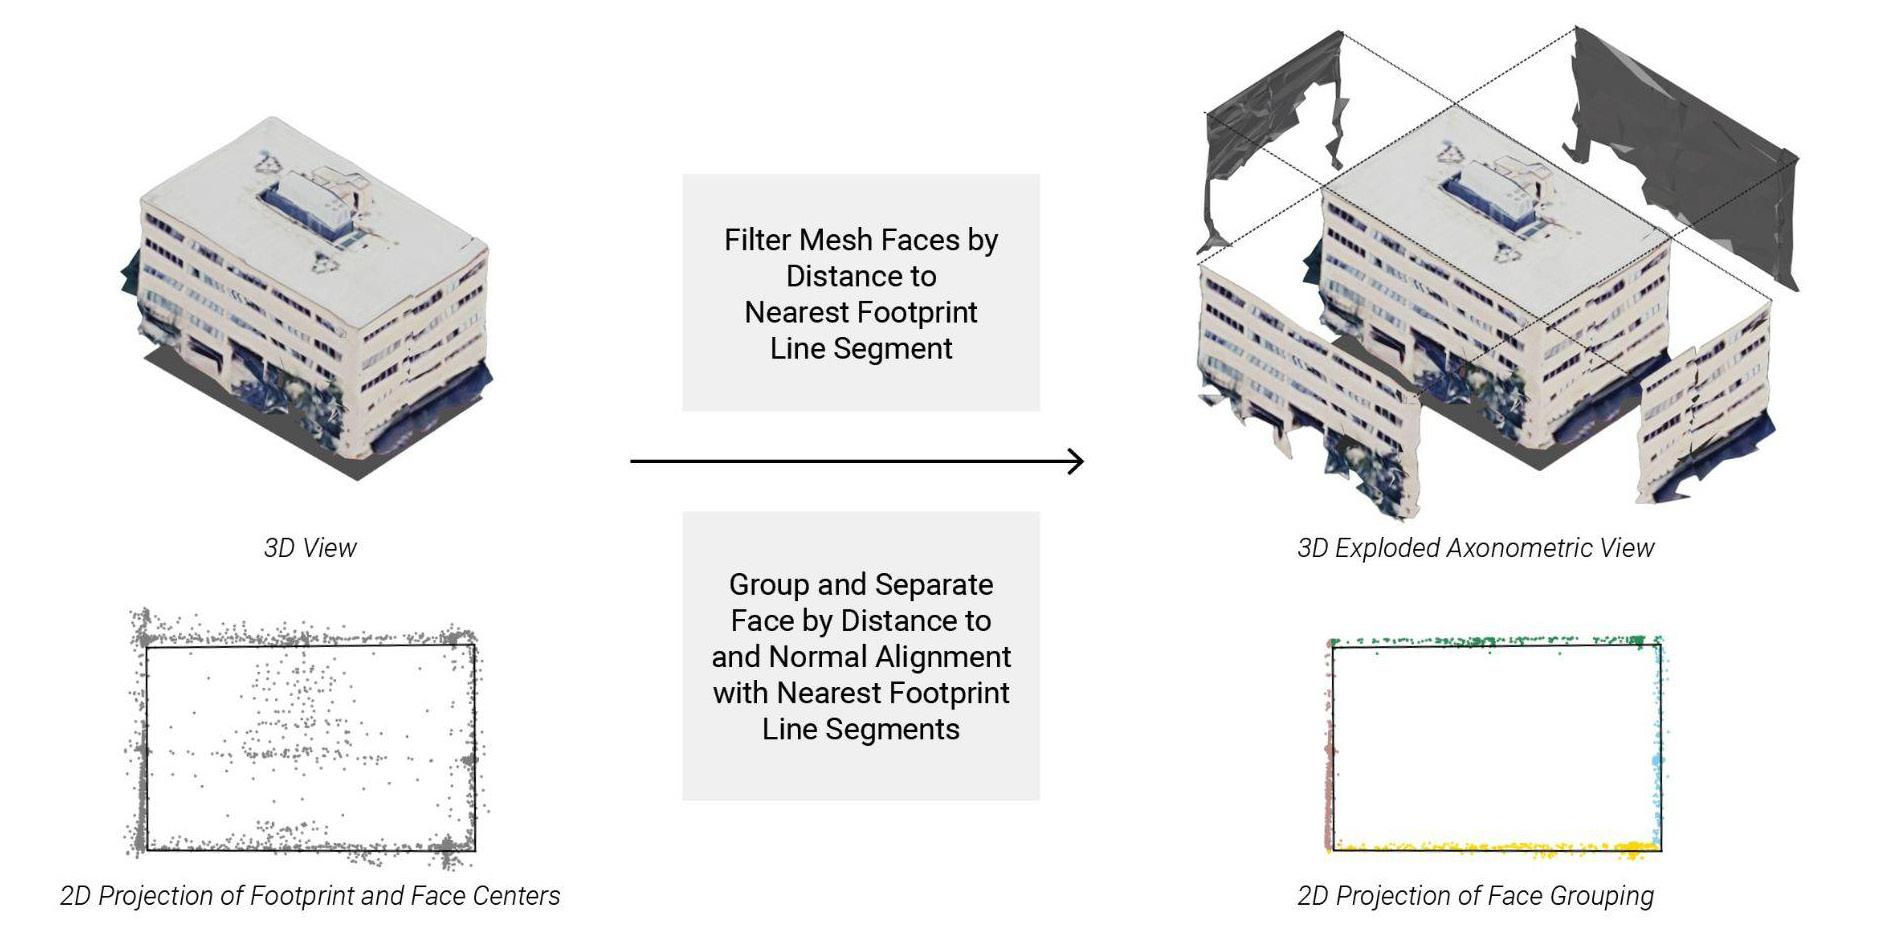
4.Window-to-Wall Ratio (WWR) Calculation
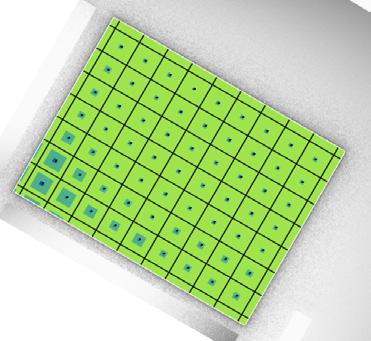
i. Window Surface Separation
We integrate segmented texture maps into building mesh models, dividing them into façade and roof segments for precise WWR calculations. This process identifies window surfaces in the original model for accurate area measurements and potential reconstruction into clean energy models with mapped windows. By extracting and grouping window mesh surfaces based on center-point colors, and leveraging building structure semantics and surface normals to distinguish façades from
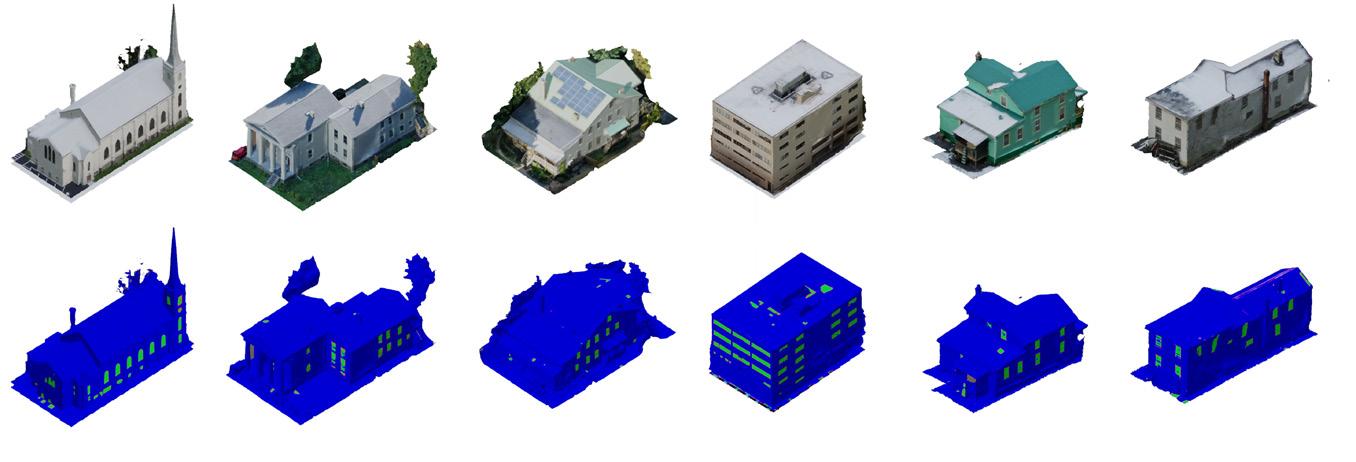
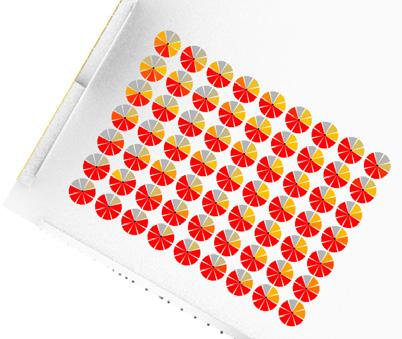
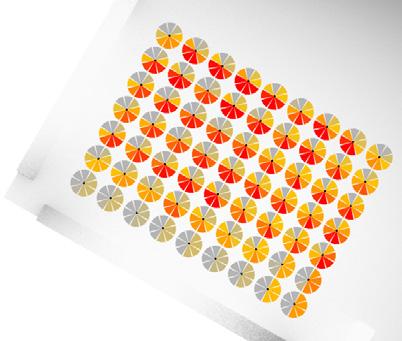
ii. Window Area and WWR Calculation
To validate the proposed WWR detection methods, we collected and compared three datasets on eight buildings representing diverse typologies and shape complexities, from single-family homes to mid-rise offices. The datasets include: (1) manual surface normal calculations from labeled texture maps, (2) pix2pix-based segmentation predictions, and (3) pix2pix with SAM. Error rates were calculated by comparing (1) with (2) and (3), complemented by qualitative visual evaluations. This semi-automated, scalable method reliably analyzes façade WWRs, segments texture maps into windows and façade components, and achieves a mean absolute error rate of 8.99% in urban-scale 3D modeling.
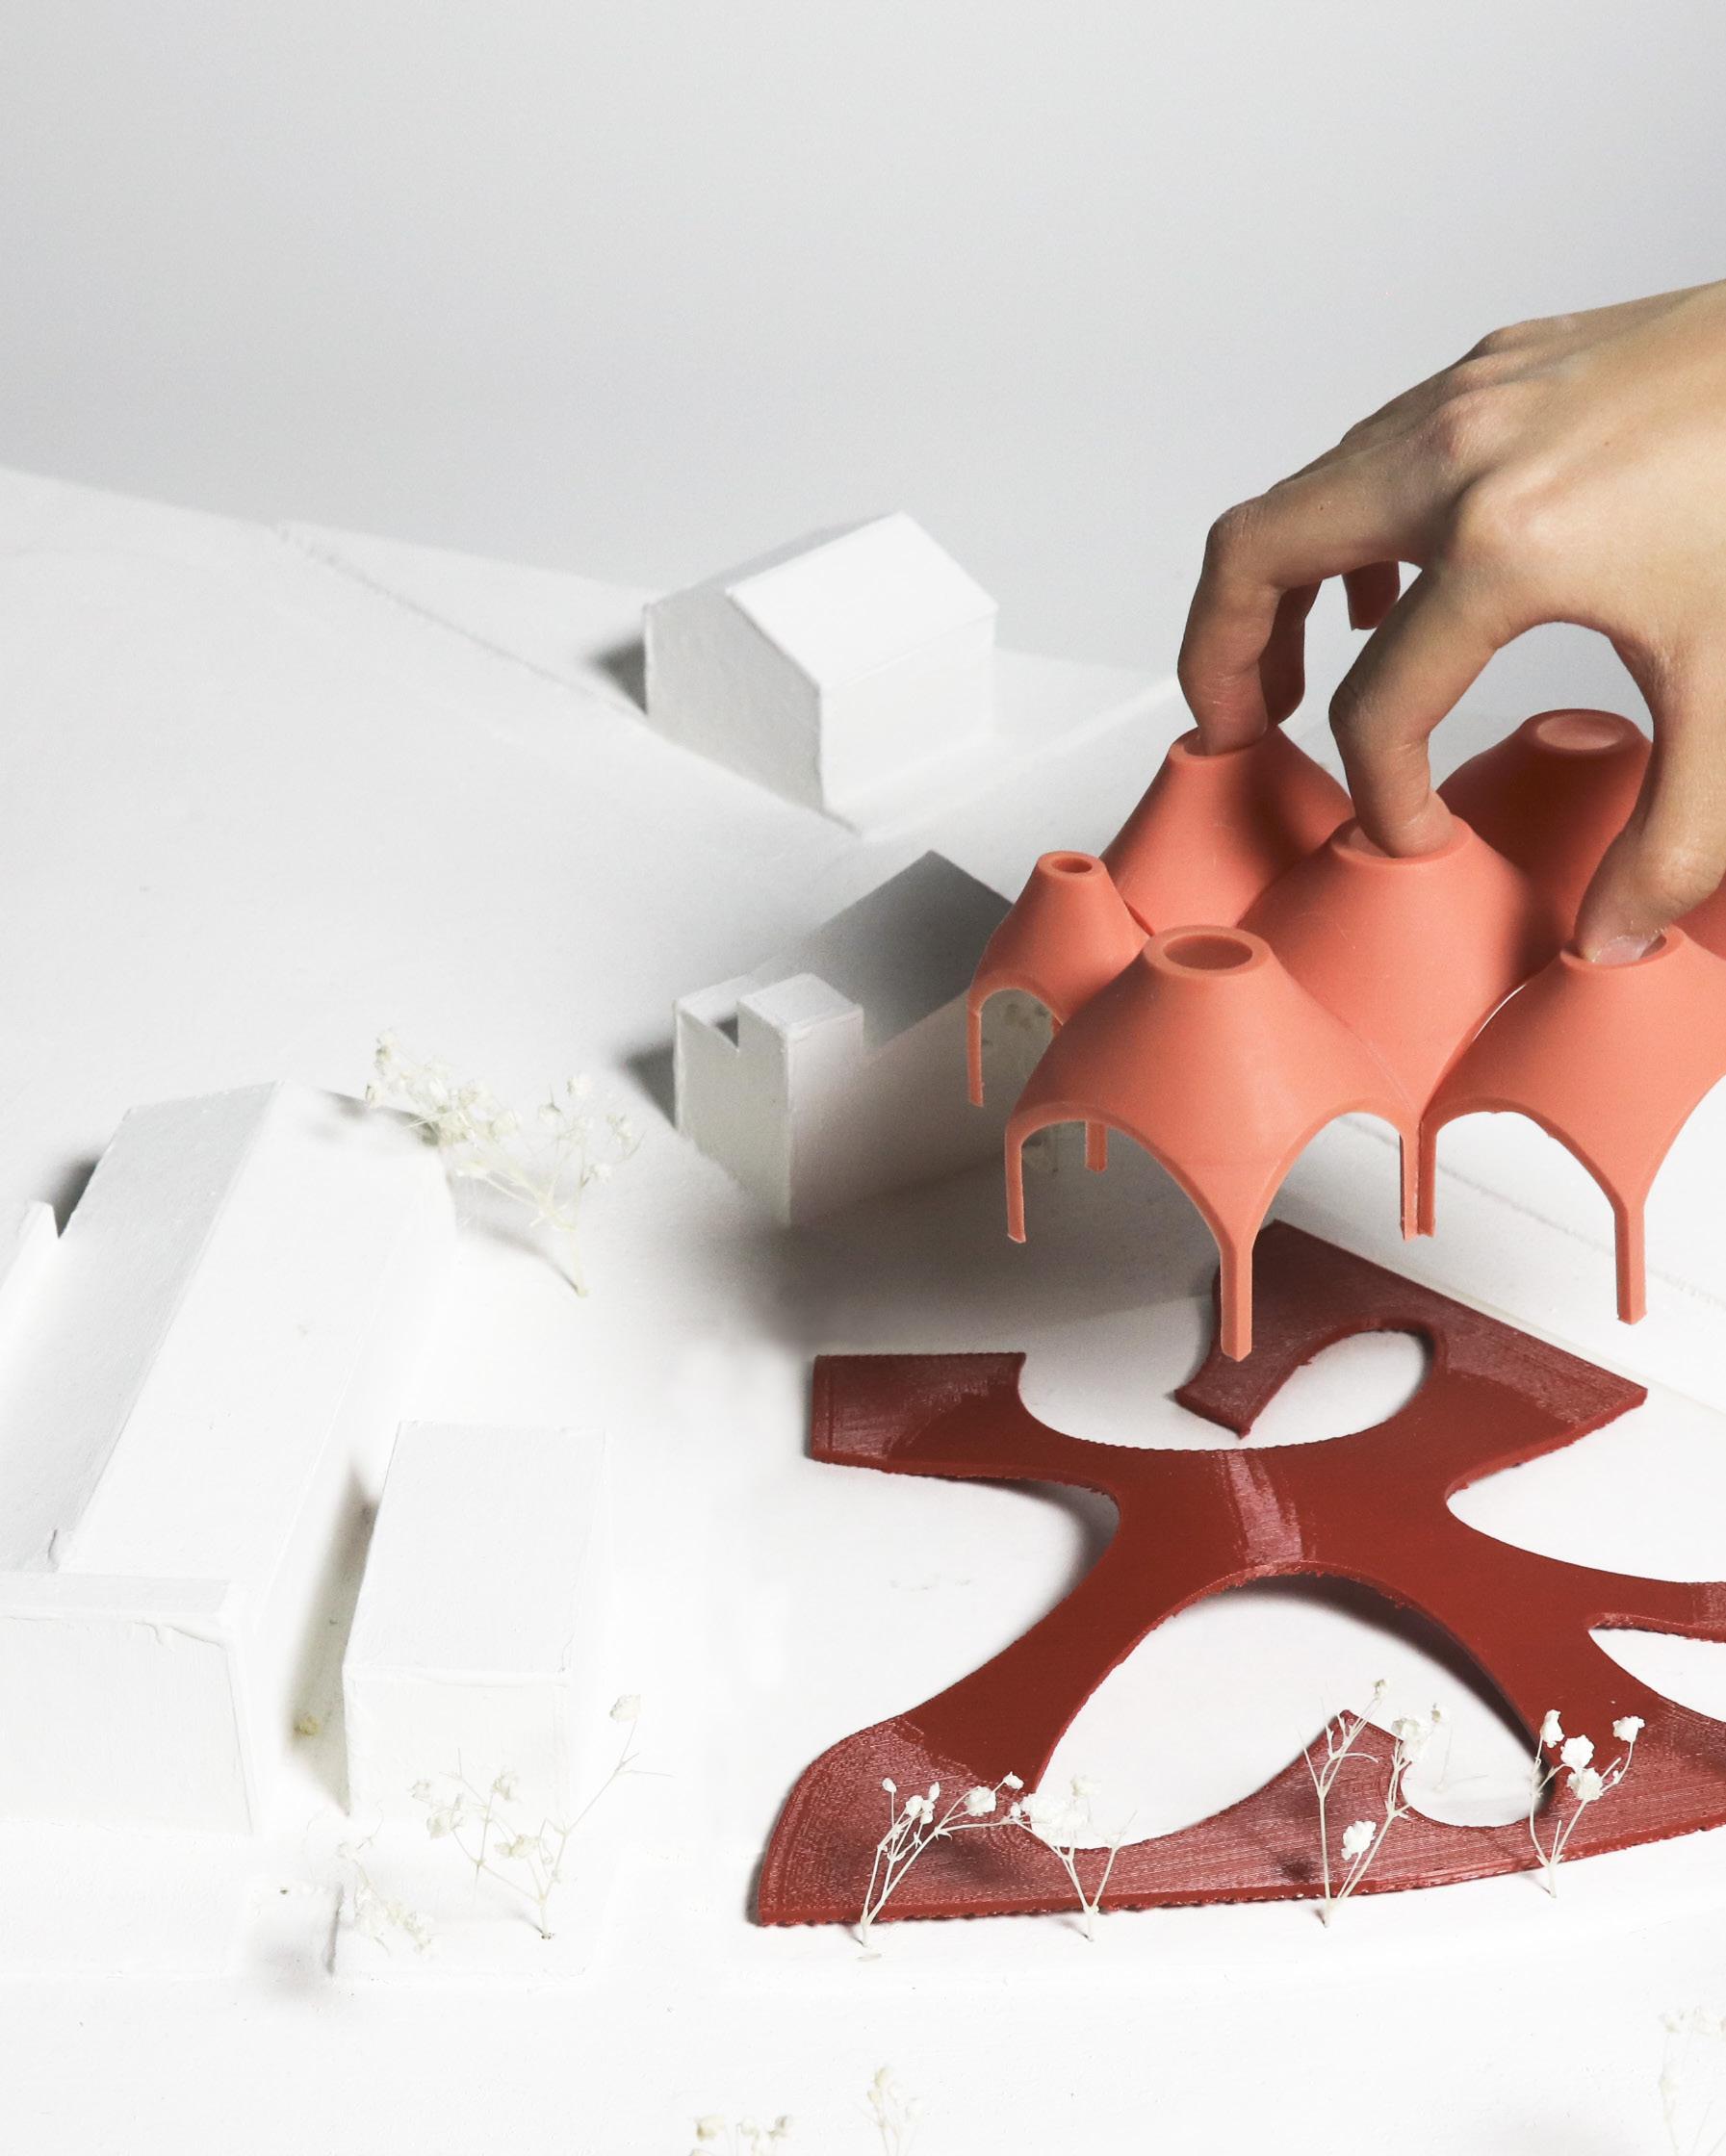
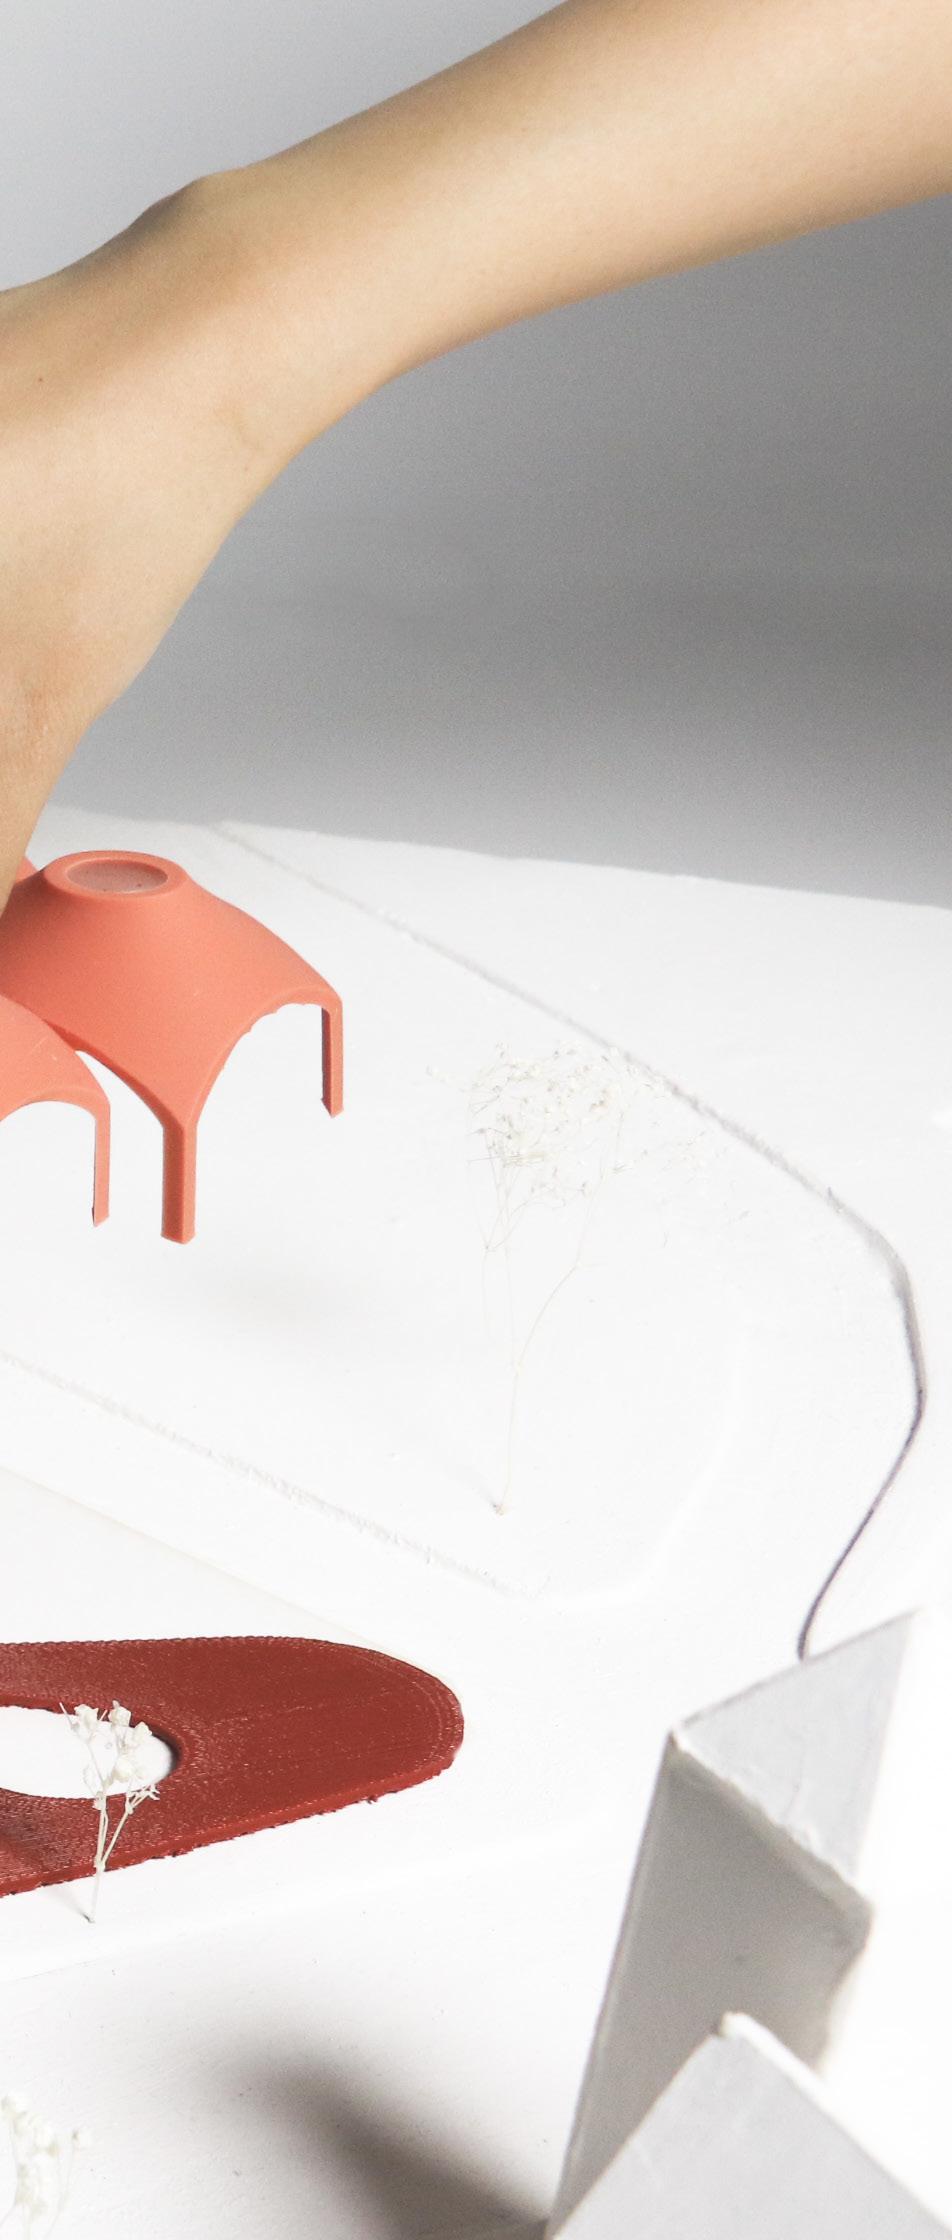
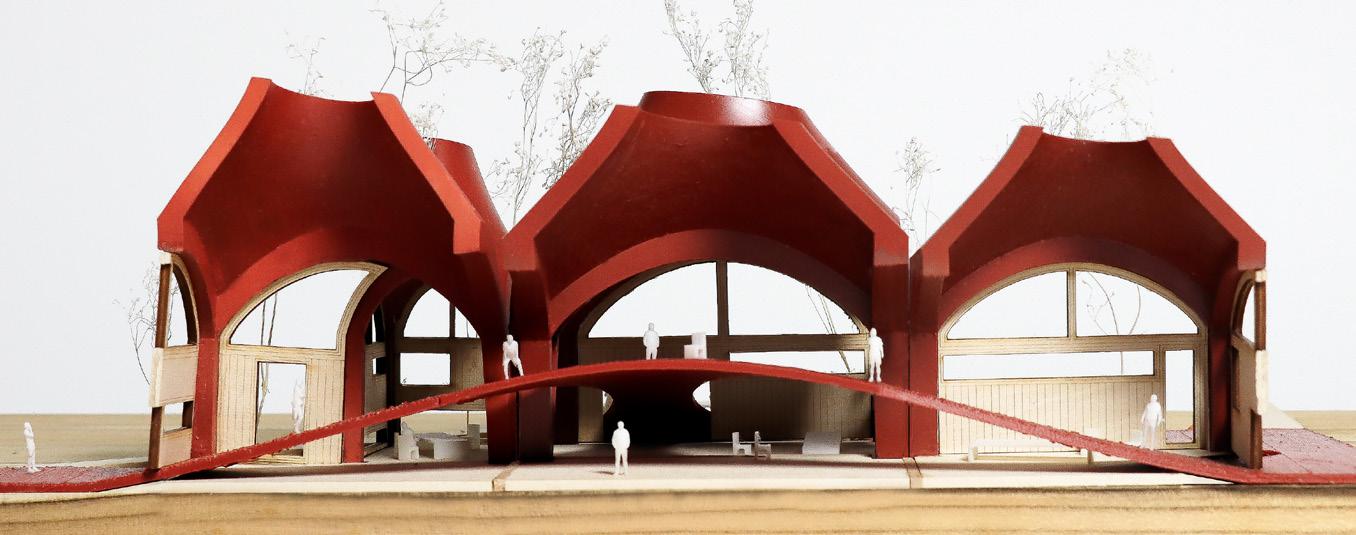
TWO DOMES
Integrative Design / Spring 2022 (ARCH2102 - DESIGN IV)
Individual Work
Instructor: Katharina Kral
The proposed project site is in Seneca Falls, New York, a historically significant town known as the birthplace of the women’s rights movement and located along the Erie Canal. To address the town’s population decline and create opportunities for community gatherings, the proposed library weaves together historic memories and modern experiences. Its design features brick domes arranged in a planned configuration, connected by a free-form brick vault that bridges programs and serves as a medium for book collections.
Sustainability is integral to the design, with passive strategies optimizing thermal performance and energy efficiency. Solar form finding, shading refinement, and construction detailing ensure the library addresses contemporary needs while honoring the town’s rich history.
ORIENTATION, FUNCTION, AND CIRCULATION
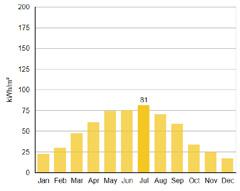
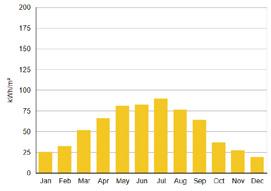
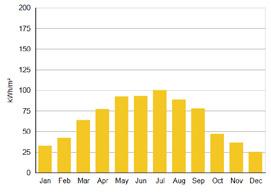
SOLAR
FORM FINDING & RADIATION APPLICATION
After radiation analysis, the northeastern roof orientation is optimized to capture consistent, diffuse daylight, while the southwestern facades are designed for the PV panel intergration. These panels are added as an additional layer on the brick, with their density varying based on the orientation, resulting in a higher concentration of PV panels on the southwestern facades to maximize solar exposure.
FENESTRATION & SHADING SYSTEM OPTIMIZATION
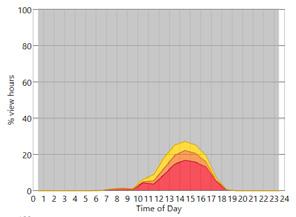
To create a well-daylight space (illuminance target:800-1800), southern opening size need to reduced and northern openings need to be large. Original large, eye-level wiindow is reduced and move up. It could avoid more direct sunlight for improving both UDI and glare.Adding fixed shading on arch windows; Adding dynamic shading on rectangular windows(for different program demands).
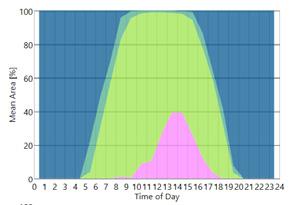
Useful Daylight Illuminance (UDI) Performance
MODEL SECTION
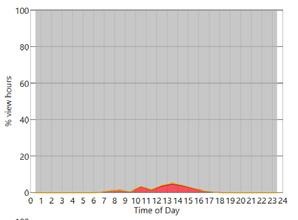
Annual Glare Performance
Southwestern facade (base case)
Southwestern facade (iteration #1)
BASE CASE #0
ITERATION #1
Annual Glare reduced by 43.3%
Avg. UDI increased by 5.1%
1-A
SUMMER PASSIVE DESIGN STRATEGIES
1-A
The arch shape provides a natural curve for collecting water from the top to the drainage at the bottom of the column.
1-B
The arch shape provides a natural curve for collecting water from the top to the drainage at the bottom of the column.
1-B
The valley between brick cones also serves as the gutter for collecting water to the drainage at the bottom of the column.
The valley between brick cones also serves as the gutter for collecting water to the drainage at the bottom of the column.
1-C
Rainwater could be collected and reused for sanitary demands.
1-C
Rainwater could be collected and reused for sanitary demands.
1-A
1-A
The valley between brick cones and the its curve shape could reduce the wind speed from northeastern.
The valley between brick cones and the its curve shape could reduce the wind speed from northeastern.
2-A
Sunlight through the low-E glazing system became one of the main solar gain sources.
2-A
Sunlight through the low-E glazing system became one of the main solar gain sources.
2-B
The vault space underneath provides a natural semi-closed space for hot air circulating and storing.
2-B
The vault space underneath provides a natural semi-closed space for hot air circulating and storing.
2-C
Brick serves as a great thermal mass material for storing heat during the winter daytime.
2-C
Brick serves as a great thermal mass material for storing heat during the winter daytime.
2-D At winter night, heat will be relased by the brick.
2-D At winter night, heat will be relased by the brick.
INSULATED GLASS
RETAINING ANGLE
RETAINING ANGLE FASTENER
CURB FRAME
CURB
FLASHING
STRUCTURE BRICK
INSULATION
FACING BRICK
2-A
SKYLIGHT DETAILING OPTIMIZATION
BASE CASE #0
Internal Temperature: 20ºC
2-A
The brick shell shape provides a curve surface for introducing cold wind.
2-B
The brick shell shape provides a curve surface for introducing cold wind.
2-B
The operable skylight system could release the hot wind during the summer.
2-C
The operable skylight system could release the hot wind during the summer.
2-C
Brick serves as a great thermal mass material for releasing heat during the summer.
2-D
Brick serves as a great thermal mass material for releasing heat during the summer.
External Temperature: -10ºC
INSULATED GLASS RETAINING ANGLE
RETAINING ANGLE FASTENER
CURB FRAME
CURB
FLASHING
STRUCTURE BRICK
INSULATION
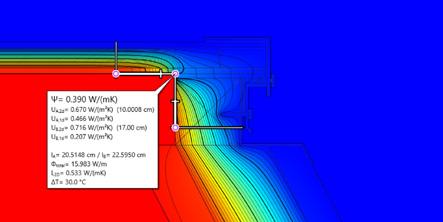
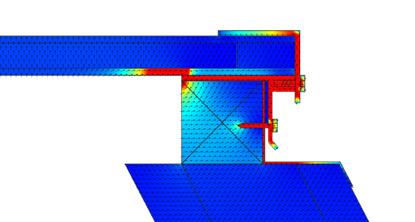
The steel angle and frame create the thermal bridge since it crossed through the inside and outside.
Due to the continuous connection between the curb and the insulation layer, the PSI value has a mediocre performance.
FACING BRICK
2-D
At summer night, heat will be removed by the natural wind.
3-A
At summer night, heat will be removed by the natural wind.
Facade U-Value = 0.716 W/(m2K)
U-Value = 0.466 W/(m2K)
The fixed shading system could prevent over-heating during the summer.
3-A
= 0.390 W/(mK)
3-B
The fixed shading system could prevent over-heating during the summer.
3-B
The dynamic shading system could prevent over-heating during the summer.
The dynamic shading system could prevent over-heating during the summer.
ITERATION #1
Internal Temperature: 20ºC
3-A
3-A
Skylights are all towards the northeast to obtain consistent and diffused daylight.
3-B
Skylights are all towards the northeast to obtain consistent and diffused daylight.
thermal bridge
External Temperature: -10ºC
INSULATED GLASS
RETAINING ANGLE
SANTOPRENE GASKET
RETAINING ANGLE FASTENER
CURB FRAME
3-B
The PV panel system are mainly installed towards the southwest to obtain.
The PV panel system are mainly installed towards the southwest to obtain.
4-A
4-A
The sunlight through the window became one of the main solar gain resources during the winter.
4-B
The sunlight through the window became one of the main solar gain resources during the winter.
4-B
The dynamic shading system could allow sunlight to come through to provide solar power during the winter.
The dynamic shading system could allow sunlight to come through to provide solar power during the winter.
CURB
FLASHING
STRUCTURE BRICK
INSULATION
FACING BRICK
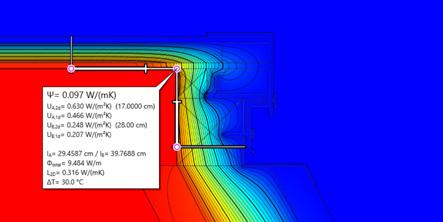
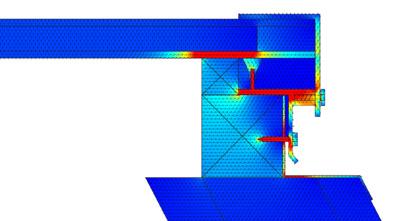
By adding the gasket and continuous curb, the skylight was lifted up, and the steel was blocked outside by the new continuous curb, so the thermal bridge is reduced.
Close To Home / Spring 2024 (ARCH4102 - DESIGN VIII)
Group work with Jiayu Su Instructor: Emma Silverblatt
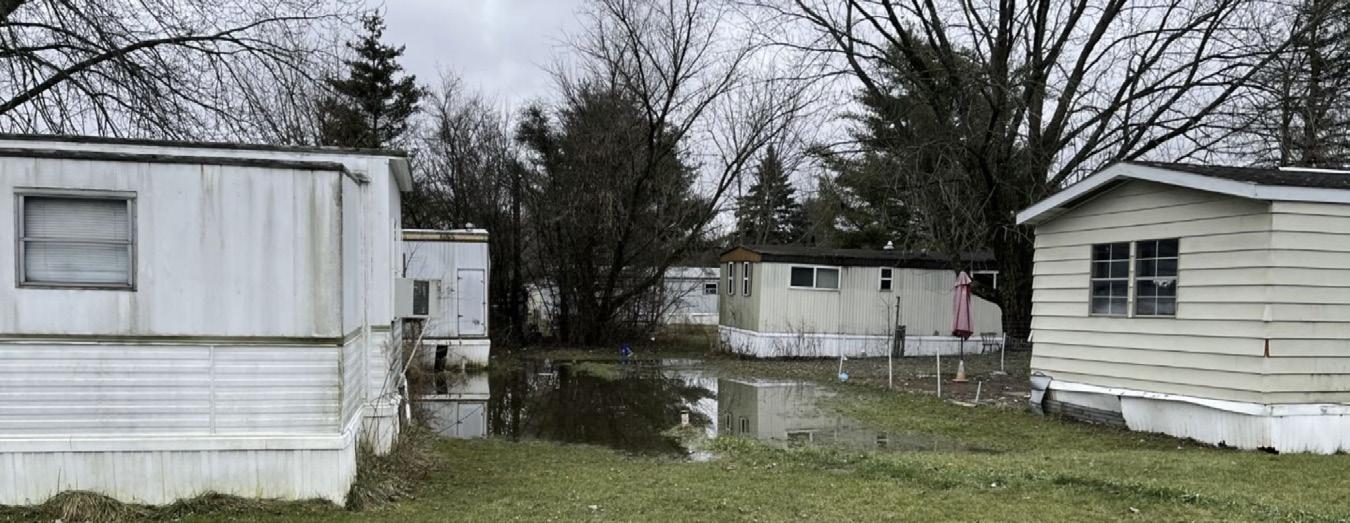
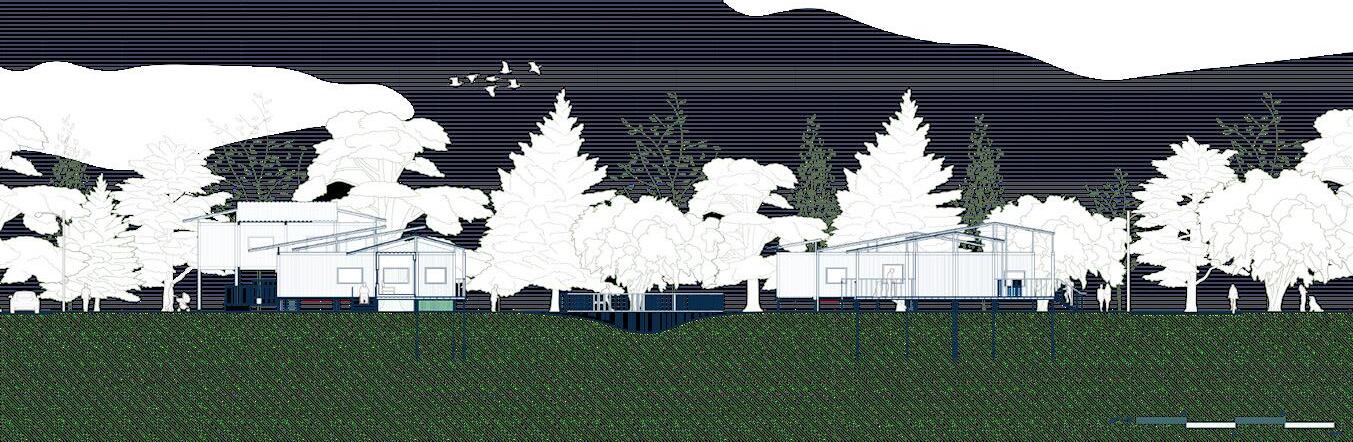
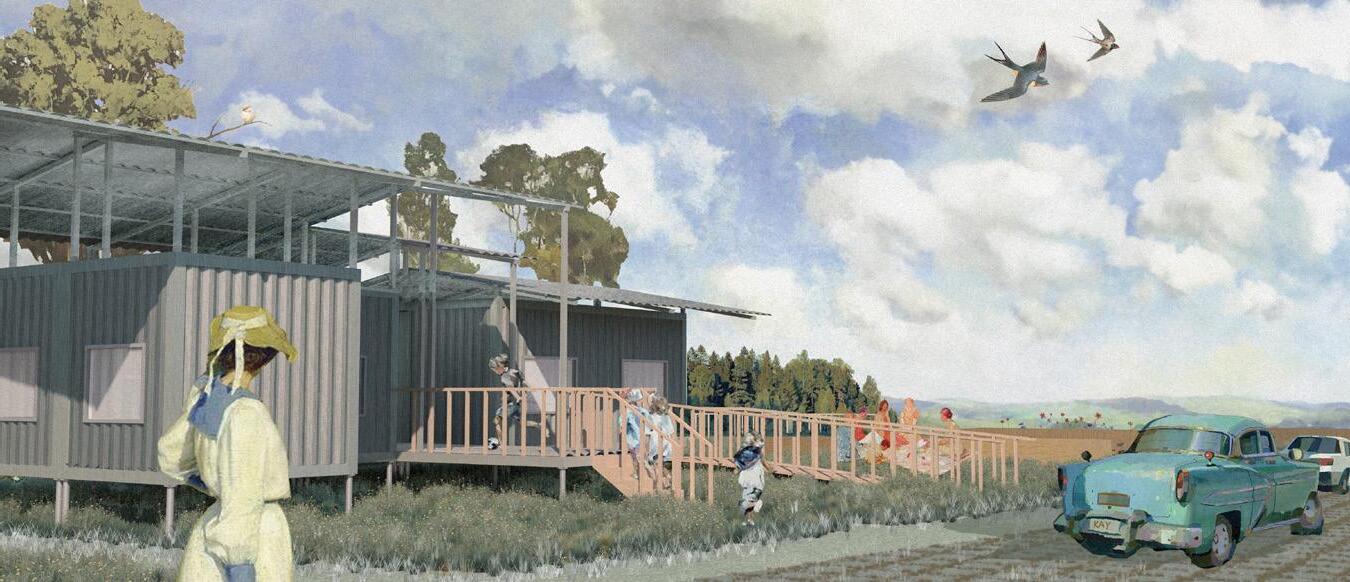
This project tackles the challenges of manufactured housing in the United States, particularly the lack of site-specific placement and installation. While intended to provide low-cost, high-efficiency solutions, improper siting often leads to reduced performance, shorter lifespans, and diminished value, undermining affordability and sustainability goals.
Site-Specific and Community-Focused Design
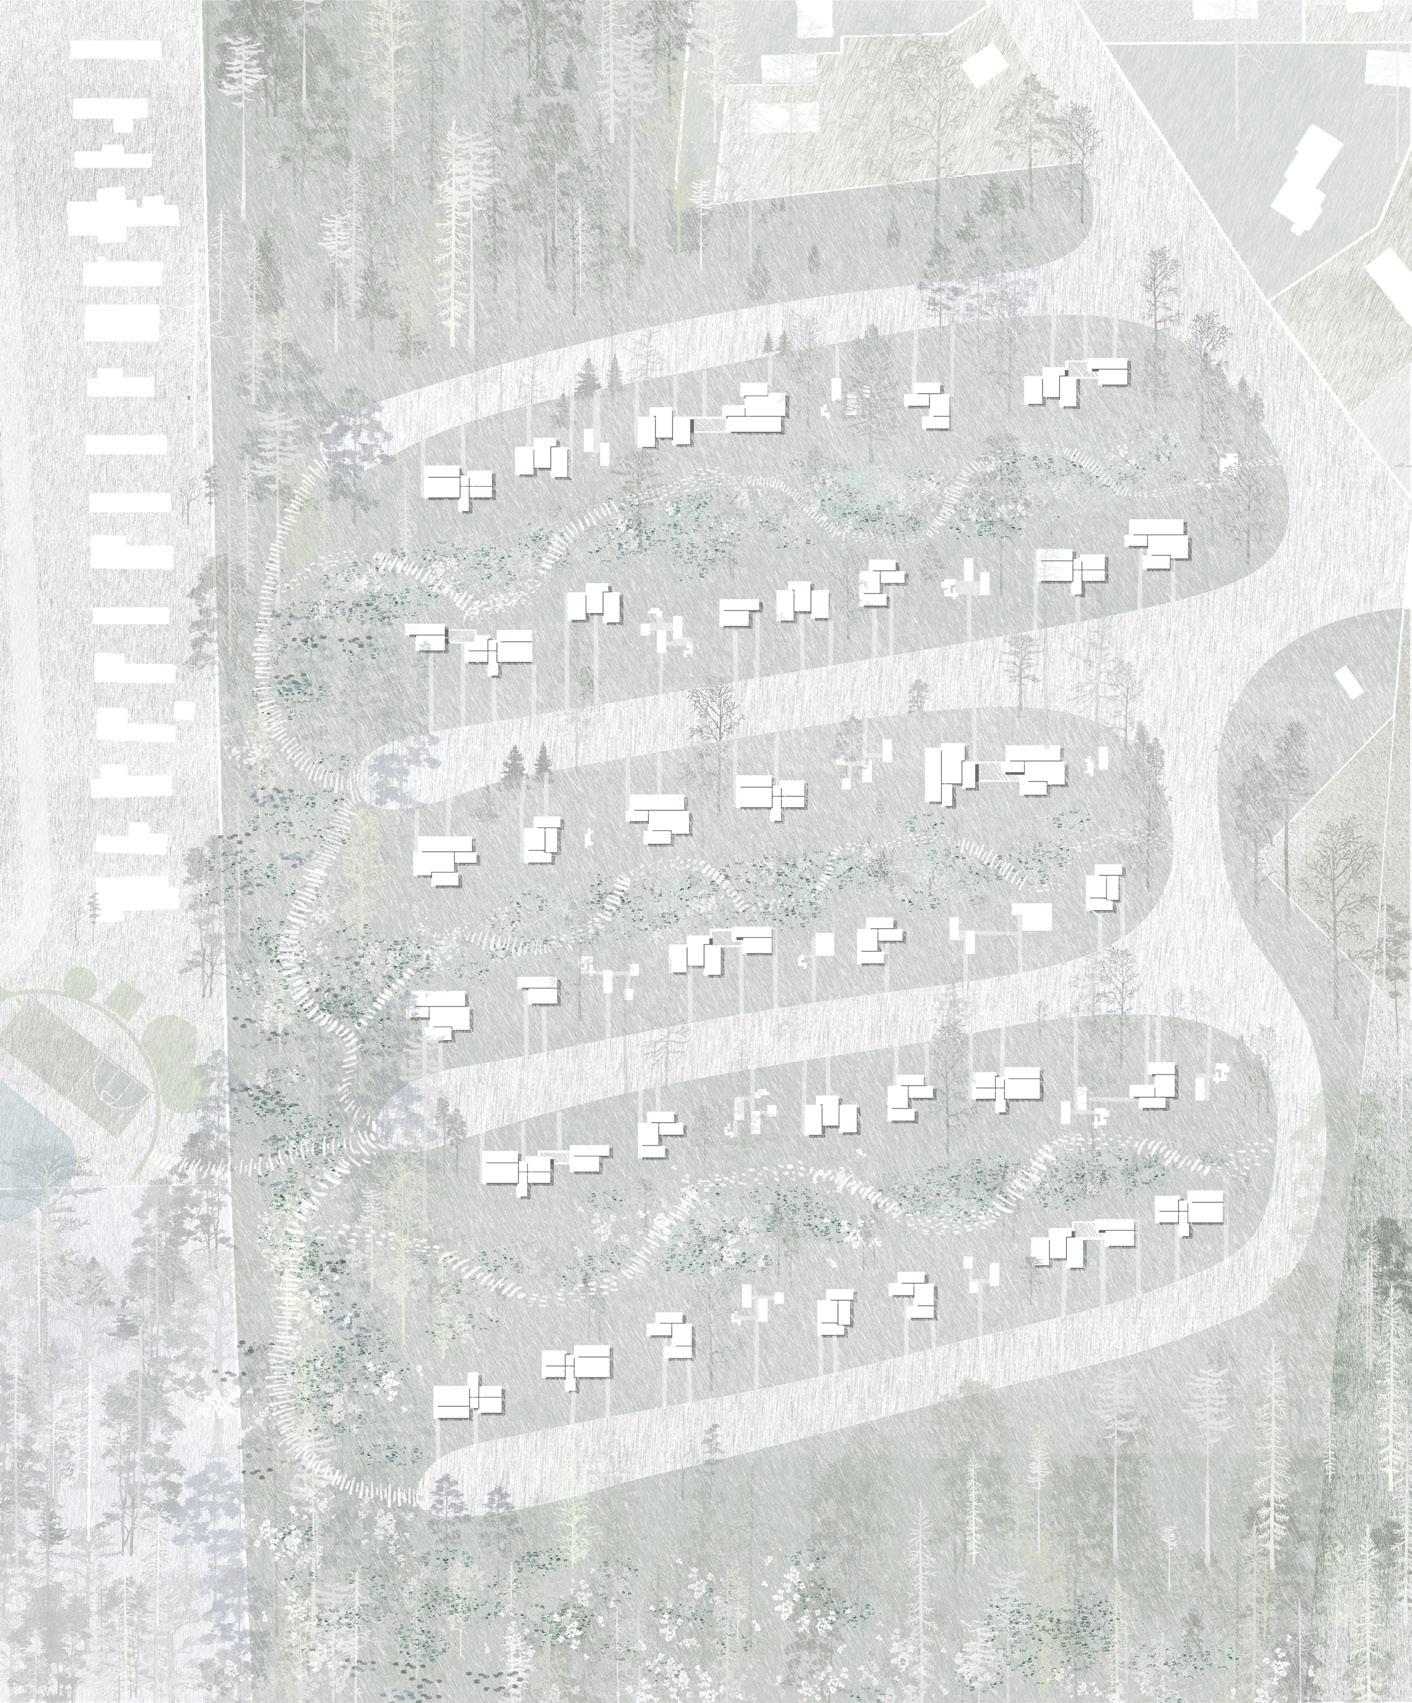
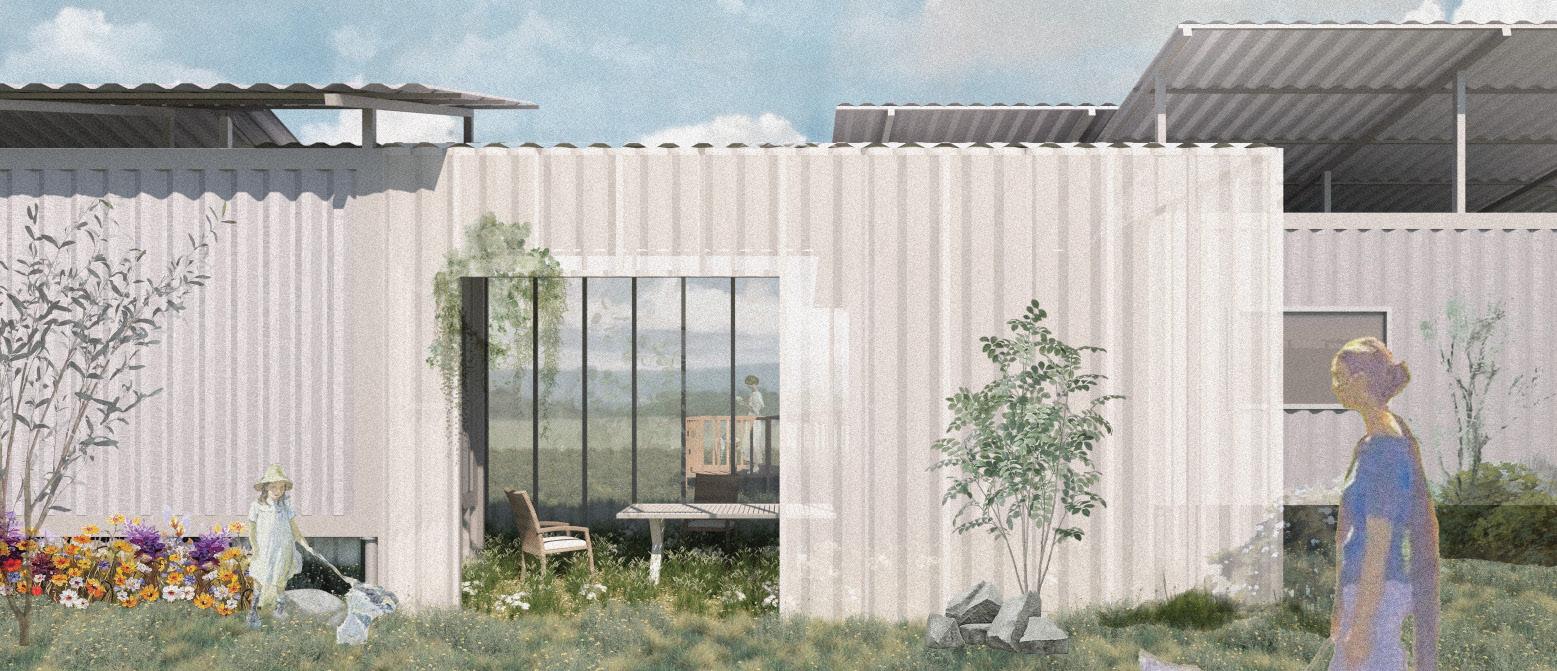
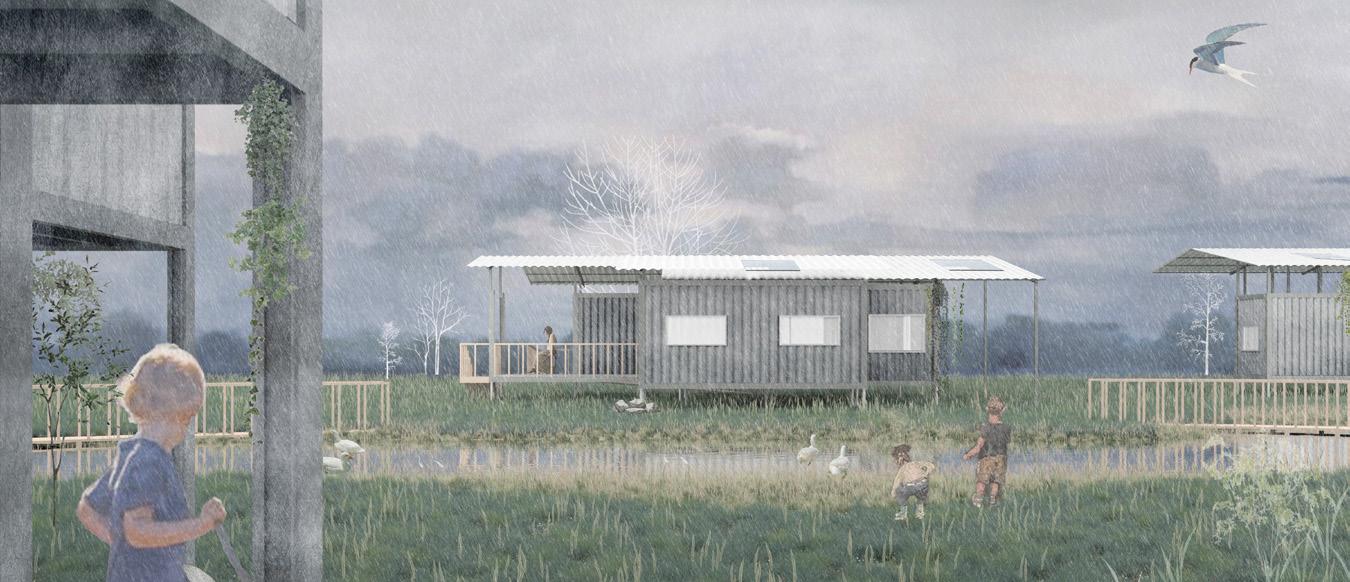
The proposal adopts a container-house model with site-specific principles, ensuring resilience and efficiency by tailoring units to their environments. Flexible floorplans offer adaptability for changing needs. Clustered housing surrounded by vegetation enhances wind efficiency, manages stormwater, and fosters community interaction, creating sustainable and connected living environments.
Foundation - Water Damage Siting - Flooding on site
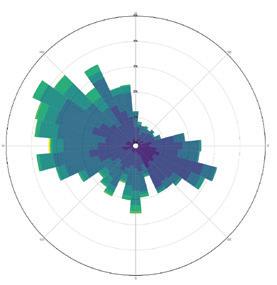
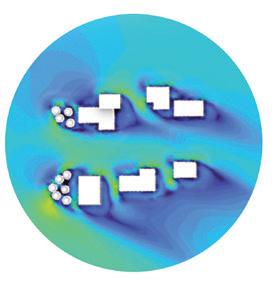
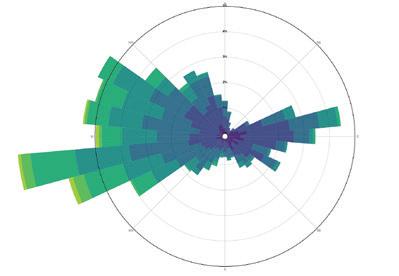
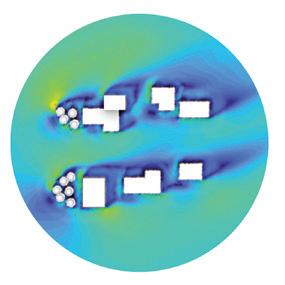
WIND ANALYSIS AND STRATEGIES
Frame Out of Alignment Foundation - Skirting Damage / Potential Unleveling
Winter Wind Rose & CFD
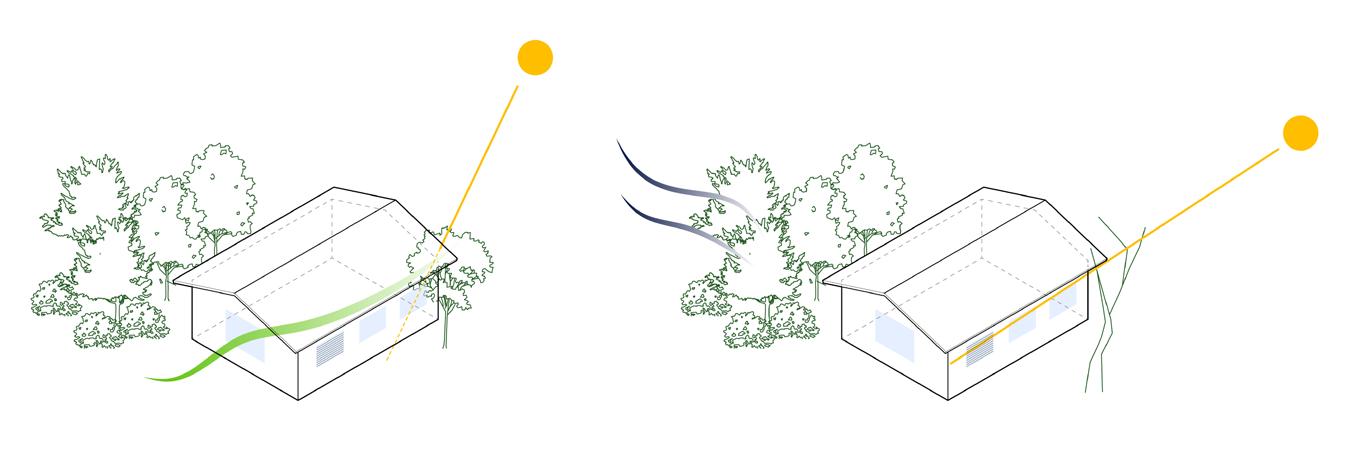
PASSIVE DESIGN STRATEGIES
Shade to Block Out Summer Direct Sunlight
Phase-Changing Material (Dry Wall)
Natural Ventilation
Blinds to Avoid Glare
Water-Permeable Driveway
Deciduous Tree for Summer Shade
Dense Evergreen Shrubs and Trees to Create Wind Break and Dead Air Zone
Air Tightness
Dense Vegetation to Create Winter Wind Break
South-facing Elevated Roof for PV Panels
Window with Low U-Value Median SHGC Median TVis
Deciduous Tree for Winter Sun for Passive Heating
Sloping Landscape for Directing Water towards Central Stormwater Management Canel
Tall Building for creating Slow Winter Wind Area for buildings behind, elevated for Flood Resistence
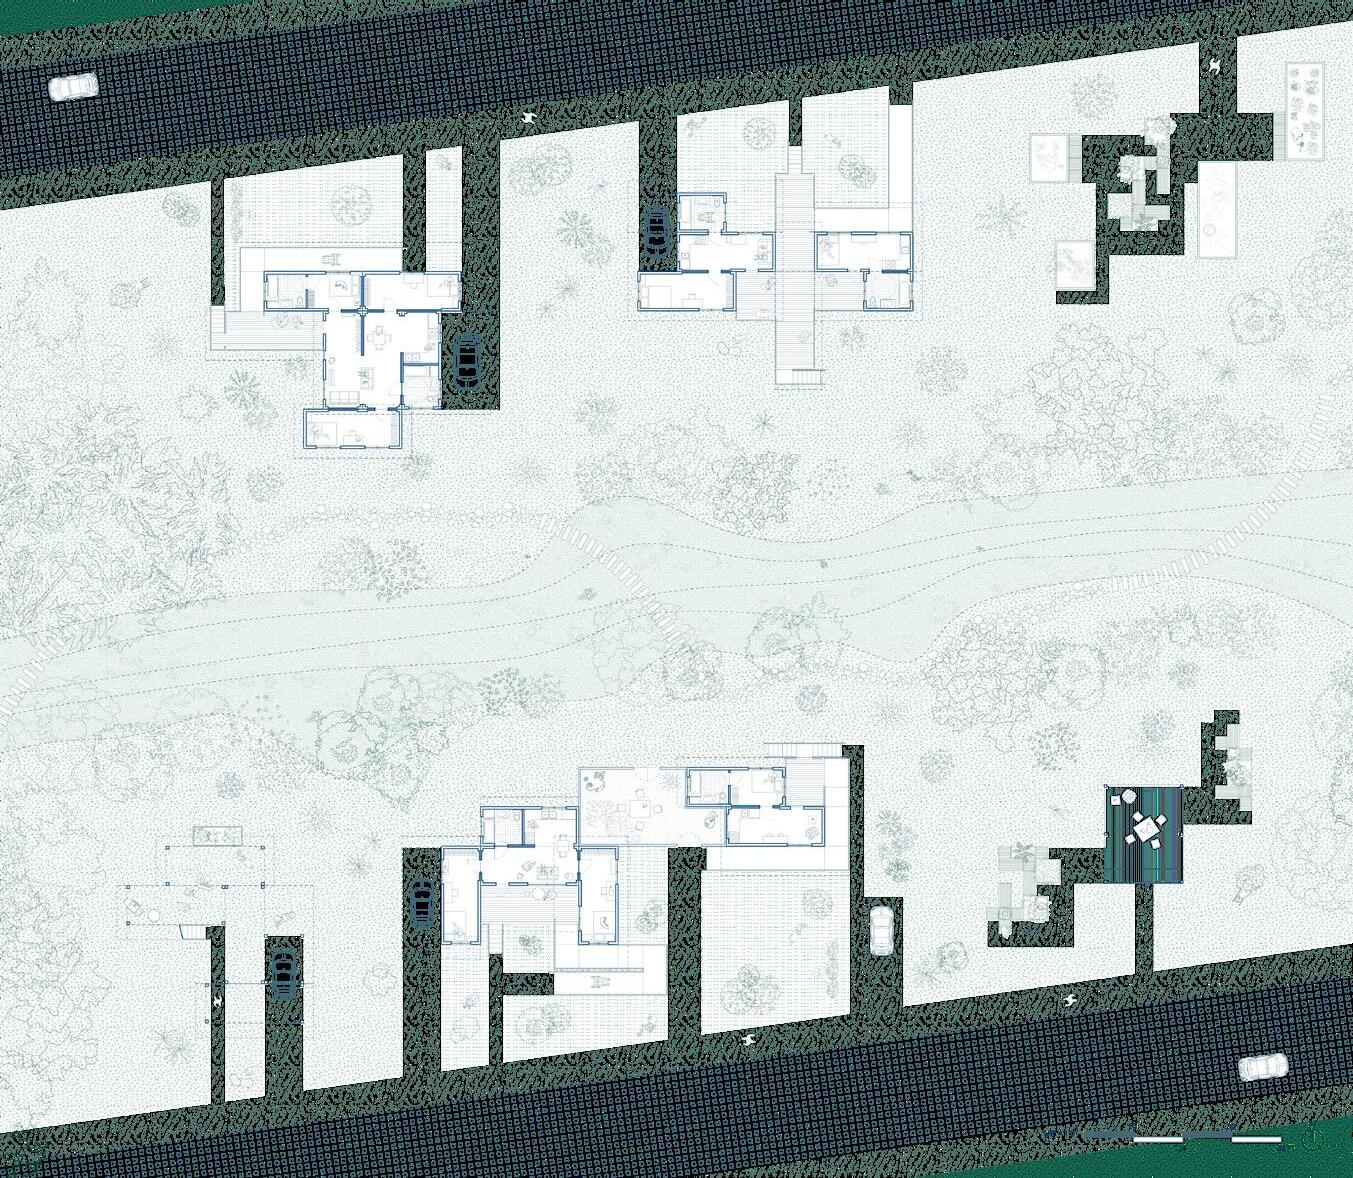
CONTAINER UNITS AND THEIR LIVING POSSIBILITES
2 BEDROOMS 560 sq.ft.
By combining A, B, and C container units, users can easily assemble a two-bedroom unit. They can also customize and assemble different configurations based on their needs, with all units designed to be transportation-friendly.
BUILDING LIFE CYCLE
STRUCTURE SYSTEM
GROUND FLOOR PLAN
N-S SECTION
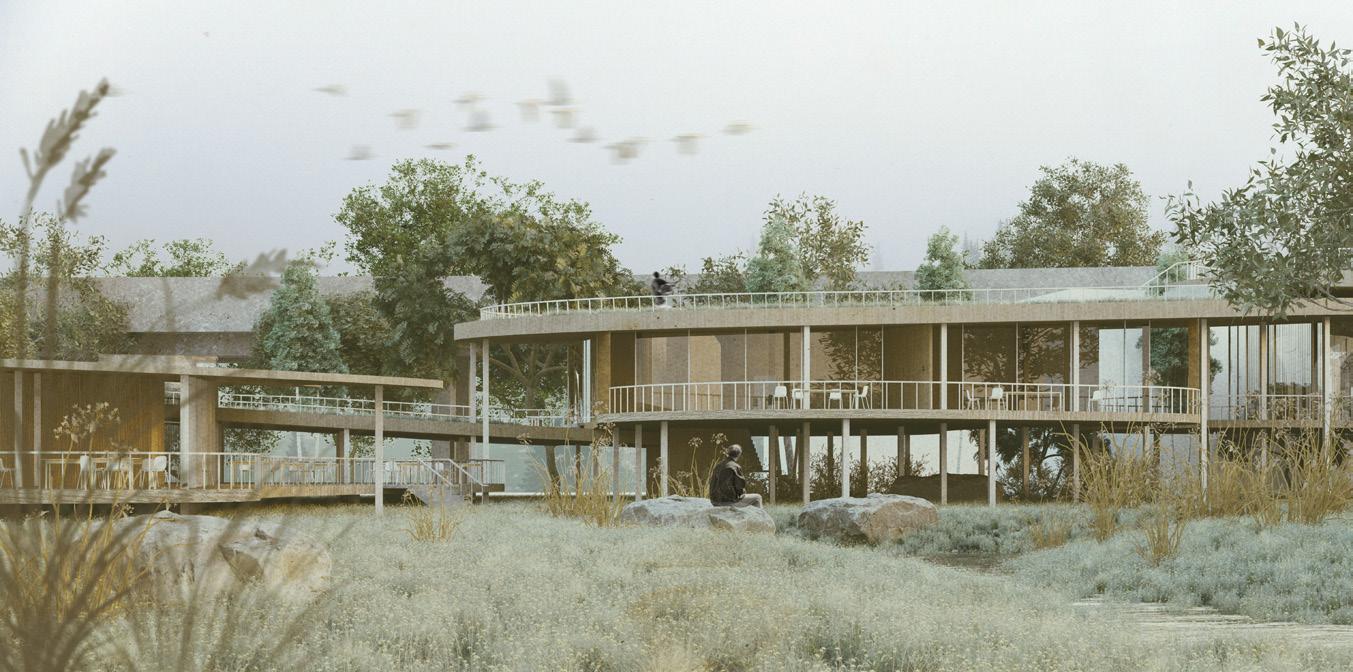
AT LAND
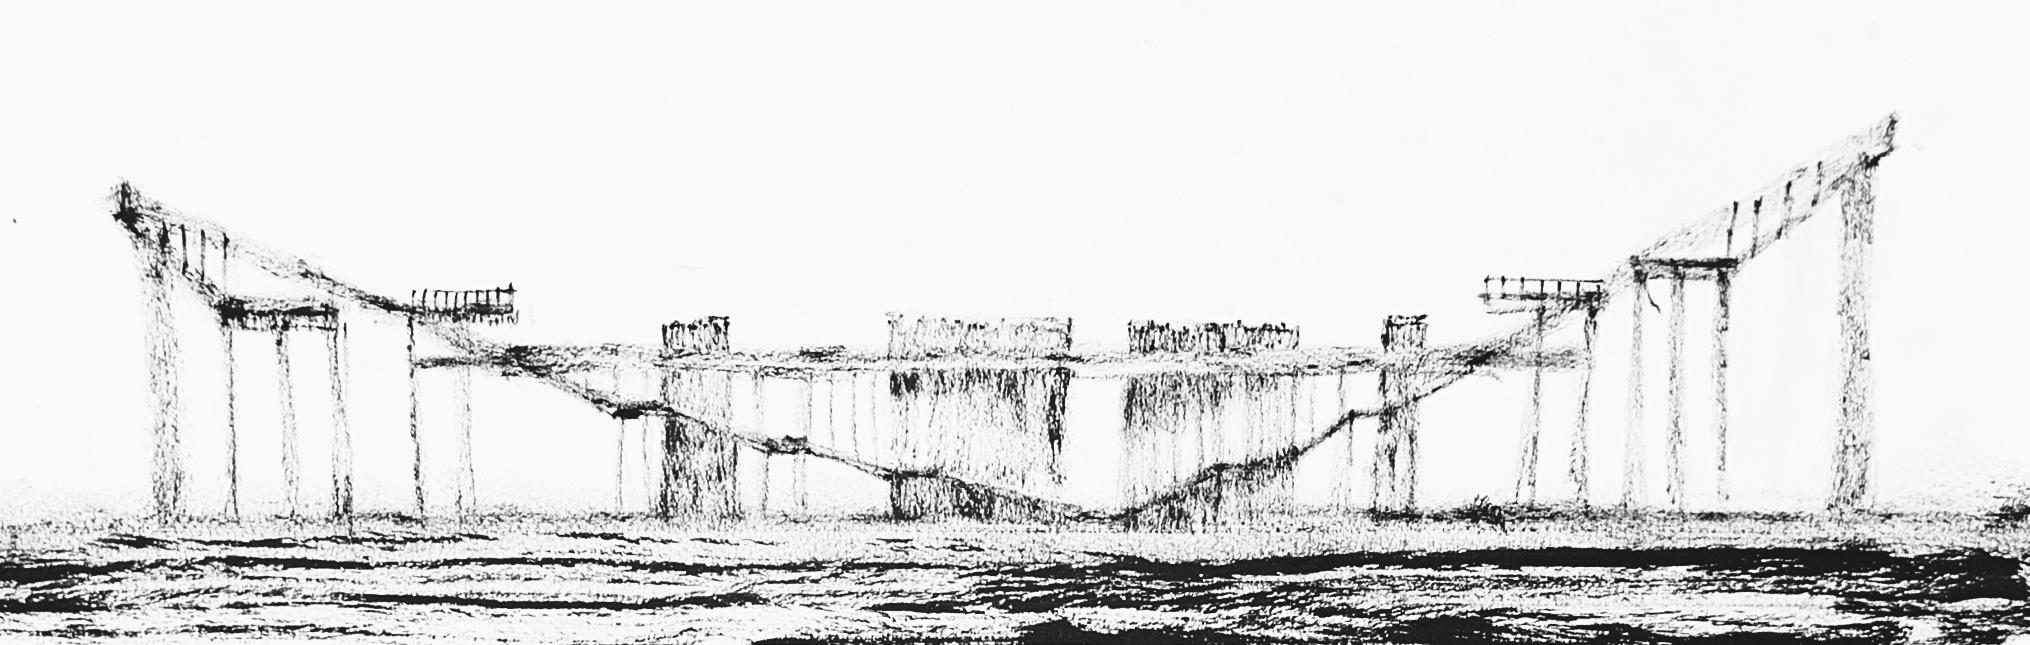
Architecture of Relation / Spring 2023 (ARCH3102 - DESIGN VI)
Group work with Jiayu Su Instructor: Tao DuFour
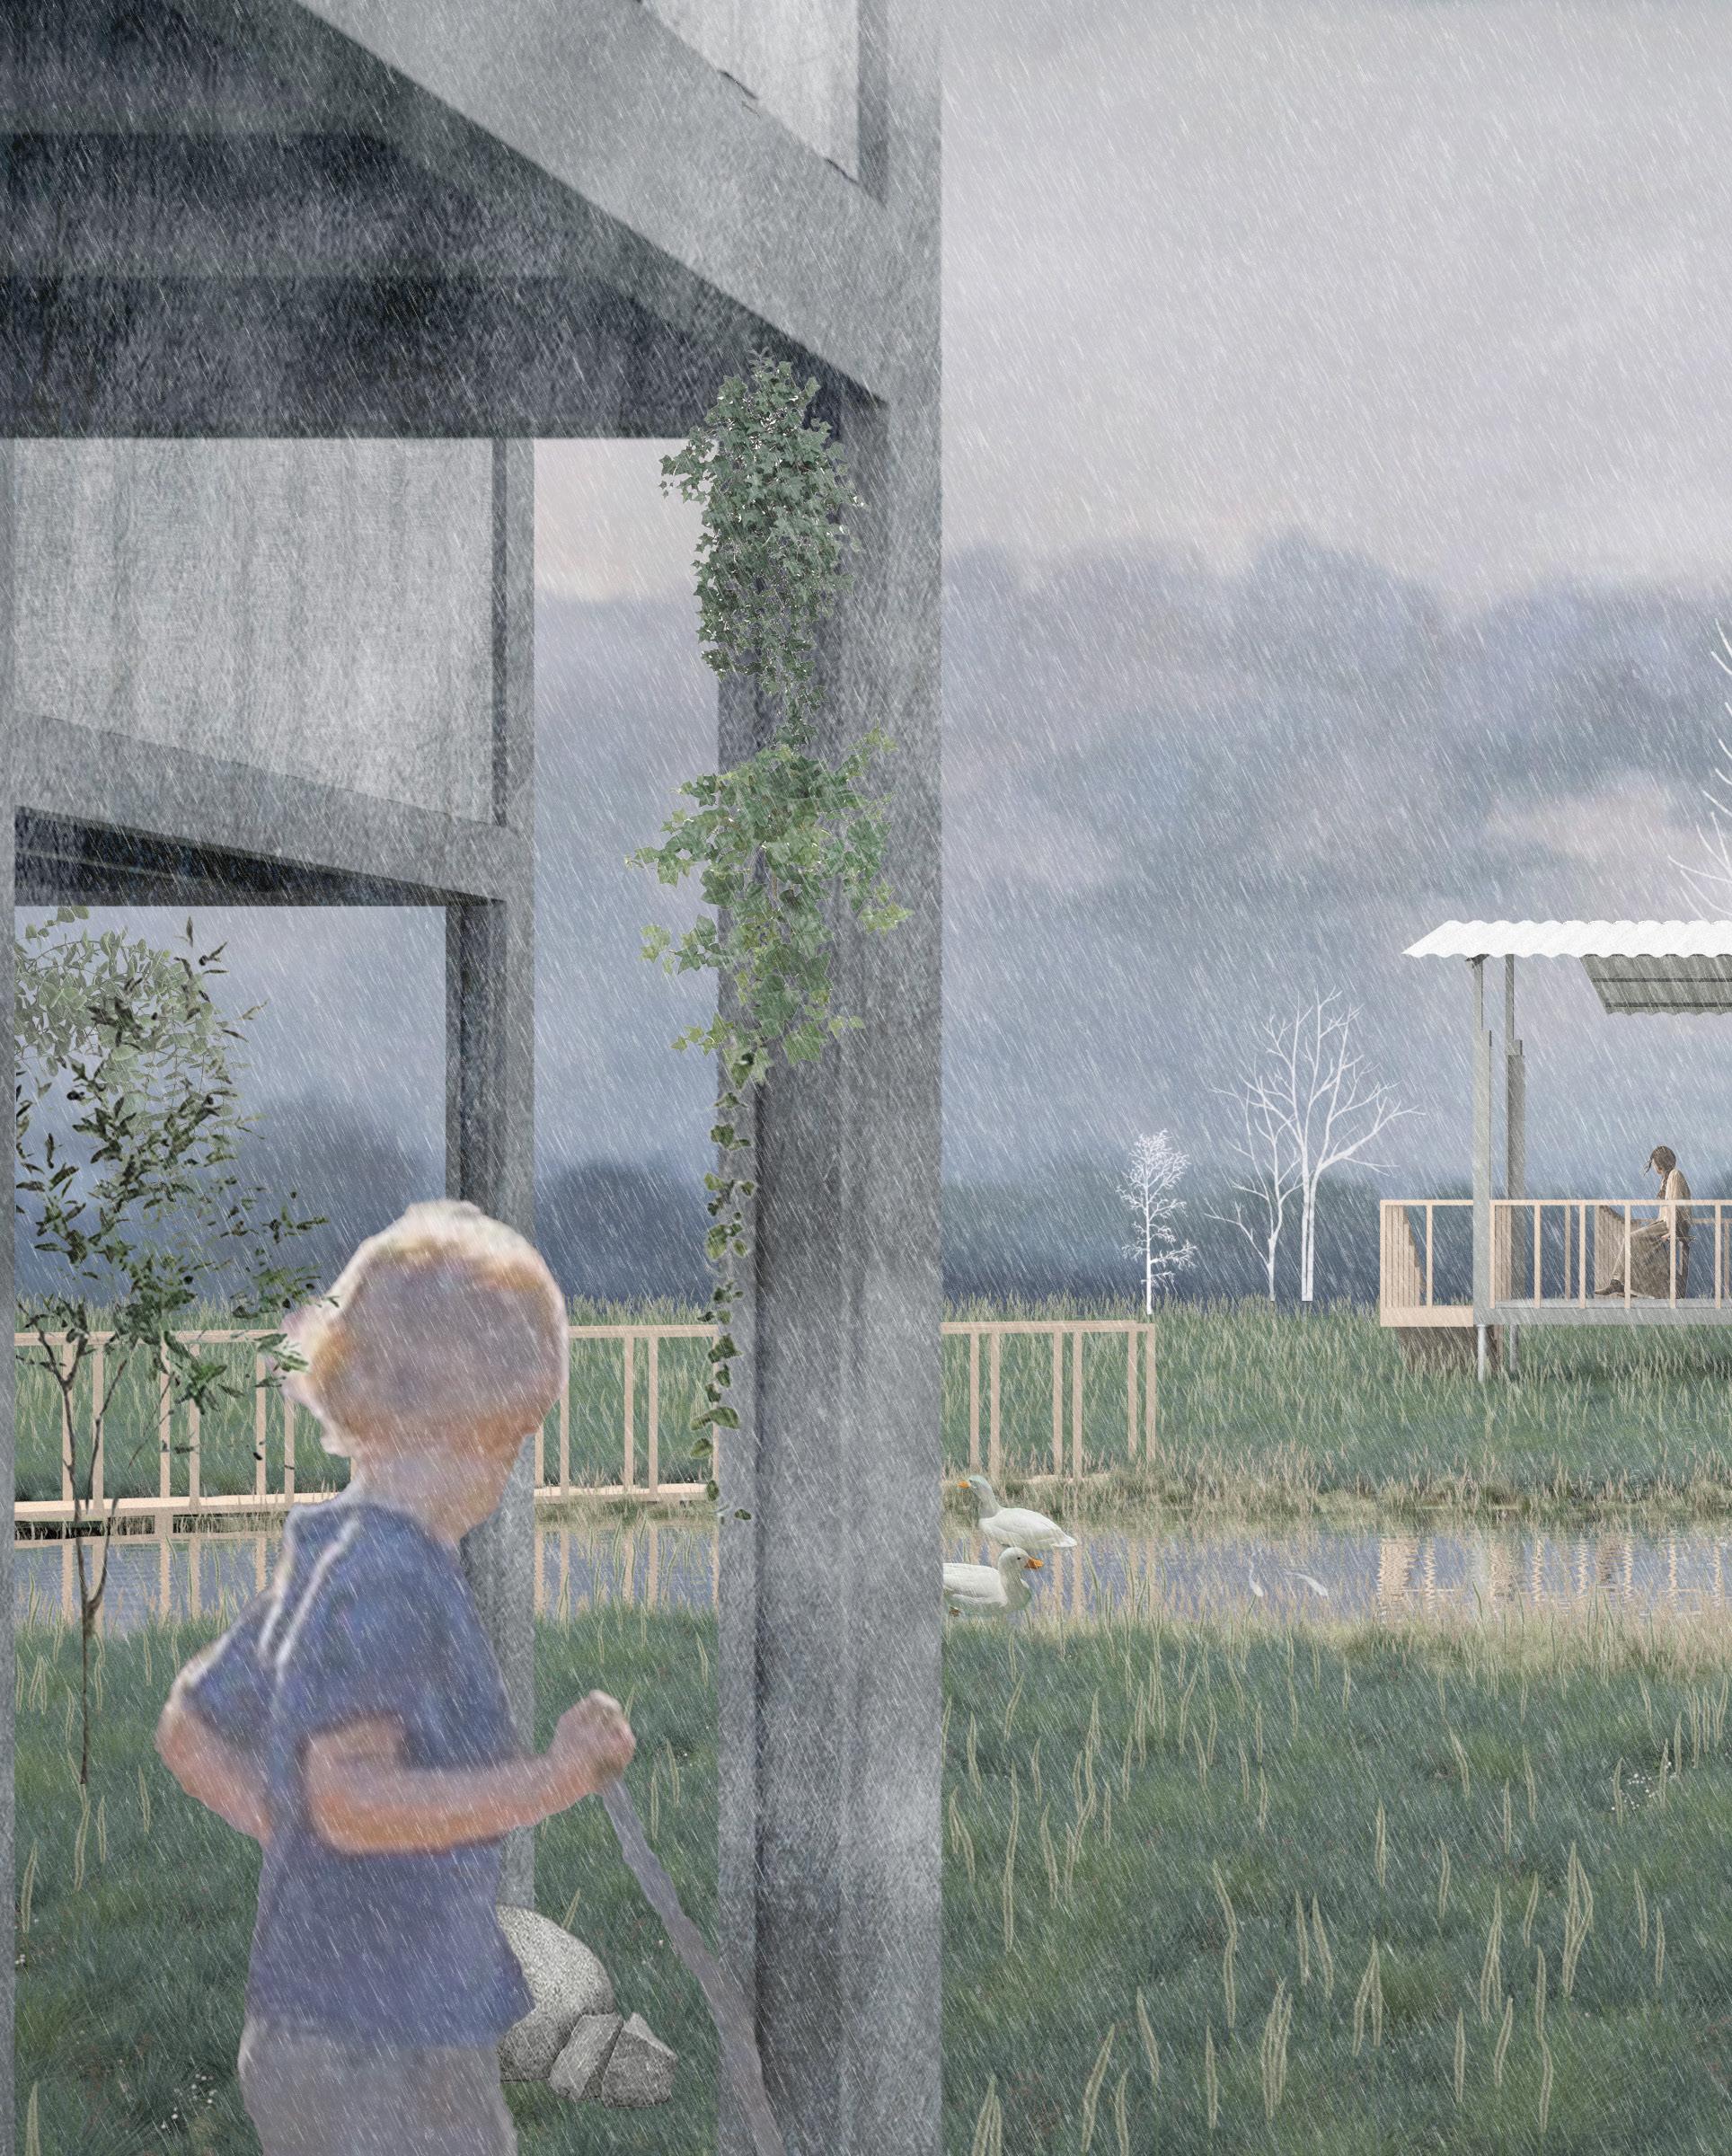
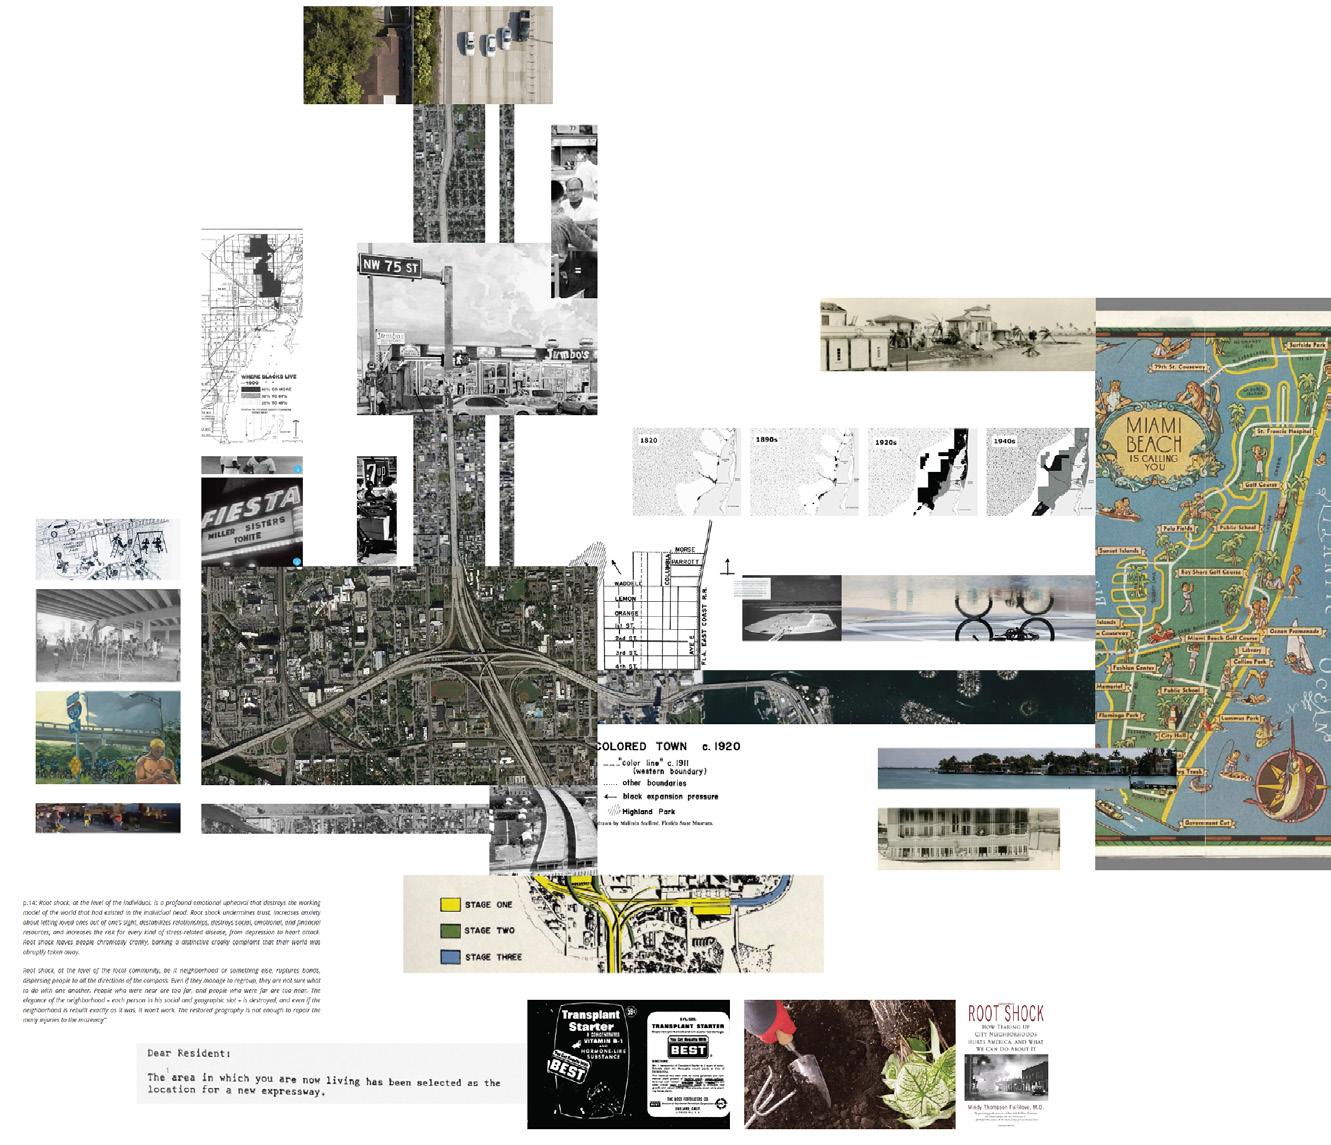
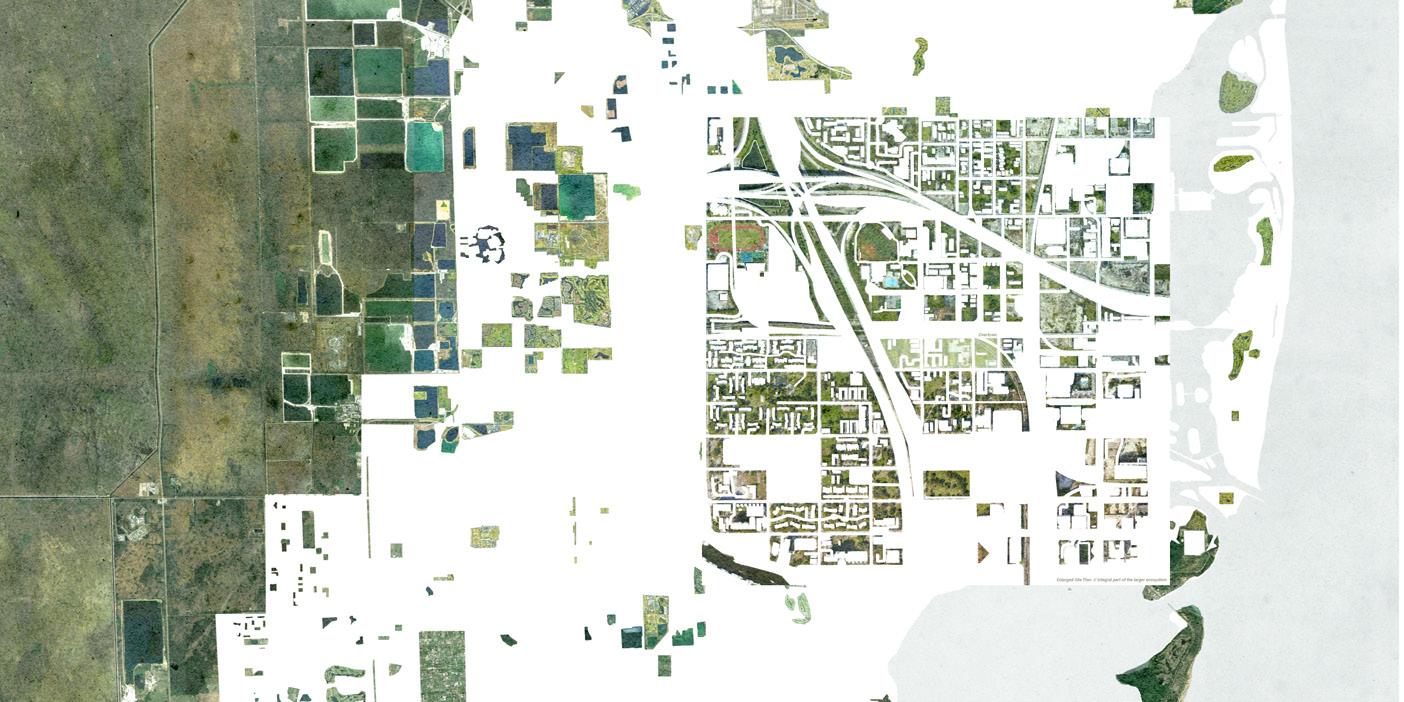
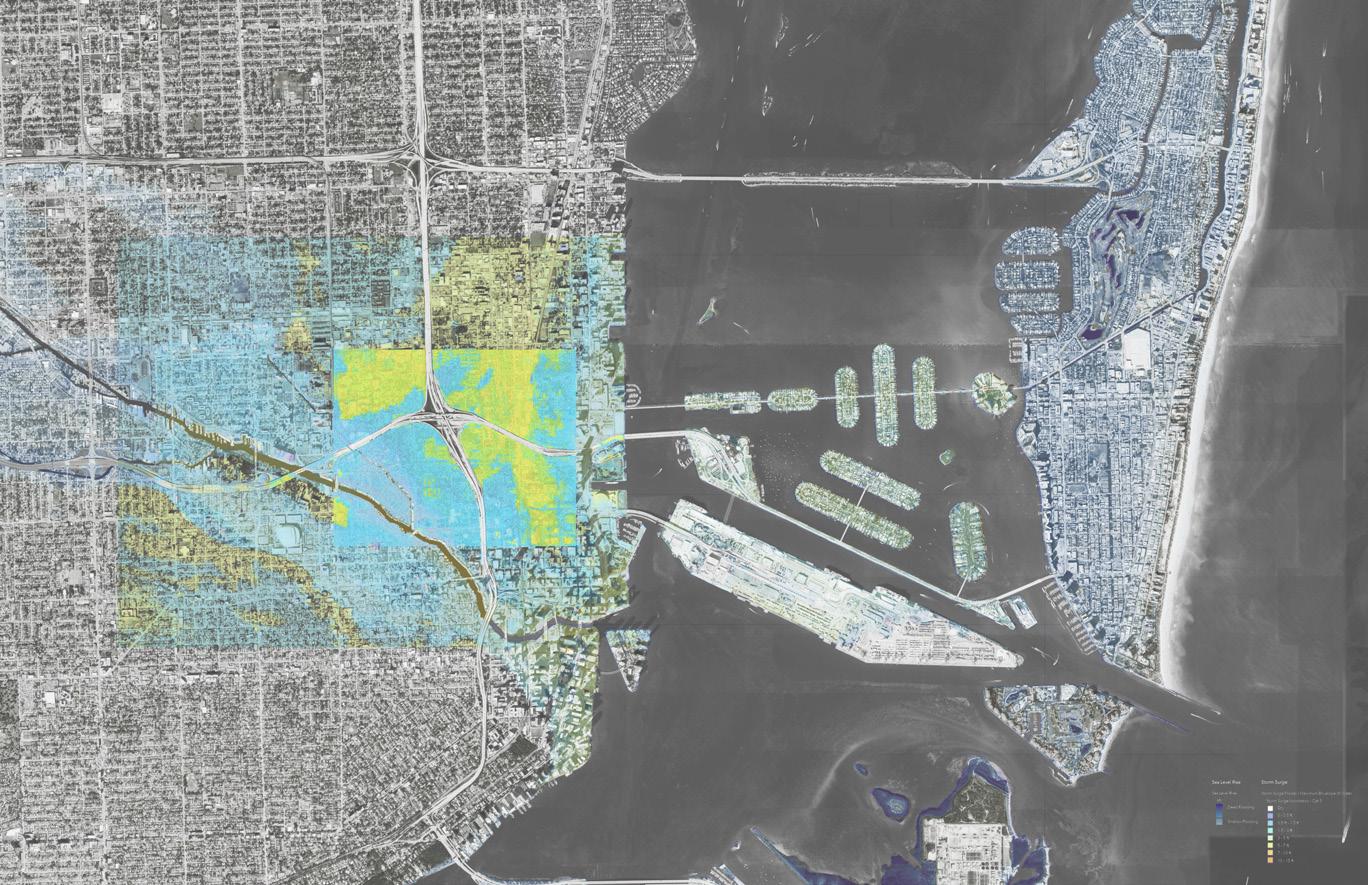
Situated between the Atlantic Ocean and the Everglades, Miami was once part of a vast wetland ecosystem. However, urbanization has significantly altered its natural water flow and ecology, transforming swamps into a structured urban landscape.
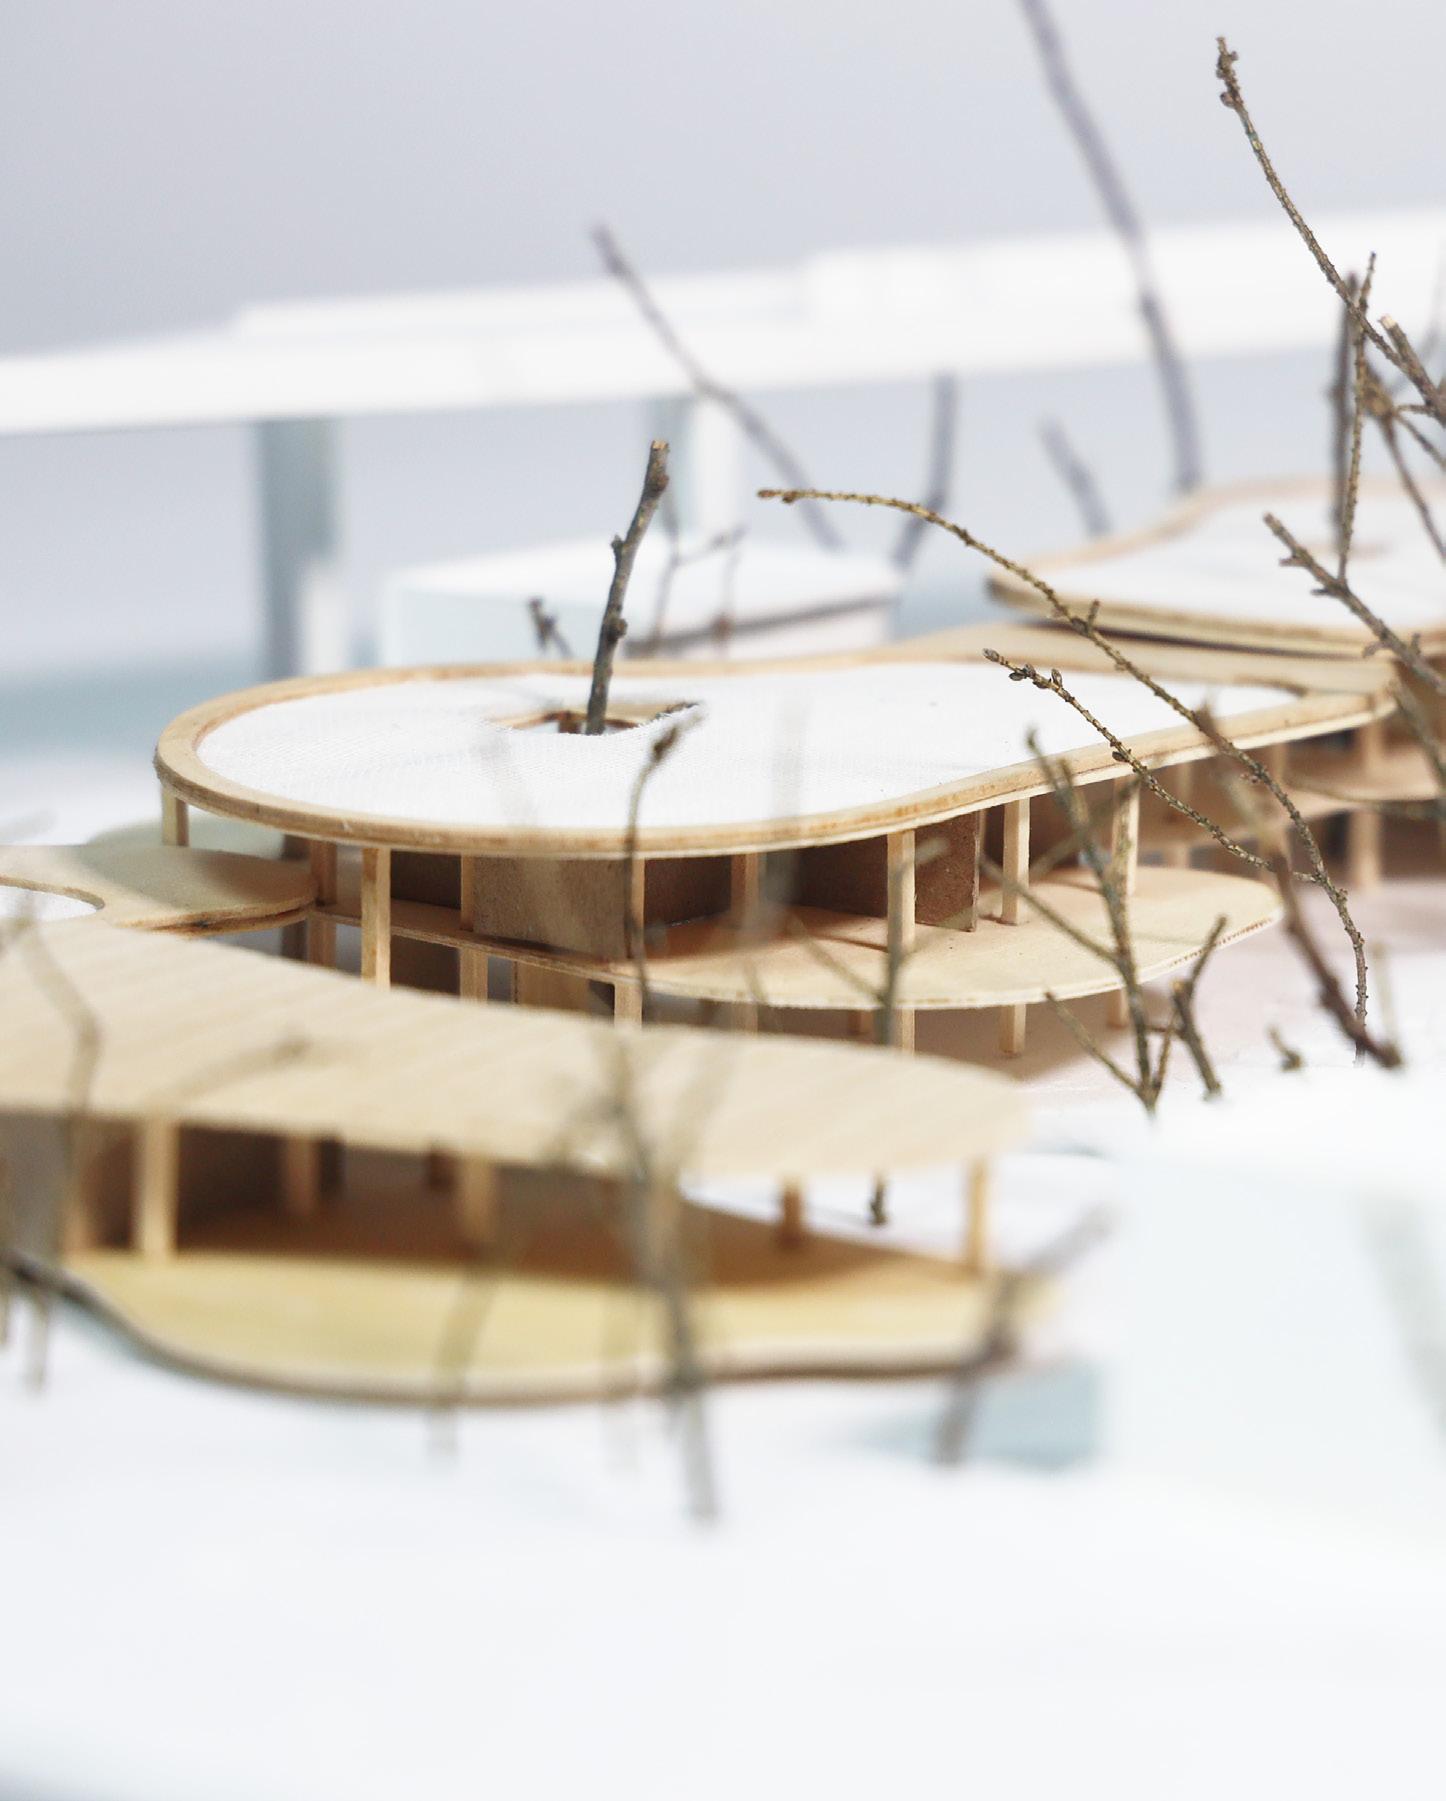
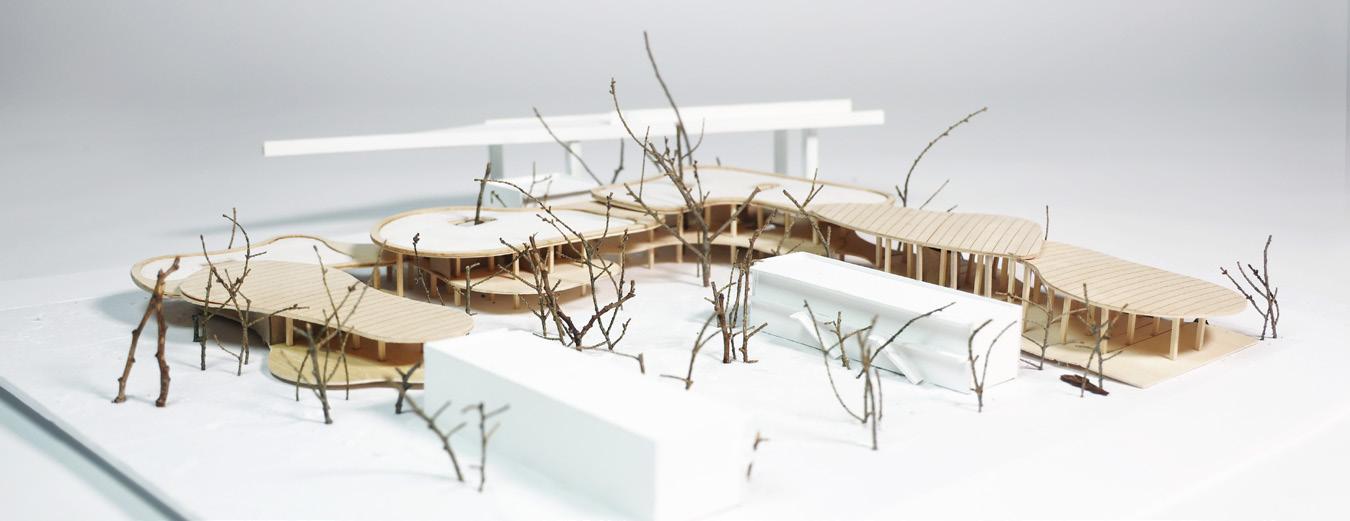
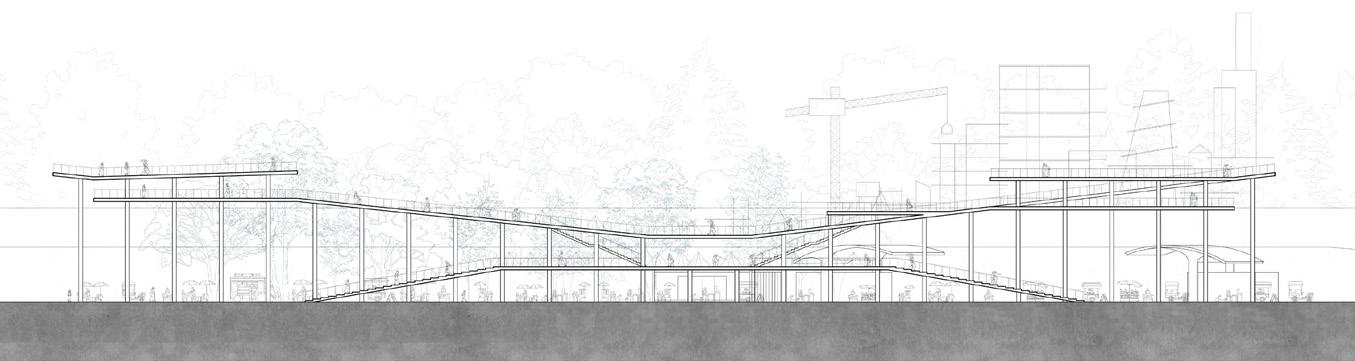
Responding to the ecological history and memory of Miami, we root our project on the land with an emphasis on environmental resilience. We elevate our intervention above land to leave space for the natural ground and space for the habitation of vegetation and animals, while also protecting the building from flooding and future sea level rising. As a second ground, the buildings construct land at different levels. If the original land would be eventually buried beneath the ocean, would the building turn into a new land, and relink the past and memory?
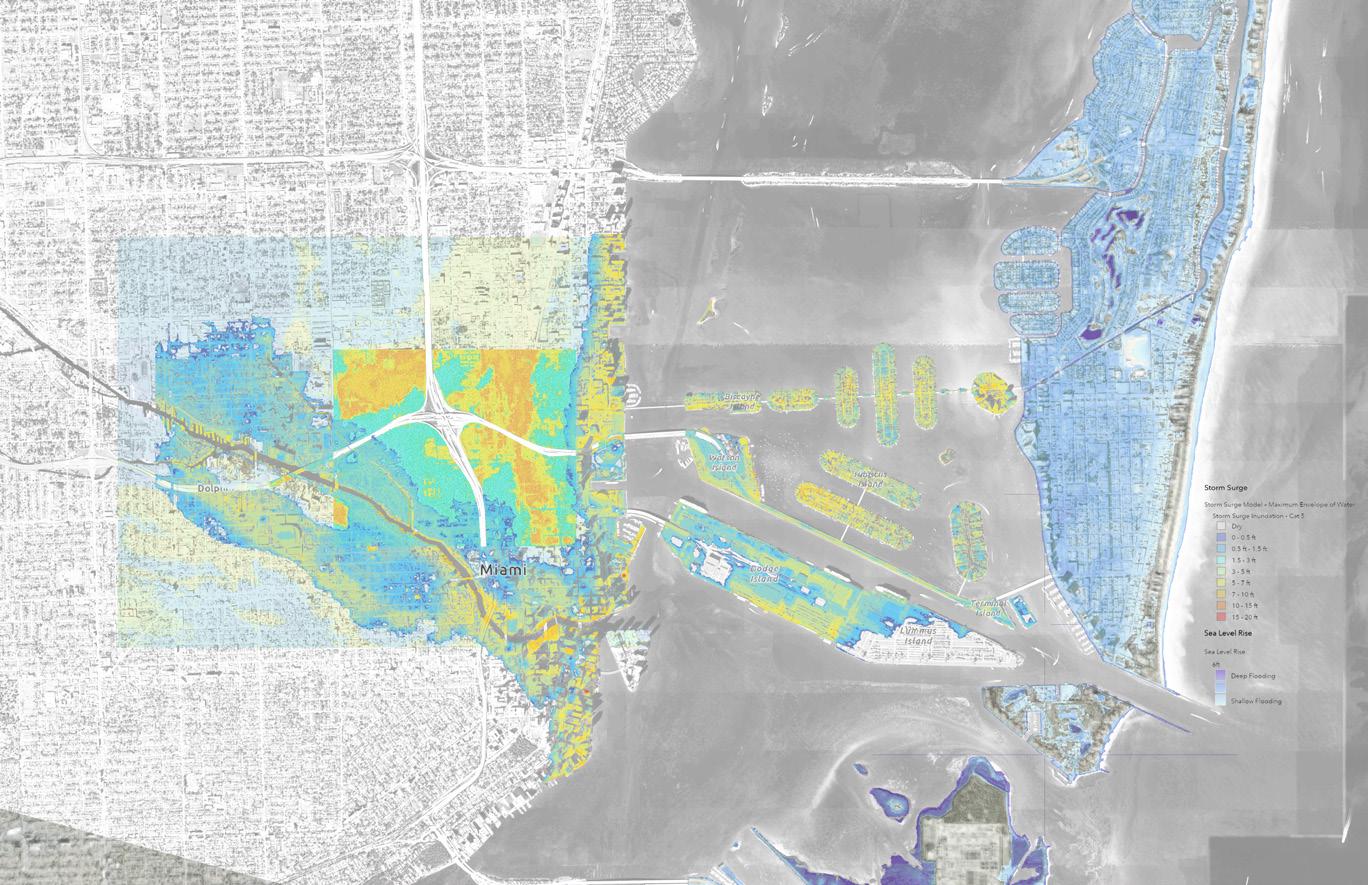
Environmental Risks: Sea Level Rising, Groundwater Pollution, and Saltwater Intrusion.
Situated between the Atlantic Ocean and the Everglades, Miami was once an integral part of a vast wetland ecosystem. However, extensive development and urbanization have drastically altered its natural water flow and ecology, transforming the once-thriving wetlands into a structured urban landscape.
I-95 Highway Development: Ecosystem Fragmentation and Community Division
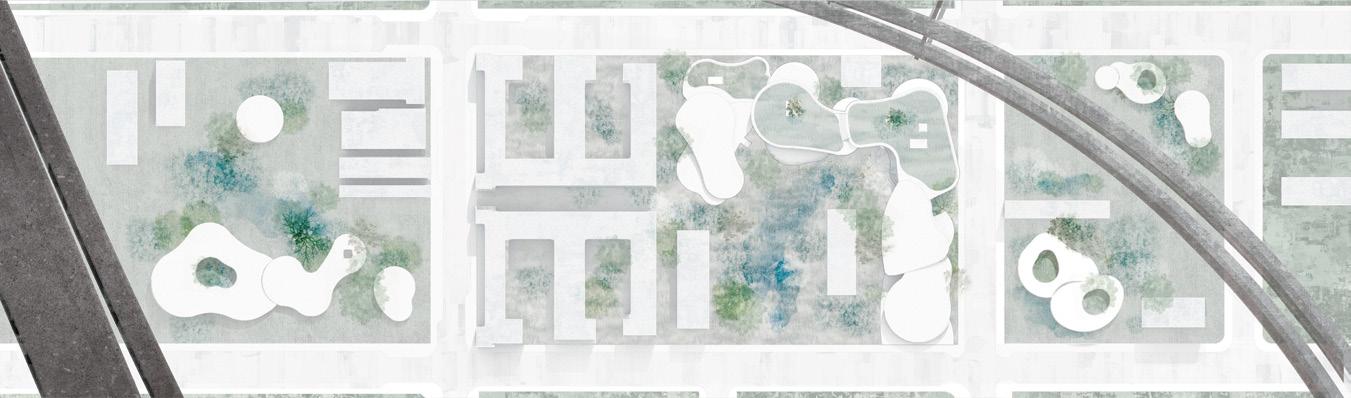
Proposal of Green Space & Stormwater Management in Overtown
Responding to the ecological history of Miami, we root our project on the land with an emphasis on environmental resilience. The site does not only serve as a water management infrastructure , but also a dynamic gallery of weather, water, and land, where the climate reveal themselves through the growth of vegetation, the condition of the soil.
Accessible Green Areas in Florida
Potential Environmental Emergencies in Miami
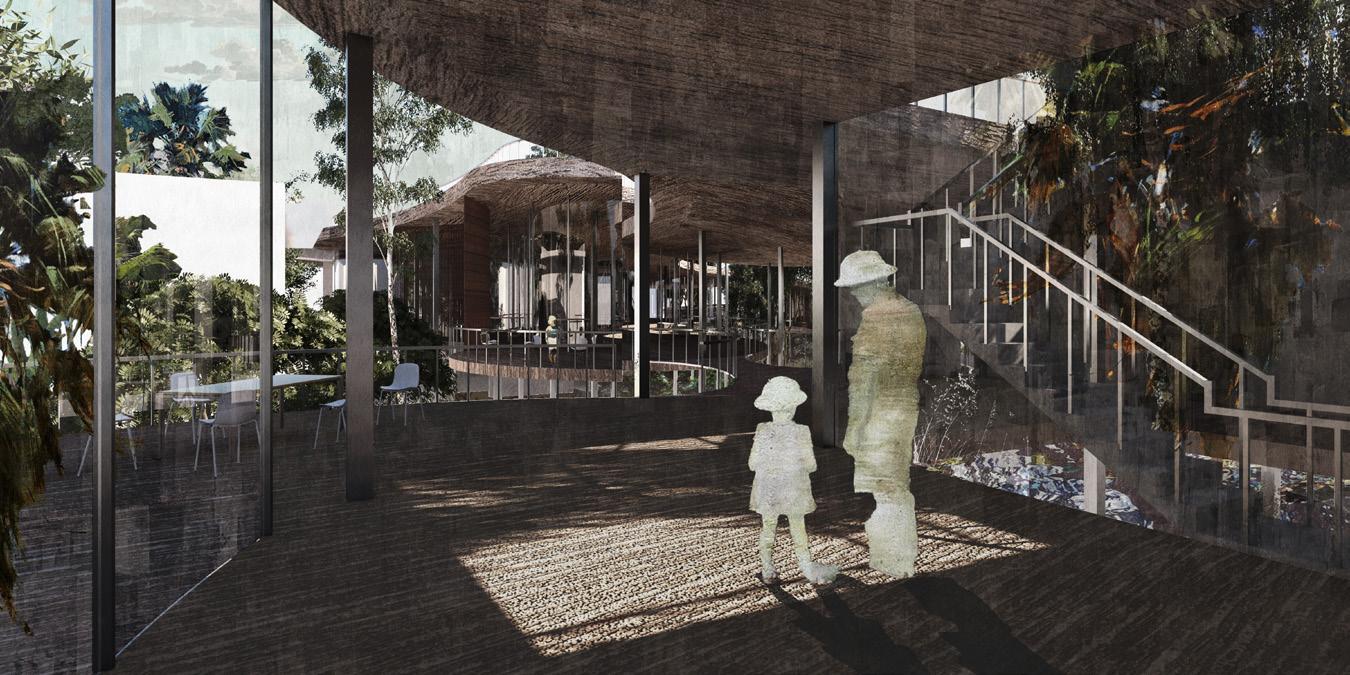
The ground floor is strategically designed within the urban garden and stormwater management area to enhance resilience in this space. The second floor serves as the “Second Ground,” safeguarding the building from flooding and potential sea levelrise. Its open structure also offers the potential for future development.
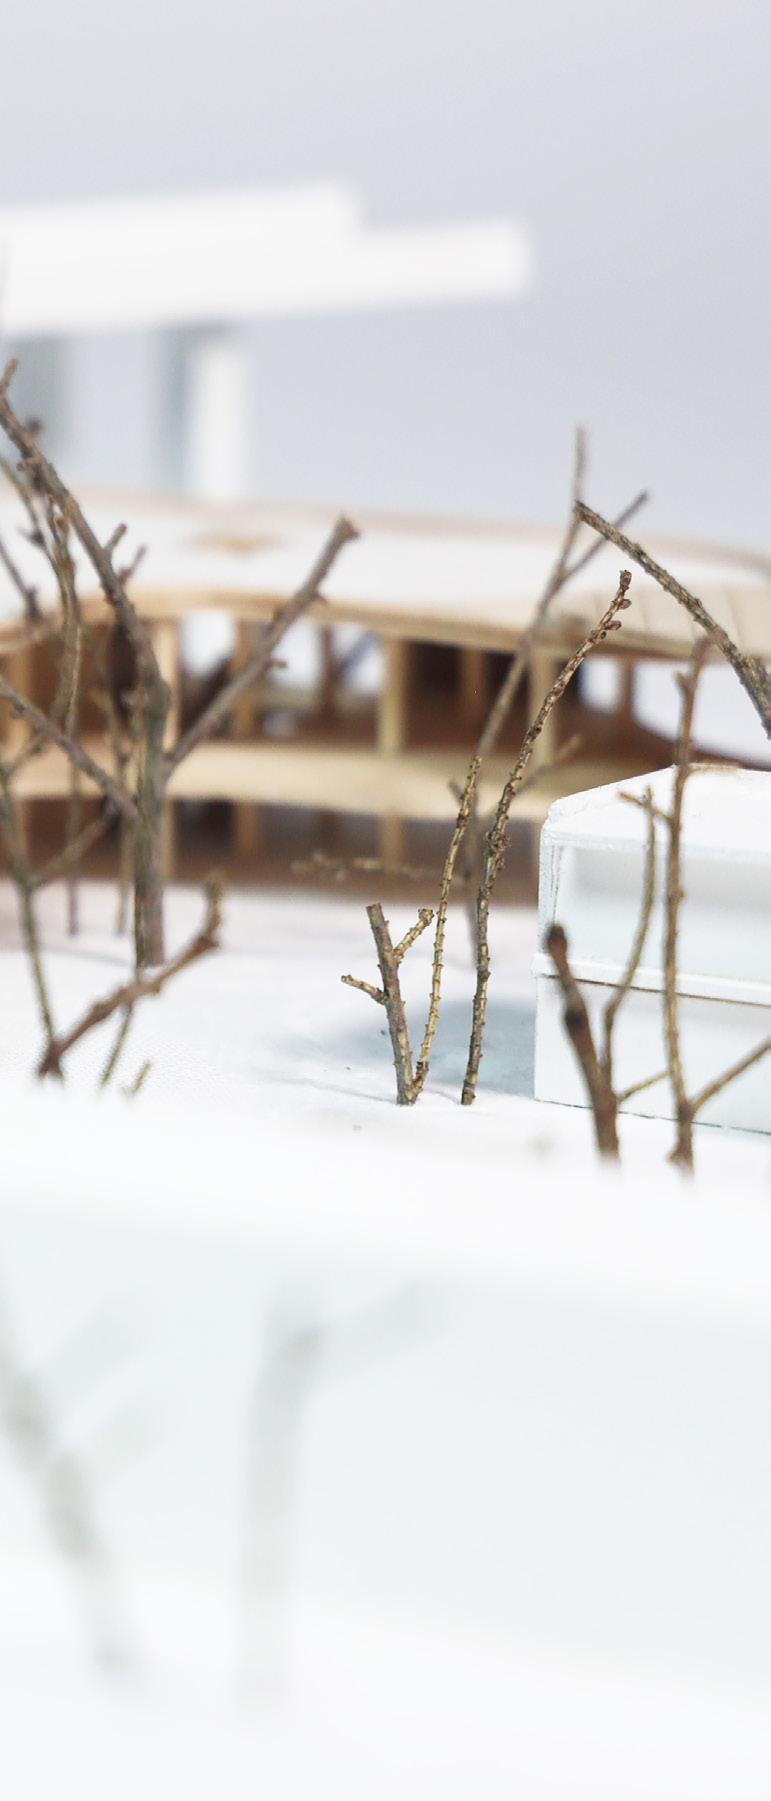
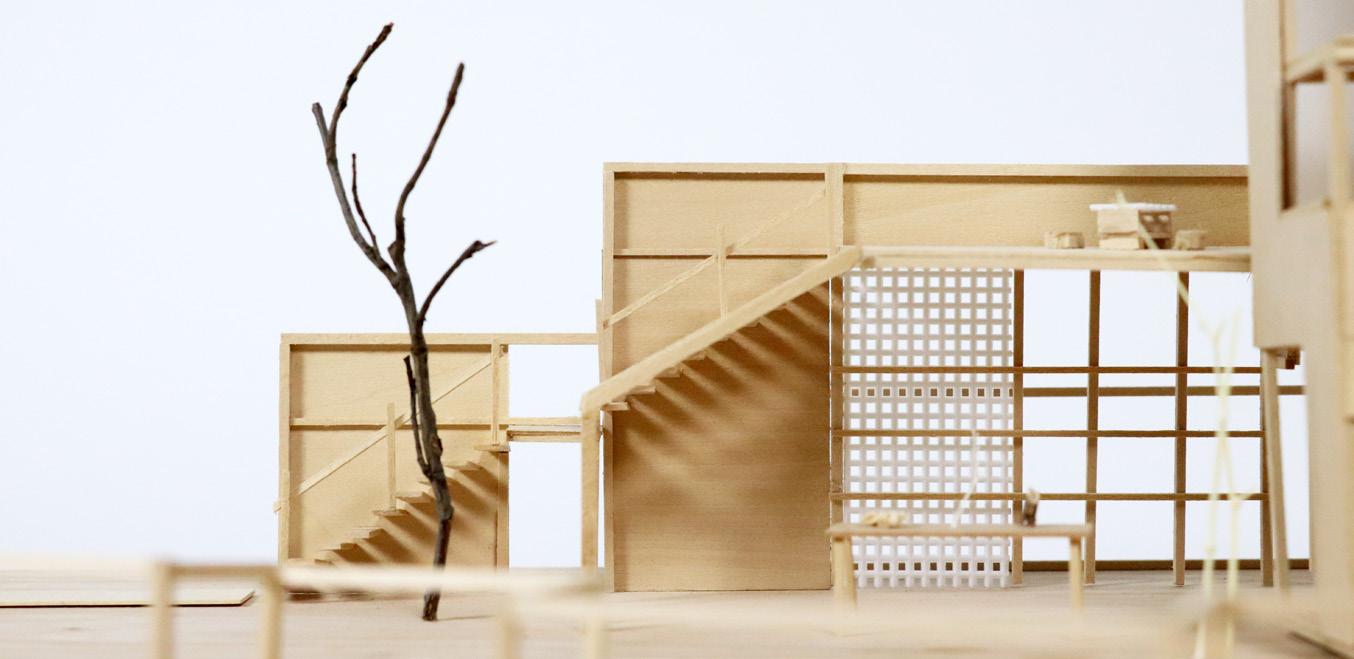
PHYSICAL MODEL
the building and its environment
AXON
of the “Second Ground” of
Photovoltaic Panels & Sunlight
PV panels are strategically installed on the south roof to maximize solar energy production while maintaining occupiable space and reducing site energy demands.
Rainwater Collection
Rainwater is filtered through the green and stored, and pumped for sanitary use and tainability by reducing reliance on external
Facade Setback Natural Ventilation
The southern facade is set back to reduce sunlight in hot seasons, creating outdoor space for activities and enhancing enjoyment of the natural landscape.
The open design promotes natural ventilation and passive cooling, crucial for Miami’s hot, humid climate. An elevated ground level enhances wind flow, further improving comfort and efficiency.
Dynamic shading
Dynamic shading use. By adjusting tect the library’s
and regular roofs, treated, and irrigation, promoting susexternal water sources.
shading
shading systems regulate natural light, reducing artificial lighting and energy adjusting to the sun’s position, they maintain comfort, prevent glare, and prolibrary’s collection from sunlight exposure.
Green Roof
The green roof provides a comfortable outdoor space with natural temperature regulation, reducing cooling demands due to its more stable temperature compared to indoor air.
Stormwater Management
Managing stormwater runoff reduces flooding risks, protects homes, and conserves water by collecting runoff for irrigation, groundwater recharge, or non-potable uses, lessening reliance on municipal water supplies.
HOUSE TRI
Lightness / Fall 2021
(ARCH2101 - DESIGN III)
Individual Work
Instructor: Roz Barr
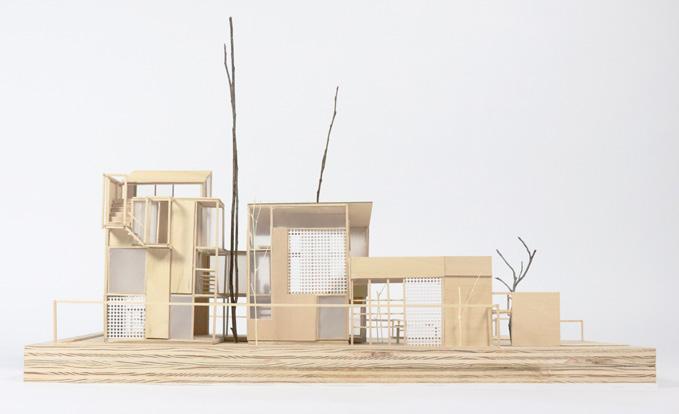
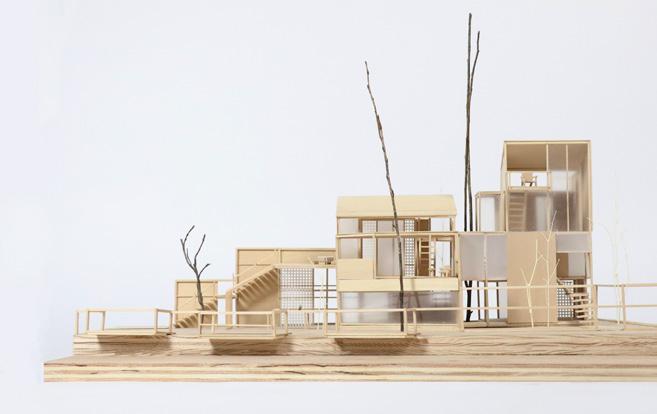
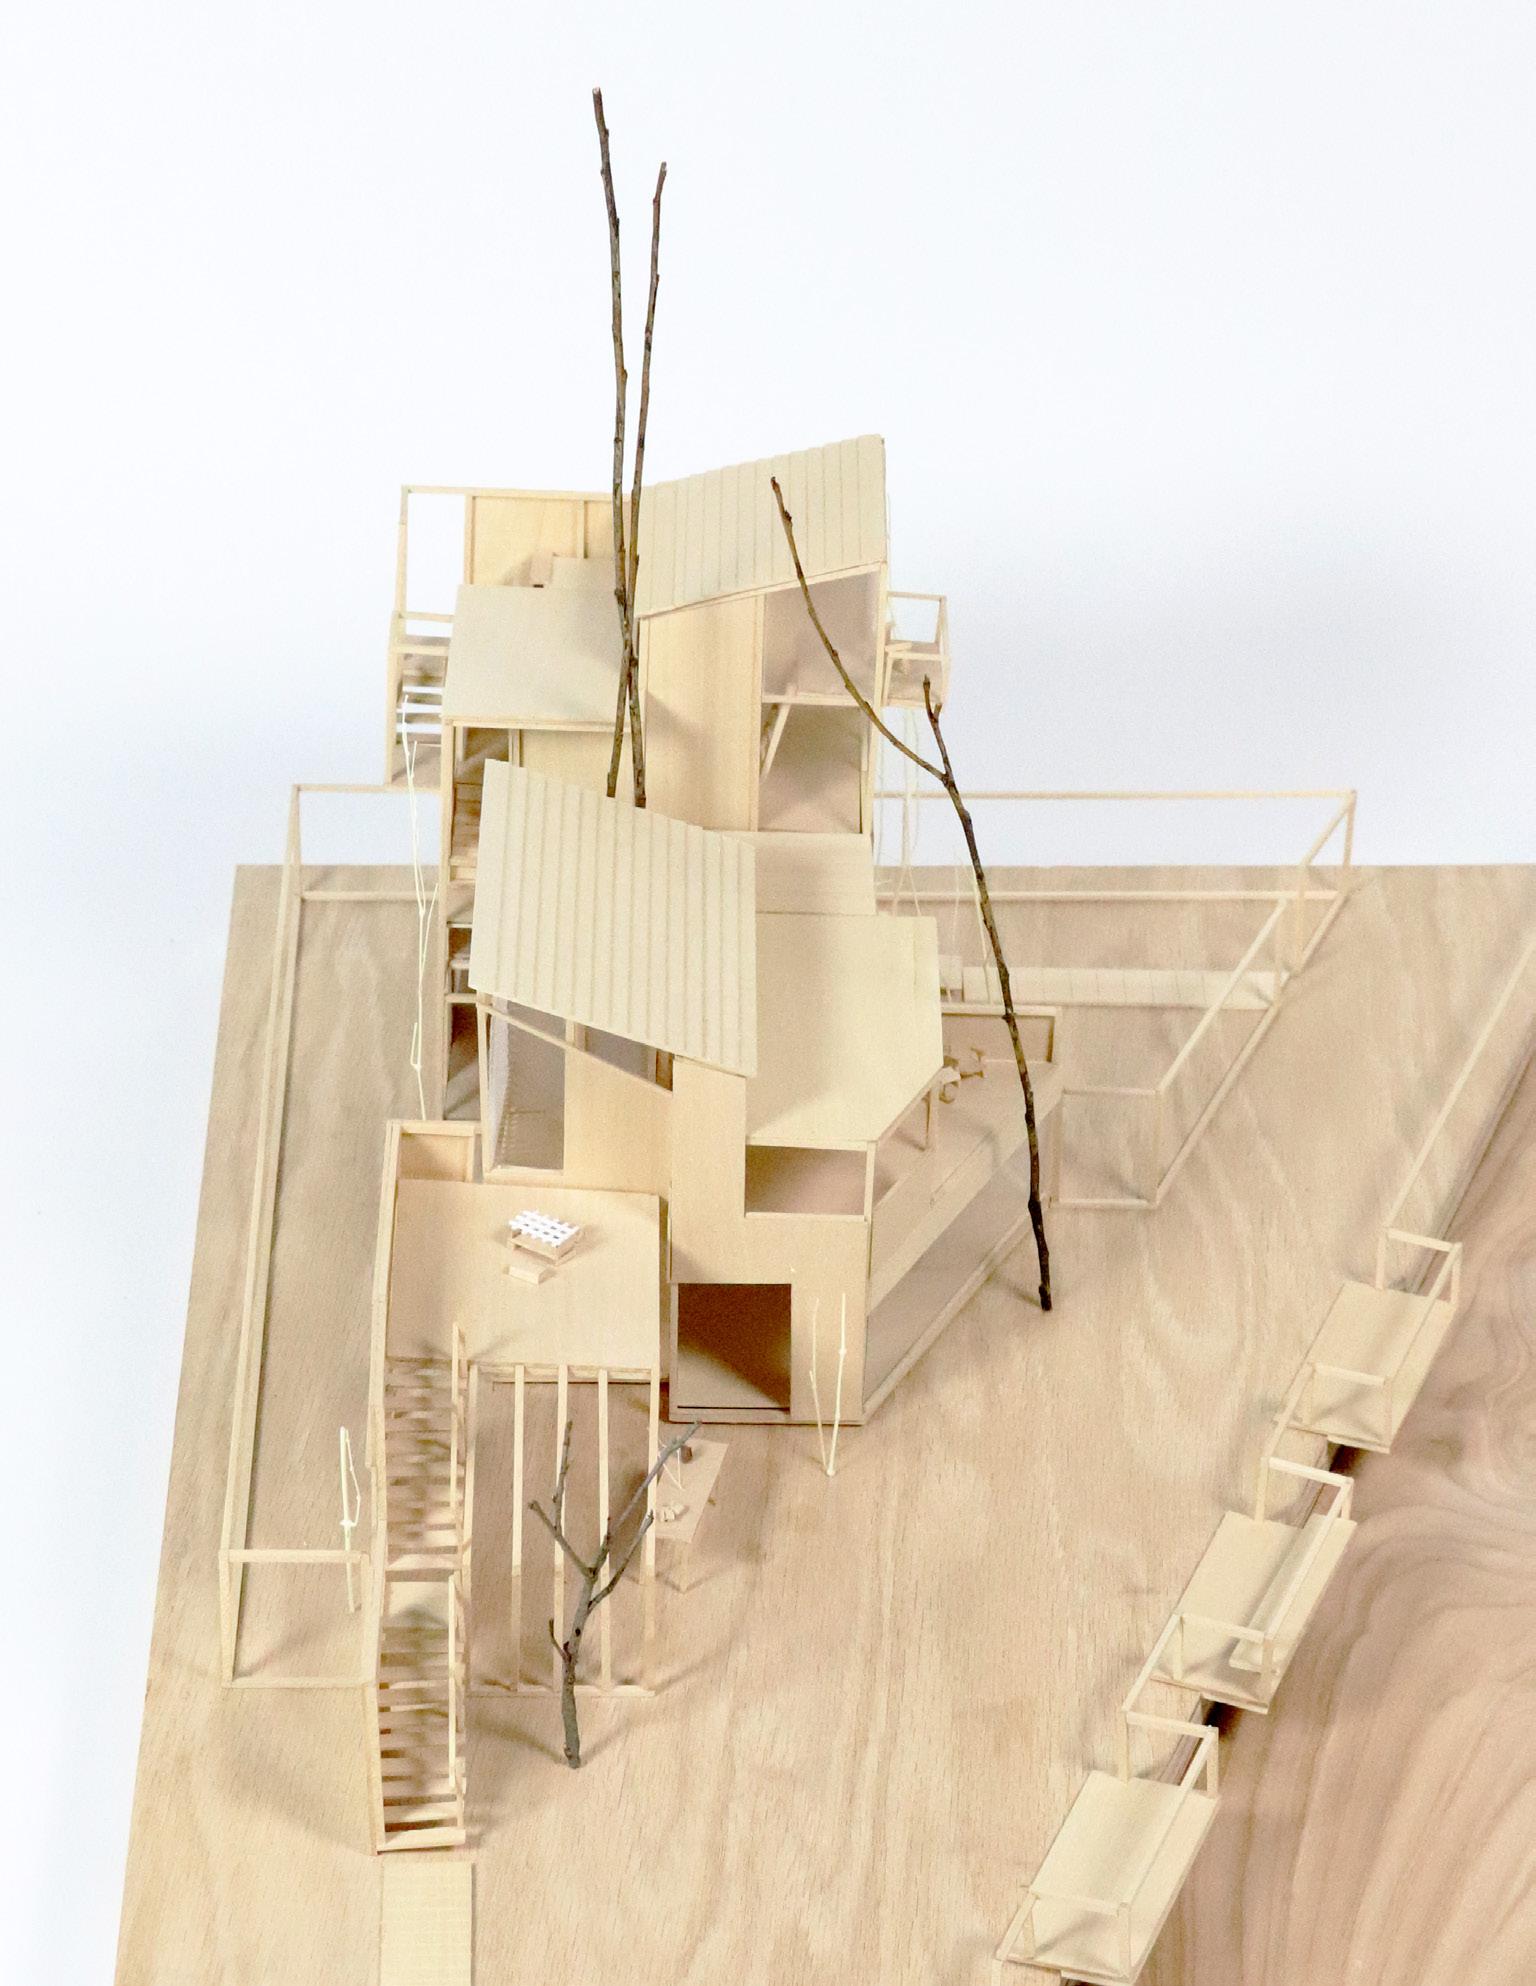
Located in Ithaca, New York, this project is a residential housing design for a family of a carpenter, a child, and a dog. Blending public and private functions, it serves as both a workshop and home. The concept of “in-between” moments, or “tri-status,” explores transitions between work and home, personal spaces for each family member, and connections to nature. Emphasizing “lightness,” the design optimizes fenestration and facade materials to balance light, privacy, functionality, and aesthetic harmony.
Concept, drawing, and Model Making
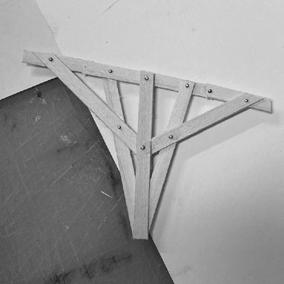
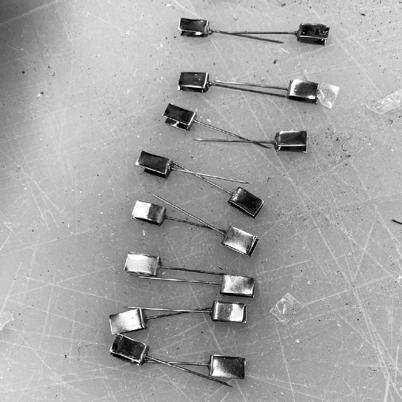
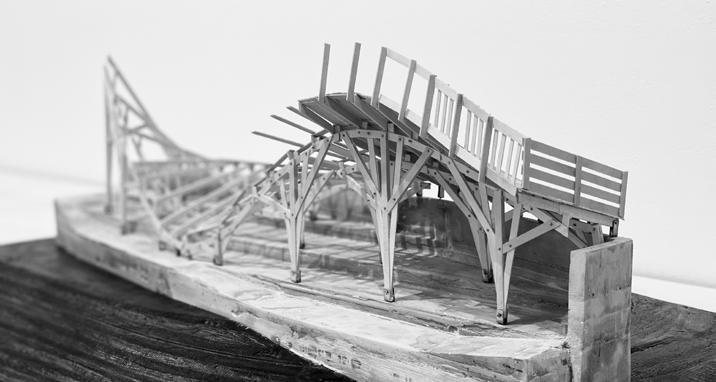
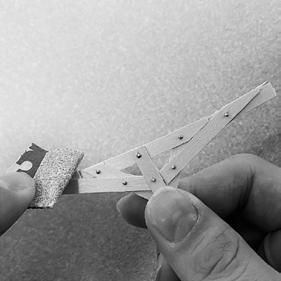
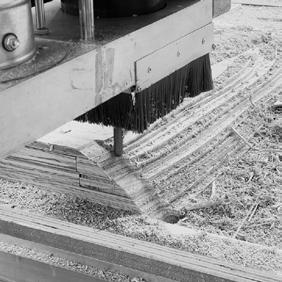
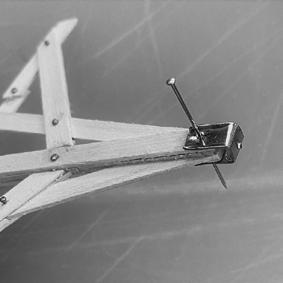
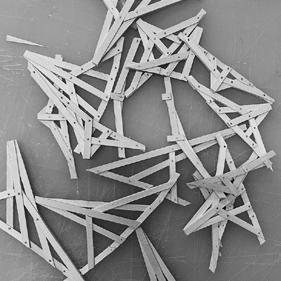
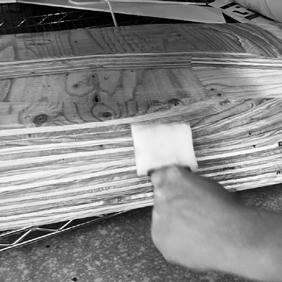
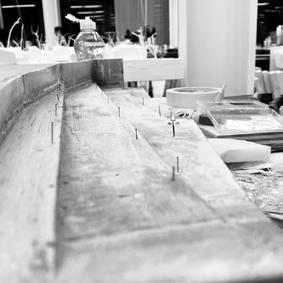
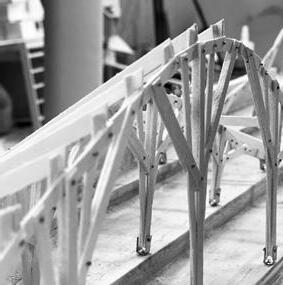
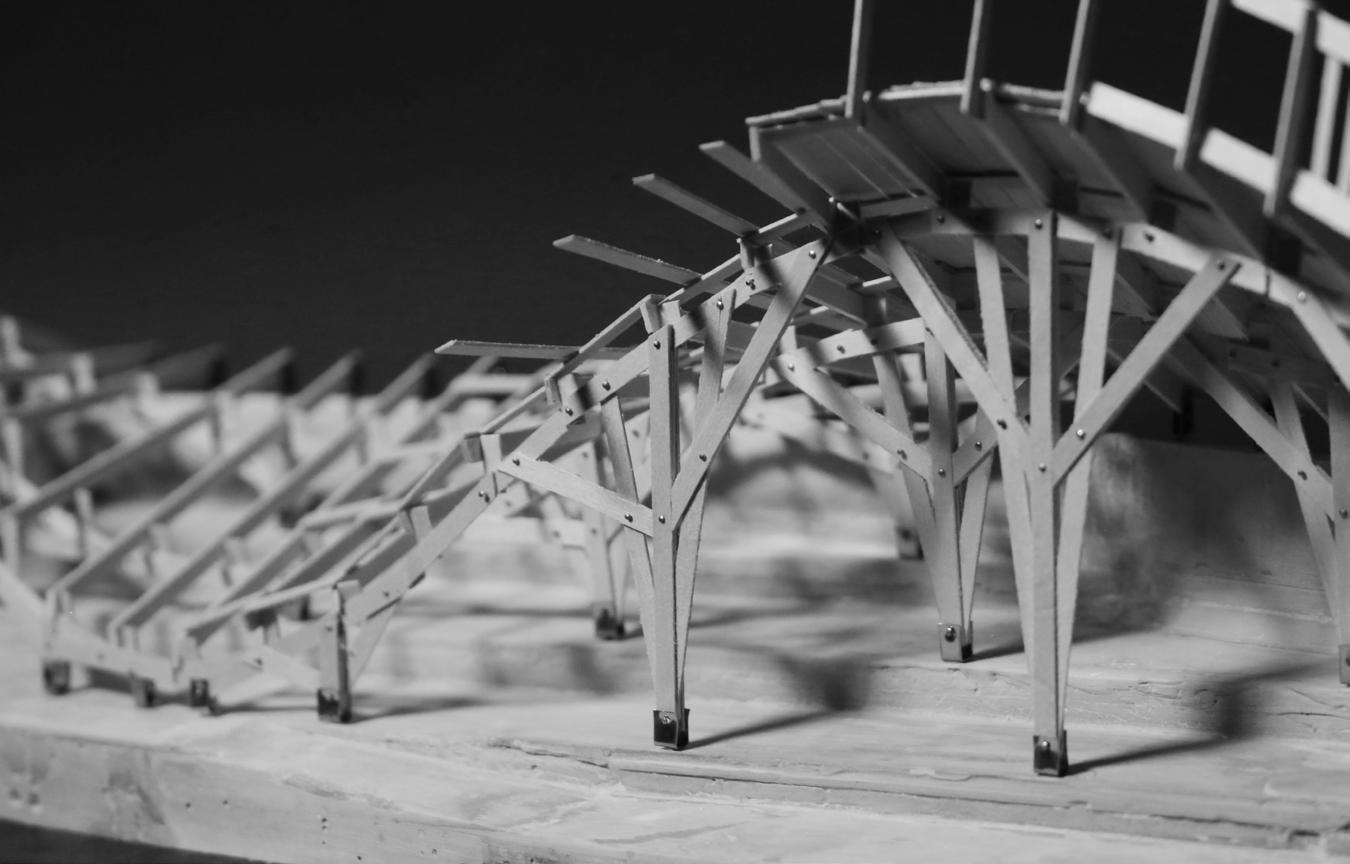
THE WARP
Structure Model Study / Fall 2021 (ARCH2613 - Structure Systems)
Group Work with Jiayu Su and Xuanyin Lin
Instructor: Mark R. Cruvellier
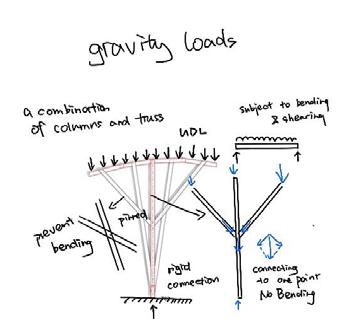
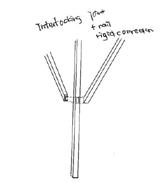
REASON OF DECISION
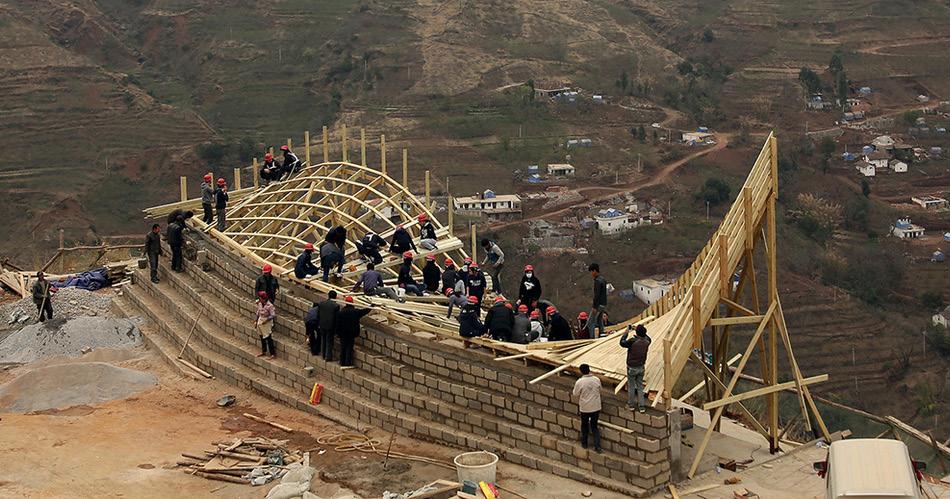
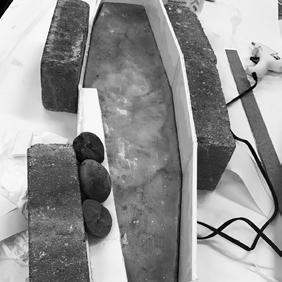
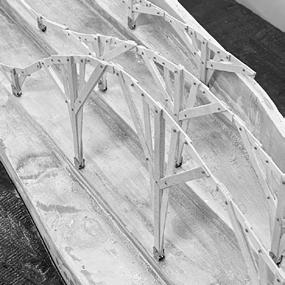
PROCESS PHOTOS
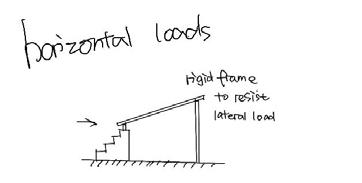
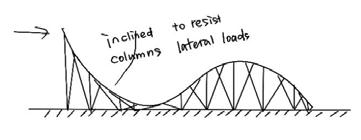
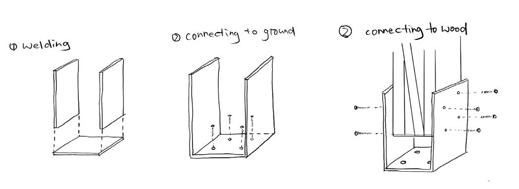
Research on Structure System
REASON OF DECISION
ORIGINAL WORK BY OLIVIER OTTEVAERE & JOHN LIN + THE UNIVERSITY OF HONG KONG
Original Structure
ABOVE GROUND
Open Monument / Fall 2023 (ARCH4101 - DESIGN VII)
Individual Work
Instructor: John Zissovici
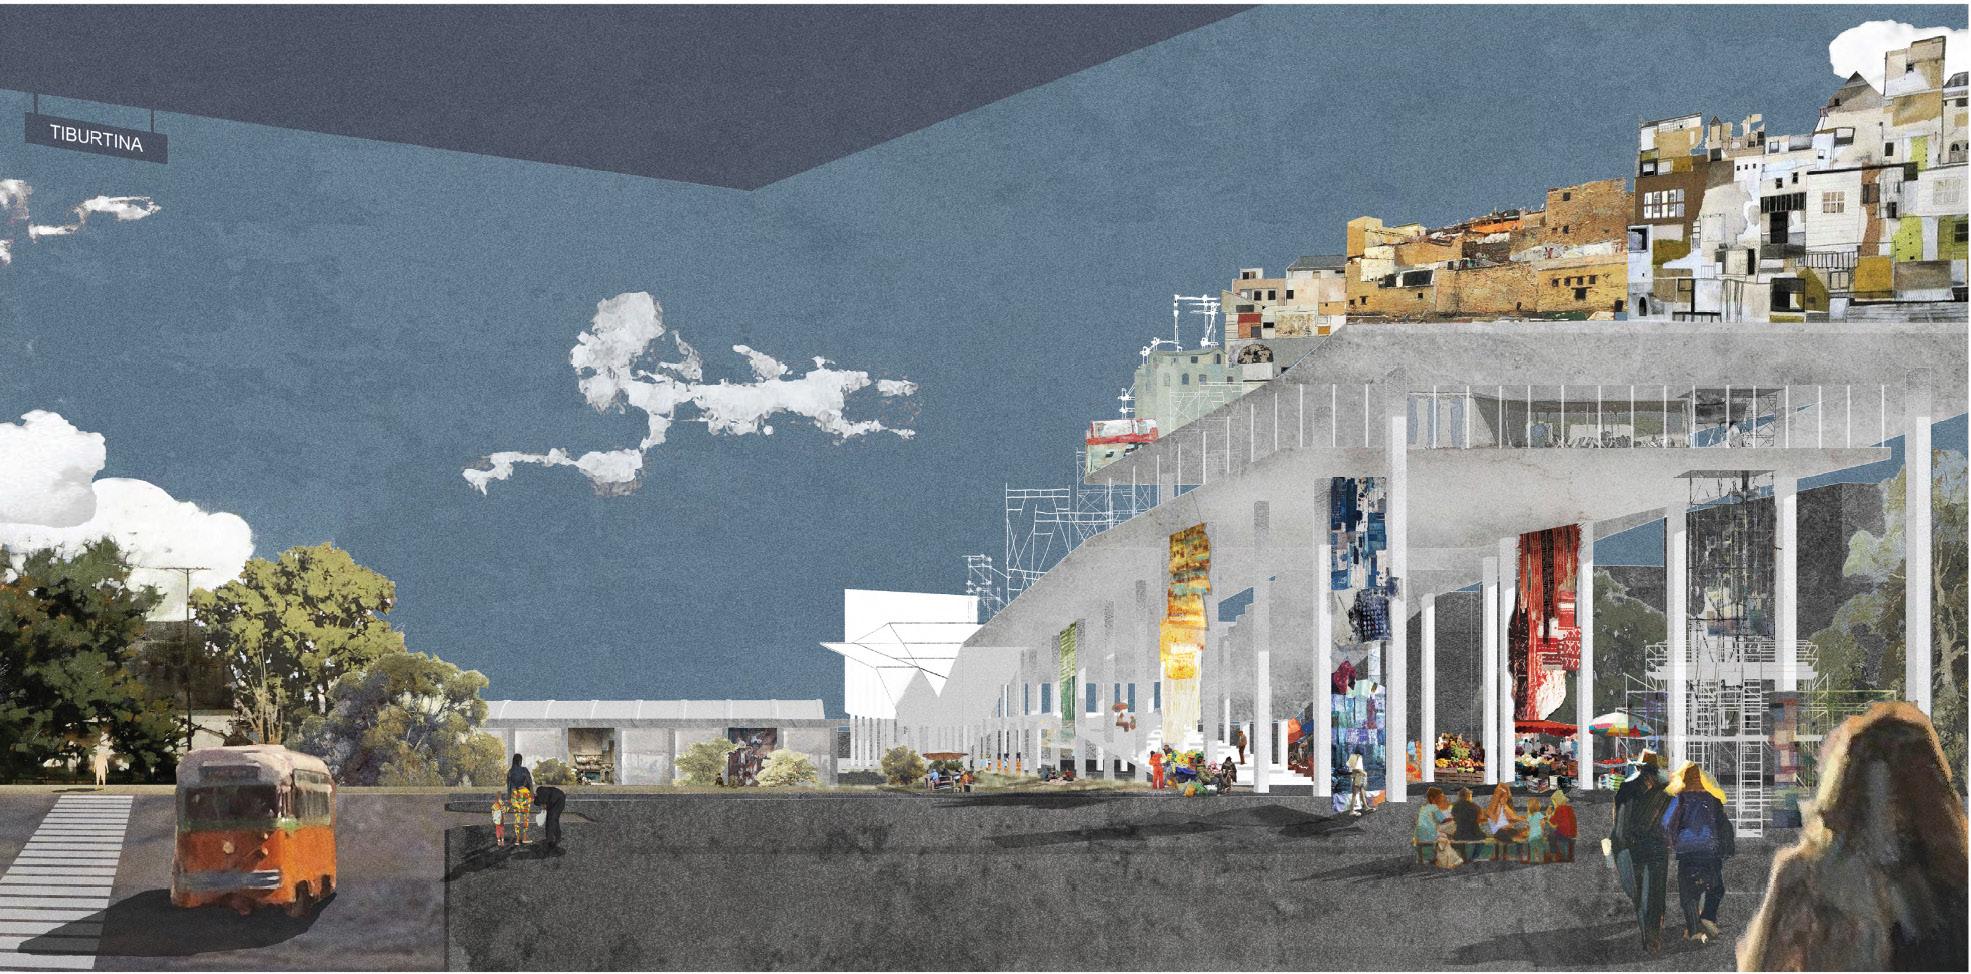
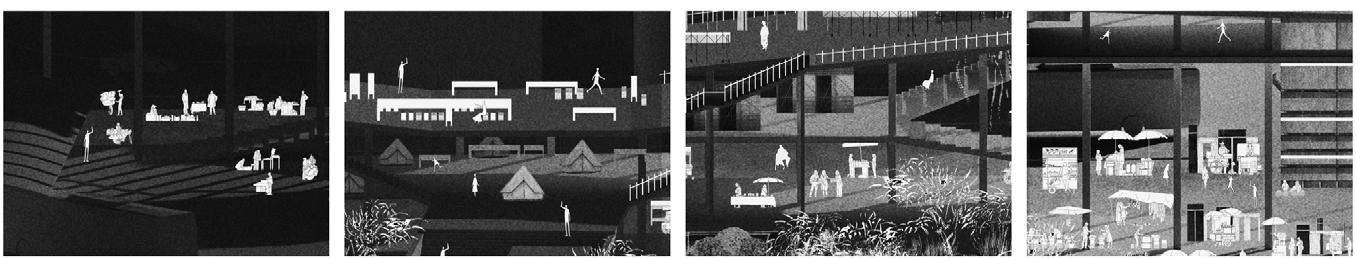
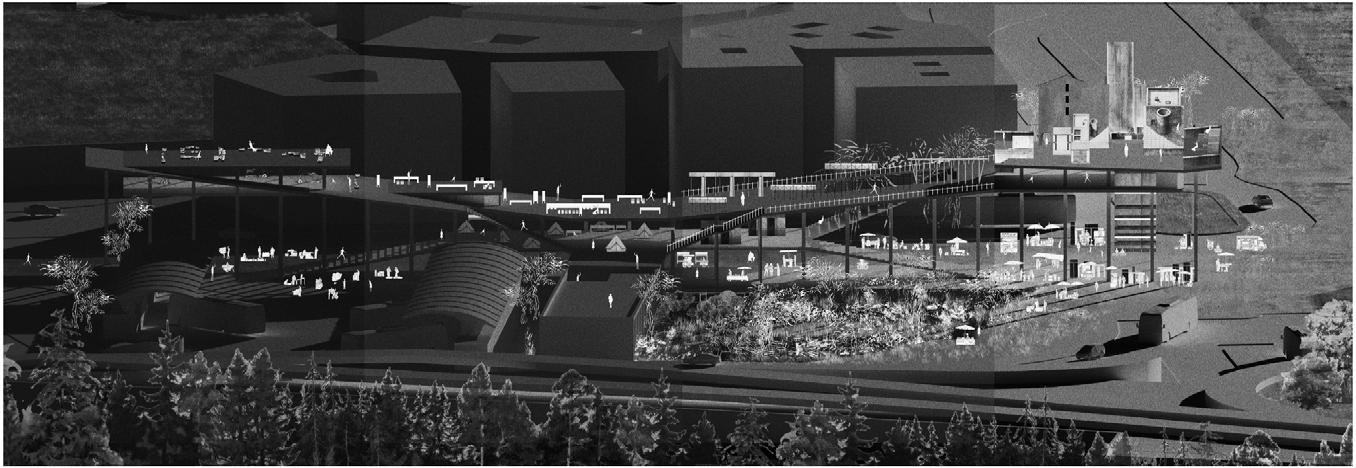
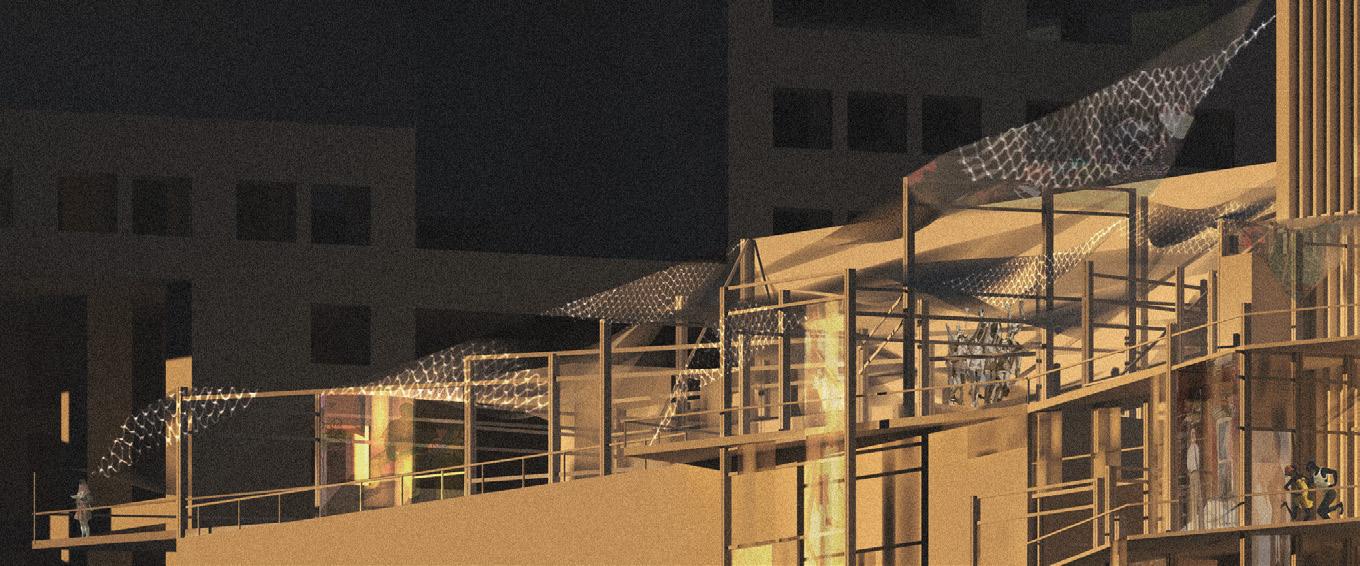
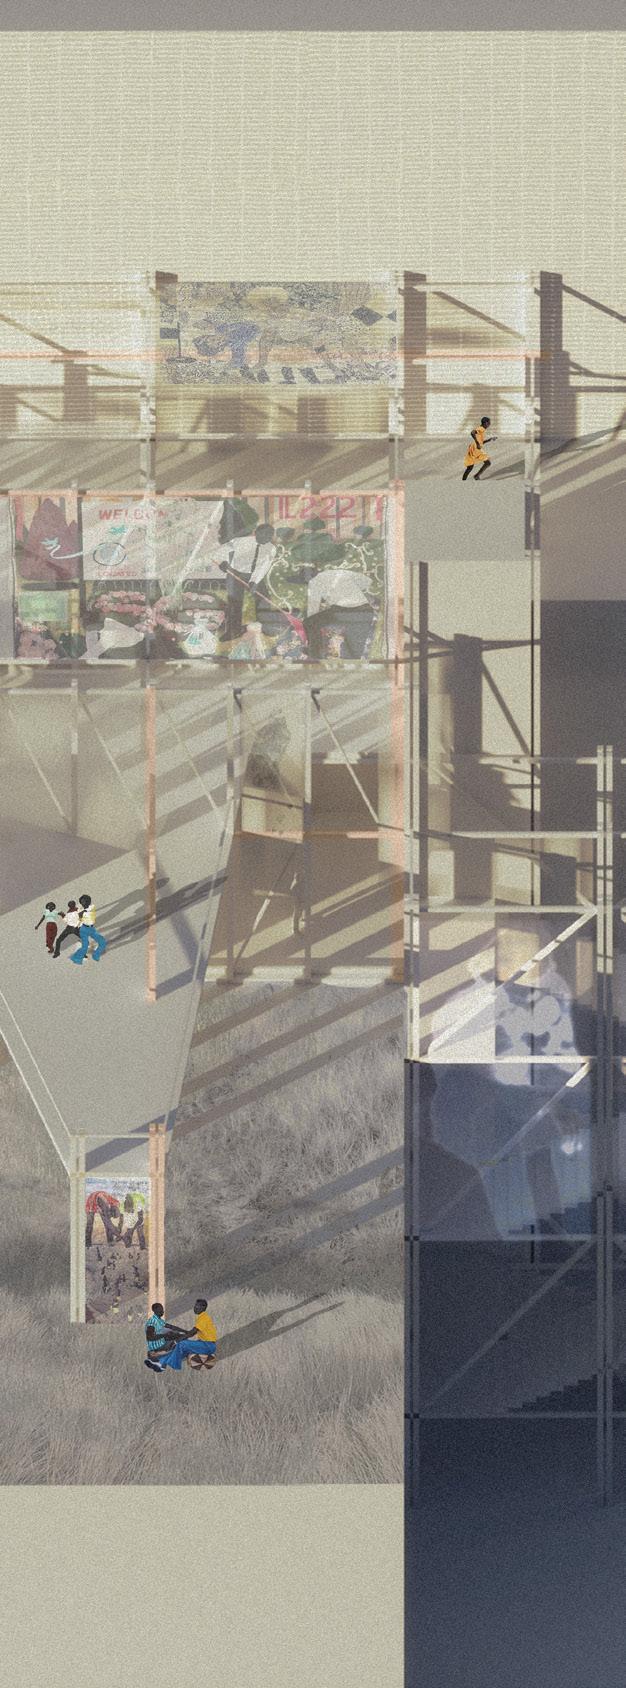
Tiburtina Station, a key transportation hub in Rome, often serves as the first arrival point and temporary settlement for migrants. Surrounded by highways and walls, the site reflects both physical boundaries and Rome’s inhospitable policies. This project proposes a new ground where migrants can construct their own dwellings, symbolizing a “Tower of Babel” for new beginnings. Beneath, a market fosters interaction between locals and migrants, while amenities in sunken areas meet basic needs, creating a monument of hope and integration.
Curvature, Structure, and Monument
View from Tiburtina Station
Market Moments Monument Evolution
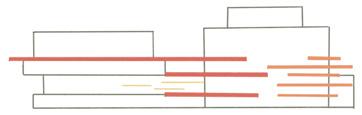
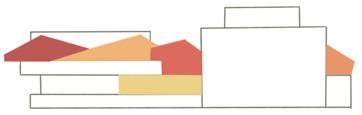
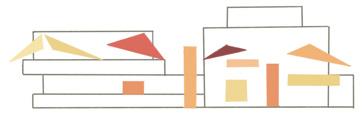
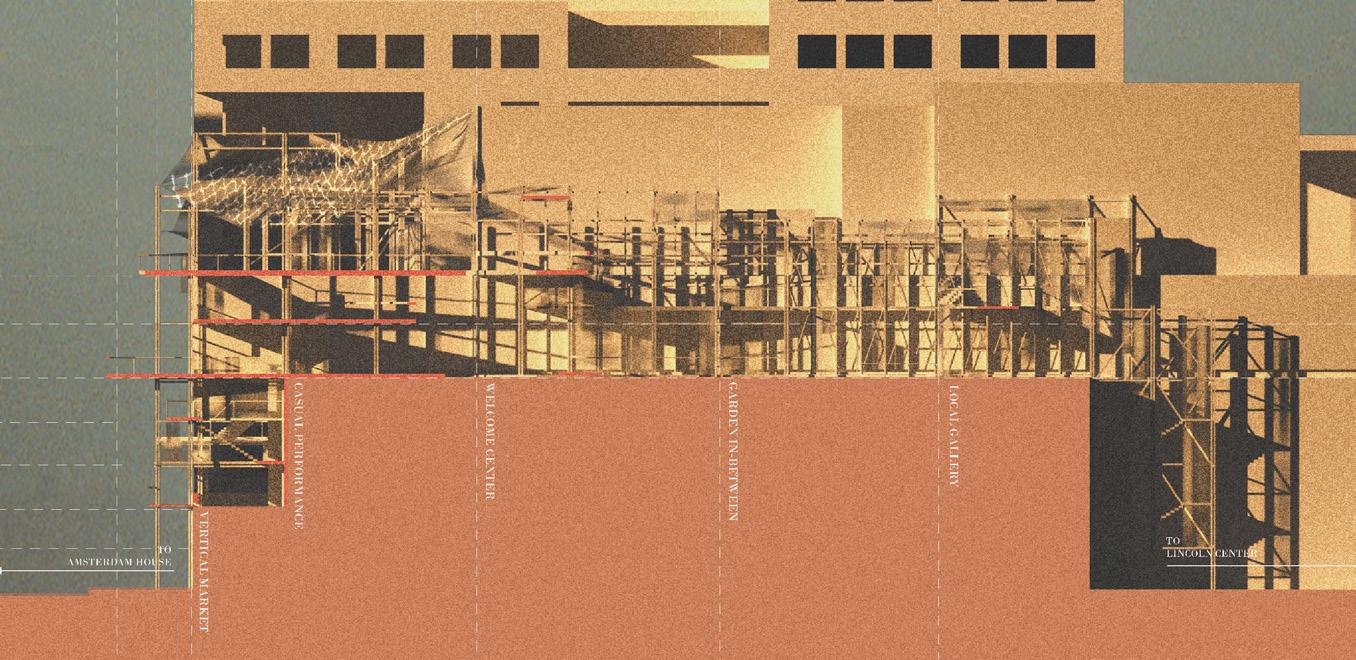
MESHES
Individual Work
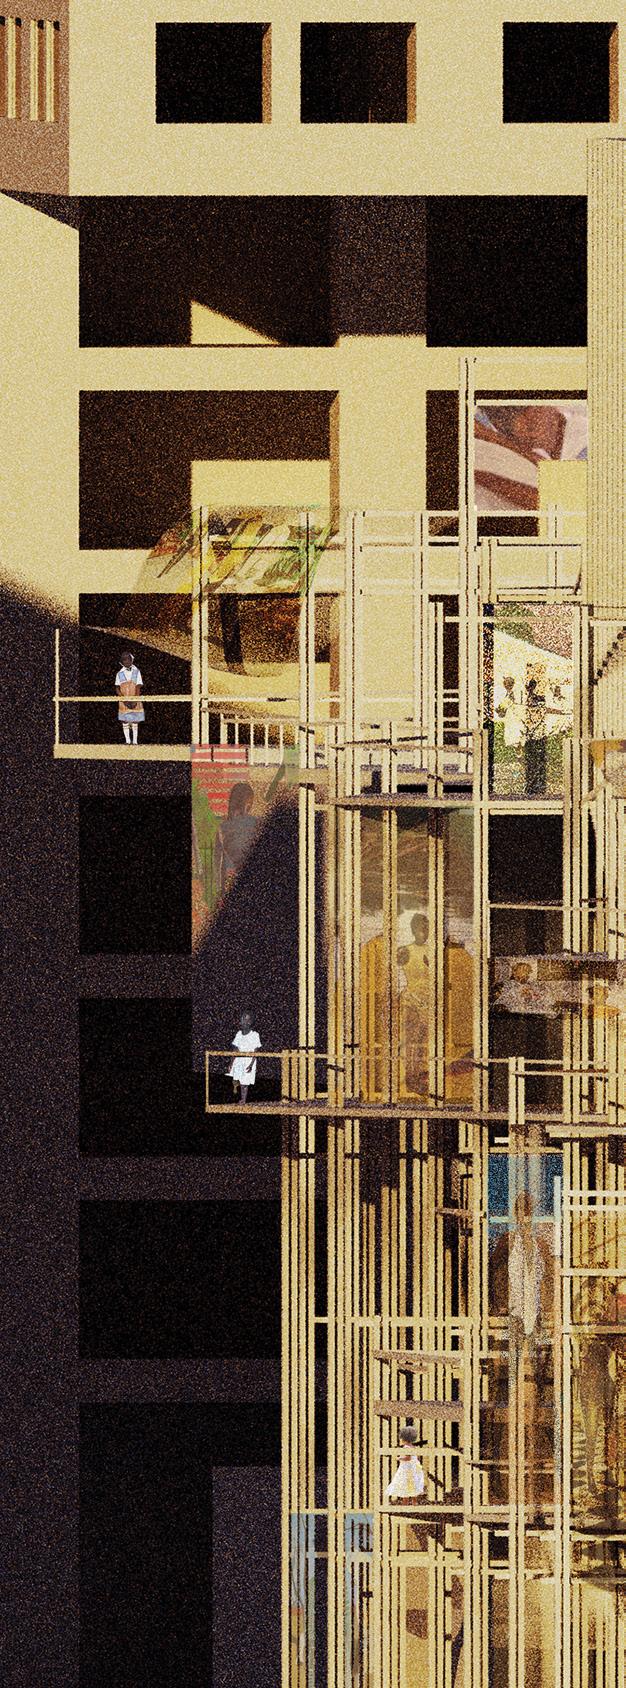
Instructor: Syndey Maubert Public, Service / Fall 2022 (ARCH3101 - DESIGN V)
This project challenges Lincoln Center’s monumental architecture by reconstructing the abandoned spaces between its massive structures, questioning whether architectural gigantism serves culture or authority. It seeks to revive the cultural identity of San Juan Hill and restore a sense of place through a timber-mesh construction that reshapes vertical and horizontal divisions. Timber frames provide structural grounding, while meshes display neighborhood art and statements. By reversing spatial and political hierarchies, the project explores architecture as a subtle form of rebellion and cultural revival.