


San Francisco Bay Area


District 1 - Northwest
Sea Cliff, Lake Street, Richmond (Inner, Central, Outer), Jordan Park/Laurel Heights, Lone Mountain
Jump to District 1 - Northwest
2 - West
Sunset & Parkside (Inner, Central, Outer), Golden Gate Heights
Jump to District 2 - West
District 3 - Southwest
Lake Shore, Lakeside, Merced Manor, Merced Heights, Ingleside, Ingleside Heights, Oceanview
Jump to District 3 - Southwest
District 4 - Central SW
St. Francis Wood, Forest Hill, West Portal, Forest Knolls, Diamond Heights, Midtown Terrace, Miraloma Park, Sunnyside, Balboa Terrace, Ingleside Terrace, Mt Davidson Manor, Sherwood Forest, Monterey Heights, Westwood Highlands
Jump to District 4 - Central SW
5 - Central
Noe Valley, Eureka Valley/Dolores Heights (Castro, Liberty Hill), Cole Valley, Glen Park, Corona Heights, Clarendon Heights, Ashbury Heights, Buena Vista Park, Haight Ashbury, Duboce Triangle, Twin Peaks, Mission Dolores, Parnassus Heights
Jump to District 5 - Central

Hayes Valley, North of Panhandle (NOPA), Alamo Square, Western Addition, Anza Vista, Lower Pacific Heights
Jump to District 6 - Central North
Pacific Heights, Presidio Heights, Cow Hollow, Marina
Jump to District 7 - North
Russian Hill, Nob Hill, Telegraph Hill, North Beach, Financial District, North Waterfront, Downtown, Van Ness/Civic Center, Tenderloin
Jump to District 8 - Northeast
SoMa, South Beach, Mission Bay, Potrero Hill, Dogpatch, Bernal Heights, Inner Mission, Yerba Buena
Jump to District 9 - East
Bayview, Bayview Heights, Excelsior, Portola, Visitacion Valley, Silver Terrace, Mission Terrace, Crocker Amazon, Outer Mission
Jump to District 10 - Southeast
That's the question you should be asking yourself.
Our market is incredibly diverse and rapidly changing. Values vary not just by neighborhood but by street. Your home isn't necessarily worth what your neighbors' home is. It's the current market that sets the value of your home.
So, do you know what your home is worth in today's market?
Icanhelp...
Contact me for a confidential, no obligation assessment of your home's value.

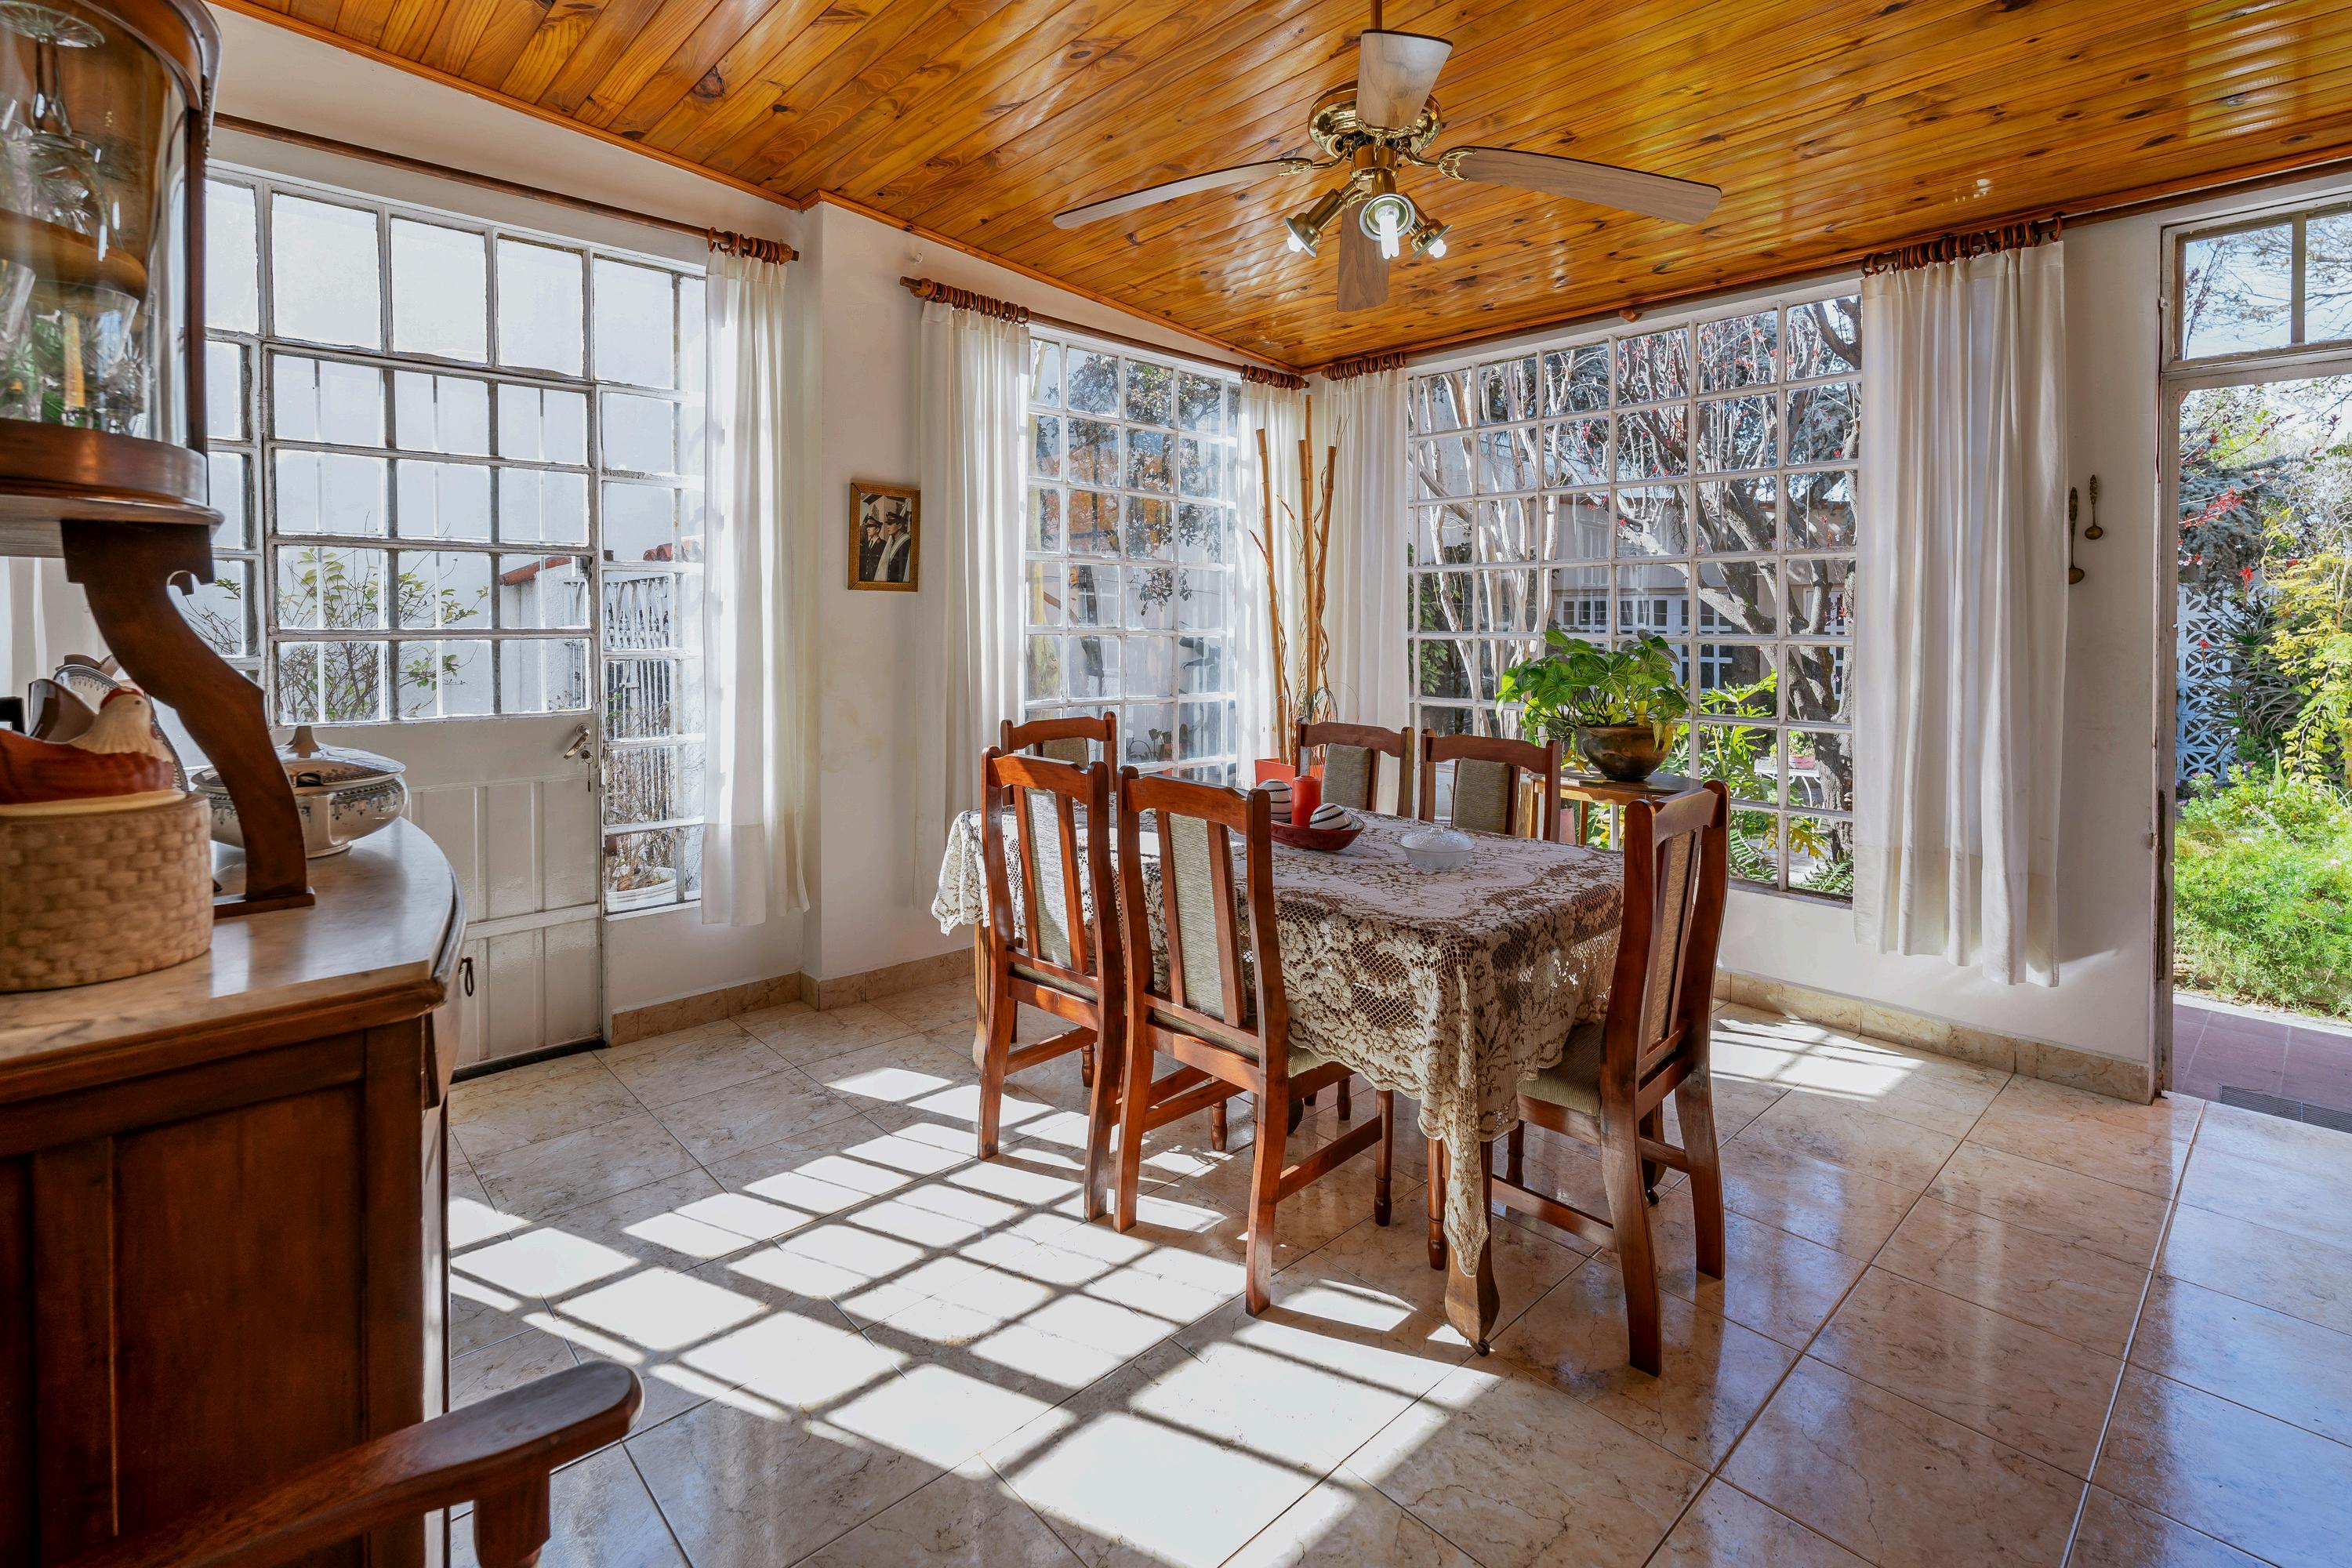
If your house is on the market but you haven’t gotten any offers you’re comfortable with, you may be wondering: what do I do if it doesn’t sell? And for a growing number of homeowners, that’s turning into a new dilemma: should I just rent it instead?
There’s a term for this in the industry, and it’s called an accidental landlord. Here’s how Yahoo Finance defines it:


Secure Your Dream Home Today

Navigating the mortgage application process can be a breeze with a little preparation. To ensure a successful application and closing, consider these helpful tips for what to avoid.


3
4 5 6 1 2
Avoid major purchases like furniture, cars, or vacations to keep your credit profile stable. Maintain your current employment to show financial stability. Always consult your mortgage professional before making large financial moves.
Avoid paying off debts or collections without professional advice.
Use verified funds for deposits to prevent closing delays.
Don't have your credit report pulled too many times - this can hurt your credit score.


In2024,thehomebuyingmarketfacessignificantchallenges highprices, steepinterestrates,andlimitedhousinginventory Formany,renovatingtheir currenthomeisamoreattractiveoptionthanpurchasinganewone.Whilethe LIRAreportpredictsadeclineinrenovationspending,expertsemphasizethat small-scaleupdatesortargetedlargerprojectscanstilldelivermajorbenefits.
Beforedivingintoarenovation,it’sessentialtoplan carefullyandbudgetwisely.Workingwithreputable professionalsiskey,especiallythoseoffering financingoptionsandtransferablewarranties.Sharing yourbudgetwithcontractorsupfrontandinvolving designersearlyensuresthatyourrenovationruns smoothlyandachievesbothfinancialandfunctional success Adetailedplanwillkeeptheprojectontrack andhelpavoidcostlysurprises


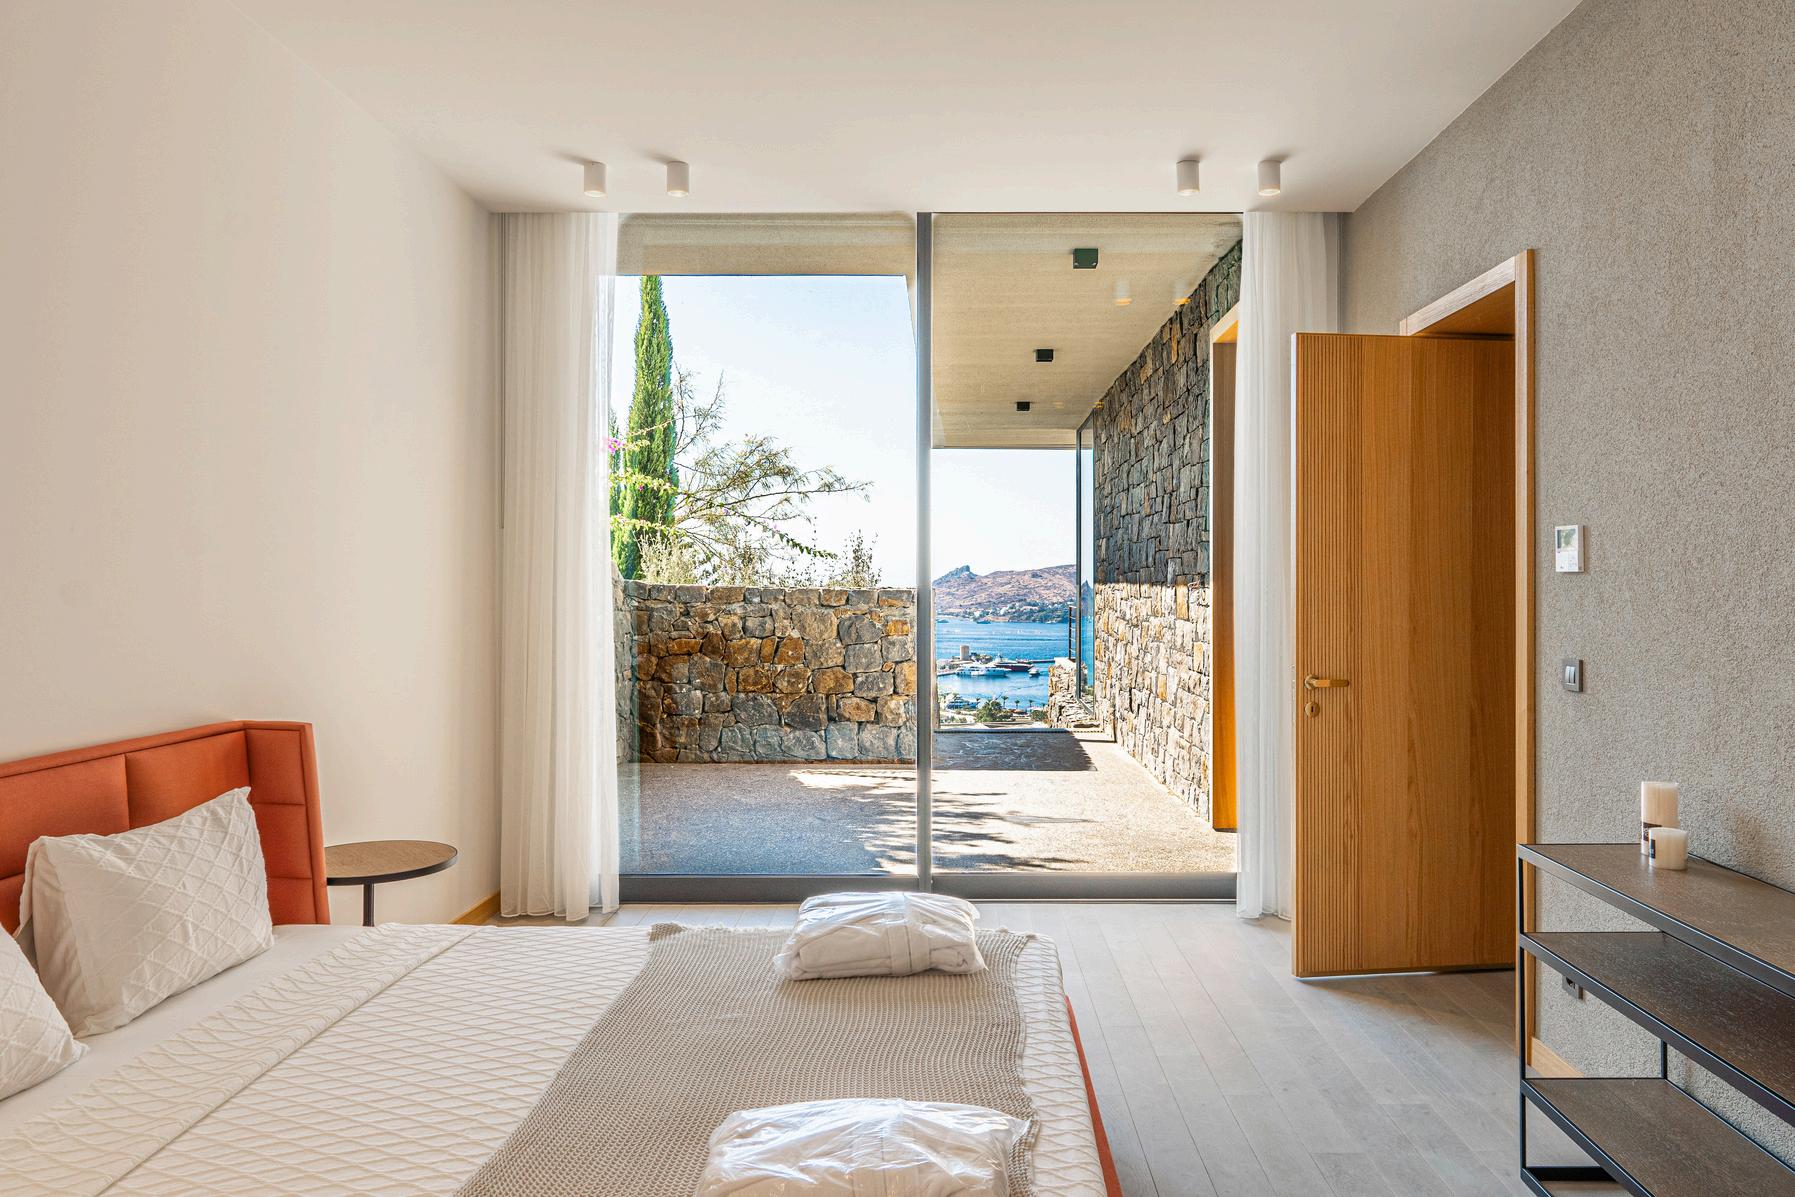
Bathrooms are a safe investment. Simple changes like a new vanity, upgraded flooring, or fresh lighting can completely transform the space. For a luxurious touch, consider adding a freestanding tub for a spa-like experience


The kitchen is a crucial space for resale value. Opening up the space or adding functional features can make a big difference Smaller updates, like upgrading appliances, cabinets, or flooring, can give your kitchen a fresh, modern feel


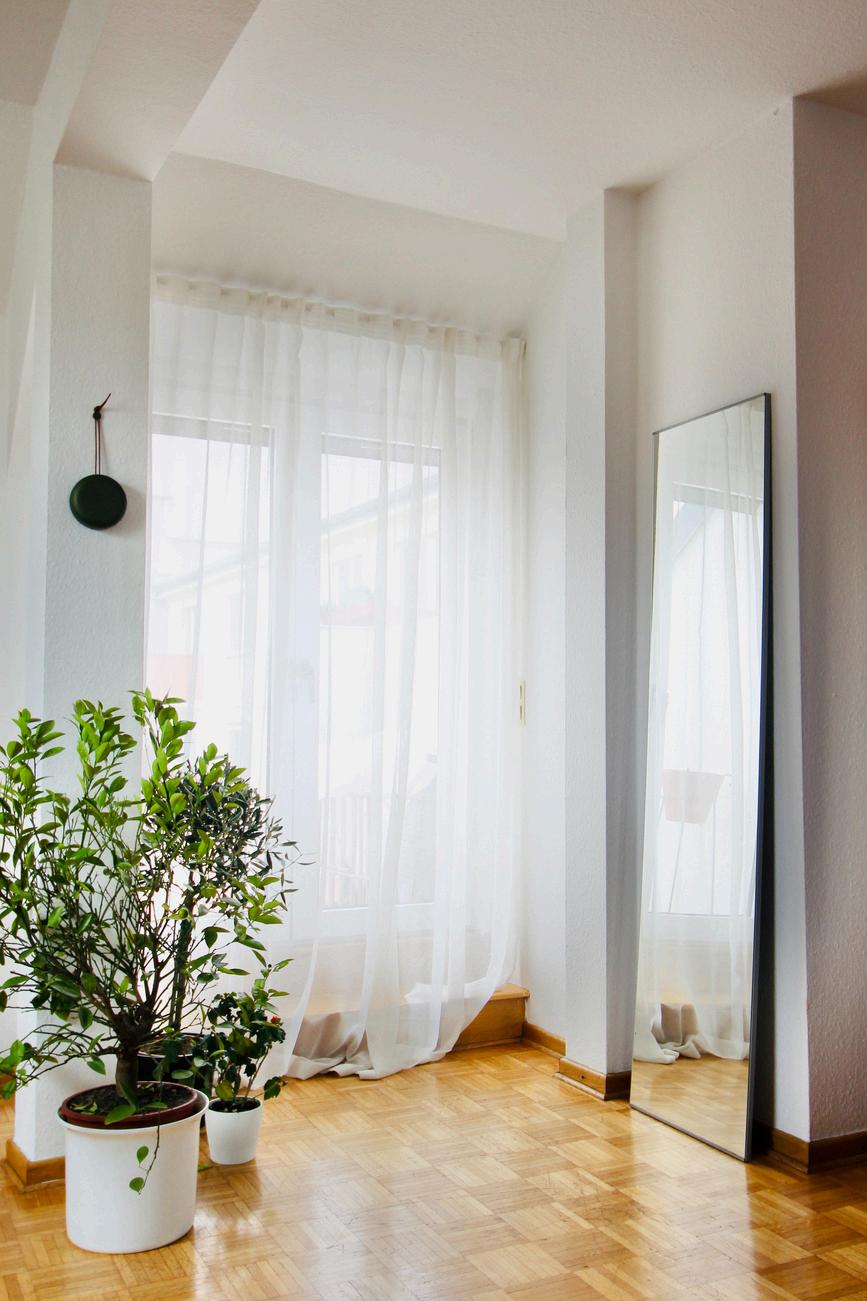
Bold design choices, such as statement wallpaper, unique lighting, or striking color palettes, can refresh any room. Layering textiles or mixing traditional and modern styles creates a space that feels cohesive and impactful


Renovations focusing on health are becoming increasingly popular. Use non-toxic materials free from Red List chemicals like BPA and VOCs. Consider adding air purifiers, water filtration systems, and better ventilation to create a healthier living environment


First impressions matter, and curb appeal can greatly impact your home's value. Exterior upgrades like siding, roofing, and landscaping enhance both aesthetics and security. Adding outdoor living spaces, such as a garden or entertainment area, boosts appeal even more.


Tailor renovations to your family’s lifestyle. Flexible spaces that accommodate workfrom-home needs, growing children, or future buyers will add lasting value. Think about both how your family uses the space and how it will appeal to future buyers.


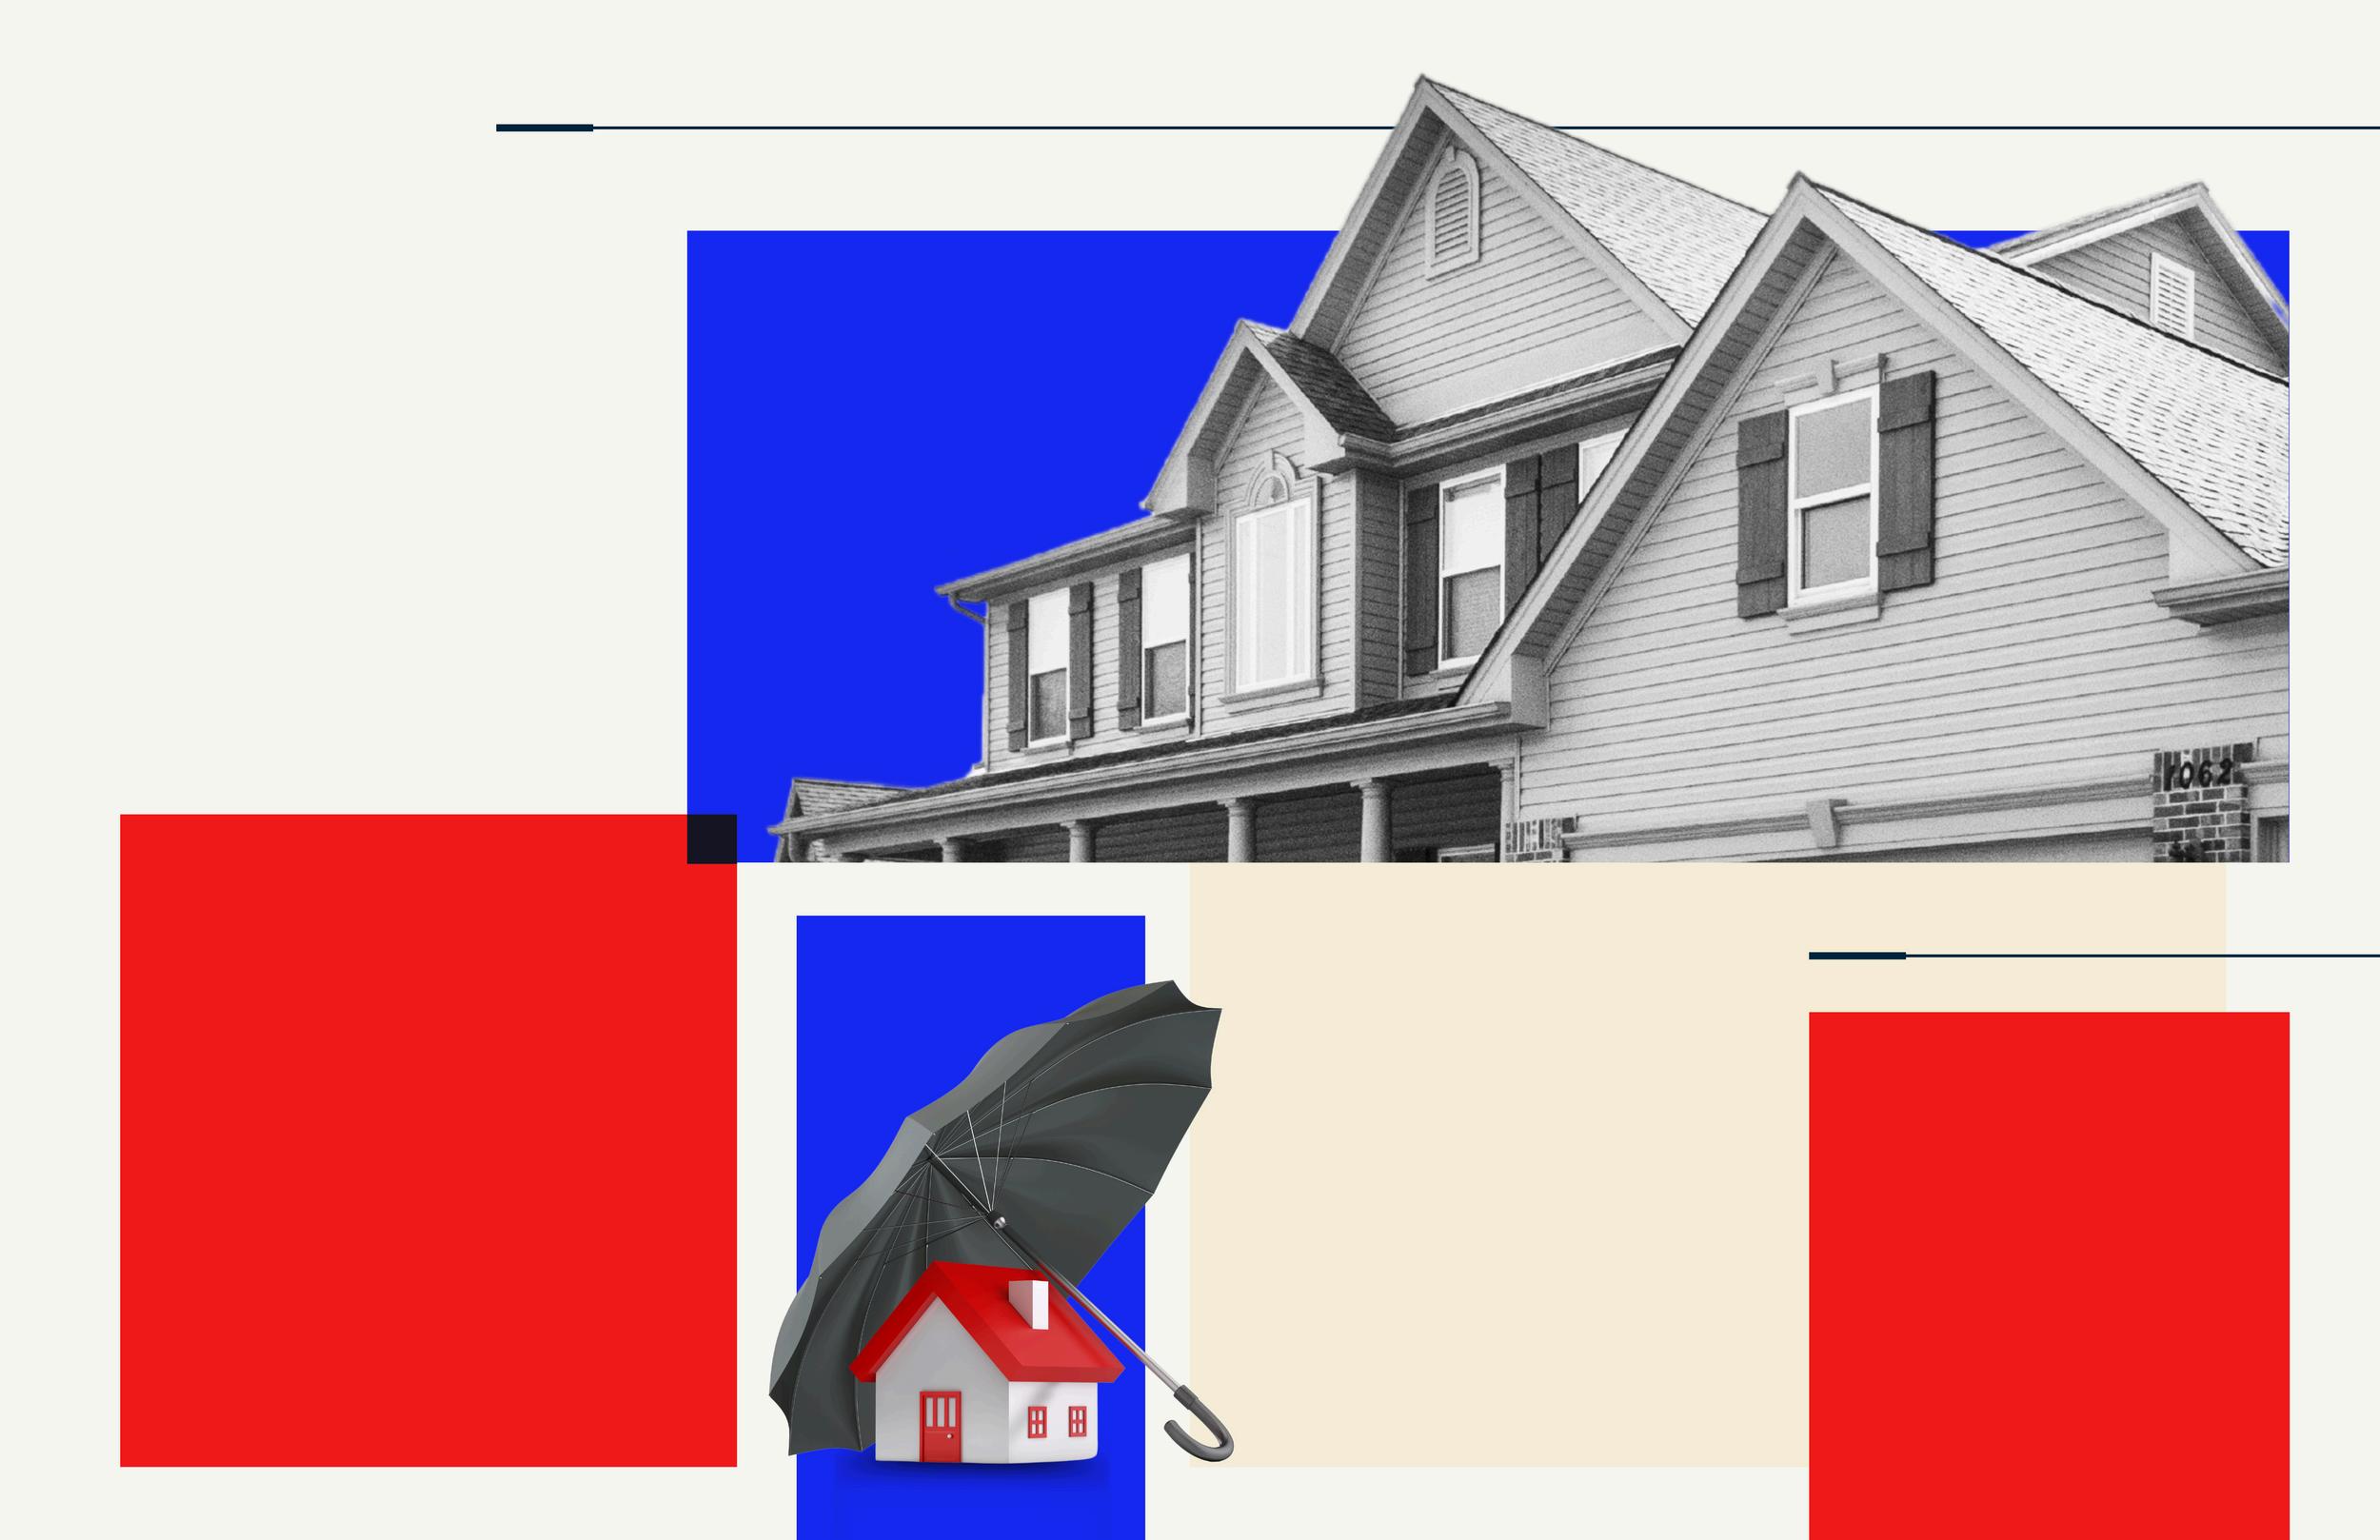
The Anenberg-Essert family in Campbell collaborated with Acton ADU to create a versatile, comfortable, and valuable addition to their property. This ADU project is a shining example of how a well-designed accessory dwelling unit can increase property value and serve a family’s unique needs.
The family envisioned an ADU that would function as an independent living space for family members, enhance their property’s worth, and provide seamless integration with the main home They wanted a space that balanced privacy with connectivity, feeling like a natural extension of their residence
Constructed at 747 square feet, this ADU was designed with modern, high-quality finishes to serve both aesthetic and practical needs. Key features include:
Vaulted Ceilings
Creates a spacious, open atmosphere
Senior-Friendly Living
Safe, independent space for elderly family members
Fully Equipped Kitchen
Modern amenities for everyday convenience
Open Living Area
Multipurpose area for relaxation and entertainment
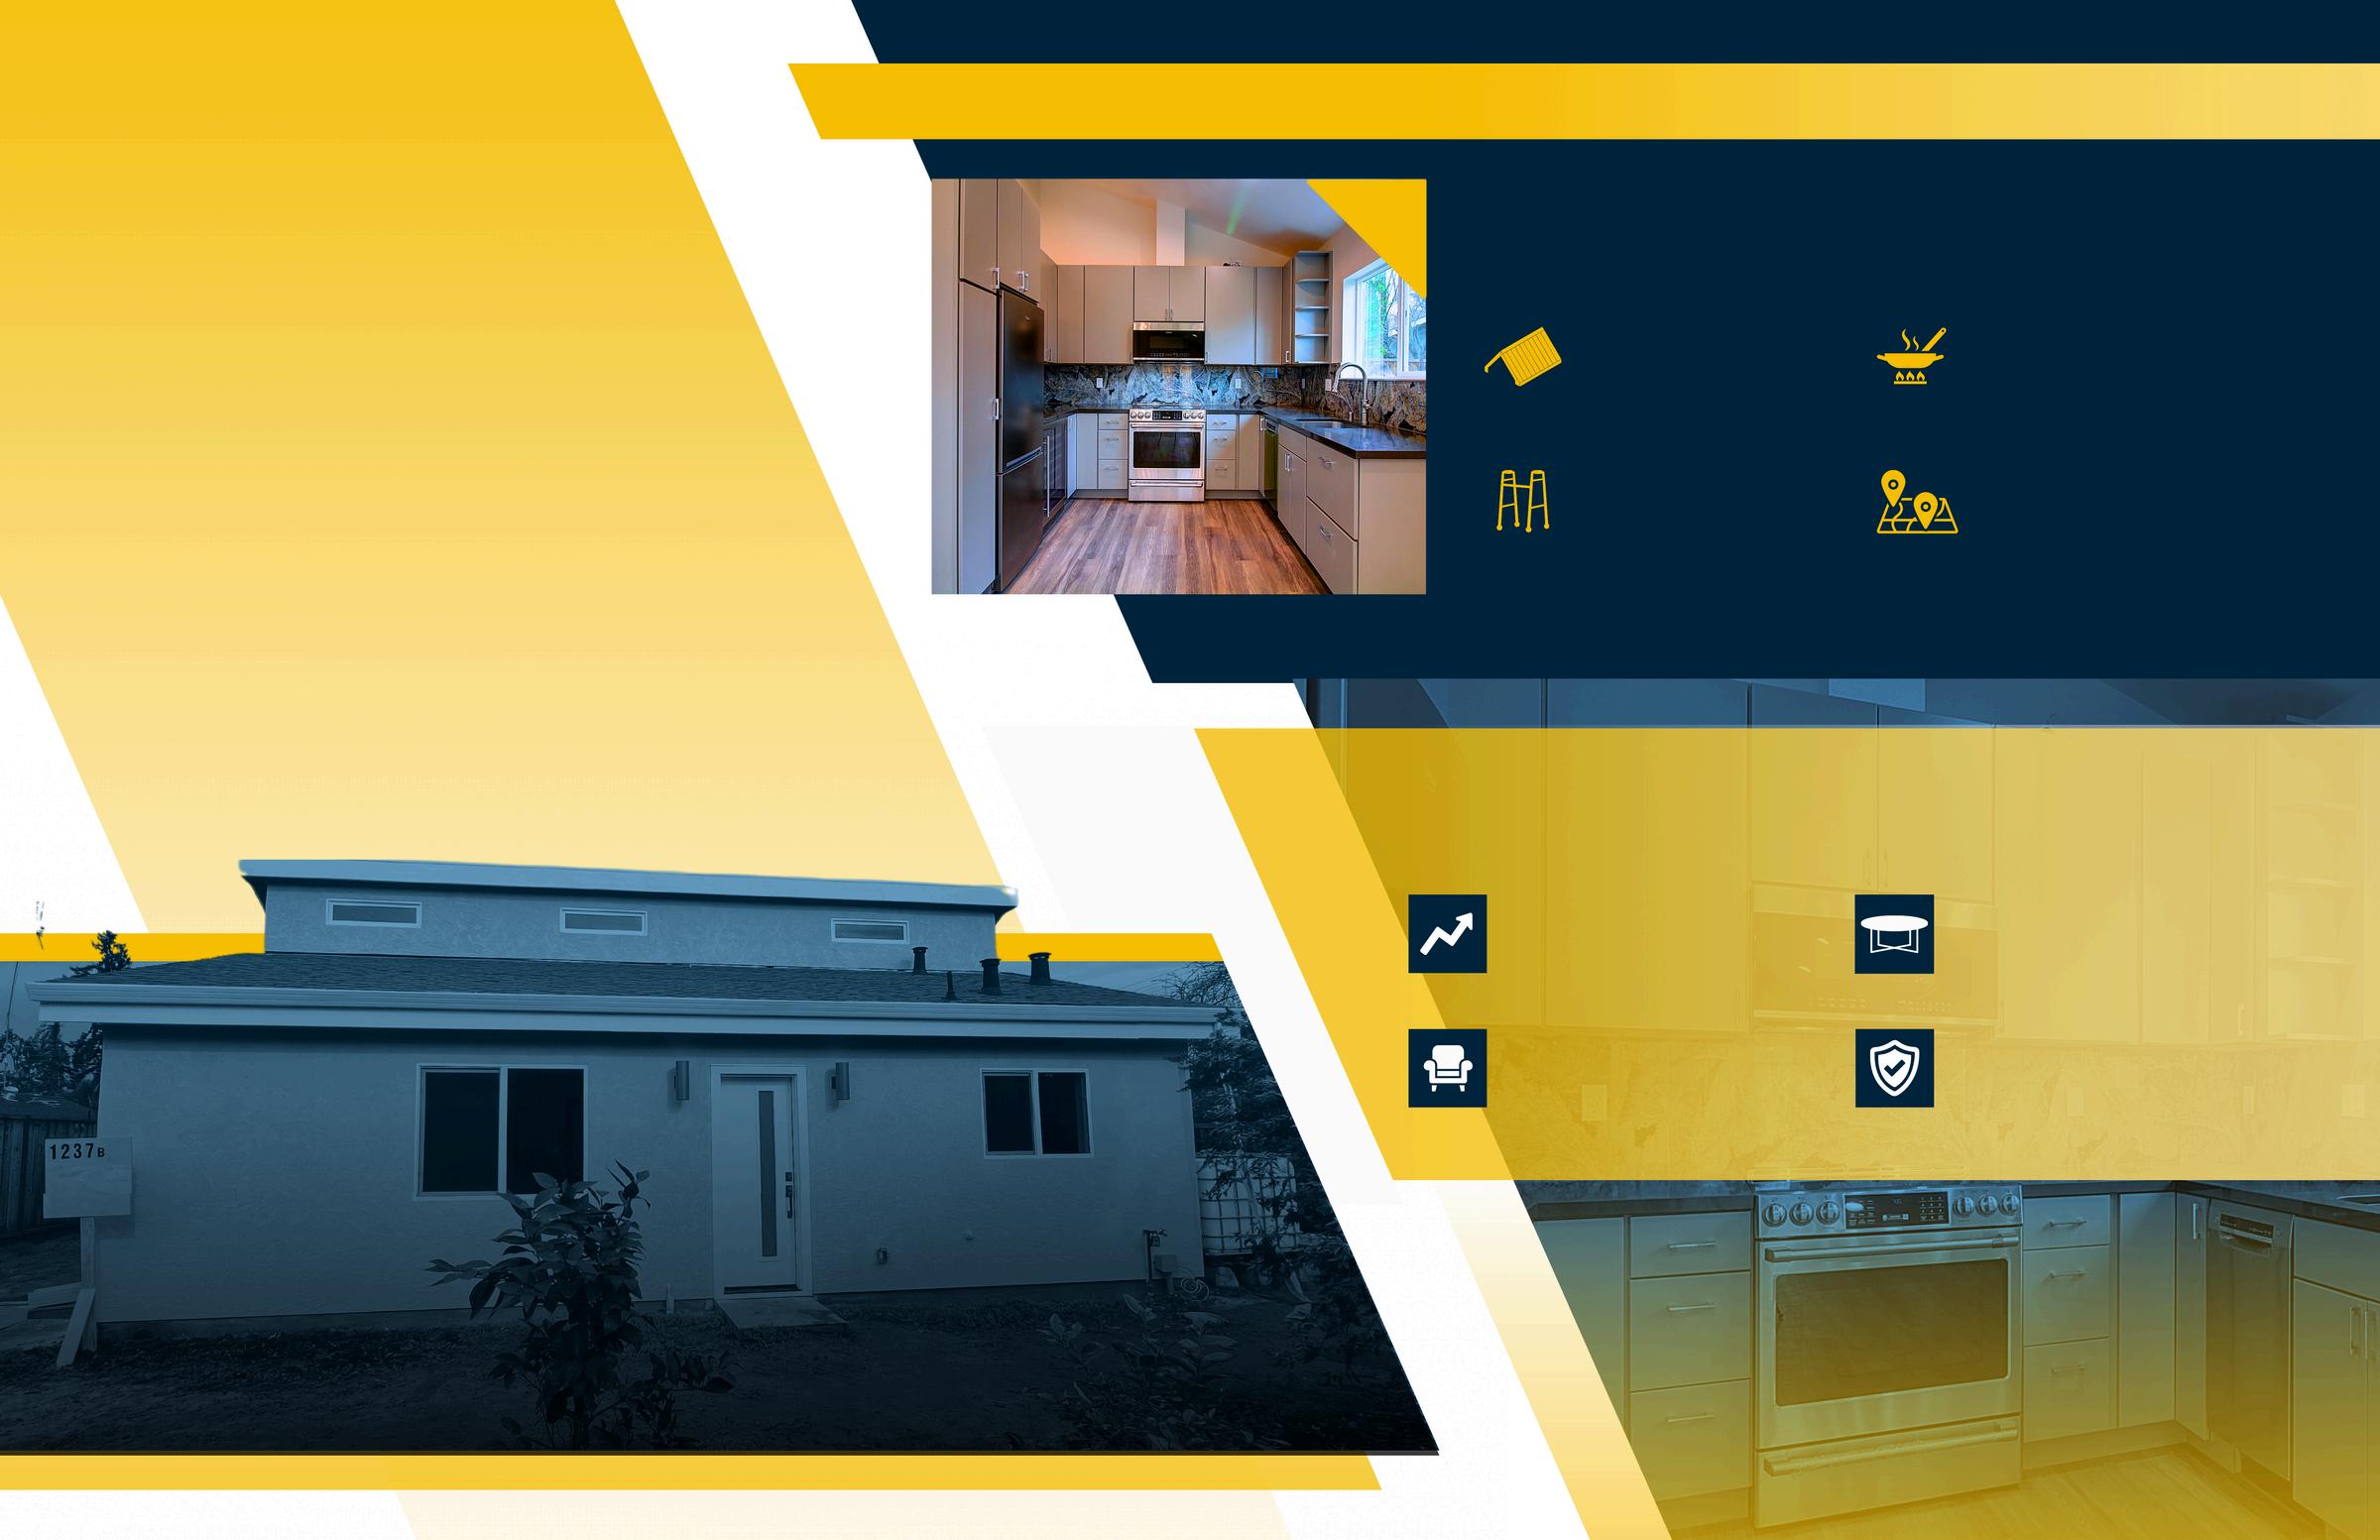
The completion of the Anenberg-Essert ADU led to several valuable outcomes:
Increased Property Value
The ADU addition significantly boosted property value
Flexible Living Space
A versatile space for family, guests, or as a rental
Modern Comforts
High-end finishes and amenities enhance both function and style.
Enhanced Family Living
The ADU enriches the AnenbergEssert family’s home with both privacy and connection

Thinking about how an ADU could fit into your family’s lifestyle or property investment strategy?
Trust Acton ADU to guide you every step of the way.

When it comes to home ownership, knowing who you can trust is crucial. That's why we've curated a select list of trusted vendors who are ready to help with your home goals.


Sea Cliff, Lake Street, Richmond (Inner, Central, Outer), Jordan Park/Laurel Heights, Lone Mountain
There were 13 single-family homes for sale, providing 0.8 months of inventory. There were 14 new listings, and 13 homes sold at a median price of $1.6m. The median overbid percentage was at 119 2%, with an average of 20 days on the market
There were 6 condo and townhome units for sale, providing 0.8 months of inventory. There were 8 new listings and 1 unit sold at a median sale price of $1.4m. The median overbid percentage was at 100%, with an average of 0 days on the market.
14 New Listings
13 Sold Listings
0.8 Months of Inventory
$1.6M Median Sale Price
119.2%
Median Sale vs List
20 Avg Days on Market
The data, sourced from InfoSparks, includes all single-family homes, condos and townhomes in the California Area above from August 2024 to August 2025. This may include preliminary data, and may vary from the time the data was gathered. All data is deemed reliable but not guaranteed. DRE# 01995149. Copyright KW Advisors San Francisco | Napa Valley 2025. Each office is independently owned and operated.
AUGUST 2024 - AUGUST 2025
le-Family Homes 12 months, year-over-year.
dos & Townhomes 12 months, year-over-year
Single-Family Homes
The median sale price has decreased from $2 1m last August 2024, to $1 6m as of August 2025
Condos & Townhomes
The median sale price has increased from $805k last August 2024, to $1 4m as of August 2025
Single-Family Homes
The average time spent on the market went up from 19 days last August 2024, to 20 days as of August 2025
Condos & Townhomes
The average time spent on the market went down from 53 days in August 2024, to 0 days as of August 2025.
Single-Family Homes
The overbid percentage has increased from 107 6% last August 2024, to 119 2% a year later
Condos & Townhomes
The overbid percentage has increased from 97.6% last August 2024, to 100% a year later.
Sunset & Parkside (Inner, Central, Outer), Golden Gate Heights
There were 17 single-family homes for sale, providing 0.5 months of inventory. There were 30 new listings, and 27 homes sold at a median price of $1.6m. The median overbid percentage was at 123.1%, with an average of 24 days on the market.
There were 8 condo and townhome units for sale, providing 2.6 months of inventory. There were 5 new listings and 0 units sold at a median sale price of $0. The median overbid percentage was at 0%, with an average of 0 days on the market.

30 New Listings
27 Sold Listings
0.5 Months of Inventory
$1.6M Median Sale Price
123.1%
Median Sale vs List
24 Avg Days on Market
The data, sourced from InfoSparks, includes all single-family homes, condos and townhomes in the California Area above from August 2024 to August 2025. This may include preliminary data, and may vary from the time the data was gathered. All data is deemed reliable but not guaranteed. DRE# 01995149. Copyright KW Advisors San Francisco | Napa Valley 2025. Each office is independently owned and operated.
5
New Listings
2.6
Months of Inventory

Sold Listings
$0
Median Sale Price 0%
Median Sale vs List 0 Avg Days on Market 0
AUGUST 2024 - AUGUST 2025
The median sale price has increased from $1 5m last August 2024, to $1 6m as of August 2025
Condos & Townhomes
The median sale price has decreased from $1 2m last August 2024, to $0 as of August 2025
The average time spent on the market remained the same from 24 days last August 2024, to 24 days as of August 2025
Condos & Townhomes
The average time spent on the market went down from 35 days in August 2024, to 0 days as of August 2025.
Single-Family Homes
The overbid percentage has increased from 119% last August 2024, to 123 1% a year later
Condos & Townhomes
The overbid percentage has decreased from 106.3% last August 2024, to 0% a year later.

Lake Shore, Lakeside, Mer Merced Heights, Ingleside Heights, Oceanview
What's in the Distr Southwest data?
There were 14 single-family h providing 1.2 months of inve new listings, and 16 homes s of $1.3m. The median overbi 115%, with an average of 15
There were 4 condo and tow providing 2.1 months of inve new listings and 4 units sold price of $1.2m. The median o was at 97.4%, with an averag market.
14 New Listings
1.2 Months of Inventory
115% Median Sale vs List
16 Sold Listings
$1.3M Median Sale Price
15 Avg Days on Market
homes, condos and August 2025. This may was gathered. All data is Copyright KW Advisors San Francisco | Napa Valley 2025. Each office is independently owned and operated.
Condo
3
New Listings
4 Sold Listings
2.1
Months of Inventory
$1.2M
Median Sale Price 97.4%
Median Sale vs List
67 Avg Days on Market
AUGUST 2024 - AUGUST 2025
Family Homes
months, year-over-year.
& Townhomes
months, year-over-year
The median sale price has increased from $998k last August 2024, to $1 3m as of August 2025
Condos & Townhomes
The median sale price has increased from $0 last August 2024, to $1 2m as of August 2025
The average time spent on the market went down from 39 days last August 2024, to 15 days as of August 2025 Aug2024Sep2024Oct2024Nov2024Dec2024 Jan2025Feb2025Mar2025Apr2025May2025 Jun2025 Jul2025Aug2025
The average time spent on the market went up from 0 days in August 2024, to 67 days as of August 2025.
Single-Family Homes
The overbid percentage has increased from 106 7% last August 2024, to 115% a year later
Condos & Townhomes
The overbid percentage has increased from 0% last August 2024, to 97.4% a year later.

St. Francis Wood, Forest Hill, West Portal, Forest Knolls, Diamond Heights, Midtown Terrace, Miraloma Park, Sunnyside, Balboa Terrace, Ingleside Terrace, Mt Davidson Manor, Sherwood Forest, Monterey Heights, Westwood Highlands
There were 15 single-family homes for sale, providing 0.6 months of inventory. There were 21 new listings, and 17 homes sold at a median price of $1.9m. The median overbid percentage was at 106.2%, with an average of 26 days on the market.
There were 15 condo and townhome units for sale, providing 4 months of inventory. There were 7 new listings and 2 units sold at a median sale price of $688k. The median overbid percentage was at 100%, with an average of 109 days on the market.

21 New Listings
17 Sold Listings
0.6 Months of Inventory
$1.9M Median Sale Price
106.2%
Median Sale vs List
26 Avg Days on Market
The data, sourced from InfoSparks, includes all single-family homes, condos and townhomes in the California Area above from August 2024 to August 2025. This may include preliminary data, and may vary from the time the data was gathered. All data is deemed reliable but not guaranteed. DRE# 01995149. Copyright KW Advisors San Francisco | Napa Valley 2025. Each office is independently owned and operated.

AUGUST 2024 - AUGUST 2025
Single-Family Homes
Last 12 months, year-over-year.
Condos & Townhomes
Last 12 months, year-over-year
The median sale price has increased from $1 6m last August 2024, to $1 9m as of August 2025
Condos & Townhomes
The median sale price has increased from $567k last August 2024, to $688k as of August 2025
The average time spent on the market went up from 21 days last August 2024, to 26 days as of August 2025
Condos & Townhomes
The average time spent on the market went up from 64 days in August 2024, to 109 days as of August 2025.
Single-Family Homes
The overbid percentage has increased from 103 1% last August 2024, to 106 2% a year later
Condos & Townhomes
The overbid percentage has decreased from 100.1% last August 2024, to 100% a year later.
Noe Valley, Eureka Valley/Dolores Heights (Castro, Liberty Hill), Cole Valley, Glen Park, Corona Heights, Clarendon Heights, Ashbury Heights, Buena Vista Park, Haight Ashbury, Duboce Triangle, Twin Peaks, Mission Dolores, Parnassus Heights
There were 28 single-family homes for sale, providing 1.1 months of inventory. There were 21 new listings, and 14 homes sold at a median price of $2m. The median overbid percentage was at 100%, with an average of 35 days on the market.
There were 31 condo and townhome units for sale, providing 1.3 months of inventory. There were 20 new listings and 12 units sold at a median sale price of $1.3m. The median overbid percentage was at 103.4%, with an average of 57 days on the market.
21 New Listings
14 Sold Listings
1.1 Months of Inventory
$2M
Median Sale Price
100%
Median Sale vs List
35 Avg Days on Market
The data, sourced from InfoSparks, includes all single-family homes, condos and townhomes in the California Area above from August 2024 to August 2025. This may include preliminary data, and may vary from the time the data was gathered. All data is deemed reliable but not guaranteed. DRE# 01995149. Copyright KW Advisors San Francisco | Napa Valley 2025. Each office is independently owned and operated.
20
New Listings
12
Sold Listings
1.3
Months of Inventory
$1.3M
Median Sale Price
103.4%
Median Sale vs List
57 Avg Days on Market

AUGUST 2024 - AUGUST 2025
Single-Family Homes
Last 12 months, year-over-year.
Condos & Townhomes
Last 12 months, year-over-year
Single-Family Homes
The median sale price has decreased from $2 5m last August 2024, to $2m as of August 2025
Condos & Townhomes
The median sale price has decreased from $1 4m last August 2024, to $1 3m as of August 2025
Single-Family Homes
The average time spent on the market went up from 23 days last August 2024, to 35 days as of August 2025
Condos & Townhomes
The average time spent on the market went up from 39 days in August 2024, to 57 days as of August 2025.
Single-Family Homes
The overbid percentage has decreased from 100 4% last August 2024, to 100% a year later
Condos & Townhomes
The overbid percentage has increased from 101.6% last August 2024, to 103.4% a year later.
Hayes Valley, North Alamo Square, Wes Vista, Lower Pacific
There were 2 single-fa providing 0.7 months new listings, and 2 ho of $2.3m. The median 97%, with an average There were 22 condo sale, providing 1.3 mo were 18 new listings a sale price of $1.3m. T percentage was at 98 days on the market.
0
New Listings
2 Sold Listings
0.7 Months of Inventory
$2.3M Median Sale Price
97%
Median Sale vs List
s single-family homes, condos and 2024 to August 2025. This may the data was gathered. All data is 01995149. Copyright KW Advisors San Francisco | Napa Valley 2025. Each office is independently owned and operated.
166 Avg Days on Market
18
New Listings
13
Sold Listings
1.3
Months of Inventory
$1.3M
Median Sale Price 98.1%
Median Sale vs List
43 Avg Days on Market

AUGUST 2024 - AUGUST 2025
Family Homes
2 months, year-over-year.
s & Townhomes
2 months, year-over-year
The median sale price has increased from $2m last August 2024, to $2 3m as of August 2025
Condos & Townhomes
The median sale price has increased from $949k last August 2024, to $1 3m as of August 2025
The average time spent on the market went up from 39 days last August 2024, to 166 days as of August 2025
The average time spent on the market went up from 36 days in August 2024, to 43 days as of August 2025.
Single-Family Homes
The overbid percentage has decreased from 103 8% last August 2024, to 97% a year later
Condos & Townhomes
The overbid percentage has decreased from 100% last August 2024, to 98.1% a year later.
Pacific Heights, Presidio Heights, Cow Hollow, Marina
There were 16 single-family homes for sale, providing 1.7 months of inventory. There we new listings, and 9 homes sold at a median p of $4.8m. The median overbid percentage w 97.3%, with an average of 94 days on the ma
There were 30 condo and townhome units fo sale, providing 1.3 months of inventory. Ther were 23 new listings and 14 units sold at a m sale price of $1.4m. The median overbid percentage was at 100%, with an average of days on the market.

15 New Listings
9 Sold Listings
1.7 Months of Inventory
$4.8M Median Sale Price
97.3%
Median Sale vs List
94 Avg Days on Market
sourced from InfoSparks, includes all single-family homes, condos and the California Area above from August 2024 to August 2025. This may preliminary data, and may vary from the time the data was gathered. All data is reliable but not guaranteed. DRE# 01995149. Copyright KW Advisors San Francisco | Napa Valley 2025. Each office is independently owned and operated.
Condo & Town
23
New Listings
14
Sold Listings
1.3
Months of Inventory
$1.4M
Median Sale Price 100%
Median Sale vs List
52 Avg Days on Market

AUGUST 2024 - AUGUST 2025
amily Homes months, year-over-year. & Townhomes months, year-over-year
The median sale price has decreased from $5 1m last August 2024, to $4 8m as of August 2025
Condos & Townhomes
The median sale price has decreased from $1 8m last August 2024, to $1 4m as of August 2025
The average time spent on the market went down from 178 days last August 2024, to 94 days as of August 2025
Condos & Townhomes
The average time spent on the market went down from 53 days in August 2024, to 52 days as of August 2025.
Single-Family Homes
The overbid percentage has decreased from 99 1% last August 2024, to 97 3% a year later
Condos & Townhomes
The overbid percentage has remained the same from 100% last August 2024, to 100% a year later.

Russian Hill, Beach, Finan Downtown, V Tenderloin
There were 3 s providing 1.3 m new listings, a $13m. The me 83 9%, with an
There were 10 sale, providing were 46 new li sale price of $ percentage wa days on the m

3 New Listings
1 Sold Listing
1.3 Months of Inventory $13M Median Sale Price
83.9%
Median Sale vs List
127 Avg Days on Market
and may data is San
Condo & Town
46
New Listings
34 Sold Listings
3.5
Months of Inventory $857K
Median Sale Price 97.7%
Median Sale vs List 67 Avg Days on Market
AUGUST 2024 - AUGUST 2025
amily Homes months, year-over-year. & Townhomes
months, year-over-year
The median sale price has increased from $3 3m last August 2024, to $13m as of August 2025
The median sale price has increased from $815k last August 2024, to $857k as of August 2025
The average time spent on the market went up from 63 days last August 2024, to 127 days as of August 2025
The average time spent on the market went down from 68 days in August 2024, to 67 days as of August 2025.
The overbid percentage has decreased from 96 8% last August 2024, to 83 9% a year later
Condos & Townhomes
The overbid percentage has decreased from 98.4% last August 2024, to 97.7% a year later.


16 New Listings
18 Sold Listings
1.1 Months of Inventory
$1.3M Median Sale Price
118.8%
Median Sale vs List
40 Avg Days on Market
from InfoSparks, includes all single-family homes, condos and California Area above from August 2024 to August 2025. This may data, and may vary from the time the data was gathered. All data is but not guaranteed. DRE# 01995149. Copyright KW Advisors San Francisco | Napa Valley 2025. Each office is independently owned and operated.
87
New Listings
76
Sold Listings
3.4
Months of Inventory
$968K
Median Sale Price 98.1%
Median Sale vs List 86 Avg Days on Market

AUGUST 2024 - AUGUST 2025
Single-Family Homes
Last 12 months, year-over-year.
Condos & Townhomes
Last 12 months, year-over-year
The median sale price has increased from $1 36m last August 2024, to $1 39m as of August 2025
Condos & Townhomes
The median sale price has decreased from $1000k last August 2024, to $968k as of August 2025
The average time spent on the market went up from 23 days last August 2024, to 40 days as of August 2025
The average time spent on the market went up from 74 days in August 2024, to 86 days as of August 2025.
The overbid percentage has increased from 103 9% last August 2024, to 118 8% a year later
Condos & Townhomes
The overbid percentage has decreased from 99% last August 2024, to 98.1% a year later.

Bayview, Bayview Heights, Excelsior, Portola, Visitacion Valley, Silver Terrace, Mission Terrace, Crocker Amazon, Outer Mission
There were 71 single-family homes for sale, providing 1.8 months of inventory. There were 39 new listings, and 37 homes sold at a median price of $1m. The median overbid percentage was at 107 9%, with an average of 33 days on the market
There were 33 condo and townhome units for sale, providing 5.5 months of inventory. There were 6 new listings and 1 unit sold at a median sale price of $869k. The median overbid percentage was at 98.9%, with an average of 48 days on the market.
39 New Listings
37 Sold Listings
1.8 Months of Inventory
$1M Median Sale Price
107.9%
Median Sale vs List
33 Avg Days on Market
The data, sourced from InfoSparks, includes all single-family homes, condos and townhomes in the California Area above from August 2024 to August 2025. This may include preliminary data, and may vary from the time the data was gathered. All data is deemed reliable but not guaranteed. DRE# 01995149. Copyright KW Advisors San Francisco | Napa Valley 2025. Each office is independently owned and operated.
6
New Listings
1 Sold Listing
5.5
Months of Inventory
$869K
Median Sale Price
98.9%
Median Sale vs List
48 Avg Days on Market

AUGUST 2024 - AUGUST 2025
Single-Family Homes
Last 12 months, year-over-year.
Condos & Townhomes
Last 12 months, year-over-year
Single-Family Homes
The median sale price has decreased from $1 1m last August 2024, to $1m as of August 2025
Condos & Townhomes
The median sale price has increased from $850k last August 2024, to $869k as of August 2025
The average time spent on the market went up from 29 days last August 2024, to 33 days as of August 2025
Condos & Townhomes
The average time spent on the market went down from 119 days in August 2024, to 48 days as of August 2025.
Single-Family Homes
The overbid percentage has decreased from 108% last August 2024, to 107 9% a year later
Condos & Townhomes
The overbid percentage has decreased from 100% last August 2024, to 98.9% a year later.