MARKET REPORT


March 2023 Copyright by KW Advisors 2023


Atherton
Jump to Atherton Report
Belmont
Jump to Belmont Report
Burlingame
Jump to Burlingame Report
Foster City
Jump to Foster City Report
Hillsborough
Jump to Hillsborough Report
Menlo Park
Jump to Menlo Park Report
Palo Alto
Jump to Palo Alto Report
Portola Valley
Jump to Portola Valley Report
Redwood City
Jump to Redwood City Report
San Carlos
Jump to San Carlos County
A local Bay Area Pioneer- Sarah is the 5th Generation in San Mateo County She began her career over 30 years ago as the owner and operator of her own real estate company Then went onto opening two Century 21 franchises, followed by opening a RE/MAX franchise.

She earned the prestigious “Centurion” and “Platinum” top producer awards. Both of these awards acknowledge Sarah’s accomplishments that lead her to ranking in the top 1% of Sales Professionals Nationwide
In addition to her vast real estate experience, and successfully closing over 575 sales in her career she also has background and experience in interior design, construction and remodeling. Sarah has built 2 custom luxury homes, as well as...
Sarah advised us on what truly needed to be done to get the most 'bang' for our dollar. She sold our house in 13 days, with 4 bids all over asking price. It closed in 21 days and we were super happy with her skills to accomplish this in such a short period of time Our house sold for $116,000 Over the last sale in our neighborhood, on the market for only 14 days, Closed escrow in 21 days!
- Jim & Margaret MThank you so much for making a 20 year dream of mine come true! When I tell people that we found our home, put in a bid and the bid was accepted (in one day)
UNDER ASKING PRICE all they could say was ”WOW, in this market, I can’t believe it. Truly I don’t think I could have done this without your support, you had some amazing tricks up your sleeve! Glad you were referred to us!”
What a pleasure it has been working with you in the sale of our home. We had been listed with another brokerage with no results but were pleasantly surprised at how efficient your system was You made the entire process seem so easy compared to what we previously experienced! We thank you and your team! Please stay in touch with us.
- Stan and EveFor more testimonials, click here
Curious about what’s trending in your neighborhood? Ready to make a move? Download our app for real estate insights, on demand.
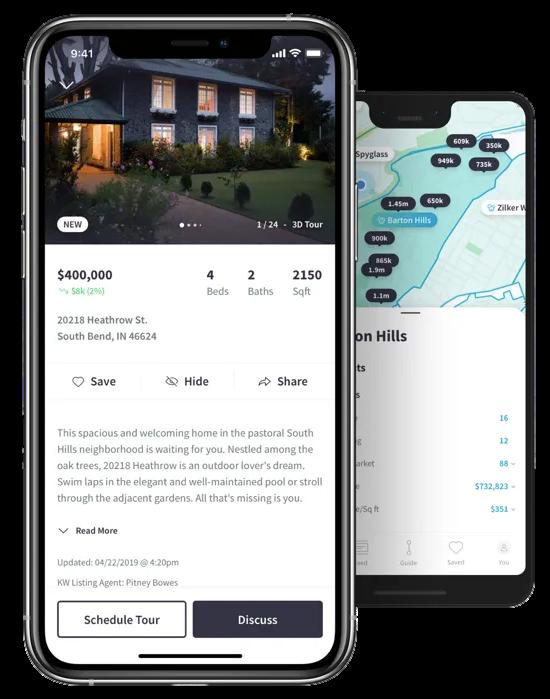
Work with an Agent Custom Searches
Dynamic Map Get Local
Anytime Access
Share Information
Download the Keller Williams Real Estate Mobile App for iPhone, iPad, and Android via the links below:
For more information, click here


You may have seen reports in the news recently saying it’s better to rent right now than it is to own your home. But before you let that impact your decisions, you should understand what these claims are based on.
A lot of the time, these reports are assuming things that aren’t realistic for the average household For example, the methodology behind one of those reports says that renting is the smarter financial option because of the opportunity to invest money elsewhere. It assumes renters take the money they’d spend on costs tied to buying a home and put it in an investment portfolio

But here’s the thing – most people who rent aren’t making those investments Ken Johnson, Co-Author of the BH&J National Price-to-Rent Index, explains:
“One of the difficulties with the rent and reinvest model is many people . . . simply rent and spend the difference. . . . That’s wealth destroying. ”
The reason homeownership is one of the best investments you can make is the wealth it helps you build. That’s why there’s a significant difference between the net worth of the average homeowner and the average renter (see graph below):
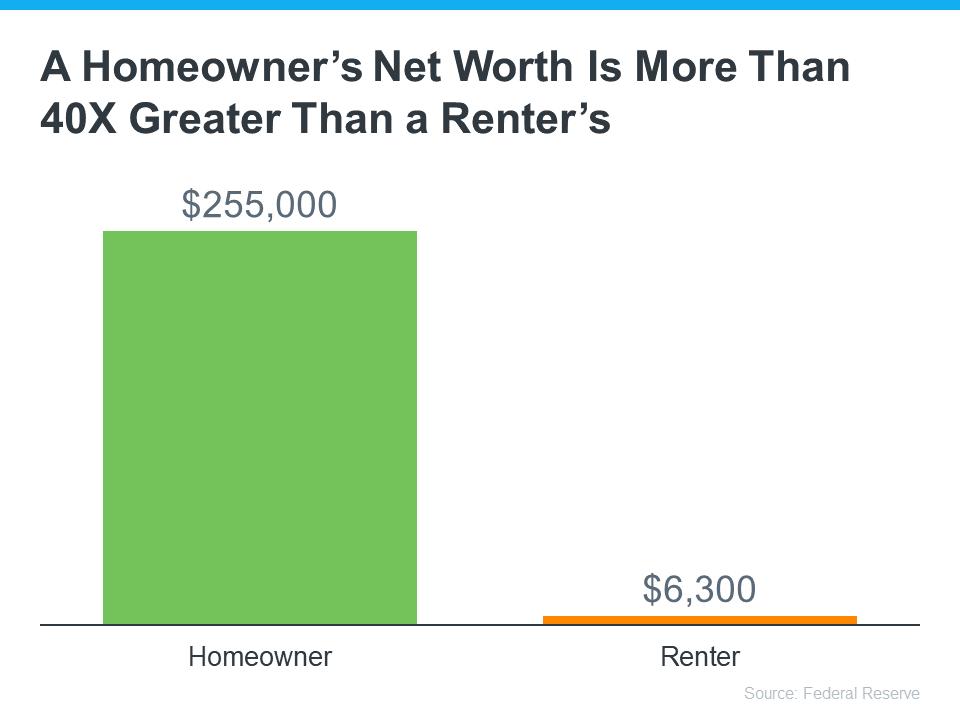
So, before you renew your rental agreement, think about the opportunity to build wealth that homeownership provides.
If you’re unsure whether to continue renting or to buy a home, work with a real estate advisor who can help you make the best decision.
Source: Keeping Current Matters
In February, Atherton had 27 single-family homes for sale, providing the market with 2.7 months of inventory. There were 6 new listings and a total of 9 homes sold, with a median sale price of $10.5m. The median sale overbid was 89.0%, and the average time on the market was 89 days.
There are currently no condos for sale, inventory, new listings, or condo sales reported in February and January.

Single-Family Homes
The median sales price has decreased from $168m last February 2022, to $105m as of February 2023
Condos & Townhomes
No data for this month
Single-Family Homes
The average days on market went up from 7 days last February 2022, to 89 days as of February 2023.
Condos & Townhomes
The average days on market went up from 0 days in February 2022, to 0 days as of February 2023
Single-Family Homes
The overbid percentage has decreased from 96.1% last February 2022, to 89% a year later.
Condos & Townhomes
The overbid percentage has decreased from 0% last February 2022, to 0% a year later.

In February, Belmont City had 6 singlefamily homes sold, a median sale price of $1.9m. The median overbid was at 101.4% and the average time on the market was 26 days. In terms of inventory, there are currently 19 homes for sale providing the market with 2.2 months of inventory.
For condos, there were no units sold. The median sale price and the median overbi was 0. The average time on the market increased to 14 days. There were 3 condo for sale providing the market with 1 mont of inventory.

Single-Family Homes

Last 12 months, year-over-year.
Condos & Townhomes
Last 12 months, year-over-year
Single-Family Homes
The median sales price has decreased from $25m last February 2022, to $19m as of February 2023
Condos & Townhomes
The median sales price has decreased from $900k last February 2022, to $0 as of February 2023
Single-Family Homes
The overbid percentage has decreased from 124.3% last February 2022, to 101.4% a year later.
Condos & Townhomes
The overbid percentage has decreased from 112.7% last February 2022, to 0% a year later.
Single-Family Homes
The average days on market went up from 8 days last February 2022, to 26 days as of February 2023.
Condos & Townhomes
The average days on market went up from 12 days in February 2022, to 14 days as of February 2023
In February, Burlingame had 7 singlefamily homes sold, a median sale price of $2.7m. The median overbid was at 96.7% and the average time on the market was 12 days. In terms of inventory, there were 29 homes for sale providing the market with 1.9 months of inventory.
For condos, there were 4 units sold. The median sale price increased to $1.2m, and the median overbid increased to 97.8%. The average time on the market increased to 32 days. There are currently 9 condos for sale providing the market with 0.8 month of inventory.

tings of Inventory
7 Sold Listings
$2.7M Median Sale Price
.7% Sale vs List
12 Avg Days on Market
as sourced from Broker Metrics on March 10th, 2023 and includes mily homes, condos, and townhomes in the California Area above ry 2022 to February 2023 This may include preliminary data, and e time the data was gathered All data is deemed reliable but not Questions may be directed to KW Advisors 4154839285 Palo # 01511642 Copyright KW Advisors 2023 Each Office is tly owned and operated
CO Condo & To
9 New Listings

0.8 Months of Inventory $ M
97.8% Median Sale vs List Av
The median sales price has increased from $26m last February 2022, to $27m as of February 2023
The median sales price has increased from $0 last February 2022, to $11m as of February 2023
Single-Family Homes
The overbid percentage has decreased from 118.3% last February 2022, to 96.7% a year later.
Condos
The overbid percentage has increased from 0% last February 2022, to 97.8% a year later.
Single-Family
The average days on market went down from 14 days last February 2022, to 12 days as of February 2023.
The average days on market went up from 31 days in February 2022, to 32 days as of February 2023

In February, Foster Cit family homes sold, wit price of $2.4m. The me 101.9% and the average market was 12 days. In there were 12 homes fo market with 1.5 month
For condos, there were median sale price incr the median overbid in The average time on t to 28 days. There were providing the market w inventory.


Single-Family Homes
The median sales price has decreased from $31m last February 2022, to $24m as of February 2023
Condos & Townhomes
The median sales price has decreased from $1.3m last February 2022, to $14m as of February 2023
Single-Family Homes
The overbid percentage has decreased from 116.2% last February 2022, to 101.9% a year later.
Condos & Townhomes
The overbid percentage has decreased from 110.3% last February 2022, to 100.6% a year later.
The average days on market went up from 10 days last February 2022, to 12 days as of February 2023.
Condos & Townhomes
The average days on market went up from 13 days in February 2022, to 28 days as of February 2023

No data for this month
Single-Family Homes
The median sales price has decreased from $54m last February 2022, to $47m as of February 2023
Condos & Townhomes
No data for this month.
The average days on market went up from 24 days last February 2022, to 32 days as of February 2023.
Condos & Townhomes
The average days on market went up from 0 days in February 2022, to 0 days as of February 2023
Single-Family Homes
The overbid percentage has decreased from 106.6% last February 2022, to 96% a year later.
Condos & Townhomes
The overbid percentage has decreased from 0% last February 2022, to 0% a year later.
Back to Table of Contents

The real estate market in Menlo Park shows a strong demand for single-family homes, with only 0.8 months of inventory currently available for sale. In February, there were 21 new listings and 22 homes sold, providing 0.8 months of inventory; with a median sale price of $4.2m and median overbid of 96.5%. The average time on the market was 22 days.
The condo market in Menlo Park has 1.2 months of inventory currently available for sale. There were 3 new condo listings and 1 condo sold, with a median sale price of $1.2m and a median overbid of 98.1%. The average time on the market for condos was 52 days.

21 New Listings
22 Sold Listings
0.8 Months of Inventory
$4.2M Median Sale Price
96.5% Median Sale vs List
22 Avg Days on Market
This data was sourced from Broker Metrics on March 3rd, 2023 and includes all single-family homes, condos, and townhomes in the California Area above from February 2022 to February 2023 This may include preliminary data, and vary from the time the data was gathered All data is deemed reliable but not guaranteed Questions may be directed to KW Advisors 4154839285 Palo Alto | DRE# 01511642 Copyright KW Advisors 2023 Each Office is independently owned and operated
Condo & Townhomes
3 New Listings

1 Sold Listings
1.2 Months of Inventory
$1.2M Median Sale Price
98.1% Median Sale vs List
52 Avg Days on Market
Single-Family Homes
Last 12 months, year-over-year.
Condos & Townhomes
Last 12 months, year-over-year
The median sales price has increased from $34m last February 2022, to $42m as of February 2023
The median sales price has decreased from $1.8m last February 2022, to $12m as of February 2023
The overbid percentage has decreased from 107.6% last February 2022, to 96.5% a year later.
The overbid percentage has decreased from 100.5% last February 2022, to 98.1% a year later.
The average days on market went up from 8 days last February 2022, to 22 days as of February 2023.
The average days on market went up from 12 days in February 2022, to 52 days as of February 2023

In February, Palo Alto had 79 homes for sale providing the market with 1.3 months of inventory. There were 36 new listings and a total of 12 homes sold. The median sale price was $3.6m, and the median overbid was 102%. The average time on the market was 31 days.
There are 24 condo and townhome units for sale, providing the market with 2.2 months of inventory. There were 5 new listings for sale and only 1 condo sold, with a median sale price of $1.8m, and a median overbid of 100%. The average time on the market was 24 days.

36 New Listings
12 Sold Listings
1.3 Months of Inventory
$3.6M Median Sale Price
102% Median Sale vs List
31 Avg Days on Market
This data was sourced from Broker Metrics on March 3rd, 2023 and includes all single-family homes, condos, and townhomes in the California Area above from February 2022 to February 2023 This may include preliminary data, and vary from the time the data was gathered All data is deemed reliable but not guaranteed Questions may be directed to KW Advisors 4154839285 Palo Alto | DRE# 01511642 Copyright KW Advisors 2023 Each Office is independently owned and operated

Condo & Townhomes
5 New Listings
1 Sold Listings
2.2 Months of Inventory
$1.8M Median Sale Price
100% Median Sale vs List
24 Avg Days on Market
Single-Family Homes
Last 12 months, year-over-year.
Condos & Townhomes
Last 12 months, year-over-year
Single-Family Homes
The median sales price has decreased from $41m last February 2022, to $36m as of February 2023
Condos & Townhomes
The median sales price has increased from $1m last February 2022, to $18m as of February 2023
The average days on market went up from 11 days last February 2022, to 31 days as of February 2023.
Condos & Townhomes
The average days on market went up from 9 days in February 2022, to 24 days as of February 2023
Condos & Townhomes
The overbid percentage has decreased from 99.1% last February 2022, to 100% a year later.
The overbid percentage has decreased from 113.3% last February 2022, to 102% a year later. Back

In February, there were 12 single-family homes for sale with 6 new listings and 2 homes sold The median sale price was $6.7m with an overbid of 84.3%. The average days on market was 15.
There are currently no condos for sale, inventory, new listings, or condo sales reported in February and January.

6 New Listings
2 Sold Listings
2 Months of Inventory
$6.7M Median Sale Price
84.3% Median Sale vs List
15 Avg Days on Market
This data was sourced from Broker Metrics on March 3rd, 2023 and includes all single-family homes, condos, and townhomes in the California Area above from February 2022 to February 2023 This may include preliminary data, and vary from the time the data was gathered All data is deemed reliable but not guaranteed Questions may be directed to KW Advisors 4154839285 Palo Alto | DRE# 01511642 Copyright KW Advisors 2023 Each Office is independently owned and operated

Single-Family Homes
Last 12 months, year-over-year.
Condos & Townhomes
Last 12 months, year-over-year
Single-Family Homes
The median sales price has increased from $0 last February 2022, to $67m as of February 2023
Condos & Townhomes
No data for this month.
Single-Family Homes
The average days on market went up from 0 days last February 2022, to 15 days as of February 2023.
Condos & Townhomes
The average days on market went up from 0 days in February 2022, to 0 days as of February 2023
Single-Family Homes
The overbid percentage has increased from 0% last February 2022, to 84.3% a year later.
Condos & Townhomes
The overbid percentage has decreased from 0% last February 2022, to 0% a year later.
Back to Table of Contents

In February, Redwood City had 23 singlefamily homes sold, a median sale price of $18m The median overbid was at 977% and the average time on the market was 26 days. In terms of inventory, there are currently 26 homes for sale providing the market with 1.1 months of inventory.
For condos, there were a total of 5 units sold. The median sale price increased from to $1.2m, and the median overbid decreased to 95.2%. The average time on the market decreased to 30 days. There are currently 12 condos for sale providing the market with 1.2 months of inventory.

26 New Listings
23 Sold Listings
1.1 Months of Inventory
$1.8M Median Sale Price
97.7% Median Sale vs List
26 Avg Days on Market
This data was sourced from Broker Metrics on March 3rd, 2023 and includes all single-family homes, condos, and townhomes in the California Area above from February 2022 to February 2023 This may include preliminary data, and vary from the time the data was gathered All data is deemed reliable but not guaranteed Questions may be directed to KW Advisors 4154839285 Palo Alto | DRE# 01511642 Copyright KW Advisors 2023 Each Office is independently owned and operated
Condo & Townhomes

12 New Listings
5 Sold Listings
1.2 Months of Inventory
$1.2M Median Sale Price
95.2% Median Sale vs List
30 Avg Days on Market
Single-Family Homes
Last 12 months, year-over-year.
Condos & Townhomes
Last 12 months, year-over-year
The median sales price has decreased from $24m last February 2022, to $18m as of February 2023
Condos
The median sales price has decreased from $1.7m last February 2022, to $12m as of February 2023
Single-Family Homes
The overbid percentage has decreased from 116.2% last February 2022, to 97.7% a year later.
The overbid percentage has decreased from 112.3% last February 2022, to 95.2% a year later.
The average days on market went up from 12 days last February 2022, to 26 days as of February 2023.
The average days on market went up from 11 days in February 2022, to 30 days as of February 2023

What data?
In Febru family h $1.3m. T and the 13 days. 23 home with 0.7 For con sold. Th $1.3m, a to 98.6% increase 23 cond with 3 m

Condo & Townhomes
23 New Listings
4 Sold Listings
3 Months of Inventory
$1.3M Median Sale Price
98.6% Median Sale vs List
20 Avg Days on Market
Single-Family Homes
The median sales price has decreased from $24m last February 2022, to $23m as of February 2023
Condos & Townhomes
The median sales price has decreased from $1.4m last February 2022, to $13m as of February 2023
Single-Family Homes
The overbid percentage has increased from 114.6% last February 2022, to 97.44% a year later.
Condos & Townhomes
The overbid percentage has decreased from 112.5% last February 2022, to 98.6% a year later.
Single-Family Homes
The average days on market went up from 7 days last February 2022, to 13 days as of February 2023.
Condos & Townhomes
The average days on market went up from 8 days in February 2022, to 20 days as of February 2023

1.3 months of inventory.

Single-Family Homes
The median sales price has decreased from $2m last February 2022, to $18m as of February 2023
Condos & Townhomes
The median sales price has decreased from $900k last February 2022, to $894k as of February 2023
The overbid percentage has decreased from 112.9% last February 2022, to 103.1% a year later.
Condos & Townhomes
The overbid percentage has decreased from 102.6% last February 2022, to 99.7% a year later.
The average days on market went down from 12 days last February 2022, to 6 days as of February 2023.
Condos
The average days on market went up from 16 days in February 2022, to 25 days as of February 2023
In Febru homes f months listings a median was $2m family ho in Janua for single There we for sale, p of invent sale and sale pric overbid was 992% The average time on the market was 45 days.

Condo & Townhomes
107 New Listings
72 Sold Listings
1.3 Months of Inventory
$983K Median Sale Price
99.2% Median Sale vs List
45 Avg Days on Market
Single-Family Homes
The median sales price has decreased from $19m last February 2022, to $2m as of February 2023
Condos & Townhomes
The median sales price has decreased from $1m last February 2022, to $983k as of February 2023
The overbid percentage has decreased from 114% last February 2022, to 100% a year later. Back
Condos & Townhomes
The overbid percentage has decreased from 105.4% last February 2022, to 99.2% a year later.
The average days on market went up from 16 days last February 2022, to 35 days as of February 2023.
Condos & Townhomes
The average days on market went up from 26 days in February 2022, to 45 days as of February 2023

In February, Santa Clara had 543 single family homes for sale, providing only 0. months of inventory There were 624 n listings and 352 homes sold, with a median sale price of $1.5m and a media overbid of 100%. There was an average 33 days on the market.
There were 229 units for sale, providing only 0.7 months of inventory. There we 243 new listings for sale and 183 condo units sold, with the median sale price a $850k and the median overbid at 100% The average days on the market decreased to 33.

4 ings
176 Sold Listings
9 of Inventory
$2M Median Sale Price
0% Sale vs List
35 Avg Days on Market
s sourced from InfoSparks on March 3rd, 2023 and includes all homes, condos and townhomes in the displayed California Area February 2022 to February 2023 This may include preliminary y vary from the time the data was gathered All data is deemed not guaranteed Questions may be directed to KW Advisors - 6506273700 DRE# 01995149 | DRE# 01906450 Copyright KW Each Office is independently owned and operated
Condo & Townhomes
107 New Listings
72 Sold Listings
1.3 Months of Inventory
$983K Median Sale Price

99.2% Median Sale vs List
45 Avg Days on Market
Last 12 months,
The median sales price has decreased from $18m last February 2022, to $15m as of February 2023
Condos
The median sales price has decreased from $985k last February 2022, to $850k as of February 2023
Single-Family Homes
The overbid percentage has decreased from 115.8% last February 2022, to 100% a year later.
The overbid percentage has decreased from 107.9% last February 2022, to 100% a year later.
The average days on market went up from 15 days last February 2022, to 33 days as of February 2023.
The average days on market went up from 16 days in February 2022, to 33 days as of February 2023


No data for this month
Single-Family Homes
The median sales price has increased from $22m last February 2022, to $237m as of February 2023
Condos & Townhomes
No data for this month.
Single-Family Homes
The average days on market went up from 7 days last February 2022, to 17 days as of February 2023.
Condos & Townhomes
The average days on market went up from 0 days in February 2022, to 0 days as of February 2023
Single-Family Homes
The overbid percentage has decreased from 99.4% last February 2022, to 91.1% a year later.
Condos & Townhomes
The overbid percentage has decreased from 0% last February 2022, to 0% a year later.