That's really the question you should be asking yourself.
Our market is incredibly diverse, and rapidly changing. Values vary not just by neighborhood, but by street. Your home isn't necessarily worth what your neighbors’ home is. At the end of the day, it’s the current market that sets the value of your home.
So, do you know what your home is worth in today's market?
I can help...
Contact me for a confidential, no obligation assessment of your home's value.
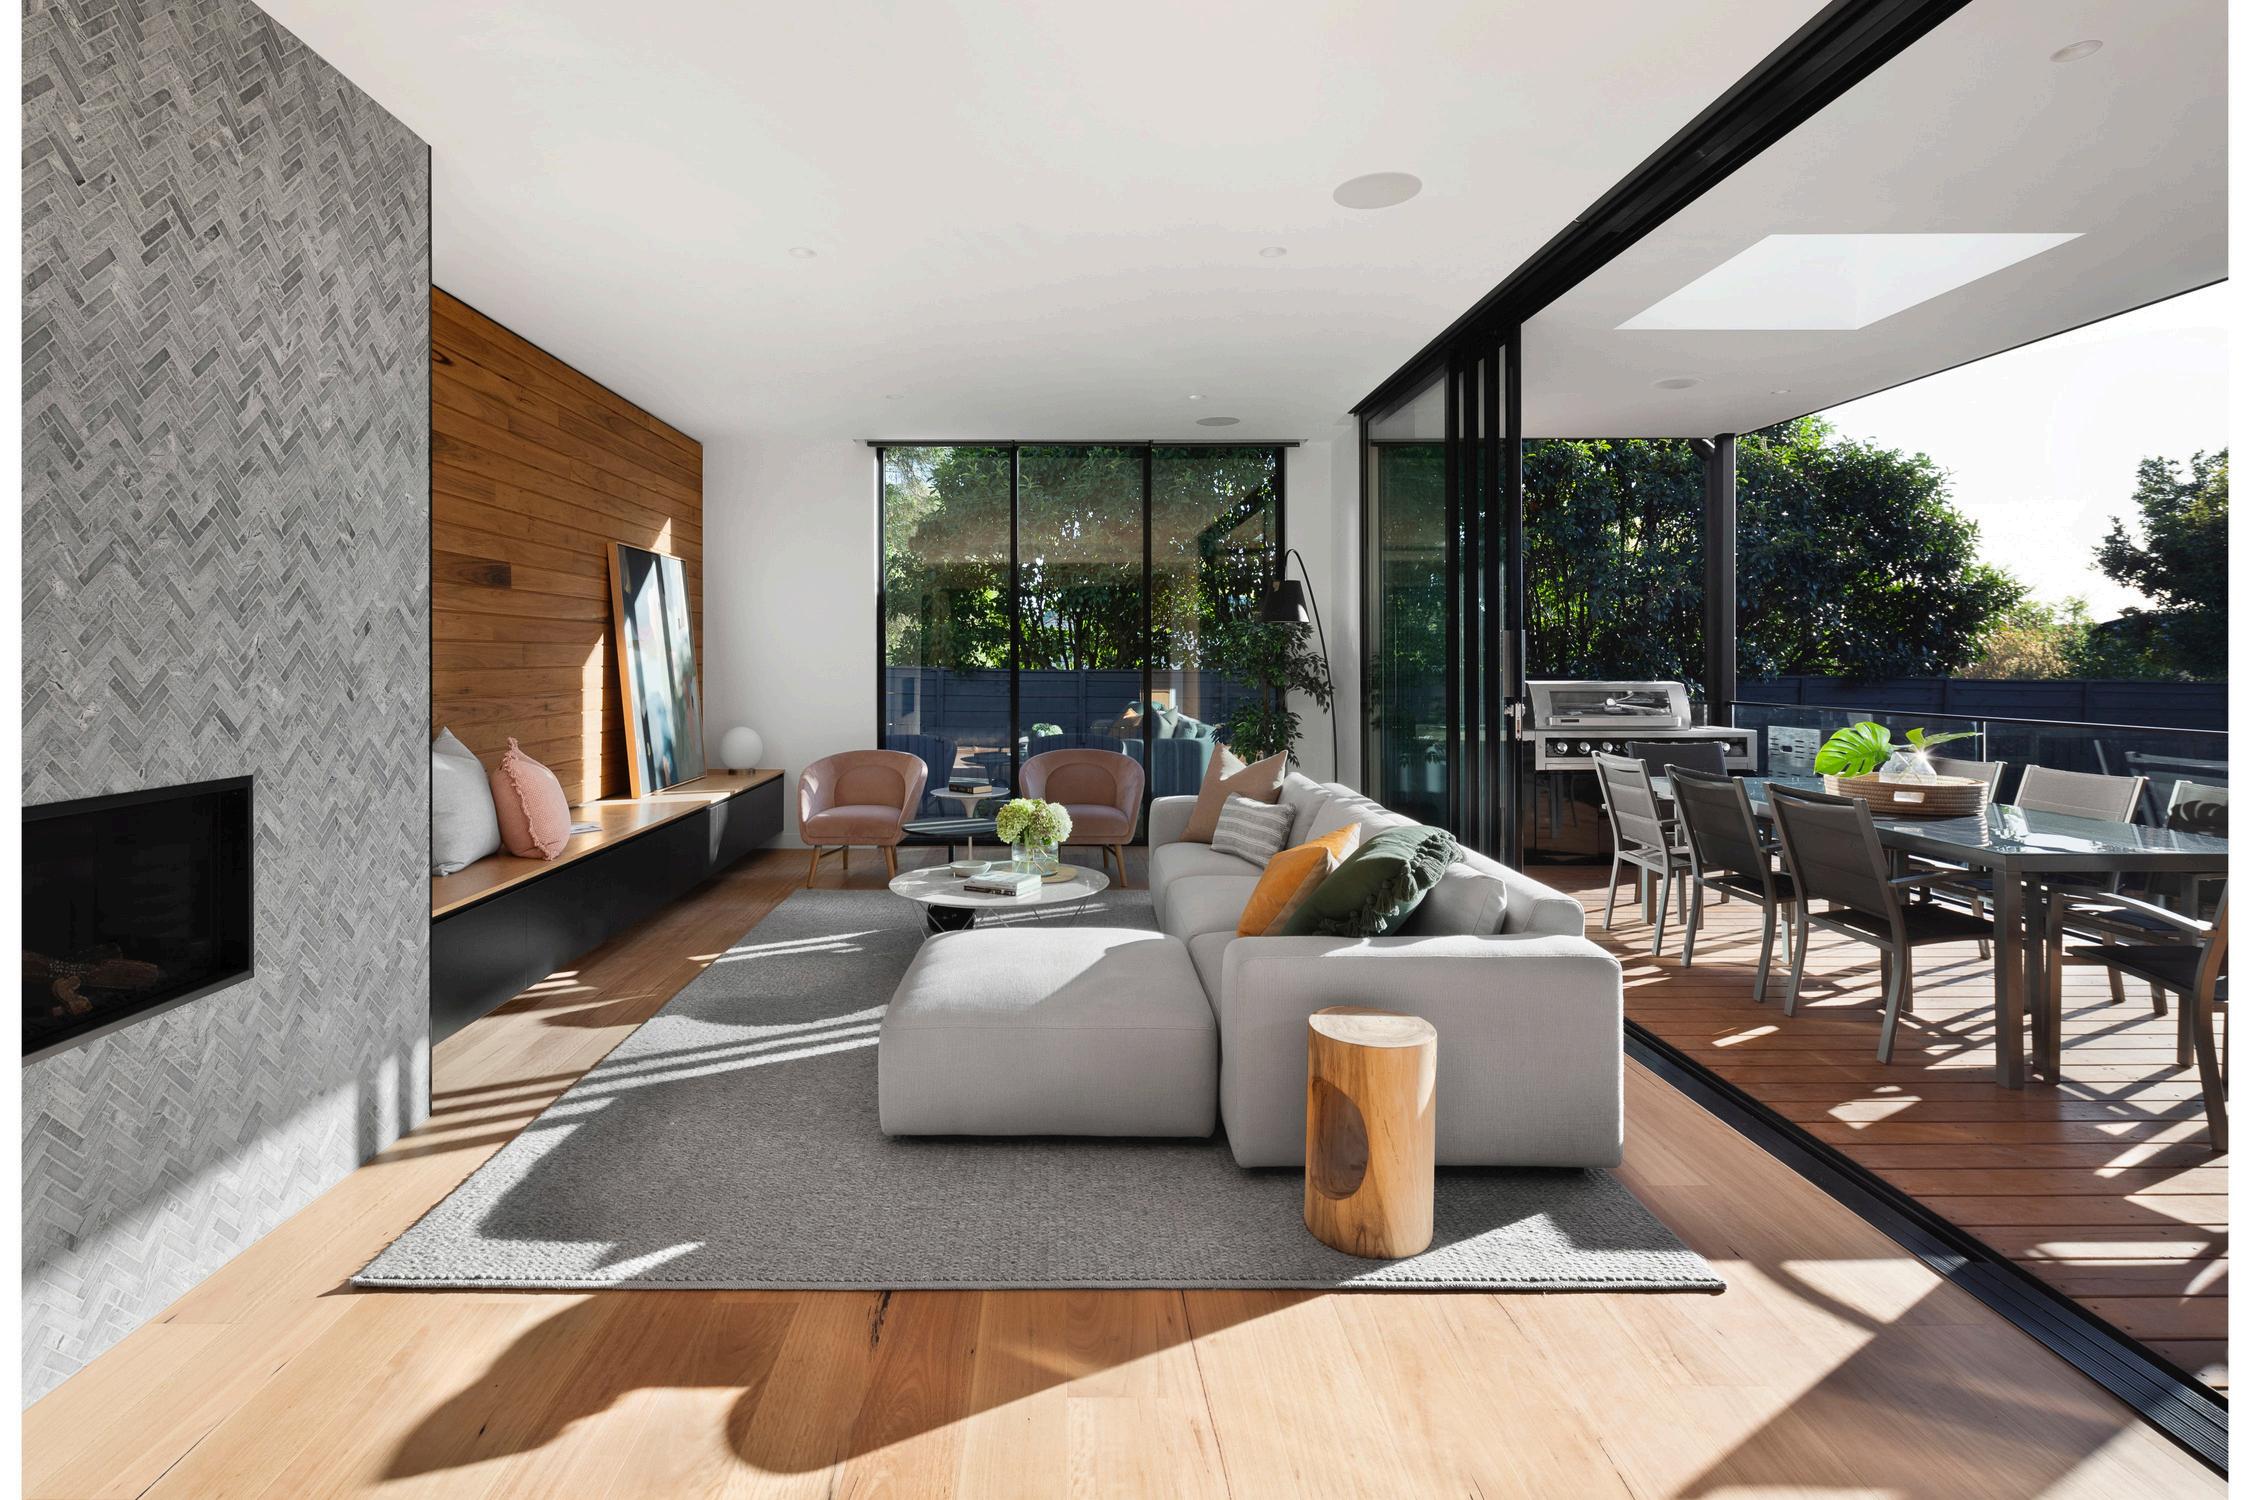
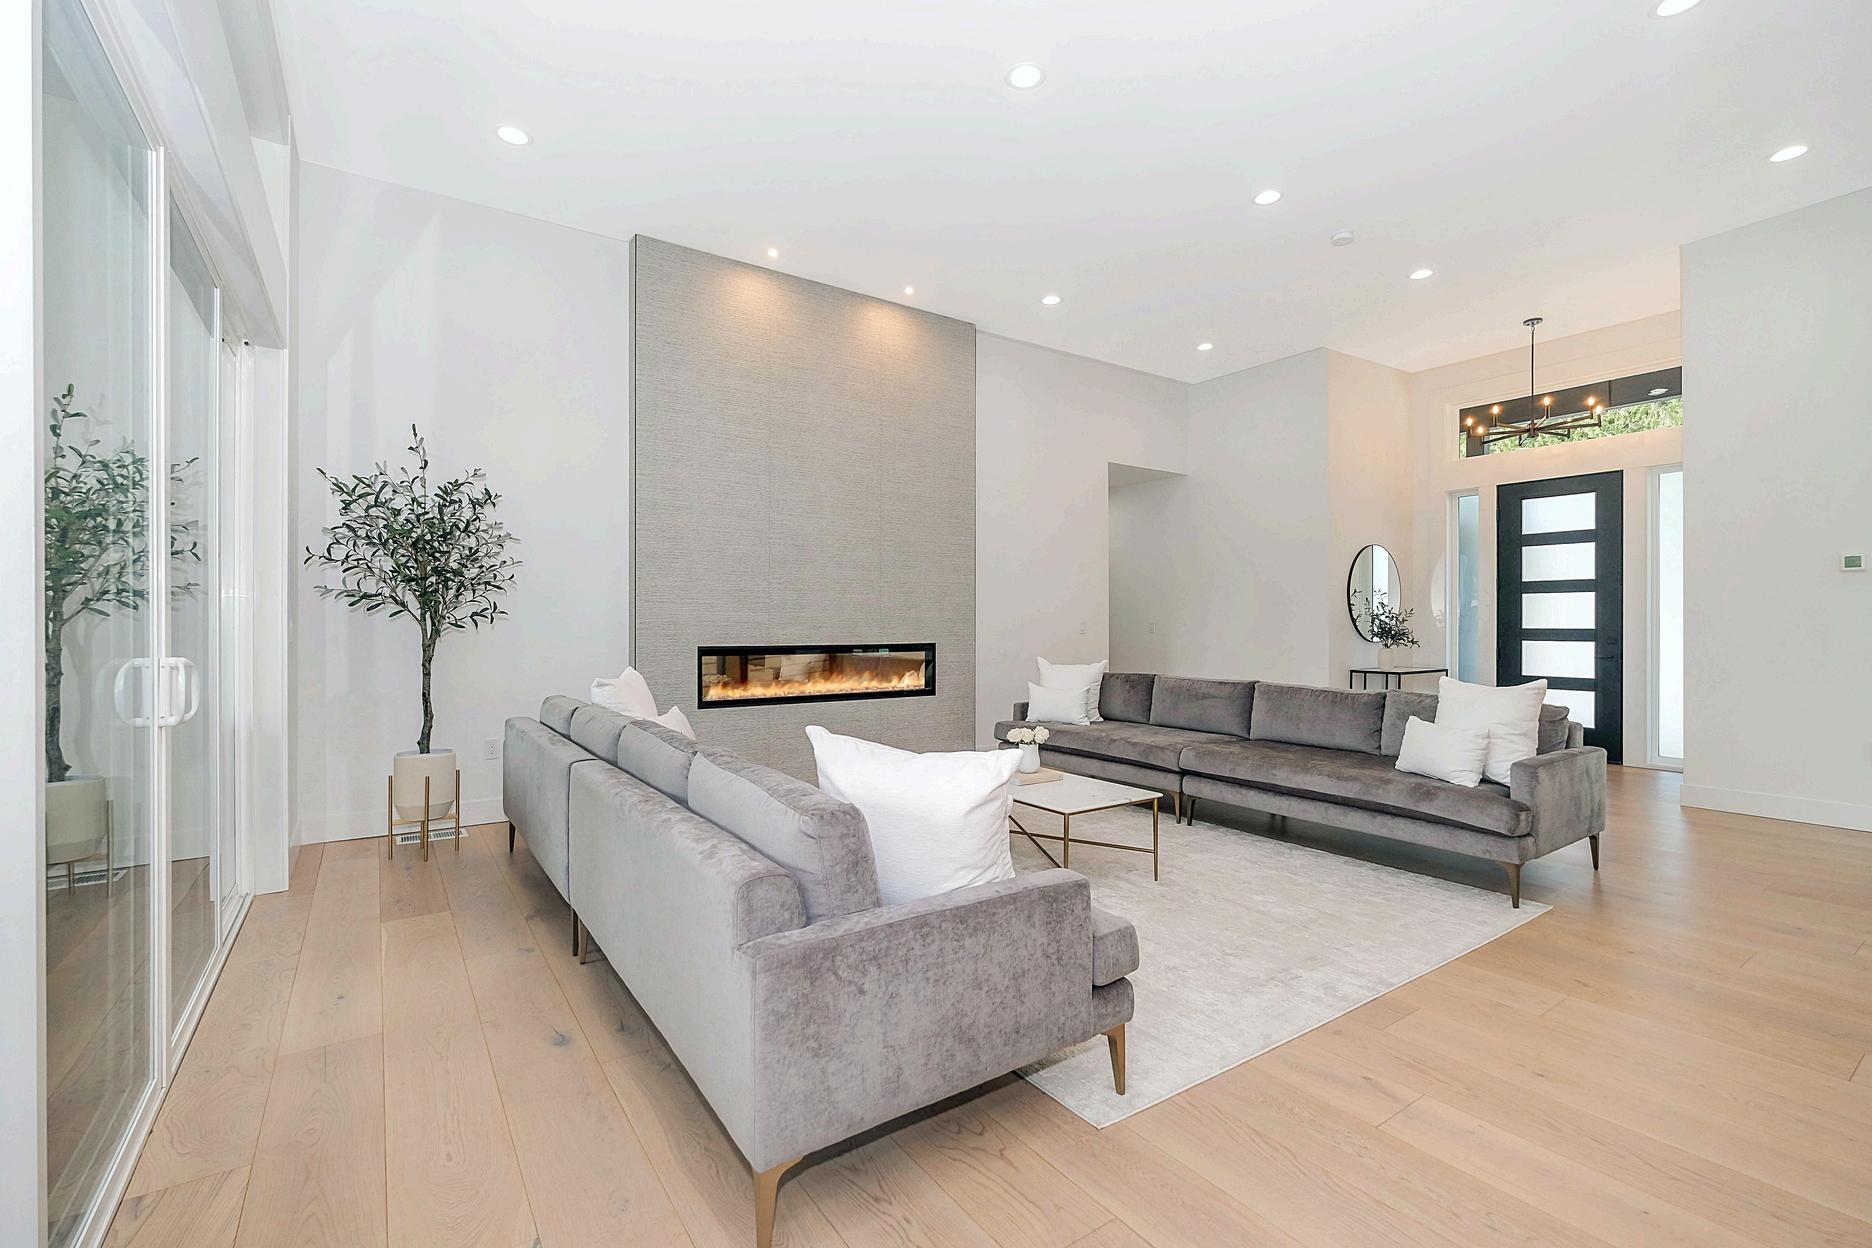
WhySomeHomesSell FasterThanOthers
As you think ahead to your own move, you may have noticed some houses sell within days, while others linger. But why is that? As Redfin says:
“. . . today’s housing market has been topsy-turvy since the pandemic. Low inventory (though rising) and high prices have created a strange mix: Some homes are flying off the market, while others sit for weeks.”
That may leave you wondering what you should expect when you sell. Let’s break it down and give you some actionable tips on how to make sure your house is one that sells quickly.
Avoid paying off debts or collections without professional advice.
Don't have your credit report pulled too many times - this can hurt your credit score. 3 4 5 6 1 2
Always consult your mortgage professional before making large financial moves. Use verified funds for deposits to prevent closing delays.
Santa Clara County
What's in the Santa Clara County data?
The market for Single Family Homes, Condo, and Townhomes units saw 1,158 closed sales at a median price of $1.7m. There was a total of 2,065 new listings with an average of 16 days on the market without price reduction and with an average price per square foot of $1,132.
April 2025
2,065
$1,132 New Listings
Average Price Per SqFt +18.4% Year-over-Year -0 8% Year-over-Year
1,158
$1.7M
16 $2.4B Average Days-on-Market Total Volume +14.3% Year-over-Year +3% Year-over-Year
Data includes all single family, townhome, and condominium sales in Santa Clara County sourced from MLS Listings The most recent quarter’s data is based on available numbers, but may change with late reported activity Data from sources deemed reliable but may contain errors and are subject to revision
20 Average Days-on Market
$1M Median Sale Price
329 Closed Sales
$814 Average Price Per SqFt
$367M Total Volume
Luxury Listings for Sale
April 2025
799
Year-over-Year
493
Average Price Per SqFt
$1,137 New Listings
4% Year-over-Year
$1.6M
Year-over-Year -0 7%Year-over-Year
23 $1.1B Average Days-on-Market Total Volume +13 7% Year-over-Year
Data includes all single family, townhome, and condominium sales in San Mateo County sourced from MLS Listings The most recent quarter’s data is based on available numbers, but may change with late reported activity Data from sources deemed reliable but may contain errors and are subject to revision
573 New Listings
368 Closed Sales
20 Average Days-on-Market
$2M
Median Sale Price
$1,239
Average Price Per SqFt
$1B Total Volume
Data includes all single family, townhome, and condominium sales in San Mateo County sourced from MLS Listings. The most recent quarter’s data is based on available numbers, but may change with late reported activity. Data from sources deemed reliable but may contain errors and are subject to revision.
33 Average Days-on Market
$980K Median Sale Price
125 Closed Sales
$836 Average Price Per SqFt
$137M Total Volume
Luxury Listings for Sale
San Francisco County
What's in the San Francisco County data?
The market for Single Family Homes, Condo, and Townhomes units saw 407 closed sales at a median price of $1.5m. There was a total of 667 new listings with an average of 33 days on the market without price reduction and with an average price per square foot of $1,070.
April 2025
667
$1,070 New Listings
Average Price Per SqFt +2.3% Year-over-Year +1 9% Year-over-Year
407
Year-over-Year
9% Year-over-Year
33 $766M
Average Days-on-Market Total Volume -10.8% Year-over-Year -6 2% Year-over-Year
Data includes all single family, townhome, and condominium sales in San Francisco County sourced from MLS Listings The most recent quarter’s data is based on available numbers, but may change with late reported activity Data from sources deemed reliable but may contain errors and are subject to revision
183 Closed Sales
1,066
Average Price Per SqFt
270M
Total Volume
Alameda County
What's in the Alameda County data?
The market for Single Family Homes, Condo, and Townhomes units saw 897 closed sales at a median price of $1.1m. There was a total of 1,820 new listings with an average of 23 days on the market without price reduction and with an average price per square foot of $747.
April 2025
1,820
Average Price Per SqFt +18.7% Year-over-Year
$747 New Listings
2% Year-over-Year
897
$1.1M
3% Year-over-Year
23 $1.1B Average Days-on-Market Total Volume +27.8% Year-over-Year -8 6% Year-over-Year
Data includes all single family, townhome, and condominium sales in Alameda County sourced from MLS Listings The most recent quarter’s data is based on available numbers, but may change with late reported activity Data from sources deemed reliable but may contain errors and are subject to revision
Single Family Homes
1,337
New Listings
680 Closed Sales
20 Average Days-on-Market
$1.3M
Median Sale Price
$791
Average Price Per SqFt
$985M
Total Volume
Data includes all single family, townhome, and condominium sales in Alameda County sourced from MLS Listings. The most recent quarter’s data is based on available numbers, but may change with late reported activity. Data from sources deemed reliable but may contain errors and are subject to revision.