That's the question you should be asking yourself.
Our market is incredibly diverse and rapidly changing. Values vary not just by neighborhood but by street. Your home isn't necessarily worth what your neighbors' home is. It's the current market that sets the value of your home.
So, do you know what your home is worth in today's market?
Icanhelp...
Contact me for a confidential, no obligation assessment of your home's value.
The#1ThingSellersNeedTo KnowAboutTheirAskingPrice
When you put your house on the market, you want to sell it quickly and for the best price possible; that’s generally the goal. But too many sellers are shooting too high right now. They don’t realize the market has shifted as inventory has grown. The side effect? Price cuts are on the rise, but they really don’t have to be. Here’s why.
Smart Strategies for a Mortgage Application
Avoid paying off debts or collections without professional advice.
Don't have your credit report pulled too many times - this can hurt your credit score. 3 4 5 6 1 2
Always consult your mortgage professional before making large financial moves. Use verified funds for deposits to prevent closing delays.
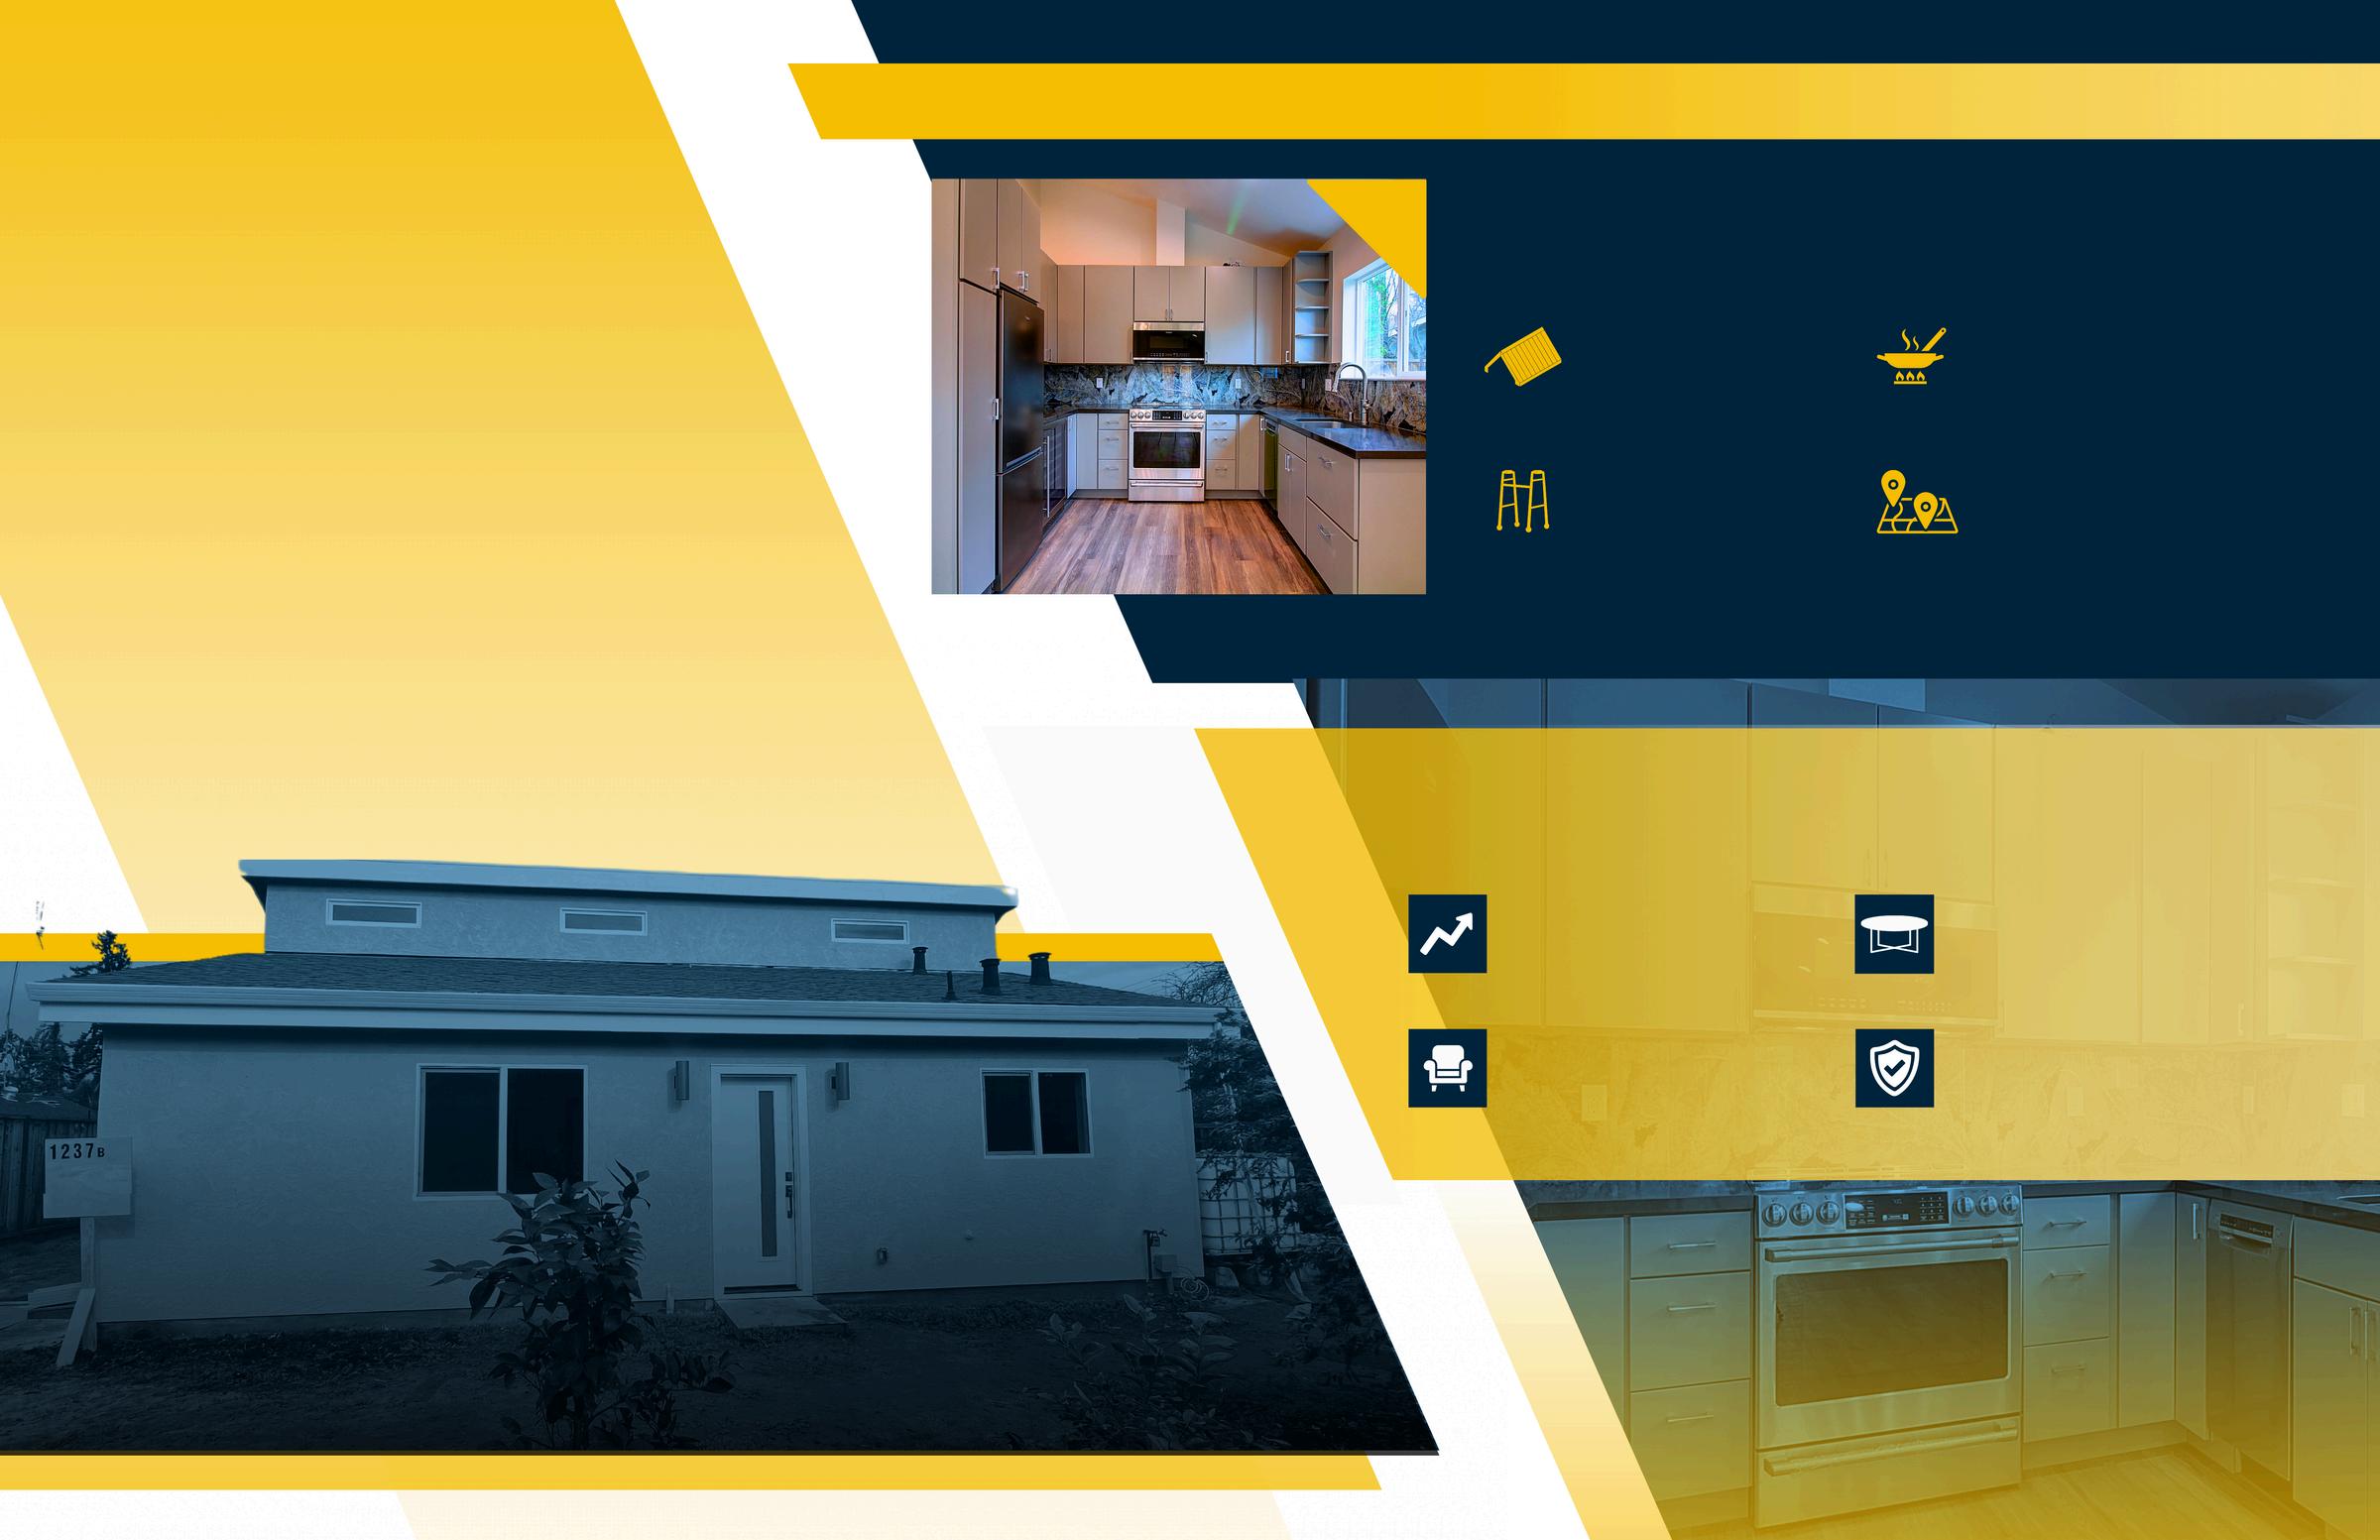
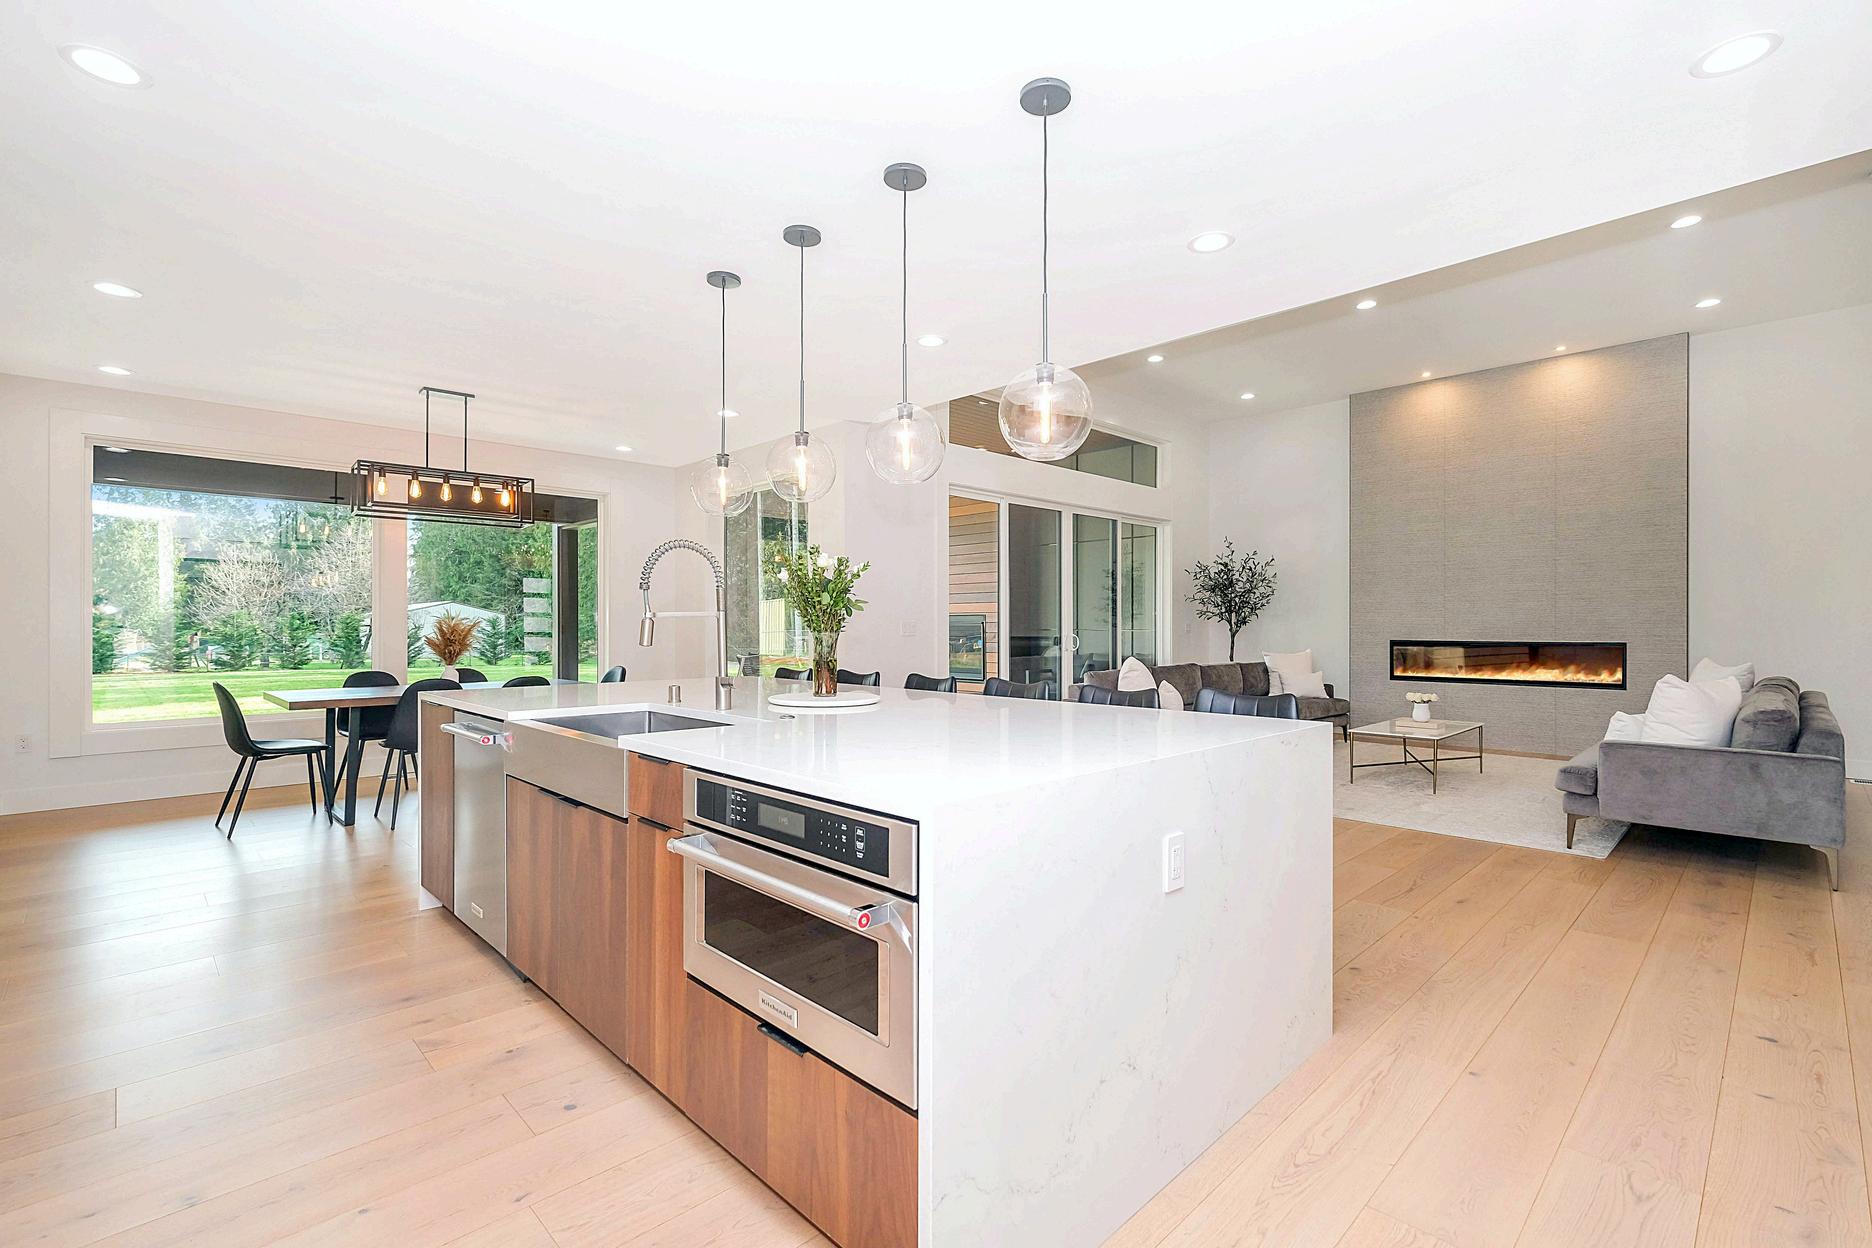
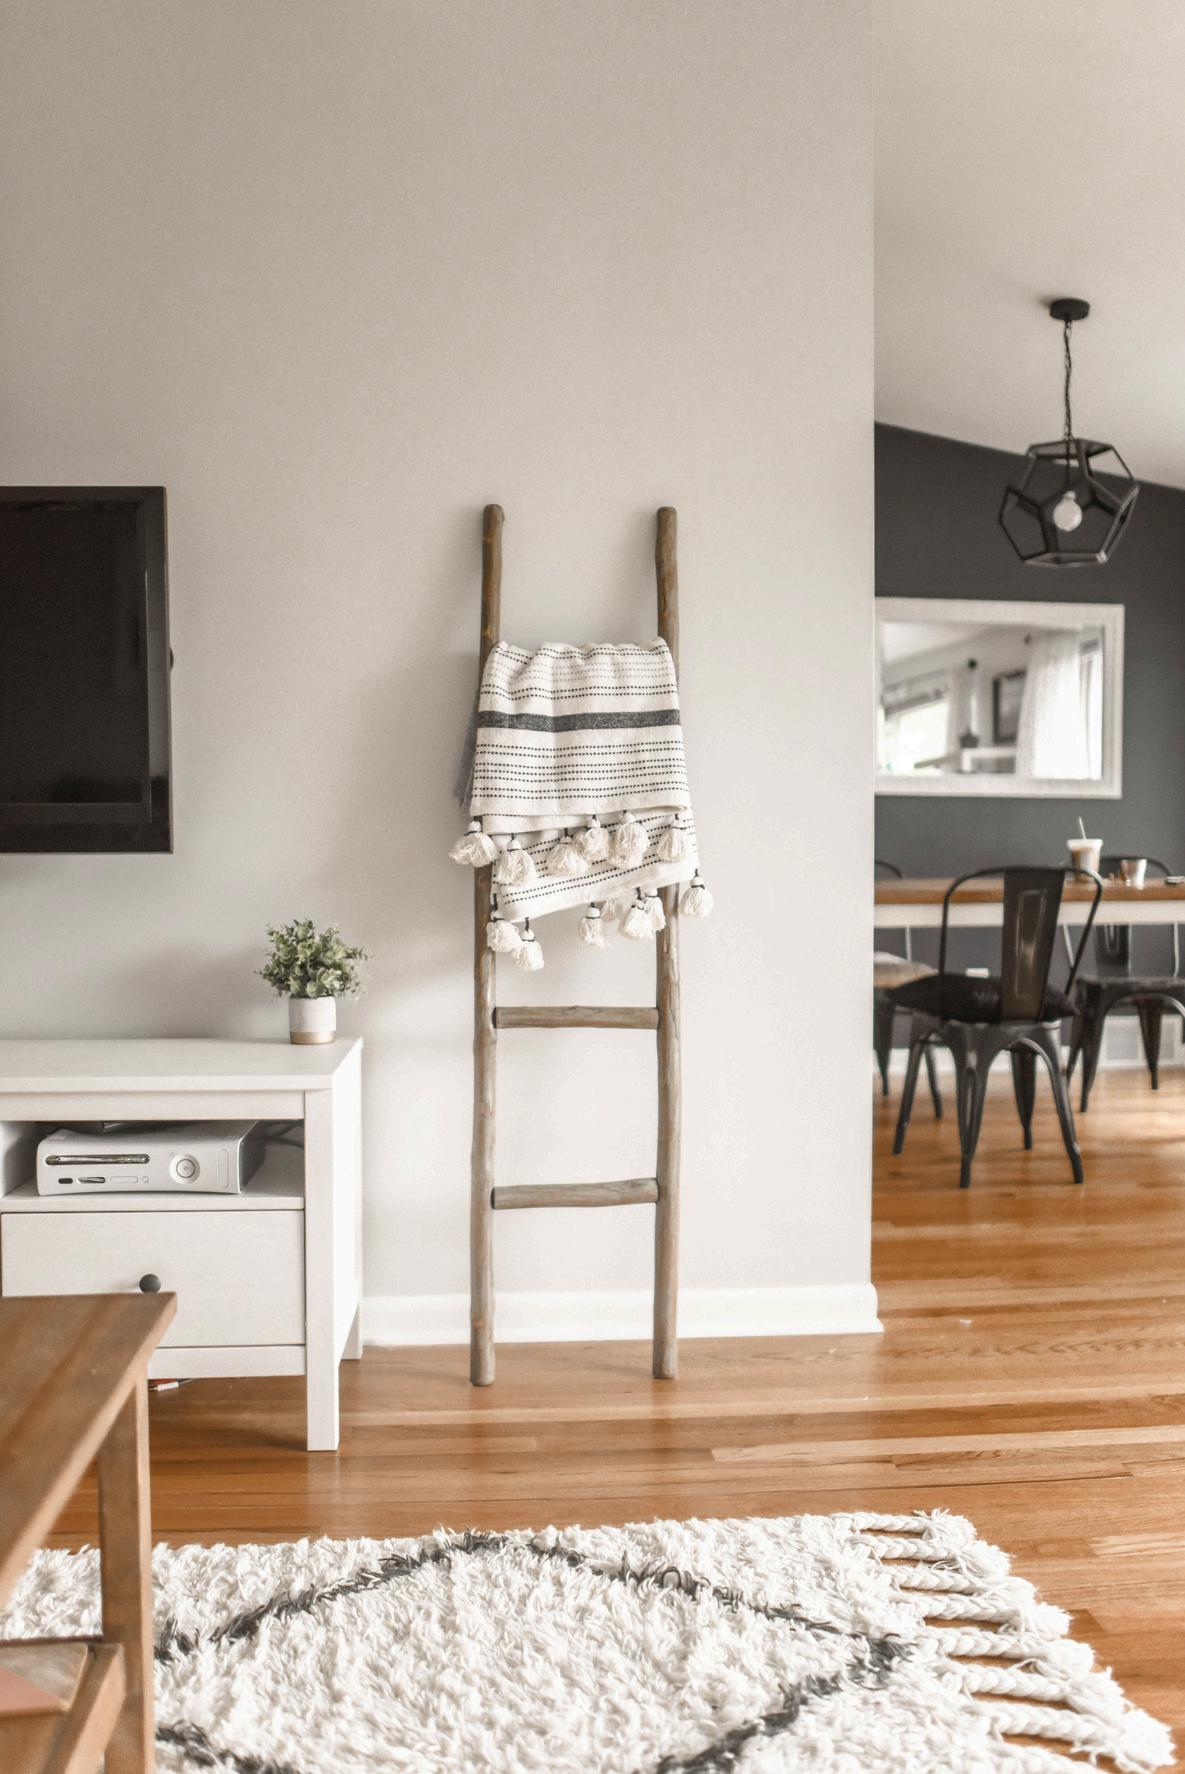
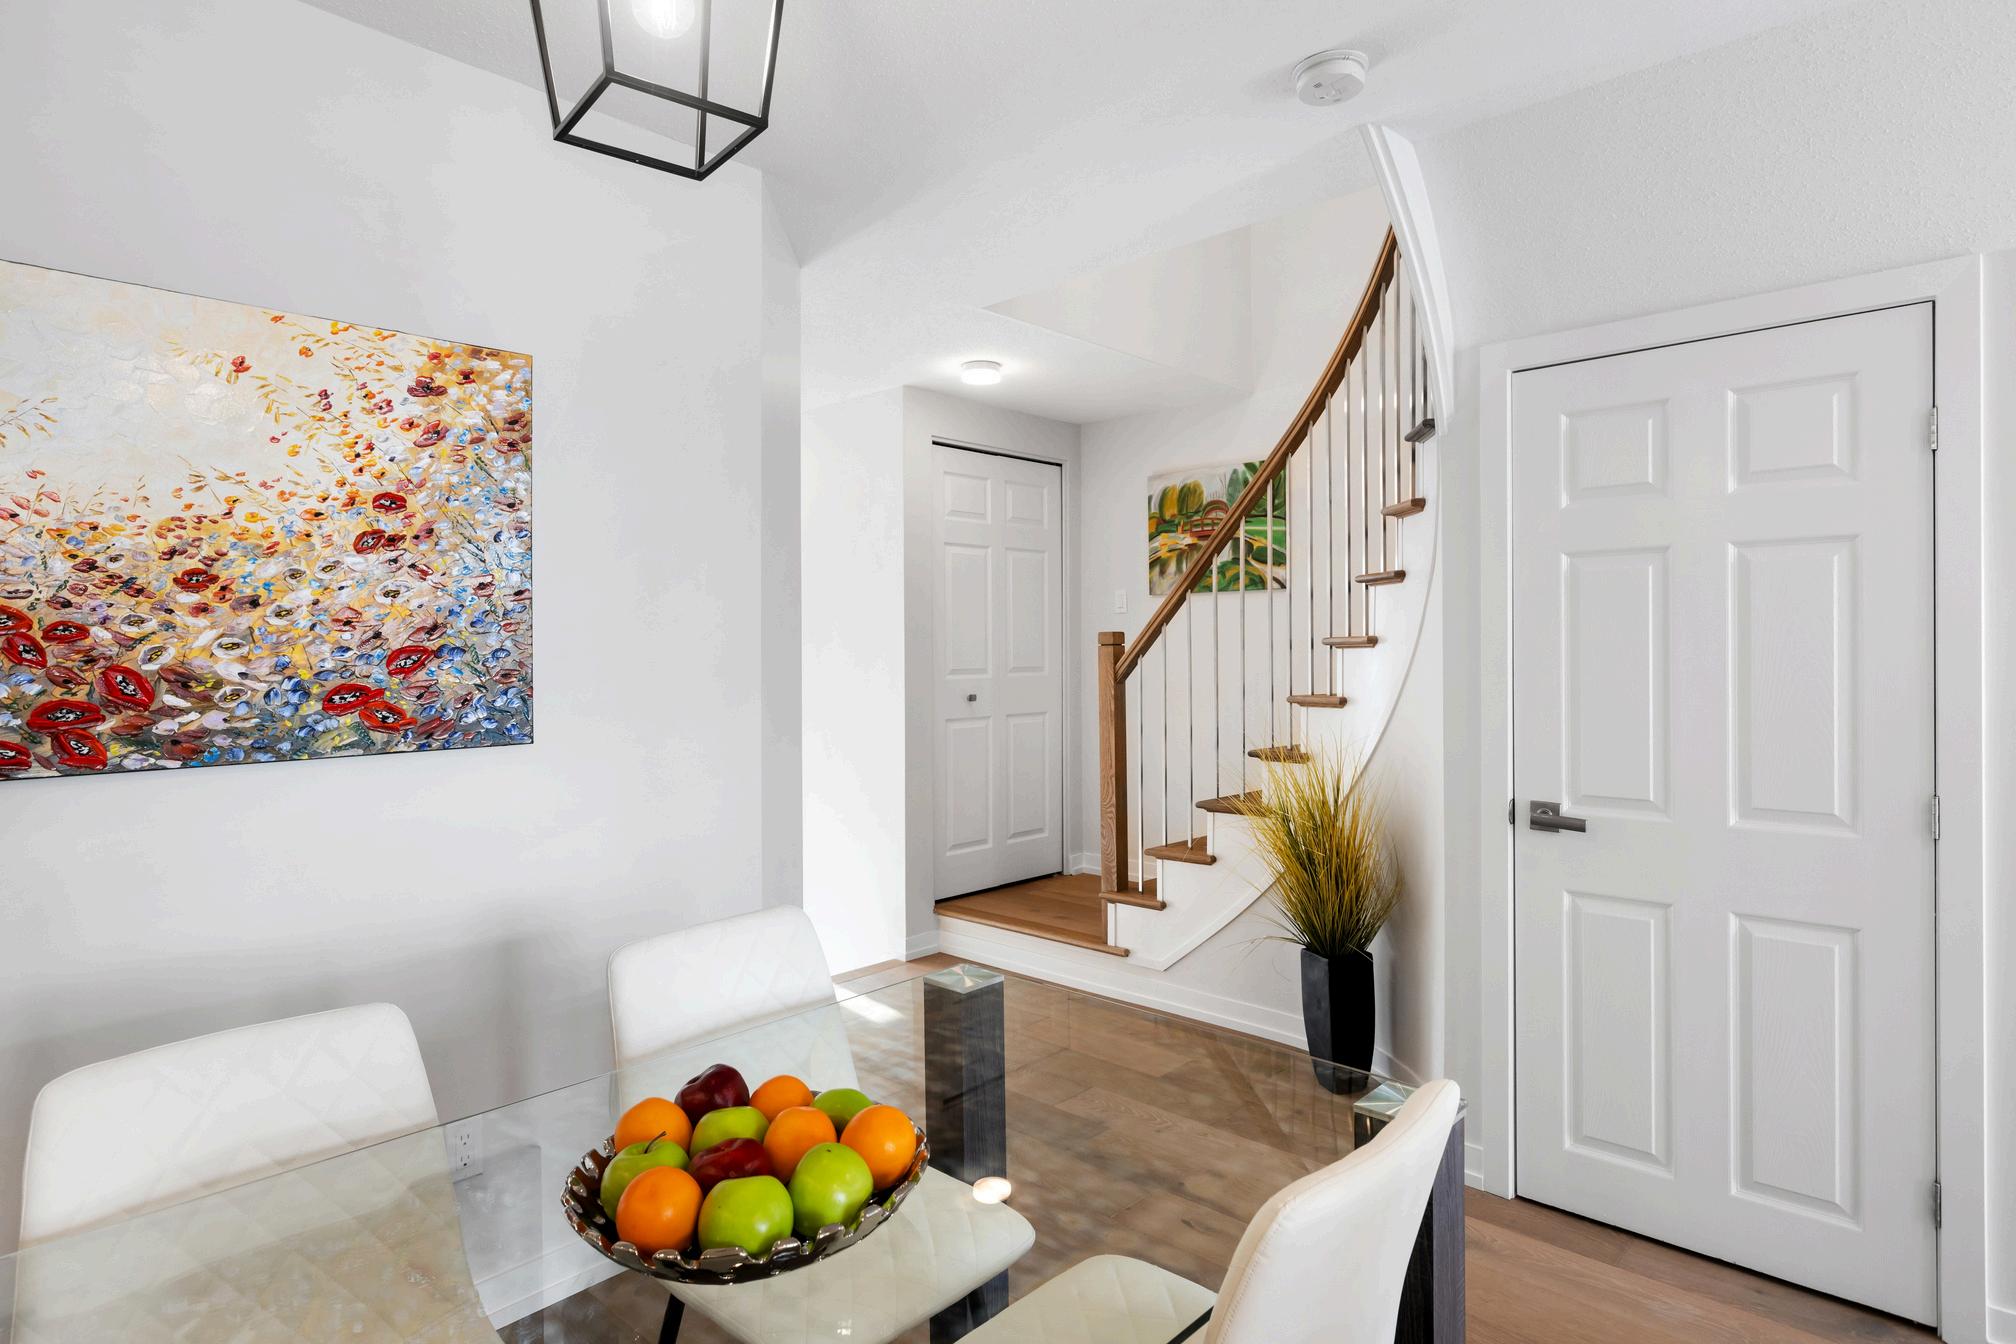
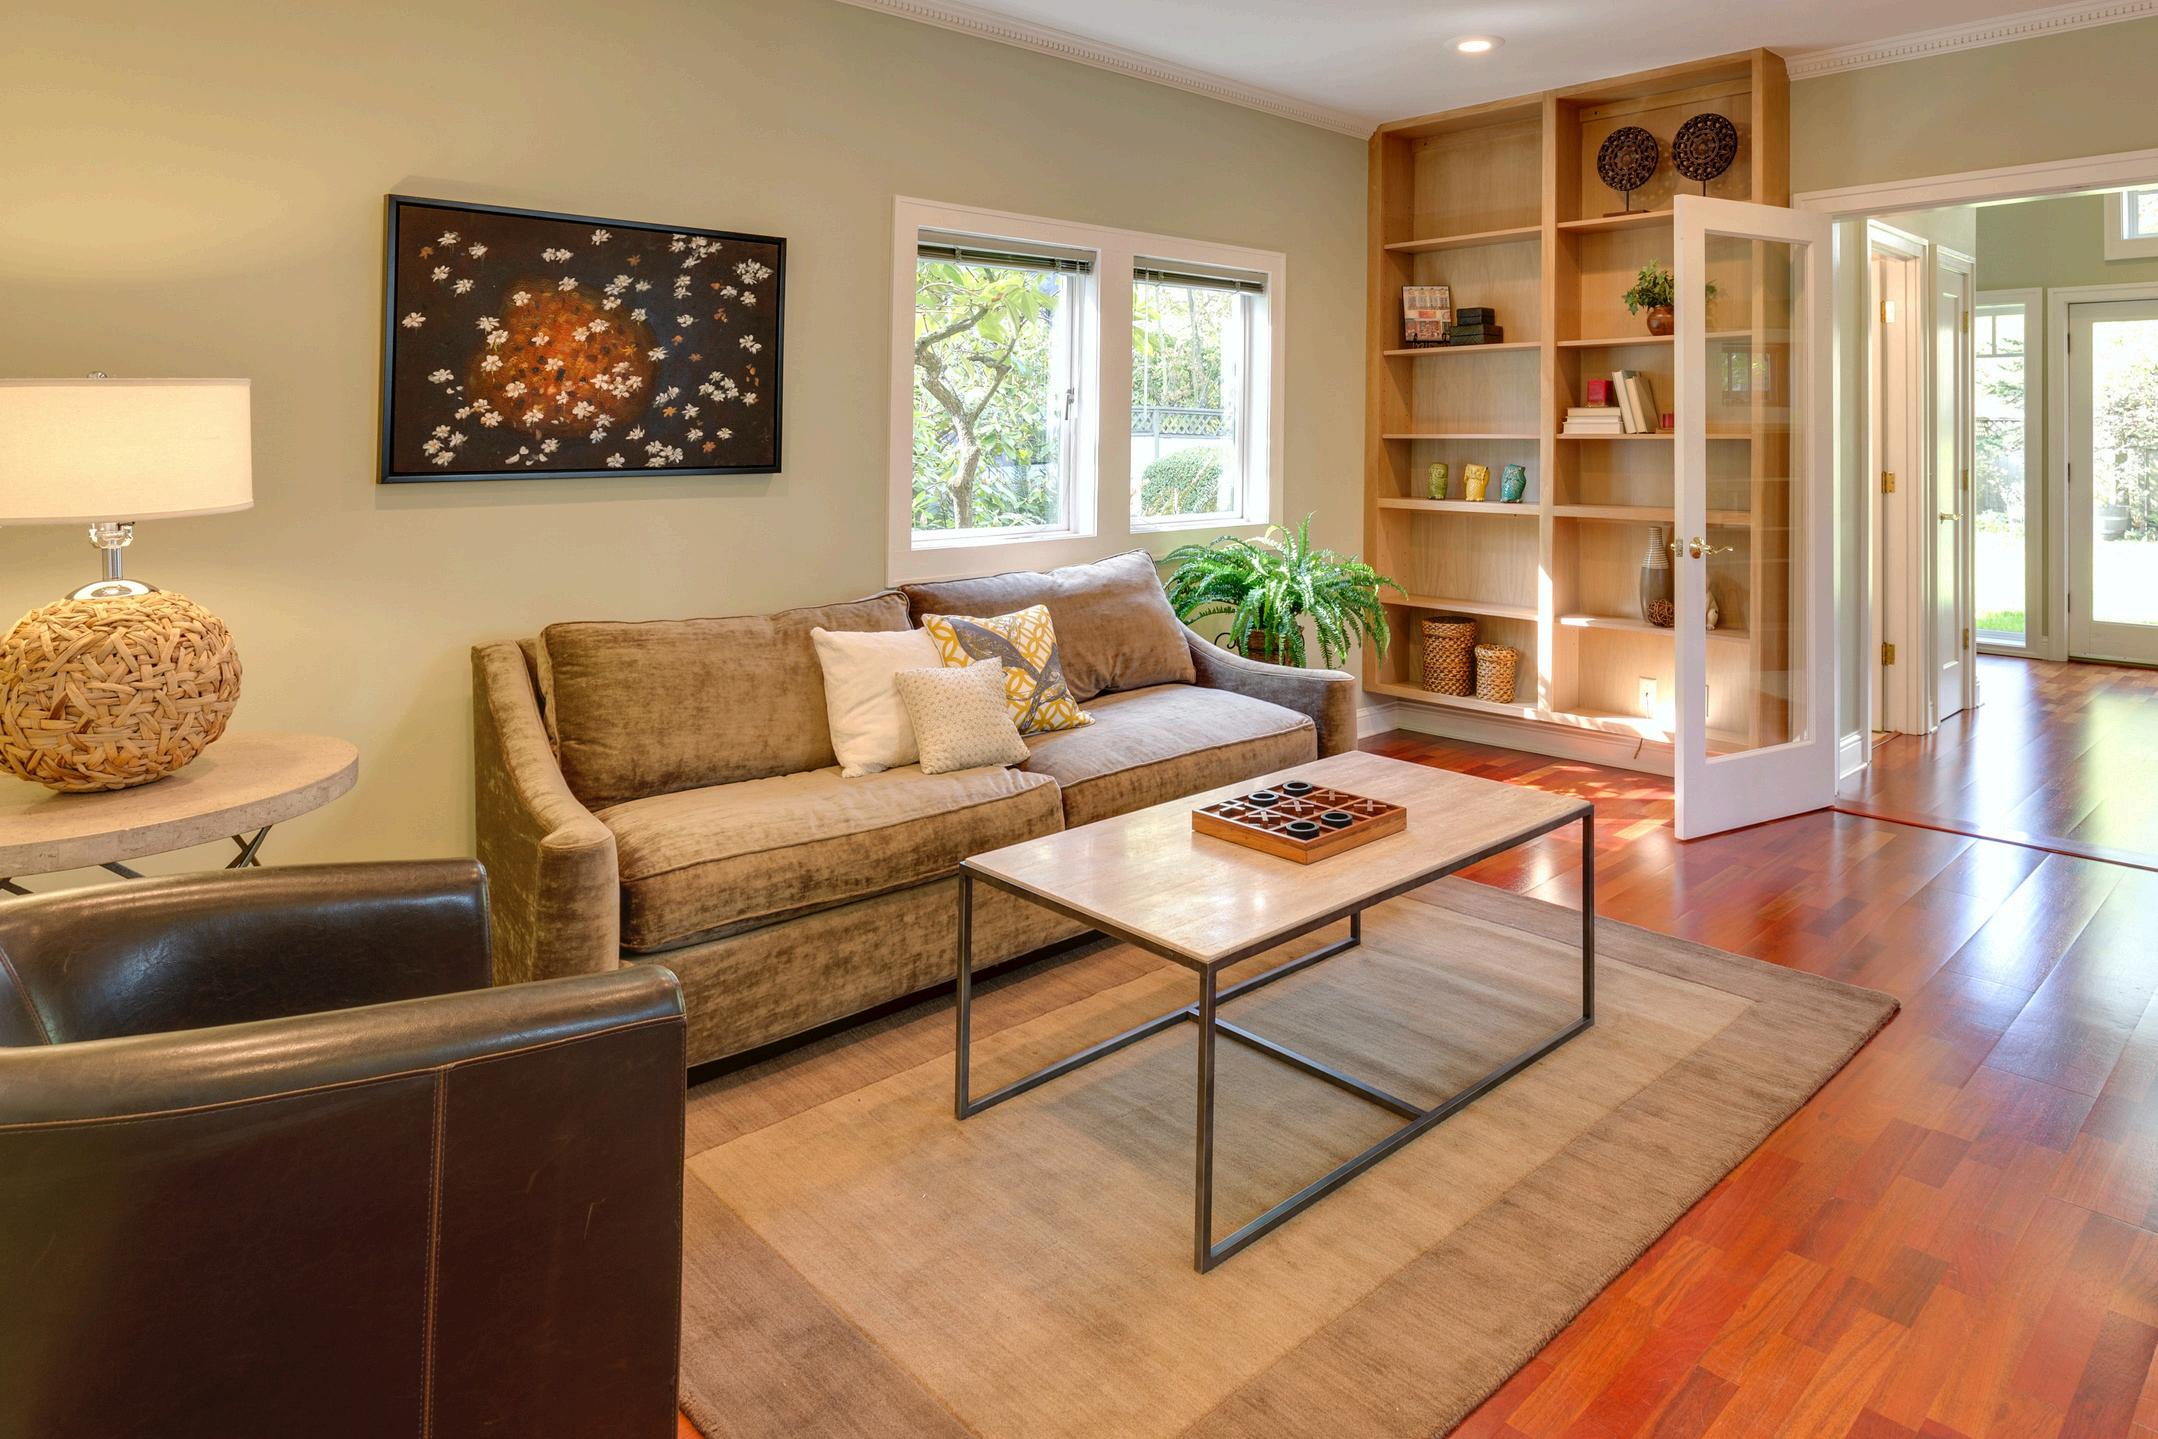
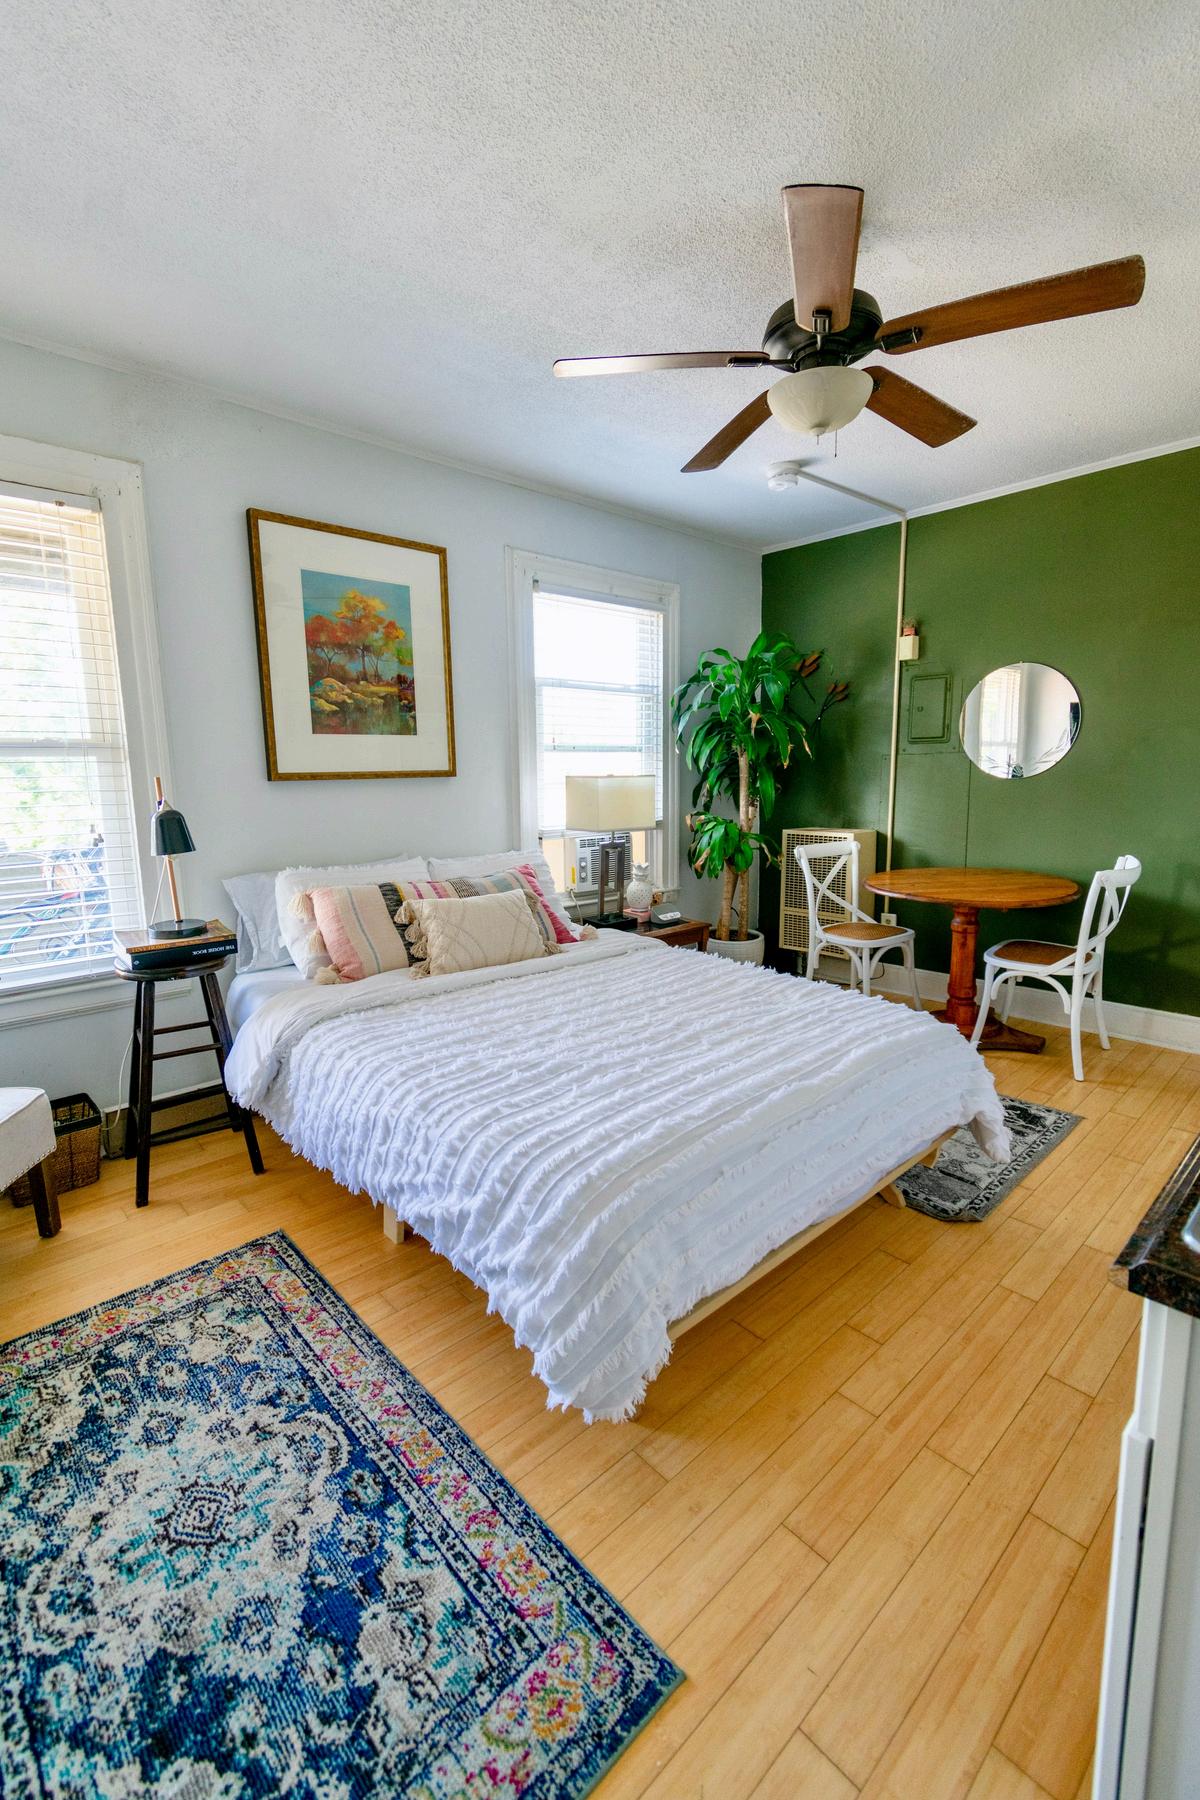
HomeRenovationsThatCanMakea BIG IMPACT AccordingtoExperts
Enhancing Property Value and Family Living Space with an Acton ADU
The Anenberg-Essert family in Campbell collaborated with Acton ADU to create a versatile, comfortable, and valuable addition to their property. This ADU project is a shining example of how a well-designed accessory dwelling unit can increase property value and serve a family’s unique needs.
GoalsandVision
The family envisioned an ADU that would function as an independent living space for family members, enhance their property’s worth, and provide seamless integration with the main home They wanted a space that balanced privacy with connectivity, feeling like a natural extension of their residence
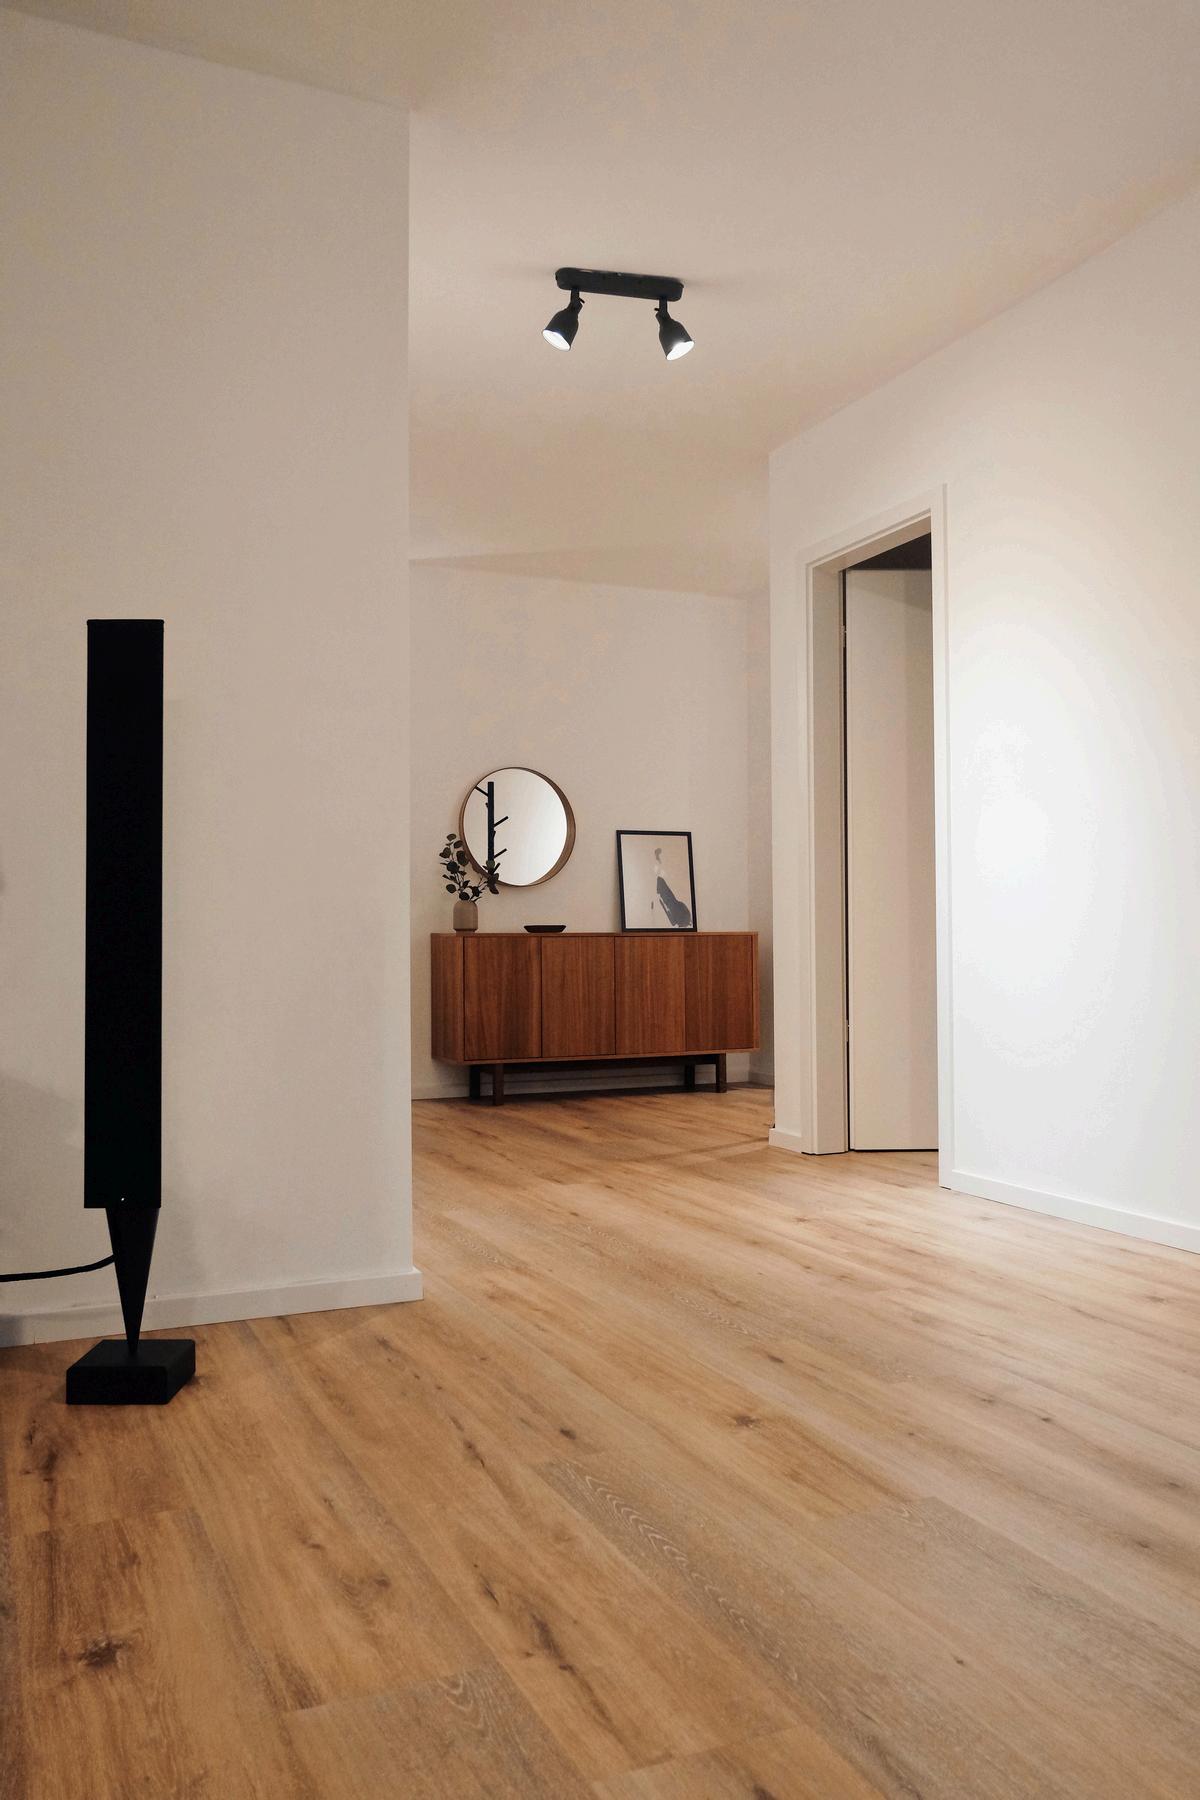
Design and Construction Details
Constructed at 747 square feet, this ADU was designed with modern, high-quality finishes to serve both aesthetic and practical needs. Key features include:
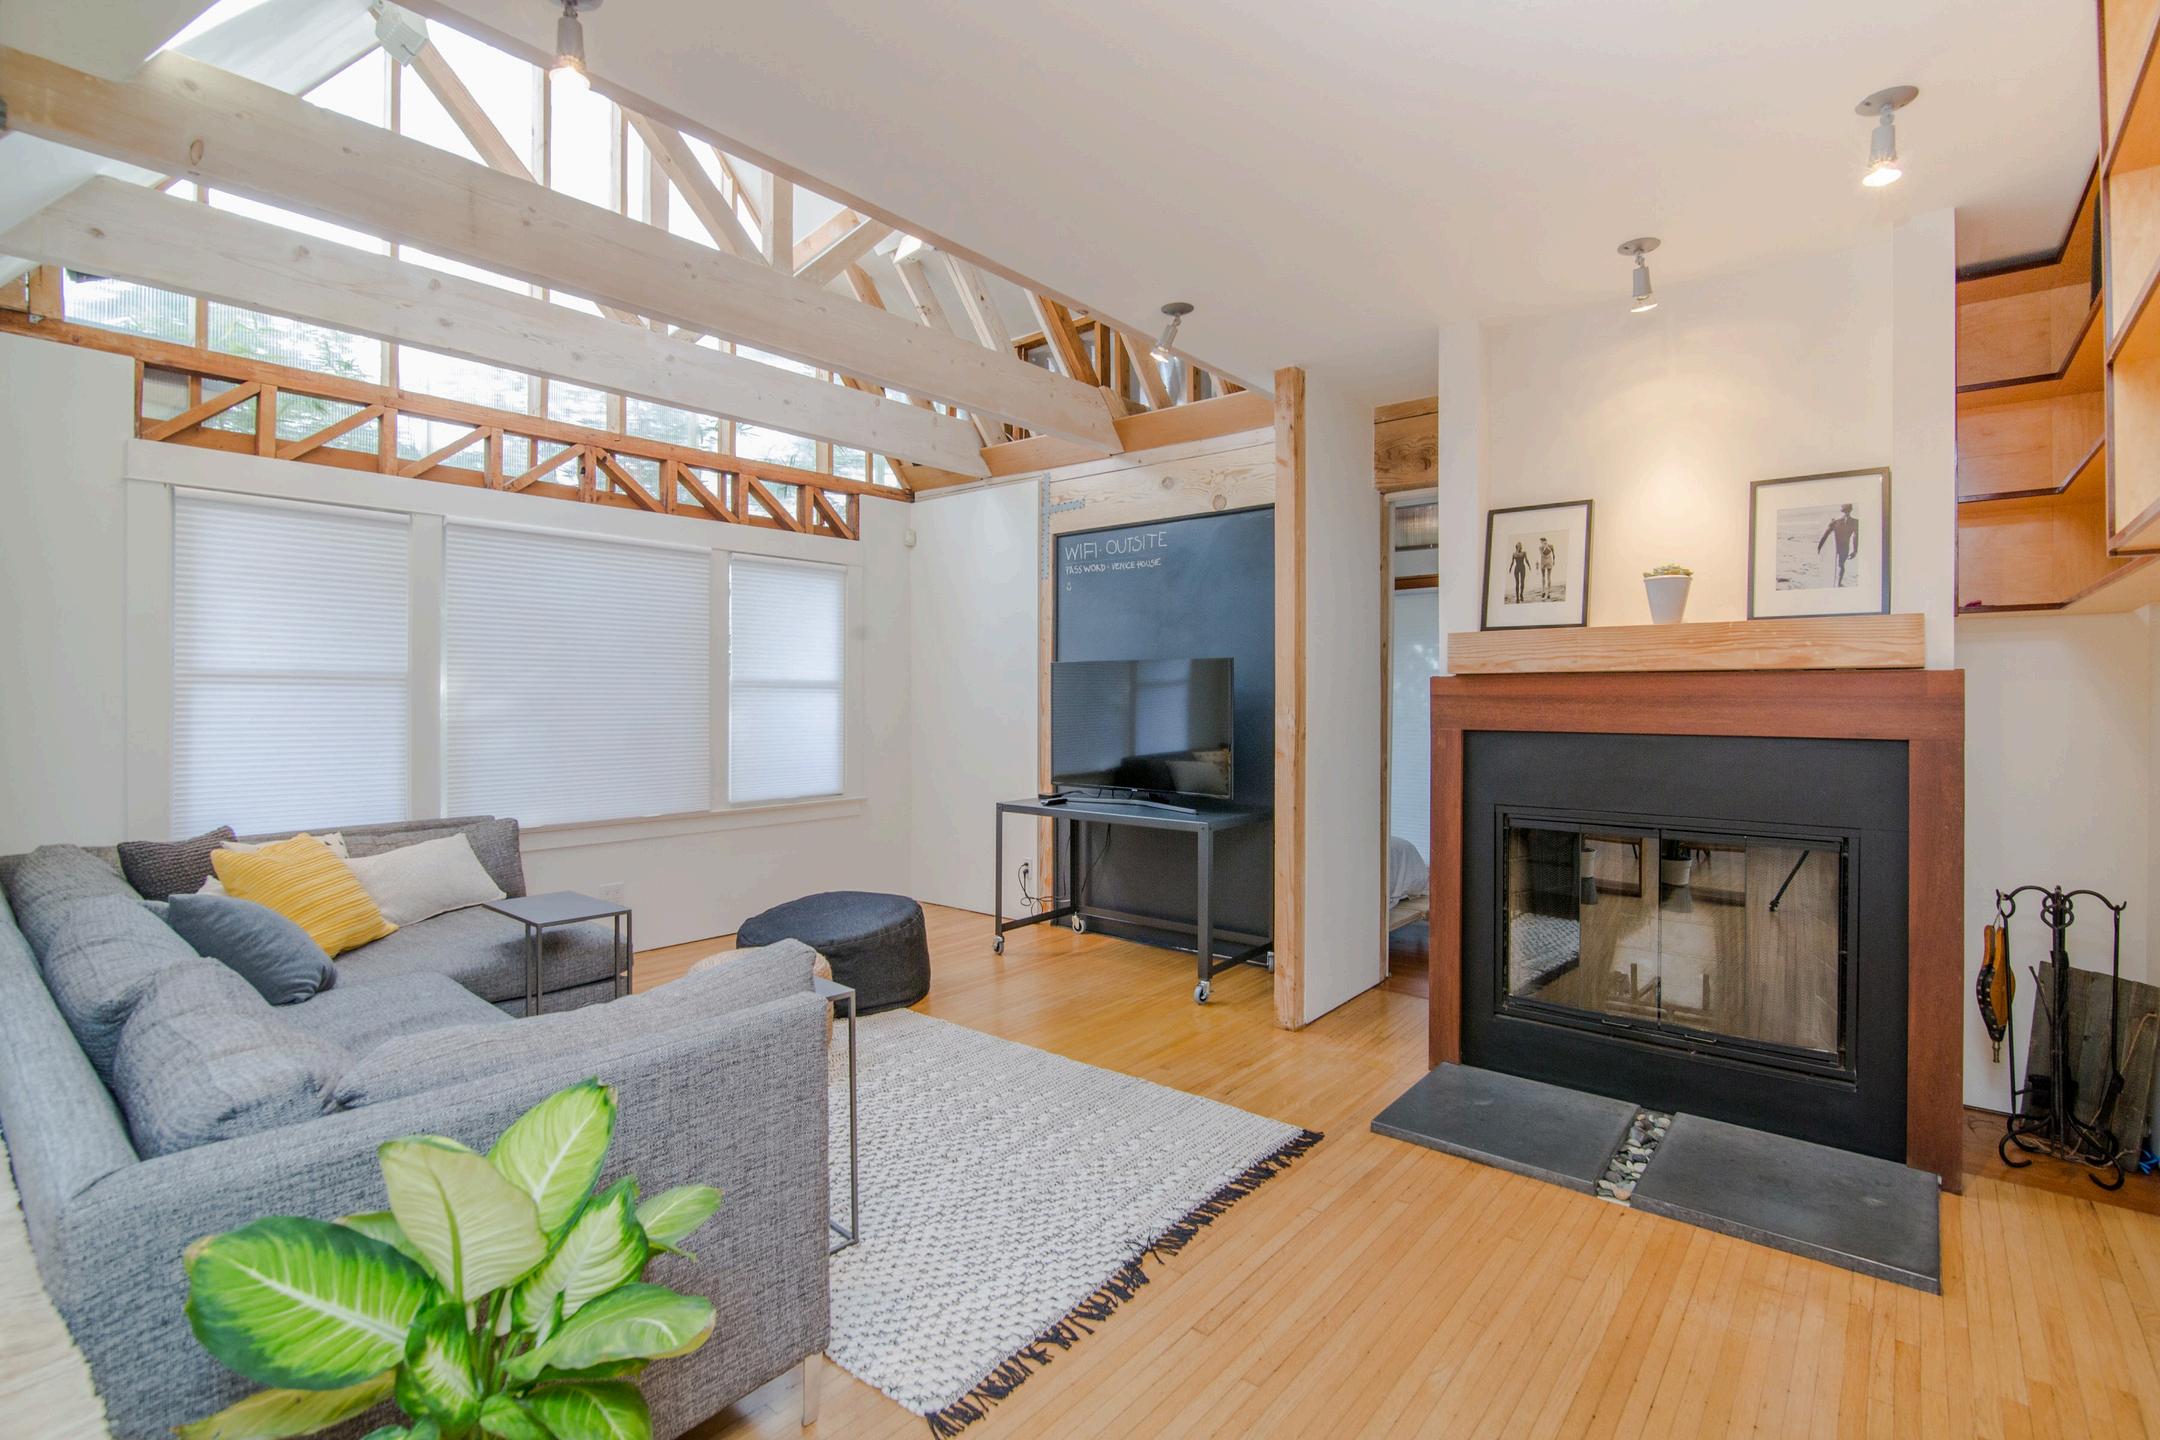
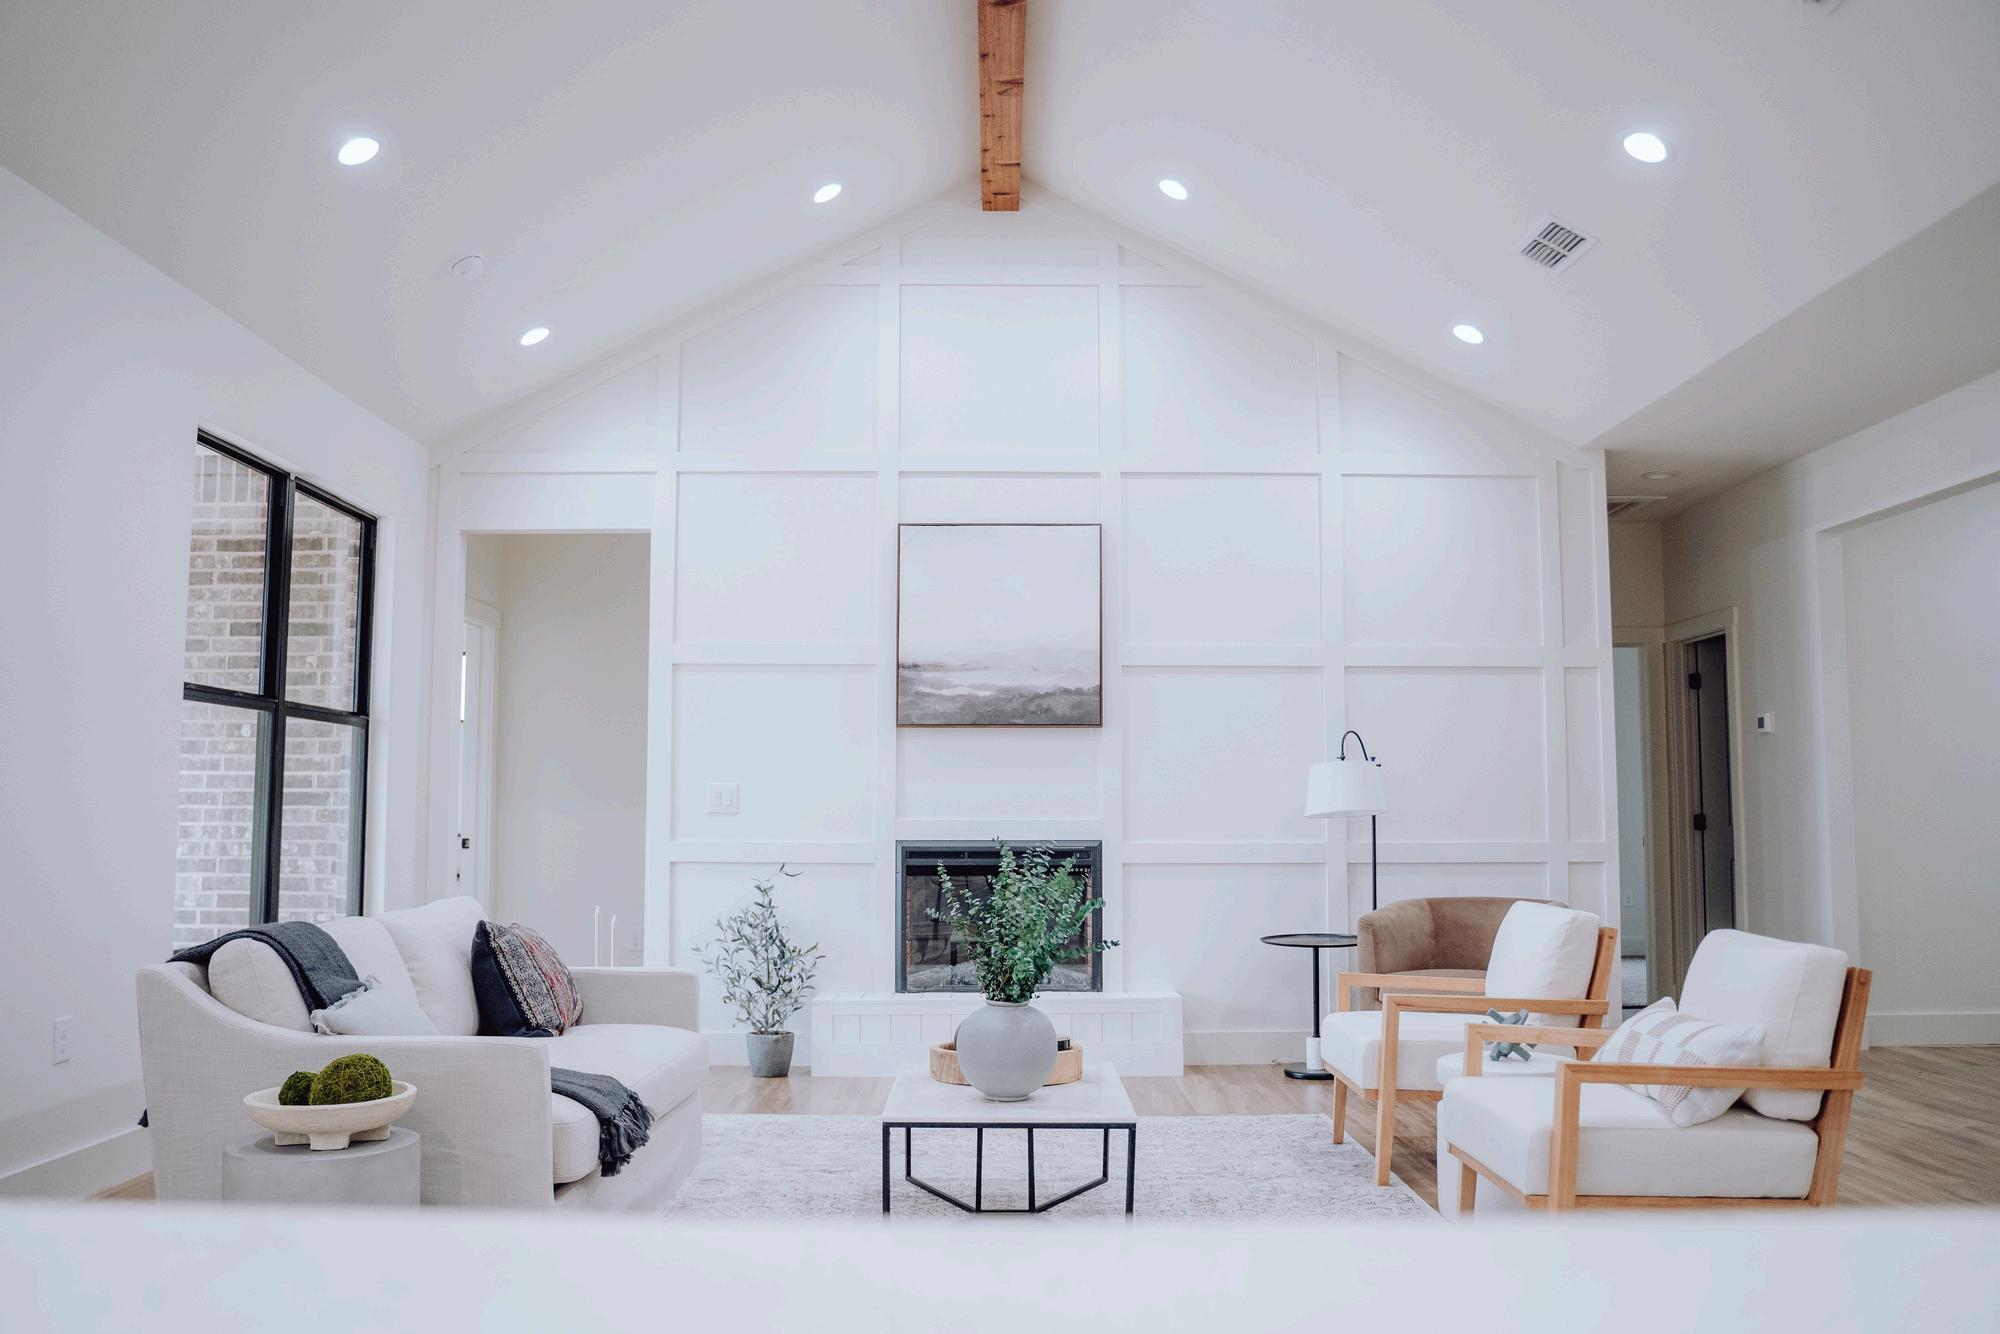
Vaulted Ceilings
Creates a spacious, open atmosphere
Senior-Friendly Living
Safe, independent space for elderly family members
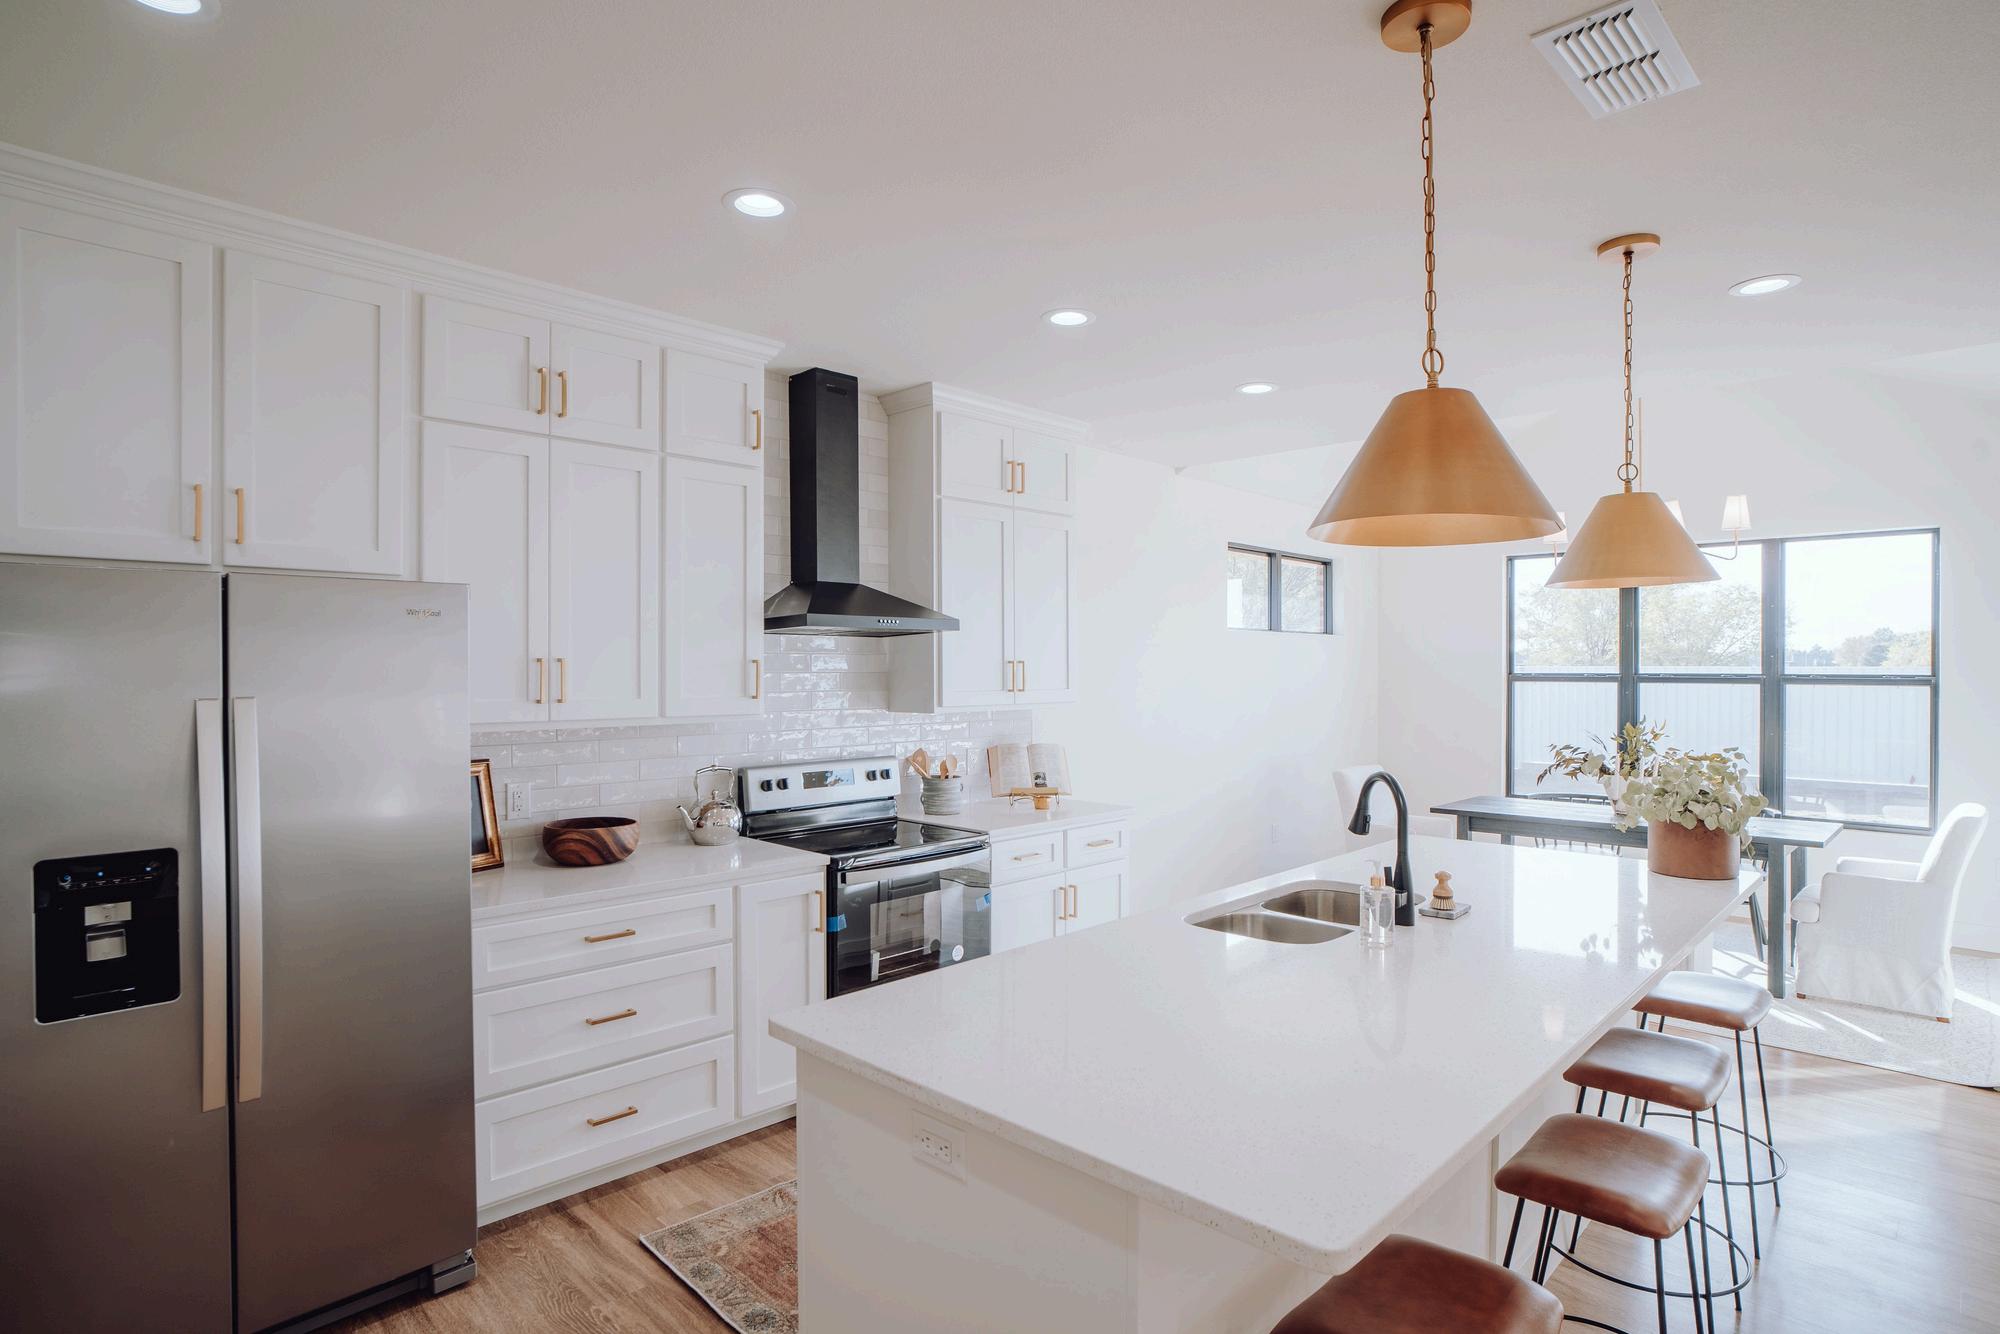
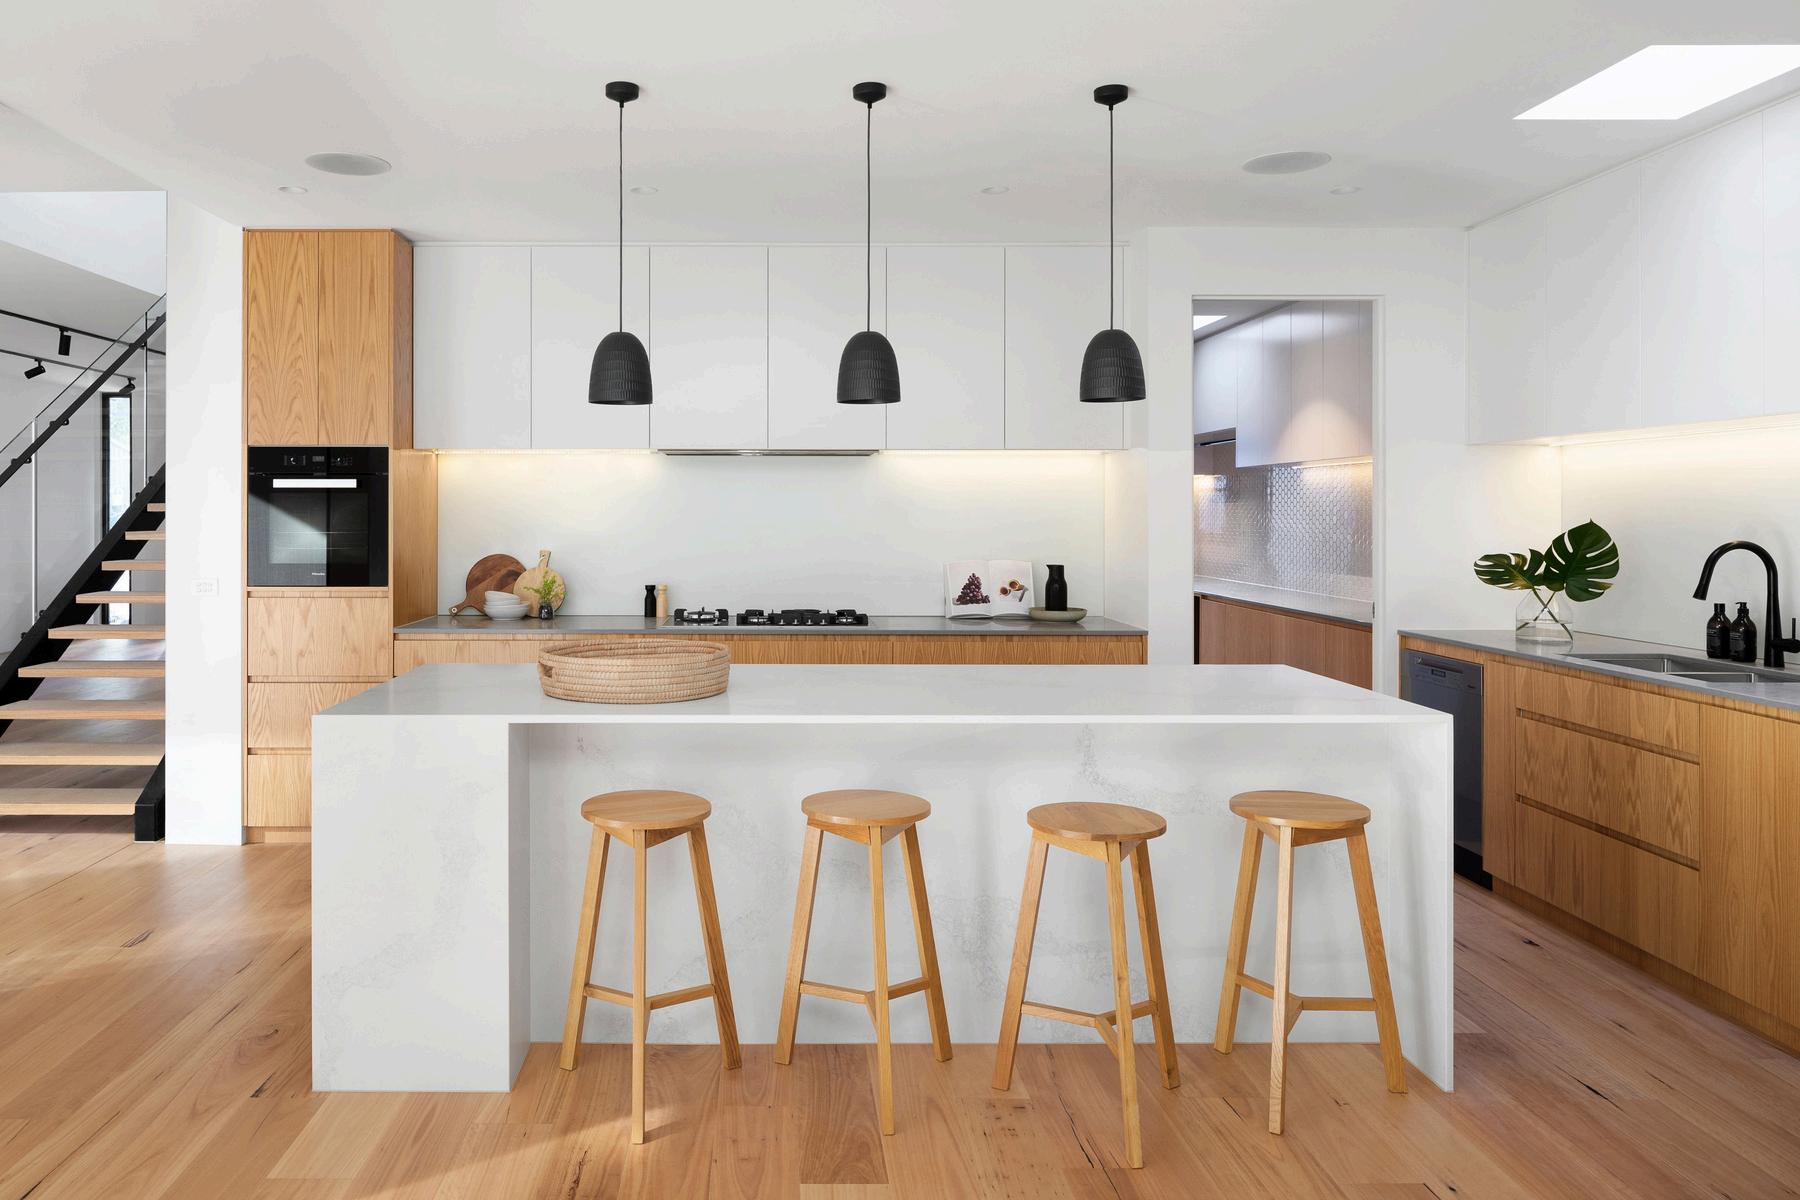
Fully Equipped Kitchen
Modern amenities for everyday convenience
Open Living Area
Multipurpose area for relaxation and entertainment
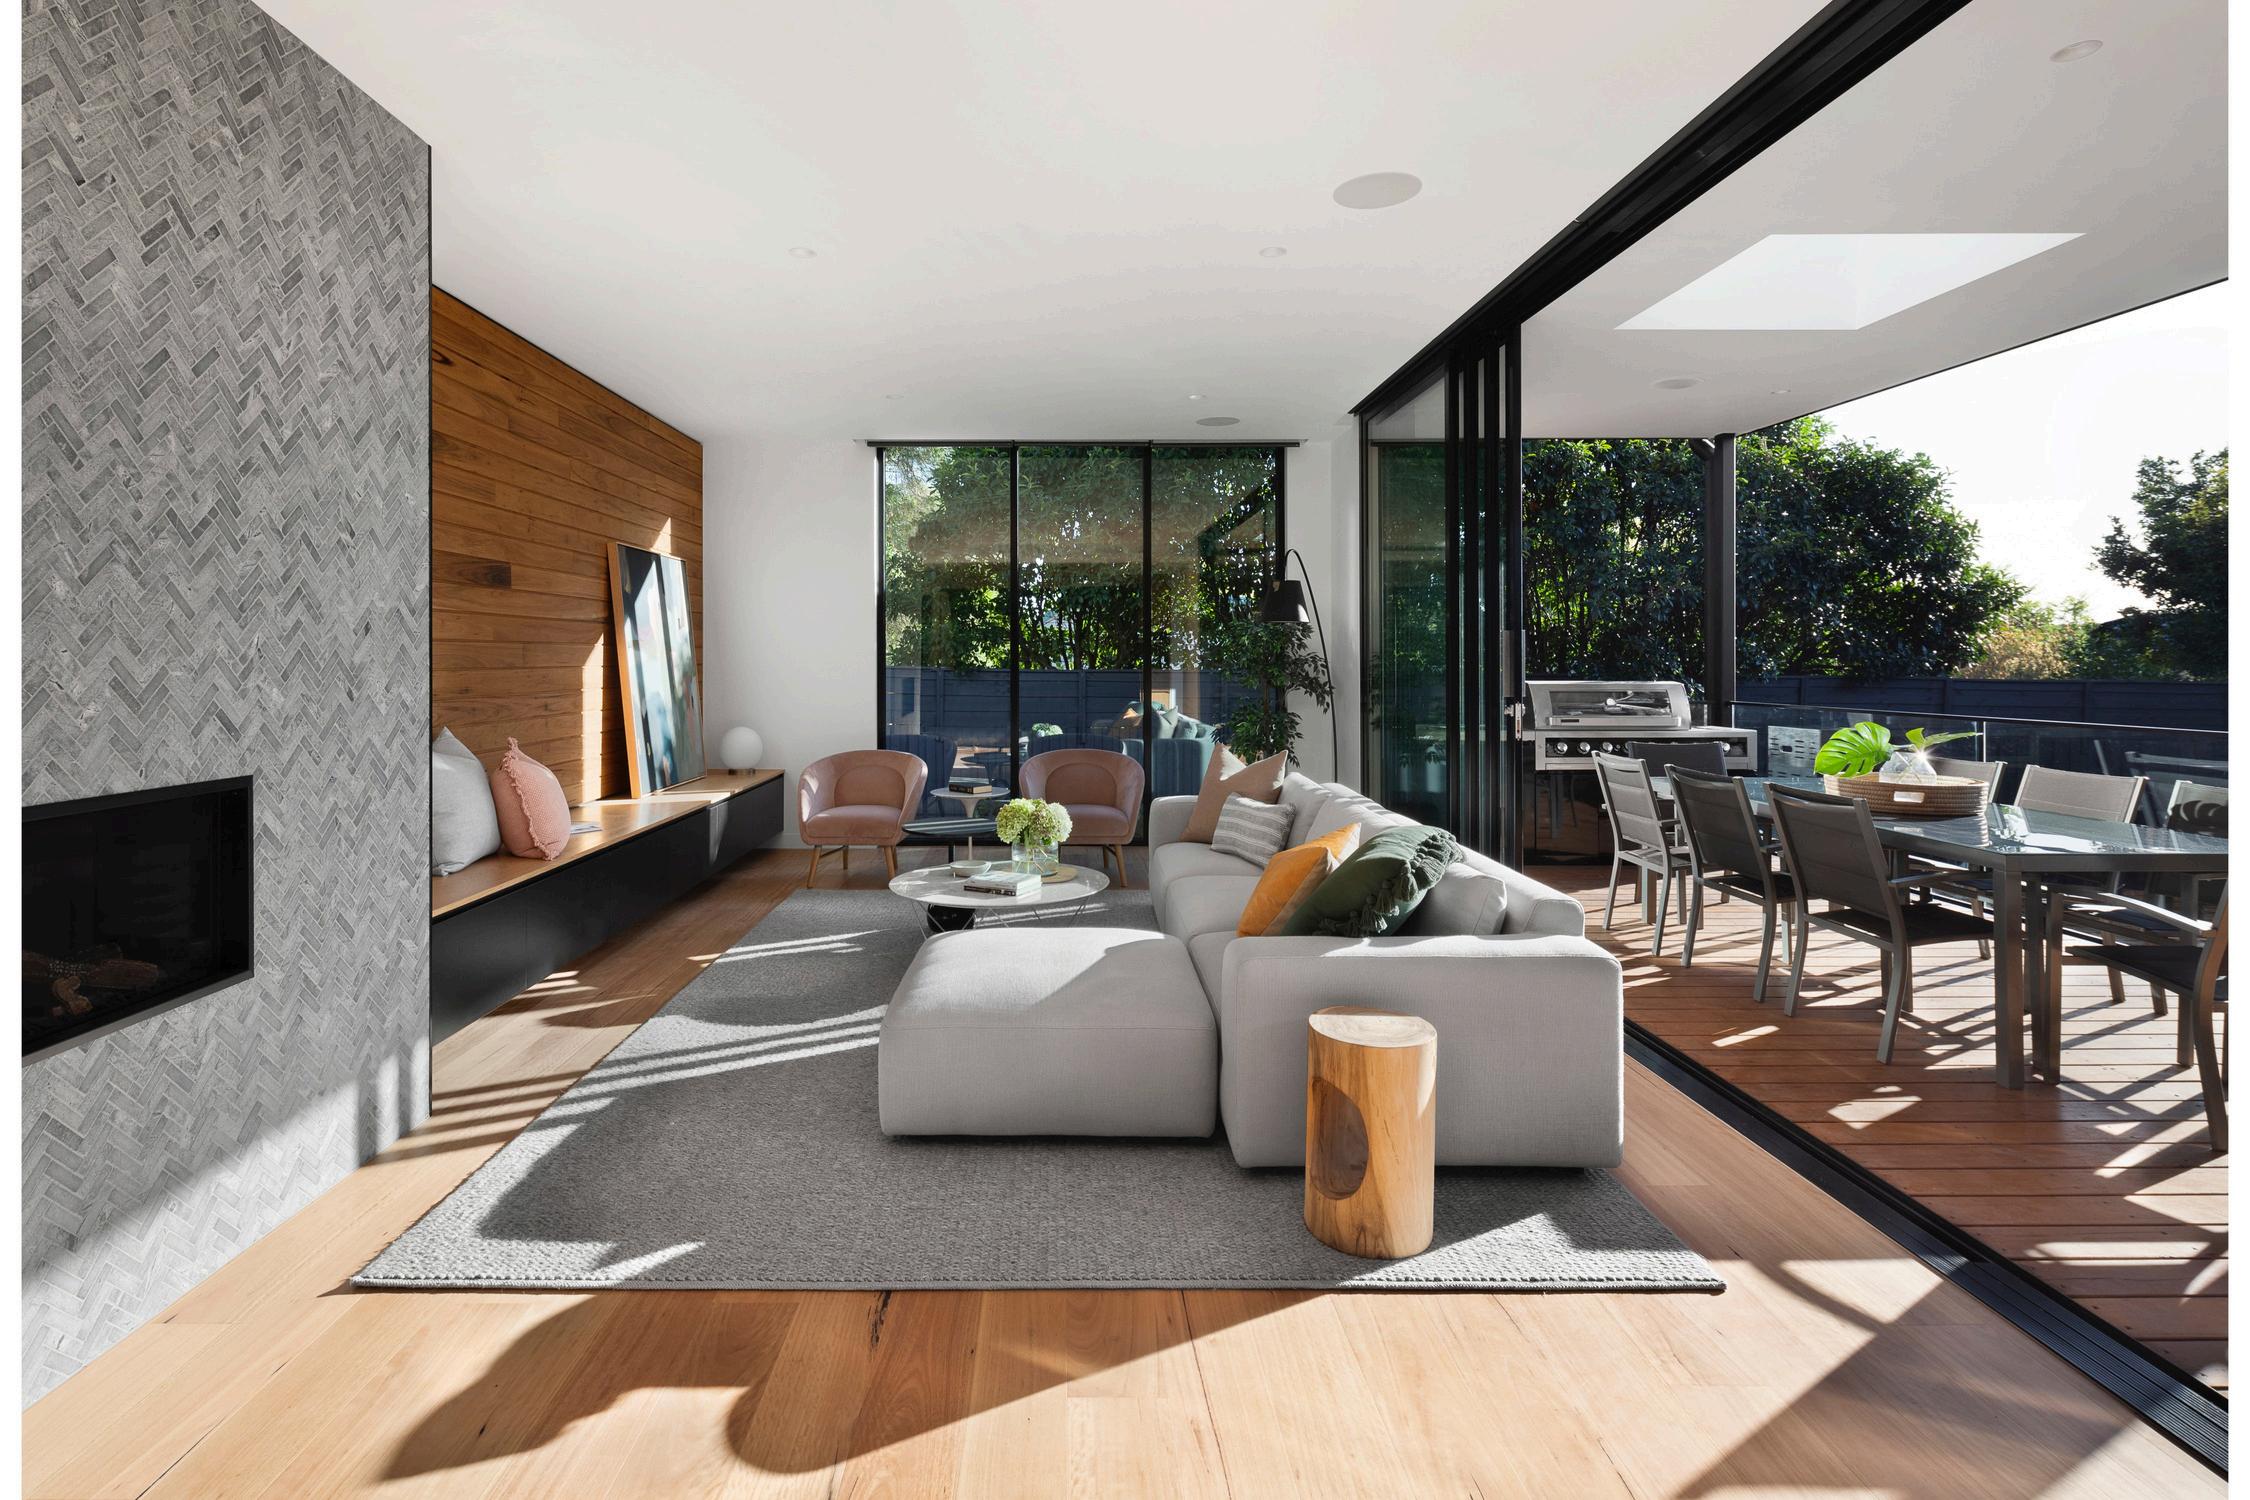
Results and Impact
The completion of the Anenberg-Essert ADU led to several valuable outcomes:
Increased Property Value
The ADU addition significantly boosted property value
Flexible Living Space
A versatile space for family, guests, or as a rental
Modern Comforts
High-end finishes and amenities enhance both function and style.
Enhanced Family Living
The ADU enriches the AnenbergEssert family’s home with both privacy and connection
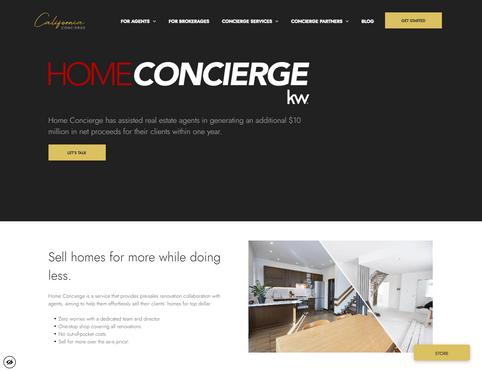
VENDOR DIRECTORY
When it comes to home ownership, knowing who you can trust is crucial. That's why we've curated a select list of trusted vendors who are ready to help with your home goals.
PaloAlto
What's in the Palo Alto data?
There were 42 single-family homes for sale, providing 1 month of inventory. There were 49 new listings, and 39 homes sold at a median price of $4.5m. The median overbid percentage was at 107%, with an average of 11 days on the market.
There were 24 condo and townhome units for sale, providing 1.5 months of inventory. There were 29 new listings and 8 units sold at a median sale price of $1.5m. The median overbid percentage was at 103%, with an average of 29 days on the market.
Single-Family Homes
49 New Listings
39 Sold Listings
1 Month of Inventory
$4.5M
Median Sale Price
107%
Median Sale vs List
11 Avg Days on Market
The data, sourced from InfoSparks and Trend Graphix, includes all single-family homes, condos and townhomes in the California Area above from March 2024 to March 2025. This may include preliminary data, and may vary from the time the data was gathered. All data is deemed reliable but not guaranteed. DRE# 01511642. Copyright KW Advisors Palo Alto 2025. Each office is independently owned and operated.
29
New Listings
8
Sold Listings
1.5
Months of Inventory
103%
Median Sale vs List
$1.5M
Median Sale Price
29
Avg Days on Market
MARCH 2024 - MARCH 2025
Last
Condos & Townhomes
Last 12 months, year-over-year
Median SalesPrice
Single-Family Homes
The median sale price has increased from $3 5m last March 2024, to $4 5m as of March 2025
Condos & Townhomes
The median sale price has increased from $948k last March 2024, to $1 5m as of March 2025
AVGDays OntheMarket
Single-Family Homes
The average time spent on the market went up from 10 days last March 2024, to 11 days as of March 2025
Condos & Townhomes
The average time spent on the market went up from 25 days in March 2024, to 29 days as of March 2025.
Overbids
Single-Family Homes
The overbid percentage has remained the same from 107% last March 2024, to 107% a year later
Condos & Townhomes
The overbid percentage has decreased from 106% last March 2024, to 103% a year later.
Redwood City
What's in the Redwood City data?
There were 44 single-family homes for sale, providing 1.3 months of inventory. There were 51 new listings, and 29 homes sold at a median price of $2.4m. The median overbid percentage was at 104%, with an average of 34 days on the market
There were 24 condo and townhome units for sale, providing 3 months of inventory. There were 19 new listings and 4 units sold at a median sale price of $1.2m. The median overbid percentage was at 99%, with an average of 41 days on the market.
Single-Family Homes
51 New Listings
29 Sold Listings
1.3 Months of Inventory
$2.4M Median Sale Price
104%
Median Sale vs List
34 Avg Days on Market
The data, sourced from InfoSparks and Trend Graphix, includes all single-family homes, condos and townhomes in the California Area above from March 2024 to March 2025. This may include preliminary data, and may vary from the time the data was gathered. All data is deemed reliable but not guaranteed. DRE# 01511642. Copyright KW Advisors Palo Alto 2025. Each office is independently owned and operated.
19 New Listings
3 Months of Inventory
4 Sold Listings
Median Sale vs List
$1.2M
woodCity
MARCH 2024 - MARCH 2025 R SALE SOLD LISTINGS
Median SalesPrice
Single-Family Homes
The median sale price has increased from $2 1m last March 2024, to $2 4m as of March 2025
Condos & Townhomes
The median sale price has increased from $985k last March 2024, to $1 2m as of March 2025
AVGDays OntheMarket
Single-Family Homes
The average time spent on the market went up from 12 days last March 2024, to 34 days as of March 2025
Condos & Townhomes
The average time spent on the market went up from 39 days in March 2024, to 41 days as of March 2025.
Overbids
Single-Family Homes
The overbid percentage has decreased from 106% last March 2024, to 104% a year later
Condos & Townhomes
The overbid percentage has decreased from 101% last March 2024, to 99% a year later.
Portola Valley
What's in the Portola Valley data?
There were 16 single-family homes for sale, providing 1.8 months of inventory. There were 14 new listings, and 5 homes sold at a median price of $4.9m. The median overbid percentage was at 103%, with an average of 11 days on the market
There was no data for condo and townhouse units for this month.
Single-Family Homes
14 New Listings
5 Sold Listings
1.8 Months of Inventory
$4.9M Median Sale Price
103%
Median Sale vs List
11 Avg Days on Market
The data, sourced from InfoSparks and Trend Graphix, includes all single-family homes, condos and townhomes in the California Area above from March 2024 to March 2025. This may include preliminary data, and may vary from the time the data was gathered. All data deemed reliable but not guaranteed. DRE# 01511642. Copyright KW Advisors Palo Alto 2025. Each office is independently owned and operated.
CONDO
Condo & Townhomes
No data available for March 2025.
PortolaValley
MARCH 2024 - MARCH 2025 LISTINGS FOR SALE
Single-Family Homes
Last 12 months, year-over-year.
No data for this month.
Condos & Townhomes
Last 12 months, year-over-year
Median SalesPrice
Single-Family Homes
The median sale price has increased from $3 9m last March 2024, to $4 9m as of March 2025
Condos & Townhomes
No data for this month
AVGDays OntheMarket
Single-Family Homes
The average time spent on the market went down from 27 days last March 2024, to 11 days as of March 2025
Condos & Townhomes
No data for this month
Overbids
Single-Family Homes
The overbid percentage has increased from 100% last March 2024, to 103% a year later
Condos & Townhomes
No data for this month
Menlo
What's in the Men
There were 21 single-family providing 0.8 months of inve new listings, and 22 homes s of $3.4m. The median overb 106%, with an average of 7 d
There were 14 condo and tow sale, providing 2 months of i 15 new listings and 5 units s price of $2.2m. The median was at 102%, with an averag market.
31 New Listings
0.8 Months of Inventory
106% Median Sale vs List
22 Sold Listings
$3.4M Median Sale Price
7 Avg Days on Market
all single-family homes, 2024 to March 2025. This data was gathered. All data KW Advisors Palo Alto
New Listings
5
Sold Listings
2
Months of Inventory
$2.2M
Median Sale Price 102%
Median Sale vs List 14 Avg Days on Market
Median SalesPrice
Single-Family Homes
The median sale price has increased from $2 6m last March 2024, to $3 4m as of March 2025
Condos & Townhomes
The median sale price has increased from $1 6m last March 2024, to $2 2m as of March 2025
AVGDays OntheMarket
Single-Family Homes
The average time spent on the market went down from 33 days last March 2024, to 7 days as of March 2025
Condos & Townhomes
The average time spent on the market went down from 36 days in March 2024, to 14 days as of March 2025.
Overbids
Single-Family Homes
The overbid percentage has increased from 101% last March 2024, to 106% a year later
Condos & Townhomes
The overbid percentage has increased from 99% last March 2024, to 102% a year later.
Atherton
What's in the Atherton data?
There were 11 single-family homes for sale, providing 1.4 months of inventory. There were 10 new listings, and 9 homes sold at a median price of $8.2m. The median overbid percentage was at 100%, with an average of 19 days on the market.
There was no data for condo and townhouse units for this month.
10 New Listings
9 Sold Listings
1.4 Months of Inventory
$8.2M Median Sale Price
100% Median Sale vs List
19 Avg Days on Market
C Condo
No data available for March 2025.
Median SalesPrice
Single-Family Homes
The median sale price has decreased from $13 7m last March 2024, to $8 2m as of March 2025
Condos & Townhomes
No data for this month
AVGDays OntheMarket
Single-Family Homes
The average time spent on the market went down from 36 days last March 2024, to 19 days as of March 2025
Condos & Townhomes
No data for this month
Overbids
Single-Family Homes
The overbid percentage has increased from 90% last March 2024, to 100% a year later
Condos & Townhomes
No data for this month
LosAltos
What's in the Los Altos data?
There were 27 single-family homes for sale, providing 0.6 months of inventory. There were 44 new listings, and 28 homes sold at a median price of $5.6m. The median overbid percentage was at 105%, with an average of 13 days on the market.
There were 19 condo and townhome units for sale, providing 4.8 months of inventory. There were 8 new listings and 4 units sold at a median sale price of $1.6m. The median overbid percentage was at 96%, with an average of 15 days on the market.
Single-Family Homes
44 New Listings
28 Sold Listings
0.6 Months of Inventory
$5.6M Median Sale Price
105%
Median Sale vs List
13 Avg Days on Market
The data, sourced from InfoSparks and Trend Graphix, includes all single-family homes, condos and townhomes in the California Area above from March 2024 to March 2025. This may include preliminary data, and may vary from the time the data was gathered. All data is deemed reliable but not guaranteed. DRE# 01511642. Copyright KW Advisors Palo Alto 2025. Each office is independently owned and operated.
New Listings
4
Sold Listings
4.8
Months of Inventory $1.6M
Median Sale Price 96%
Median Sale vs List 15 Avg Days on Market
Median SalesPrice
Single-Family Homes
The median sale price has increased from $4 3m last March 2024, to $5 6m as of March 2025
Condos & Townhomes
The median sale price has decreased from $1 8m last March 2024, to $1 6m as of March 2025
AVGDays OntheMarket
Single-Family Homes
The average time spent on the market went up from 12 days last March 2024, to 13 days as of March 2025
Condos & Townhomes
The average time spent on the market went up from 0 days in March 2024, to 15 days as of March 2025.
Overbids
Single-Family Homes
The overbid percentage has increased from 104% last March 2024, to 105% a year later
Condos & Townhomes
The overbid percentage has decreased from 97% last March 2024, to 96% a year later.
SanJos
What's in the San
There were 311 single-family providing 0.8 months of inve new listings, and 315 homes price of $1.7m. The median o was at 107% with an average market.
There were 283 condo and to sale, providing 1 8 months of were 259 new listings and 14 median sale price of $830k. T percentage was at 103%, wit days on the market.
458 New Listings
0.8 Months of Inventory
107% Median Sale vs List
315 Sold Listings
$1.7M Median Sale Price
11 Avg Days on Market
all single-family homes, 2024 to March 2025. This data was gathered. All data
Copyright KW Advisors Palo Alto
New Listings
1.8
Sold Listings
Months of Inventory $830K
Median Sale Price 103%
Median Sale vs List 21 Avg Days on Market 149
Median SalesPrice
Single-Family Homes
The median sale price has increased from $1 71m last March 2024, to $1 75m as of March 2025
Condos & Townhomes
The median sale price has decreased from $848k last March 2024, to $830k as of March 2025
AVGDays OntheMarket
Single-Family Homes
The average time spent on the market went down from 13 days last March 2024, to 11 days as of March 2025
Condos & Townhomes
The average time spent on the market went up from 19 days in March 2024, to 21 days as of March 2025.
Overbids
Single-Family Homes
The overbid percentage has decreased from 108% last March 2024, to 107% a year later
Condos & Townhomes
The overbid percentage has decreased from 104% last March 2024, to 103% a year later.
He-Family Homes
34 New Listings
20 Sold Listings
1.2 Months of Inventory
$2.6M Median Sale Price
106%
Median Sale vs List
9 Avg Days on Market
sourced from InfoSparks and Trend Graphix, includes all single-family homes, townhomes in the California Area above from March 2024 to March 2025. This preliminary data, and may vary from the time the data was gathered. All data reliable but not guaranteed. DRE# 01511642. Copyright KW Advisors Palo Alto 2025. Each office is independently owned and operated.
New Listings
17
Sold Listings
3.4
Months of Inventory $1.5M
Median Sale Price 110%
Median Sale vs List 13 Avg Days on Market
Median SalesPrice
Single-Family Homes
The median sale price has increased from $2 5m last March 2024, to $2 6m as of March 2025
Condos & Townhomes
The median sale price has increased from $1 51m last March 2024, to $1 53m as of March 2025
AVGDays OntheMarket
Single-Family Homes
The average time spent on the market went up from 8 days last March 2024, to 9 days as of March 2025
Condos & Townhomes
The average time spent on the market went down from 15 days in March 2024, to 13 days as of March 2025.
Overbids
Single-Family Homes
The overbid percentage has decreased from 108% last March 2024, to 106% a year later
Condos & Townhomes
The overbid percentage has increased from 105% last March 2024, to 110% a year later.
SanMate County
What's in the San Mate data?
There were 428 single-family homes providing 1.4 months of inventory. Th new listings, and 281 homes sold at price of $2m. The median overbid pe at 107 1%, with an average of 19 day market.
There were 265 condo and townhom sale, providing 2.7 months of invento were 182 new listings and 103 units median sale price of $970k. The med percentage was at 100%, with an ave days on the market
471
New Listings
281 Sold Listings
1.4 Months of Inventory
$2M Median Sale Price
107.1%
Median Sale vs List
19 Avg Days on Market
Graphix, includes all single-family homes, from March 2024 to March 2025. This time the data was gathered. All data 511642. Copyright KW Advisors Palo Alto 2025. Each office is independently owned and operated.
182
New Listings
103
Sold Listings
2.7
Months of Inventory
$970K
Median Sale Price 100%
Median Sale vs List
32 Avg Days on Market
SanMateo
MARCH 2024 - MARCH 2025
LISTINGS FOR SALE
Single-Family Homes
Last 12 months, year-over-year.
Condos & Townhomes
Last 12 months, year-over-year
Median SalesPrice
Single-Family Homes
The median sale price has increased from $2m last March 2024, to $2 05m as of March 2025
Condos & Townhomes
The median sale price has decreased from $1m last March 2024, to $970k as of March 2025
AVGDays OntheMarket
Single-Family Homes
The average time spent on the market went down from 20 days last March 2024, to 19 days as of March 2025
Condos & Townhomes
The average time spent on the market went down from 44 days in March 2024, to 32 days as of March 2025.
Overbids
Single-Family Homes
The overbid percentage has increased from 103 2% last March 2024, to 107 1% a year later
Condos & Townhomes
The overbid percentage has decreased from 100.6% last March 2024, to 100% a year later.
SantaClara County
What's in the Santa Clara County data?
There were 896 single-family homes for sale, providing 1.3 months of inventory. There were 1,143 new listings, and 662 homes sold at a median price of $2.1m. The median overbid percentage was at 106 8%, with an average of 14 days on the market.
There were 688 condo and townhome units for sale, providing 2.3 months of inventory. There were 627 new listings and 329 units sold at a median sale price of $1.1m. The median overbid percentage was at 101.7%, with an average of 21 days on the market
mily Homes
1,143 New Listings
662 Sold Listings
1.3 Months of Inventory
$2.1M
Median Sale Price
106.8%
Median Sale vs List
14 Avg Days on Market
InfoSparks and Trend Graphix, includes all single-family homes, the California Area above from March 2024 to March 2025. This data, and may vary from the time the data was gathered. All data guaranteed. DRE# 01511642. Copyright KW Advisors Palo Alto 2025. Each office is independently owned and operated.
Condo & Townhomes
627
New Listings
329
Sold Listings
2.3
Months of Inventory
101.7%
Median Sale vs List
$1.1M
Median Sale Price
21
Avg Days on Market
SantaClaraCounty
MARCH
2024 - MARCH 2025
LISTINGS FOR SALE SOLD LISTINGS
gle-Family Homes
t 12 months, year-over-year.
ndos & Townhomes
t 12 months, year-over-year
Median SalesPrice
Single-Family Homes
The median sale price has increased from $1 9m last March 2024, to $2 1m as of March 2025
Condos & Townhomes
The median sale price has increased from $970k last March 2024, to $1 1m as of March 2025
AVGDays OntheMarket
Single-Family Homes
The average time spent on the market went down from 15 days last March 2024, to 14 days as of March 2025
Condos & Townhomes
The average time spent on the market went up from 20 days in March 2024, to 21 days as of March 2025.
Overbids
Single-Family Homes
The overbid percentage has decreased from 107 1% last March 2024, to 106 8% a year later
Condos & Townhomes
The overbid percentage has decreased from 102.6% last March 2024, to 101.7% a year later.
Monterey County
What's in the Monterey County data?
There were 327 single-family homes for sale, providing 1.9 months of inventory. There were 194 new listings, and 128 homes sold at a median price of $937k. The median overbid percentage was at 95%, with an average of 47 days on the market.
There were 61 condo and townhome units for sale, providing 2.7 months of inventory. There were 28 new listings and 13 units sold at a median sale price of $735k. The median overbid percentage was at 96%, with an average of 46 days on the market
194 New Listings
128 Sold Listings
1.9 Months of Inventory
$937K Median Sale Price
95%
Median Sale vs List
47 Avg Days on Market
28
New Listings
13
Sold Listings
2.7
Months of Inventory
$735K
Median Sale Price 96%
Median Sale vs List
46 Avg Days on Market
MontereyCounty
MARCH 2024 - MARCH 2025
Single-Family Homes
Last 12 months, year-over-year.
Condos & Townhomes
Last 12 months, year-over-year
Median SalesPrice
Single-Family Homes
The median sale price has increased from $925k last March 2024, to $937k as of March 2025
Condos & Townhomes
The median sale price has decreased from $820k last March 2024, to $735k as of March 2025
AVGDays OntheMarket
Single-Family Homes
The average time spent on the market went up from 43 days last March 2024, to 47 days as of March 2025
Condos & Townhomes
The average time spent on the market went up from 18 days in March 2024, to 46 days as of March 2025.
Overbids
Single-Family Homes
The overbid percentage has decreased from 96% last March 2024, to 95% a year later
Condos & Townhomes
The overbid percentage has decreased from 100% last March 2024, to 96% a year later.
SantaCruz County
What's in the Santa Cruz County data?
There were 285 single-family homes for sale, providing 2.1 months of inventory. There were 214 new listings, and 92 homes sold at a median price of $1.4m. The median overbid percentage was at 97%, with an average of 41 days on the market.
There were 95 condo and townhome units for sale, providing 3.1 months of inventory. There were 56 new listings and 30 units sold at a median sale price of $770k. The median overbid percentage was at 100%, with an average of 27 days on the market.
Single-Family Homes
214 New Listings
92 Sold Listings
2.1 Months of Inventory
$1.4M
Median Sale Price
97%
Median Sale vs List
41 Avg Days on Market
The data, sourced from InfoSparks and Trend Graphix, includes all single-family homes, condos and townhomes in the California Area above from March 2024 to March 2025. This may include preliminary data, and may vary from the time the data was gathered. All data deemed reliable but not guaranteed. DRE# 01511642. Copyright KW Advisors Palo Alto 2025. Each office is independently owned and operated.
aCruzCounty
MARCH 2024 - MARCH 2025 R SALE
mes year-over-year.
omes , year-over-year
Median SalesPrice
Single-Family Homes
The median sale price has increased from $1 2m last March 2024, to $1 4m as of March 2025
Condos & Townhomes
The median sale price has increased from $725k last March 2024, to $770k as of March 2025
AVGDays OntheMarket
Single-Family Homes
The average time spent on the market went up from 34 days last March 2024, to 41 days as of March 2025
Condos & Townhomes
The average time spent on the market went down from 34 days in March 2024, to 27 days as of March 2025.
Overbids
Single-Family Homes
The overbid percentage has decreased from 98% last March 2024, to 97% a year later
Condos & Townhomes
The overbid percentage has remained the same from 100% last March 2024, to 100% a year later.
East PaloAlto
What's in the East Palo Alto data?
There were 11 single-family homes for sale, providing 1.8 months of inventory. There were 10 new listings, and 5 homes sold at a median price of $1.1m. The median overbid percentage was at 98%, with an average of 22 days on the market
There was 1 condo and townhome unit for sale, providing 0.5 months of inventory. There was 1 new listing and 1 unit sold at a median sale price of $1m. The median overbid percentage was at 100%, with an average of 1 day on the market.
10 New Listings
mily Homes
5 Sold Listings
1.8 Months of Inventory
$1.1M Median Sale Price
98% Median Sale vs List
22 Avg Days on Market
InfoSparks and Trend Graphix, includes all single-family homes, the California Area above from March 2024 to March 2025. This data, and may vary from the time the data was gathered. All data guaranteed. DRE# 01511642. Copyright KW Advisors Palo Alto 2025. Each office is independently owned and operated.
Condo & Townhomes
1 New Listing
1 Sold Listing
0.5
Months of Inventory
$1M
Median Sale Price 100%
Median Sale vs List
1 Avg Day on Market
MARCH 2024 - MARCH 2025
LISTINGS FOR SALE SOLD LISTINGS
Single-Family Homes
Last 12 months, year-over-year.
Condos & Townhomes
Last 12 months, year-over-year
Median SalesPrice
Single-Family Homes
The median sale price has decreased from $1 3m last March 2024, to $1 1m as of March 2025
Condos & Townhomes
The median sale price has increased from $0 last March 2024, to $1m as of March 2025
AVGDays OntheMarket
Single-Family Homes
The average time spent on the market went up from 17 days last March 2024, to 22 days as of March 2025
Condos & Townhomes
The average time spent on the market went up from 0 days in March 2024, to 1 day as of March 2025.
Overbids
Single-Family Homes
The overbid percentage has decreased from 101% last March 2024, to 98% a year later
Condos & Townhomes
The overbid percentage has increased from 0% last March 2024, to 100% a year later.
Sunnyv
What's in the Sunn
There were 36 single-family h providing 0.6 months of inve new listings, and 47 homes s of $2.8m. The median overbi 114% with an average of 13 d
There were 50 condo and tow sale, providing 1.9 months of were 54 new listings and 40 sale price of $1.3m. The med percentage was at 105%, wit days on the market.
80 New Listings
0.6 Months of Inventory
114% Median Sale vs List
47 Sold Listings
$2.8M Median Sale Price
13 Avg Days on Market
all single-family homes, 2024 to March 2025. This data was gathered. All data
Copyright KW Advisors Palo Alto
54 New Listings
40 Sold Listings
1.9
Months of Inventory
$1.3M
Median Sale Price 105%
Median Sale vs List 16 Avg Days on Market
MARCH 2024 - MARCH 2025
STINGS FOR SALE
e-Family Homes
12 months, year-over-year.
os & Townhomes
12 months, year-over-year
Median SalesPrice
Single-Family Homes
The median sale price has increased from $2 4m last March 2024, to $2 8m as of March 2025
Condos & Townhomes
The median sale price has decreased from $1 5m last March 2024, to $1 3m as of March 2025
AVGDays OntheMarket
Single-Family Homes
The average time spent on the market remained the same from 13 days last March 2024, to 13 days as of March 2025
Condos & Townhomes
The average time spent on the market went down from 20 days in March 2024, to 16 days as of March 2025.
Overbids
Single-Family Homes
The overbid percentage has increased from 113% last March 2024, to 114% a year later
Condos & Townhomes
The overbid percentage has decreased from 113% last March 2024, to 105% a year later.
SantaC City
What's in the Sant data?
There were 37 single-family h providing 0.9 months of inve new listings, and 36 homes s of $2m. The median overbid 114%, with an average of 8 d
There were 57 condo and tow sale, providing 1.9 months of were 45 new listings and 25 sale price of $1.2m. The med percentage was at 103%, wit days on the market.
61 New Listings
0.9 Months of Inventory
114% Median Sale vs List
36 Sold Listings
$2M Median Sale Price
8 Avg Days on Market
all single-family homes, 2024 to March 2025. This data was gathered. All data
Copyright KW Advisors Palo Alto
Condo & Townhomes
45
New Listings
25 Sold Listings
1.9
Months of Inventory
$1.2M
Median Sale Price
103%
Median Sale vs List
16 Avg Days on Market
SantaClaraCity
MARCH 2024 - MARCH 2025
LISTINGS FOR SALE
Single-Family Homes
Last 12 months, year-over-year.
Condos & Townhomes
Last 12 months, year-over-year
Median SalesPrice
Single-Family Homes
The median sale price has increased from $1 9m last March 2024, to $2m as of March 2025
Condos & Townhomes
The median sale price has decreased from $1 4m last March 2024, to $1 2m as of March 2025
AVGDays OntheMarket
Single-Family Homes
The average time spent on the market remained the same from 8 days last March 2024, to 8 days as of March 2025
Condos & Townhomes
The average time spent on the market went down from 26 days in March 2024, to 16 days as of March 2025.
Overbids
Single-Family Homes
The overbid percentage has remained the same from 114% last March 2024, to 114% a year later
Condos & Townhomes
The overbid percentage has decreased from 107% last March 2024, to 103% a year later.
Saratoga
What's in the Saratoga data?
There were 33 single-family homes for sale, providing 1.5 months of inventory. There were 35 new listings, and 18 homes sold at a median price of $3.9m. The median overbid percentage was at 97%, with an average of 15 days on the market.
There were 14 condo and townhome units for sale, providing 1.6 months of inventory. There were 11 new listings and 5 units sold at a median sale price of $2m. The median overbid percentage was at 103%, with an average of 11 days on the market.
Single-Family Homes
35 New Listings
18 Sold Listings
1.5 Months of Inventory
$3.9M Median Sale Price
97%
Median Sale vs List
15 Avg Days on Market
The data, sourced from InfoSparks and Trend Graphix, includes all single-family homes, condos and townhomes in the California Area above from March 2024 to March 2025. This may include preliminary data, and may vary from the time the data was gathered. All data is deemed reliable but not guaranteed. DRE# 01511642. Copyright KW Advisors Palo Alto 2025. Each office is independently owned and operated.
Condo & To
New Listings
5
Sold Listings
1.6
Months of Inventory
$2M
Median Sale Price 103%
Median Sale vs List 11 Avg Days on Market
Median SalesPrice
Single-Family Homes
The median sale price has decreased from $4m last March 2024, to $3 9m as of March 2025
Condos & Townhomes
The median sale price has increased from $1 5m last March 2024, to $2m as of March 2025
AVGDays OntheMarket
Single-Family Homes
The average time spent on the market went down from 21 days last March 2024, to 15 days as of March 2025
Condos & Townhomes
The average time spent on the market went up from 2 days in March 2024, to 11 days as of March 2025.
Overbids
Single-Family Homes
The overbid percentage has decreased from 105% last March 2024, to 97% a year later
Condos & Townhomes
The overbid percentage has decreased from 113% last March 2024, to 103% a year later.