That's the question you should be asking yourself.
Our market is incredibly diverse and rapidly changing. Values vary not just by neighborhood but by street. Your home isn't necessarily worth what your neighbors' home is. It's the current market that sets the value of your home.
So, do you know what your home is worth in today's market?
Icanhelp...
Contact me for a confidential, no obligation assessment of your home's value.
A recent study from the National Association of Realtors (NAR) shows most sellers (61%) completed at least minor repairs when selling their house. But sometimes life gets in the way and that’s just not possible. Maybe that’s why, 39% of sellers chose to sell asis instead
amily Homes
ntory
0 Sold Listings
$0 Median Sale Price s List
0 Avg Days on Market
from MLS Listings Inc., InfoSparks, and Trend Graphix, includes all condos, and townhomes in the California Area above from March This may include preliminary data and may vary from the time the data is deemed reliable but not guaranteed. DRE# 01906450. Peninsula Estates | Burlingame | San Mateo 2025. Each office is independently owned and operated.
New Listings
Months of Inventory M 0%
Median Sale vs List Av
coCounty
SOLD LISTINGS
odispla�
odispla�
, y y
Median SalesPrice
Single-Family Homes
The median sale price has increased from $0 last March 2024, to $0 as of March 2025
Condos & Townhomes
The median sale price has increased from $0 last March 2024, to $0 as of March 2025
No data to display
Overbids
Single-Family Homes
The overbid percentage has increased from 0% last March 2024, to 0% a year later
Condos & Townhomes
AVGDays OntheMarket
Single-Family Homes
No data to display No data to display
The average time spent on the market went up from 0 days last March 2024, to 0 days as of March 2025
Condos & Townhomes
The average time spent on the market went up from 0 days last March 2024, to 0 days as of March 2025.
The overbid percentage has increased from 0% last March 2024, to 0% a year later.
SanMateo County
What's in the San Mateo County data?
There were 0 single-family homes for sale, providing 0 months of inventory. There were 0 new listings, and 0 homes sold at a median price of $0. The median overbid percentage was at 0%, with an average of 0 days on the market
There were 0 condo and townhome units for sale, providing 0 months of inventory. There were 0 new listings and 0 units sold at a median sale price of $0. The median overbid percentage was at 0%, with an average of 0 days on the market.
SFH
Single-Family Homes
0 New Listings
0 Sold Listings
0 Months of Inventory
$0 Median Sale Price
0%
Median Sale vs List
0 Avg Days on Market
The data, sourced from MLS Listings Inc., InfoSparks, and Trend Graphix, includes all single-family homes, condos, and townhomes in the California Area above from March 2024 to March 2025. This may include preliminary data and may vary from the time the data was gathered. All data is deemed reliable but not guaranteed. DRE# 01906450.
Copyright KW Advisors Peninsula Estates | Burlingame | San Mateo 2025. Each office is independently owned and operated.
Condo & Townhomes
New Listings
Sold Listings
Months of Inventory
Median Sale Price
Median Sale vs List
Avg Days on Market
SanMateoCounty
MARCH 2024 - MARCH 2025
LISTINGS FOR SALE SOLD LISTINGS
Nodatatodispla�
Single-Family Homes
Last 12 months, year-over-year.
Nodatatodispla�
Condos & Townhomes
Last 12 months, year-over-year
Median SalesPrice
Single-Family Homes
The median sale price has increased from $0 last March 2024, to $0 as of March 2025
Condos & Townhomes
The median sale price has increased from $0 last March 2024, to $0 as of March 2025
No data to display
Overbids
Single-Family Homes
The overbid percentage has increased from 0% last March 2024, to 0% a year later
Condos & Townhomes
AVGDays OntheMarket
Single-Family Homes
No data to display No data to display
The average time spent on the market went up from 0 days last March 2024, to 0 days as of March 2025
Condos & Townhomes
The average time spent on the market went up from 0 days last March 2024, to 0 days as of March 2025.
The overbid percentage has increased from 0% last March 2024, to 0% a year later.
SantaClara County
What's in the Santa Clara County data?
There were 0 single-family homes for sale, providing 0 months of inventory. There were new listings, and 0 homes sold at a median of $0. The median overbid percentage was a with an average of 0 days on the market.
There were 0 condo and townhome units for providing 0 months of inventory. There were new listings and 0 units sold at a median sa price of $0. The median overbid percentage at 0%, with an average of 0 days on the mark
He-Family Homes
ngs f Inventory
0 Sold Listings
$0 Median Sale Price ale vs List
0 Avg Days on Market
sourced from MLS Listings Inc., InfoSparks, and Trend Graphix, includes all homes, condos, and townhomes in the California Area above from March 2025. This may include preliminary data and may vary from the time the gathered. All data is deemed reliable but not guaranteed. DRE# 01906450.
Advisors Peninsula Estates | Burlingame | San Mateo 2025. Each office is independently owned and operated.
New Listings
Months of Inventory M 0%
Median Sale vs List Av
SantaClaraCounty
MARCH 2024 - MARCH 2025
LISTINGS FOR SALE SOLD LISTINGS
Nodatatodispla�
ingle-Family Homes ast 12 months, year-over-year.
Nodatatodispla�
ondos & Townhomes ast 12 months, year-over-year
Median SalesPrice
Single-Family Homes
The median sale price has increased from $0 last March 2024, to $0 as of March 2025
Condos & Townhomes
The median sale price has increased from $0 last March 2024, to $0 as of March 2025
No data to display
Overbids
Single-Family Homes
The overbid percentage has increased from 0% last March 2024, to 0% a year later
Condos & Townhomes
AVGDays OntheMarket
Single-Family Homes
No data to display No data to display
The average time spent on the market went up from 0 days last March 2024, to 0 days as of March 2025
Condos & Townhomes
The average time spent on the market went up from 0 days last March 2024, to 0 days as of March 2025.
The overbid percentage has increased from 0% last March 2024, to 0% a year later.
Atherton
What's in the Atherton data?
There were 0 single-family homes for sale, providing 0 months of inventory. There were new listings, and 0 homes sold at a median of $0. The median overbid percentage was a with an average of 0 days on the market.
There were 0 condo and townhome units for providing 0 months of inventory. There were new listings and 0 units sold at a median sa price of $0. The median overbid percentage at 0%, with an average of 0 days on the mark
He-Family Homes
ngs f Inventory
0 Sold Listings
$0 Median Sale Price ale vs List
0 Avg Days on Market
sourced from MLS Listings Inc., InfoSparks, and Trend Graphix, includes all homes, condos, and townhomes in the California Area above from March 2025. This may include preliminary data and may vary from the time the gathered. All data is deemed reliable but not guaranteed. DRE# 01906450.
Advisors Peninsula Estates | Burlingame | San Mateo 2025. Each office is independently owned and operated.
Condo & Townh
Median Sale vs List Avg Days o
herton
MARCH 2024 - MARCH 2025
GS FOR SALE SOLD LISTINGS
Nodatatodispla�
mily Homes onths, year-over-year.
Nodatatodispla�
Townhomes onths, year-over-year
Median SalesPrice
Single-Family Homes
The median sale price has increased from $0 last March 2024, to $0 as of March 2025
Condos & Townhomes
The median sale price has increased from $0 last March 2024, to $0 as of March 2025
No data to display
Overbids
Single-Family Homes
The overbid percentage has increased from 0% last March 2024, to 0% a year later
Condos & Townhomes
AVGDays OntheMarket
Single-Family Homes
No data to display No data to display
The average time spent on the market went up from 0 days last March 2024, to 0 days as of March 2025
Condos & Townhomes
The average time spent on the market went up from 0 days last March 2024, to 0 days as of March 2025.
The overbid percentage has increased from 0% last March 2024, to 0% a year later.
BWh Ther prov new of $0 with Ther prov new price at 0%
amily
Homes ntory
0 Sold Listings
$0 Median Sale Price List
0 Avg Days on Market
MLS Listings Inc., InfoSparks, and Trend Graphix, includes all condos, and townhomes in the California Area above from March This may include preliminary data and may vary from the time the data is deemed reliable but not guaranteed. DRE# 01906450. Peninsula Estates | Burlingame | San Mateo 2025. Each office is independently owned and operated.
C Condo
New Listings
Months of Inventory
Median Sale vs List
STINGS
Median SalesPrice
Single-Family Homes
The median sale price has increased from $0 last March 2024, to $0 as of March 2025
Condos & Townhomes
The median sale price has increased from $0 last March 2024, to $0 as of March 2025
No data to display
Overbids
Single-Family Homes
The overbid percentage has increased from 0% last March 2024, to 0% a year later
Condos & Townhomes
AVGDays OntheMarket
Single-Family Homes
No data to display No data to display
The average time spent on the market went up from 0 days last March 2024, to 0 days as of March 2025
Condos & Townhomes
The average time spent on the market went up from 0 days last March 2024, to 0 days as of March 2025.
The overbid percentage has increased from 0% last March 2024, to 0% a year later.
mily
Homes ntory
0 Sold Listings
$0 Median Sale Price List
0 Avg Days on Market
MLS Listings Inc., InfoSparks, and Trend Graphix, includes all condos, and townhomes in the California Area above from March This may include preliminary data and may vary from the time the data is deemed reliable but not guaranteed. DRE# 01906450. eninsula Estates | Burlingame | San Mateo 2025. Each office is independently owned and operated.
C Condo
New Listings
Months of Inventory
Median Sale vs List
STINGS
Median SalesPrice
Single-Family Homes
The median sale price has increased from $0 last March 2024, to $0 as of March 2025
Condos & Townhomes
The median sale price has increased from $0 last March 2024, to $0 as of March 2025
No data to display
Overbids
Single-Family Homes
The overbid percentage has increased from 0% last March 2024, to 0% a year later
Condos & Townhomes
AVGDays OntheMarket
Single-Family Homes
No data to display No data to display
The average time spent on the market went up from 0 days last March 2024, to 0 days as of March 2025
Condos & Townhomes
The average time spent on the market went up from 0 days last March 2024, to 0 days as of March 2025.
The overbid percentage has increased from 0% last March 2024, to 0% a year later.
Belmont
What's in the Belmont data?
There were 0 single-family homes for sale, providing 0 months of inventory. There were 0 new listings, and 0 homes sold at a median price of $0. The median overbid percentage was at 0%, with an average of 0 days on the market.
There were 0 condo and townhome units for sale, providing 0 months of inventory. There were 0 new listings and 0 units sold at a median sale price of $0. The median overbid percentage was at 0%, with an average of 0 days on the market.
SFH
Single-Family Homes
0 New Listings
0 Sold Listings
0 Months of Inventory
$0 Median Sale Price
0%
Median Sale vs List
0 Avg Days on Market
The data, sourced from MLS Listings Inc., InfoSparks, and Trend Graphix, includes all single-family homes, condos, and townhomes in the California Area above from March 2024 to March 2025. This may include preliminary data and may vary from the time the data was gathered. All data is deemed reliable but not guaranteed. DRE# 01906450.
Copyright KW Advisors Peninsula Estates | Burlingame | San Mateo 2025. Each office is independently owned and operated.
New Listings
Months of Inventory
Median Sale vs List
Sold Listings
lmont
MARCH 2024 - MARCH 2025
NGS FOR SALE SOLD LISTINGS
Nodatatodispla�
amily Homes months, year-over-year.
Nodatatodispla�
& Townhomes months, year-over-year
Median SalesPrice
Single-Family Homes
The median sale price has increased from $0 last March 2024, to $0 as of March 2025
Condos & Townhomes
The median sale price has increased from $0 last March 2024, to $0 as of March 2025
No data to display
Overbids
Single-Family Homes
The overbid percentage has increased from 0% last March 2024, to 0% a year later
Condos & Townhomes
AVGDays OntheMarket
Single-Family Homes
No data to display No data to display
The average time spent on the market went up from 0 days last March 2024, to 0 days as of March 2025
Condos & Townhomes
The average time spent on the market went up from 0 days last March 2024, to 0 days as of March 2025.
The overbid percentage has increased from 0% last March 2024, to 0% a year later.
Burlingame
What's in the Burlingame data?
There were 0 single-family homes for sale, providing 0 months of inventory. There were 0 new listings, and 0 homes sold at a median price of $0. The median overbid percentage was at 0%, with an average of 0 days on the market.
There were 0 condo and townhome units for sale, providing 0 months of inventory. There were 0 new listings and 0 units sold at a median sale price of $0. The median overbid percentage was at 0%, with an average of 0 days on the market.
SFH
Single-Family Homes
0 New Listings
0 Sold Listings
0 Months of Inventory
$0 Median Sale Price
0%
Median Sale vs List
0 Avg Days on Market
The data, sourced from MLS Listings Inc., InfoSparks, and Trend Graphix, includes all single-family homes, condos, and townhomes in the California Area above from March 2024 to March 2025. This may include preliminary data and may vary from the time the data was gathered. All data is deemed reliable but not guaranteed. DRE# 01906450.
Copyright KW Advisors Peninsula Estates | Burlingame | San Mateo 2025. Each office is independently owned and operated.
Condo & Townhomes
New Listings
Sold Listings
Months of Inventory
Median Sale Price 0%
Median Sale vs List
Avg Days on Market
Burlingame
MARCH 2024 - MARCH 2025
LISTINGS FOR SALE SOLD LISTINGS
Nodatatodispla�
Single-Family Homes
Last 12 months, year-over-year.
Nodatatodispla�
Condos & Townhomes
Last 12 months, year-over-year
Median SalesPrice
Single-Family Homes
The median sale price has increased from $0 last March 2024, to $0 as of March 2025
Condos & Townhomes
The median sale price has increased from $0 last March 2024, to $0 as of March 2025
No data to display
Overbids
Single-Family Homes
The overbid percentage has increased from 0% last March 2024, to 0% a year later
Condos & Townhomes
AVGDays OntheMarket
Single-Family Homes
No data to display No data to display
The average time spent on the market went up from 0 days last March 2024, to 0 days as of March 2025
Condos & Townhomes
The average time spent on the market went up from 0 days last March 2024, to 0 days as of March 2025.
The overbid percentage has increased from 0% last March 2024, to 0% a year later.
DalyCity
What's in the Daly City data?
There were 0 single-family homes for sale, providing 0 months of inventory. There were 0 new listings, and 0 homes sold at a median price of $0. The median overbid percentage was at 0%, with an average of 0 days on the market.
There were 0 condo and townhome units for sale, providing 0 months of inventory. There were 0 new listings and 0 units sold at a median sale price of $0. The median overbid percentage was at 0%, with an average of 0 days on the market.
SFH
Single-Family Homes
0 New Listings
0 Sold Listings
0 Months of Inventory
$0 Median Sale Price
0%
Median Sale vs List
0 Avg Days on Market
The data, sourced from MLS Listings Inc., InfoSparks, and Trend Graphix, includes all single-family homes, condos, and townhomes in the California Area above from March 2024 to March 2025. This may include preliminary data and may vary from the time the data was gathered. All data is deemed reliable but not guaranteed. DRE# 01906450.
Copyright KW Advisors Peninsula Estates | Burlingame | San Mateo 2025. Each office is independently owned and operated.
City
MARCH 2024 - MARCH 2025
Nodatatodispla�
mes
year-over-year.
Nodatatodispla�
omes
year-over-year
Median SalesPrice
Single-Family Homes
The median sale price has increased from $0 last March 2024, to $0 as of March 2025
Condos & Townhomes
The median sale price has increased from $0 last March 2024, to $0 as of March 2025
No data to display
Overbids
Single-Family Homes
The overbid percentage has increased from 0% last March 2024, to 0% a year later
Condos & Townhomes
AVGDays OntheMarket
Single-Family Homes
No data to display No data to display
The average time spent on the market went up from 0 days last March 2024, to 0 days as of March 2025
Condos & Townhomes
The average time spent on the market went up from 0 days last March 2024, to 0 days as of March 2025.
The overbid percentage has increased from 0% last March 2024, to 0% a year later.
EastPalo Alto
What's in the Daly City data?
There were 0 single-family homes for sale, providing 0 months of inventory. There were 0 new listings, and 0 homes sold at a median price of $0 The median overbid percentage was at 0%, with an average of 0 days on the market.
There were 0 condo and townhome units for sale, providing 0 months of inventory. There were 0 new listings and 0 units sold at a median sale price of $0. The median overbid percentage was at 0%, with an average of 0 days on the market.
SFH
Single-Family Homes
0 New Listings
0 Sold Listings
0 Months of Inventory
$0 Median Sale Price
0%
Median Sale vs List
0 Avg Days on Market
The data, sourced from MLS Listings Inc., InfoSparks, and Trend Graphix, includes all single-family homes, condos, and townhomes in the California Area above from March 2024 to March 2025. This may include preliminary data and may vary from the time the data was gathered. All data is deemed reliable but not guaranteed. DRE# 01906450.
Copyright KW Advisors Peninsula Estates | Burlingame | San Mateo 2025. Each office is independently owned and operated.
Condo & Townhomes
New Listings
Sold Listings
Months of Inventory
Median Sale Price 0%
Median Sale vs List
Avg Days on Market
EastPaloAlto
MARCH 2024 - MARCH 2025
LISTINGS FOR SALE SOLD LISTINGS
Nodatatodispla�
Single-Family Homes
Last 12 months, year-over-year.
Nodatatodispla�
Condos & Townhomes
Last 12 months, year-over-year
Median SalesPrice
Single-Family Homes
The median sale price has increased from $0 last March 2024, to $0 as of March 2025
Condos & Townhomes
The median sale price has increased from $0 last March 2024, to $0 as of March 2025
No data to display
Overbids
Single-Family Homes
The overbid percentage has increased from 0% last March 2024, to 0% a year later
Condos & Townhomes
AVGDays OntheMarket
Single-Family Homes
No data to display No data to display
The average time spent on the market went up from 0 days last March 2024, to 0 days as of March 2025
Condos & Townhomes
The average time spent on the market went up from 0 days last March 2024, to 0 days as of March 2025.
The overbid percentage has increased from 0% last March 2024, to 0% a year later.
FosterCity
What's in the Foster City data?
There were 0 single-family homes for sale, providing 0 months of inventory. There were 0 new listings, and 0 homes sold at a median price of $0. The median overbid percentage was at 0%, with an average of 0 days on the market.
There were 0 condo and townhome units for sale, providing 0 months of inventory. There were 0 new listings and 0 units sold at a median sale price of $0. The median overbid percentage was at 0%, with an average of 0 days on the market.
Single-Family Homes
0 New Listings
0 Sold Listings
0 Months of Inventory
$0 Median Sale Price
0%
Median Sale vs List
0 Avg Days on Market
The data, sourced from MLS Listings Inc., InfoSparks, and Trend Graphix, includes all single-family homes, condos, and townhomes in the California Area above from March 2024 to March 2025. This may include preliminary data and may vary from the time the data was gathered. All data is deemed reliable but not guaranteed. DRE# 01906450. Copyright KW Advisors Peninsula Estates | Burlingame | San Mateo 2025. Each office is independently owned and operated.
Condo & Townhomes
New Listings
Sold Listings
Months of Inventory
Median Sale Price
Median Sale vs List
Avg Days on Market
FosterCity
MARCH 2024 - MARCH 2025
LISTINGS FOR SALE SOLD LISTINGS
Nodatatodispla�
Single-Family Homes
Last 12 months, year-over-year.
Nodatatodispla�
Condos & Townhomes
Last 12 months, year-over-year
Median SalesPrice
Single-Family Homes
The median sale price has increased from $0 last March 2024, to $0 as of March 2025
Condos & Townhomes
The median sale price has increased from $0 last March 2024, to $0 as of March 2025
No data to display
Overbids
Single-Family Homes
The overbid percentage has increased from 0% last March 2024, to 0% a year later
Condos & Townhomes
AVGDays OntheMarket
Single-Family Homes
No data to display No data to display
The average time spent on the market went up from 0 days last March 2024, to 0 days as of March 2025
Condos & Townhomes
The average time spent on the market went up from 0 days last March 2024, to 0 days as of March 2025.
The overbid percentage has increased from 0% last March 2024, to 0% a year later.
HalfM Bay
What's in the Half data?
There were 0 single-family h providing 0 months of invent new listings, and 0 homes so of $0. The median overbid pe with an average of 0 days on
There were 0 condo and tow providing 0 months of invent new listings and 0 units sold price of $0. The median over at 0%, with an average of 0 d
0
New Listings
0 Months of Inventory
0% Median Sale vs List
0 Sold Listings
$0 Median Sale Price
0 Avg Days on Market
Trend Graphix, includes all Area above from March vary from the time the guaranteed. DRE# 01906450. Mateo 2025. Each office is independently owned and operated.
New Listings
Months of Inventory
Median Sale vs List
Sold Listings
ISTINGS
Median SalesPrice
Single-Family Homes
The median sale price has increased from $0 last March 2024, to $0 as of March 2025
Condos & Townhomes
The median sale price has increased from $0 last March 2024, to $0 as of March 2025
No data to display
Overbids
Single-Family Homes
The overbid percentage has increased from 0% last March 2024, to 0% a year later
Condos & Townhomes
AVGDays OntheMarket
Single-Family Homes
No data to display No data to display
The average time spent on the market went up from 0 days last March 2024, to 0 days as of March 2025
Condos & Townhomes
The average time spent on the market went up from 0 days last March 2024, to 0 days as of March 2025.
The overbid percentage has increased from 0% last March 2024, to 0% a year later.
Hillsborough
What's in the Hillsborough data?
There were 0 single-family homes for sale, providing 0 months of inventory. There were 0 new listings, and 0 homes sold at a median price of $0. The median overbid percentage was at 0%, with an average of 0 days on the market.
There were 0 condo and townhome units for sale, providing 0 months of inventory. There were 0 new listings and 0 units sold at a median sale price of $0. The median overbid percentage was at 0%, with an average of 0 days on the market.
0
New Listings
0 Sold Listings
0 Months of Inventory
$0 Median Sale Price
0%
Median Sale vs List
independently owned and operated.
0 Avg Days on Market
New Listings
Sold Listings
D LISTINGS
pla� pla� onth.
y y
Median SalesPrice
Single-Family Homes
The median sale price has increased from $0 last March 2024, to $0 as of March 2025
Condos & Townhomes
The median sale price has increased from $0 last March 2024, to $0 as of March 2025
No data to display
Overbids
Single-Family Homes
The overbid percentage has increased from 0% last March 2024, to 0% a year later
Condos & Townhomes
AVGDays OntheMarket
Single-Family Homes
No data to display No data to display
The average time spent on the market went up from 0 days last March 2024, to 0 days as of March 2025
Condos & Townhomes
The average time spent on the market went up from 0 days last March 2024, to 0 days as of March 2025.
The overbid percentage has increased from 0% last March 2024, to 0% a year later.
MenloPark
What's in the Hillsborough data?
There were 0 single-family homes for sale, providing 0 months of inventory. There were 0 new listings, and 0 homes sold at a median price of $0. The median overbid percentage was at 0%, with an average of 0 days on the market.
There were 0 condo and townhome units for sale, providing 0 months of inventory. There were 0 new listings and 0 units sold at a median sale price of $0. The median overbid percentage was at 0%, with an average of 0 days on the market
Single-Family Homes
0
New Listings
0 Sold Listings
0 Months of Inventory
$0 Median Sale Price
0%
Median Sale vs List
0 Avg Days on Market
The data, sourced from MLS Listings Inc., InfoSparks, and Trend Graphix, includes all single-family homes, condos, and townhomes in the California Area above from March 2024 to March 2025. This may include preliminary data and may vary from the time the data was gathered. All data is deemed reliable but not guaranteed. DRE# 01906450. Copyright KW Advisors Peninsula Estates | Burlingame | San Mateo 2025. Each office is independently owned and operated.
C Condo
New Listings
Months of Inventory
Median Sale vs List
STINGS
Median SalesPrice
Single-Family Homes
The median sale price has increased from $0 last March 2024, to $0 as of March 2025
Condos & Townhomes
The median sale price has increased from $0 last March 2024, to $0 as of March 2025
No data to display
Overbids
Single-Family Homes
The overbid percentage has increased from 0% last March 2024, to 0% a year later
Condos & Townhomes
AVGDays OntheMarket
Single-Family Homes
No data to display No data to display
The average time spent on the market went up from 0 days last March 2024, to 0 days as of March 2025
Condos & Townhomes
The average time spent on the market went up from 0 days last March 2024, to 0 days as of March 2025.
The overbid percentage has increased from 0% last March 2024, to 0% a year later.
Millbrae
What's in the Millbrae data?
There were 0 single-family homes for sale, providing 0 months of inventory. There were 0 new listings, and 0 homes sold at a median price of $0. The median overbid percentage was at 0%, with an average of 0 days on the market.
There were 0 condo and townhome units for sale, providing 0 months of inventory. There were 0 new listings and 0 units sold at a median sale price of $0. The median overbid percentage was at 0%, with an average of 0 days on the market.
Single-Family Homes
0
New Listings
0 Sold Listings
0 Months of Inventory
$0 Median Sale Price
0%
Median Sale vs List
0 Avg Days on Market
The data, sourced from MLS Listings Inc., InfoSparks, and Trend Graphix, includes all single-family homes, condos, and townhomes in the California Area above from March 2024 to March 2025. This may include preliminary data and may vary from the time the data was gathered. All data is deemed reliable but not guaranteed. DRE# 01906450. Copyright KW Advisors Peninsula Estates | Burlingame | San Mateo 2025. Each office is independently owned and operated.
New Listings
Months of Inventory
Sold Listings
STINGS
Median SalesPrice
Single-Family Homes
The median sale price has increased from $0 last March 2024, to $0 as of March 2025
Condos & Townhomes
The median sale price has increased from $0 last March 2024, to $0 as of March 2025
No data to display
Overbids
Single-Family Homes
The overbid percentage has increased from 0% last March 2024, to 0% a year later
Condos & Townhomes
AVGDays OntheMarket
Single-Family Homes
No data to display No data to display
The average time spent on the market went up from 0 days last March 2024, to 0 days as of March 2025
Condos & Townhomes
The average time spent on the market went up from 0 days last March 2024, to 0 days as of March 2025.
The overbid percentage has increased from 0% last March 2024, to 0% a year later.
Pacifica
What's in the Paci
There were 0 single-family ho providing 0 months of invent new listings, and 0 homes so of $0. The median overbid pe with an average of 0 days on
There were 0 condo and tow providing 0 months of invent new listings and 0 units sold price of $0. The median over at 0%, with an average of 0 d
0
New Listings
0 Months of Inventory
0% Median Sale vs List
0 Sold Listings
$0 Median Sale Price
0 Avg Days on Market
Trend Graphix, includes all Area above from March vary from the time the guaranteed. DRE# 01906450. Mateo 2025. Each office is independently owned and operated.
New Listings
Months of Inventory
Median Sale vs List
Sold Listings
STINGS
Median SalesPrice
Single-Family Homes
The median sale price has increased from $0 last March 2024, to $0 as of March 2025
Condos & Townhomes
The median sale price has increased from $0 last March 2024, to $0 as of March 2025
No data to display
No data to display
AVGDays OntheMarket
Single-Family Homes
The average time spent on the market went up from 0 days last March 2024, to 0 days as of March 2025
Condos & Townhomes
The average time spent on the market went up from 0 days last March 2024, to 0 days as of March 2025.
Overbids
Single-Family Homes
The overbid percentage has increased from 0% last March 2024, to 0% a year later
Condos & Townhomes
The overbid percentage has increased from 0% last March 2024, to 0% a year later.
No data to display
Portola Valley
What's in the Pacifica data?
There were 0 single-family homes for sale, providing 0 months of inventory. There were 0 new listings, and 0 homes sold at a median price of $0 The median overbid percentage was at 0%, with an average of 0 days on the market.
There were 0 condo and townhome units for sale, providing 0 months of inventory. There were 0 new listings and 0 units sold at a median sale price of $0. The median overbid percentage was at 0%, with an average of 0 days on the market.
Single-Family Homes
0
New Listings
0 Sold Listings
0 Months of Inventory
$0 Median Sale Price
0%
Median Sale vs List
0 Avg Days on Market
The data, sourced from MLS Listings Inc., InfoSparks, and Trend Graphix, includes all single-family homes, condos, and townhomes in the California Area above from March 2024 to March 2025. This may include preliminary data and may vary from the time the data was gathered. All data is deemed reliable but not guaranteed. DRE# 01906450. Copyright KW Advisors Peninsula Estates | Burlingame | San Mateo 2025. Each office is independently owned and operated.
Condo & Townhomes
New Listings
Sold Listings
Months of Inventory
Median Sale Price 0%
Median Sale vs List
Avg Days on Market
ortolaValley
MARCH 2024 - MARCH 2025
TINGS FOR SALE SOLD LISTINGS
Nodatatodispla�
Family Homes
2 months, year-over-year.
Nodatatodispla�
s & Townhomes
2 months, year-over-year
Median SalesPrice
Single-Family Homes
The median sale price has increased from $0 last March 2024, to $0 as of March 2025
Condos & Townhomes
The median sale price has increased from $0 last March 2024, to $0 as of March 2025
No data to display
No data to display
AVGDays OntheMarket
Single-Family Homes
The average time spent on the market went up from 0 days last March 2024, to 0 days as of March 2025
Condos & Townhomes
The average time spent on the market went up from 0 days last March 2024, to 0 days as of March 2025.
Overbids
Single-Family Homes
The overbid percentage has increased from 0% last March 2024, to 0% a year later
Condos & Townhomes
The overbid percentage has increased from 0% last March 2024, to 0% a year later.
No data to display
Redwood City
What's in the Pacifica data?
There were 0 single-family homes for sale, providing 0 months of inventory. There were 0 new listings, and 0 homes sold at a median price of $0 The median overbid percentage was at 0%, with an average of 0 days on the market.
There were 0 condo and townhome units for sale, providing 0 months of inventory. There were 0 new listings and 0 units sold at a median sale price of $0. The median overbid percentage was at 0%, with an average of 0 days on the market.
Single-Family Homes
0 New Listings
0 Sold Listings
0 Months of Inventory
$0 Median Sale Price
0%
Median Sale vs List
0 Avg Days on Market
The data, sourced from MLS Listings Inc., InfoSparks, and Trend Graphix, includes all single-family homes, condos, and townhomes in the California Area above from March 2024 to March 2025. This may include preliminary data and may vary from the time the data was gathered. All data is deemed reliable but not guaranteed. DRE# 01906450. Copyright KW Advisors Peninsula Estates | Burlingame | San Mateo 2025. Each office is independently owned and operated.
Condo & Townhomes
New Listings
Sold Listings
Months of Inventory
Median Sale Price
Median Sale vs List
Avg Days on Market
RedwoodCity
MARCH 2024 - MARCH 2025
LISTINGS FOR SALE SOLD LISTINGS
Nodatatodispla�
Single-Family Homes
Last 12 months, year-over-year.
Nodatatodispla�
Condos & Townhomes
Last 12 months, year-over-year
Median SalesPrice
Single-Family Homes
The median sale price has increased from $0 last March 2024, to $0 as of March 2025
Condos & Townhomes
The median sale price has increased from $0 last March 2024, to $0 as of March 2025
No data to display
No data to display
AVGDays OntheMarket
Single-Family Homes
The average time spent on the market went up from 0 days last March 2024, to 0 days as of March 2025
Condos & Townhomes
The average time spent on the market went up from 0 days last March 2024, to 0 days as of March 2025.
Overbids
Single-Family Homes
The overbid percentage has increased from 0% last March 2024, to 0% a year later
Condos & Townhomes
The overbid percentage has increased from 0% last March 2024, to 0% a year later.
No data to display
He-Family Homes
0 New Listings
0 Sold Listings
0 Months of Inventory
$0 Median Sale Price
0%
Median Sale vs List
0 Avg Days on Market
sourced from MLS Listings Inc., InfoSparks, and Trend Graphix, includes all homes, condos, and townhomes in the California Area above from March March 2025. This may include preliminary data and may vary from the time the gathered. All data is deemed reliable but not guaranteed. DRE# 01906450. KW Advisors Peninsula Estates | Burlingame | San Mateo 2025. Each office is independently owned and operated.
Condo
New Listings
Months of Inventory
Median Sale vs List
Sold Listings
STINGS
Median SalesPrice
Single-Family Homes
The median sale price has increased from $0 last March 2024, to $0 as of March 2025
Condos & Townhomes
The median sale price has increased from $0 last March 2024, to $0 as of March 2025
No data to display
Overbids
Single-Family Homes
The overbid percentage has increased from 0% last March 2024, to 0% a year later
Condos & Townhomes
AVGDays OntheMarket
Single-Family Homes
No data to display No data to display
The average time spent on the market went up from 0 days last March 2024, to 0 days as of March 2025
Condos & Townhomes
The average time spent on the market went up from 0 days last March 2024, to 0 days as of March 2025.
The overbid percentage has increased from 0% last March 2024, to 0% a year later.
SanCarlos
What's in the San Carlos data?
There were 0 single-family homes for sale, providing 0 months of inventory. There were 0 new listings, and 0 homes sold at a median price of $0. The median overbid percentage was at 0%, with an average of 0 days on the market.
There were 0 condo and townhome units for sale, providing 0 months of inventory. There were 0 new listings and 0 units sold at a median sale price of $0. The median overbid percentage was at 0%, with an average of 0 days on the market.
Single-Family Homes
0 New Listings
0 Sold Listings
0 Months of Inventory
$0 Median Sale Price
0%
Median Sale vs List
0 Avg Days on Market
The data, sourced from MLS Listings Inc., InfoSparks, and Trend Graphix, includes all single-family homes, condos, and townhomes in the California Area above from March 2024 to March 2025. This may include preliminary data and may vary from the time the data was gathered. All data is deemed reliable but not guaranteed. DRE# 01906450. Copyright KW Advisors Peninsula Estates | Burlingame | San Mateo 2025. Each office is independently owned and operated.
New Listings
Sold Listings
Months of Inventory
Median Sale Price
Median Sale vs List
Avg Days on Market
Carlos
MARCH 2024 - MARCH 2025
R SALE SOLD LISTINGS
Nodatatodispla�
mes year-over-year.
Nodatatodispla�
omes , year-over-year
Median SalesPrice
Single-Family Homes
The median sale price has increased from $0 last March 2024, to $0 as of March 2025
Condos & Townhomes
The median sale price has increased from $0 last March 2024, to $0 as of March 2025
No data to display
Overbids
Single-Family Homes
The overbid percentage has increased from 0% last March 2024, to 0% a year later
Condos & Townhomes
AVGDays OntheMarket
Single-Family Homes
No data to display No data to display
The average time spent on the market went up from 0 days last March 2024, to 0 days as of March 2025
Condos & Townhomes
The average time spent on the market went up from 0 days last March 2024, to 0 days as of March 2025.
The overbid percentage has increased from 0% last March 2024, to 0% a year later.
SanMateo
What's in the San Mateo data?
There were 0 single-family homes for sale, providing 0 months of inventory. There were 0 new listings, and 0 homes sold at a median price of $0. The median overbid percentage was at 0%, with an average of 0 days on the market.
There were 0 condo and townhome units for sale, providing 0 months of inventory. There were 0 new listings and 0 units sold at a median sale price of $0. The median overbid percentage was at 0%, with an average of 0 days on the market.
0 New Listings
mily Homes
0 Sold Listings
0 Months of Inventory
$0 Median Sale Price
0%
Median Sale vs List
0 Avg Days on Market
MLS Listings Inc., InfoSparks, and Trend Graphix, includes all condos, and townhomes in the California Area above from March may include preliminary data and may vary from the time the data is deemed reliable but not guaranteed. DRE# 01906450. eninsula Estates | Burlingame | San Mateo 2025. Each office is independently owned and operated.
Condo & Townhomes
New Listings
Sold Listings
Months of Inventory
Median Sale Price 0%
Median Sale vs List
Avg Days on Market
SanMateo
MARCH 2024 - MARCH 2025
LISTINGS FOR SALE SOLD LISTINGS
Nodatatodispla�
gle-Family Homes
t 12 months, year-over-year.
Nodatatodispla�
ndos & Townhomes
t 12 months, year-over-year
Median SalesPrice
Single-Family Homes
The median sale price has increased from $0 last March 2024, to $0 as of March 2025
Condos & Townhomes
The median sale price has increased from $0 last March 2024, to $0 as of March 2025
No data to display
Overbids
Single-Family Homes
The overbid percentage has increased from 0% last March 2024, to 0% a year later
Condos & Townhomes
AVGDays OntheMarket
Single-Family Homes
No data to display No data to display
The average time spent on the market went up from 0 days last March 2024, to 0 days as of March 2025
Condos & Townhomes
The average time spent on the market went up from 0 days last March 2024, to 0 days as of March 2025.
The overbid percentage has increased from 0% last March 2024, to 0% a year later.
SouthSan Francisco
What's in the South San Francisco data?
There were 0 single-family homes for sale, providing 0 months of inventory. There were 0 new listings, and 0 homes sold at a median price of $0. The median overbid percentage was at 0%, with an average of 0 days on the market
There were 0 condo and townhome units for sale, providing 0 months of inventory. There were 0 new listings and 0 units sold at a median sale price of $0. The median overbid percentage was at 0%, with an average of 0 days on the market.
0
New Listings
0 Sold Listings
0 Months of Inventory
$0 Median Sale Price
0%
Median Sale vs List
independently owned and operated.
0 Avg Days on Market
Condo & Townhomes
New Listings
Sold Listings
Months of Inventory
Median Sale Price 0%
Median Sale vs List
Avg Days on Market
SouthSanFrancisco
MARCH 2024 - MARCH 2025
LISTINGS FOR SALE SOLD LISTINGS
Nodatatodispla�
Single-Family Homes
Last 12 months, year-over-year.
Nodatatodispla�
Condos & Townhomes
Last 12 months, year-over-year
Median SalesPrice
Single-Family Homes
The median sale price has increased from $0 last March 2024, to $0 as of March 2025
Condos & Townhomes
The median sale price has increased from $0 last March 2024, to $0 as of March 2025
No data to display
Overbids
Single-Family Homes
The overbid percentage has increased from 0% last March 2024, to 0% a year later
Condos & Townhomes
AVGDays OntheMarket
Single-Family Homes
No data to display No data to display
The average time spent on the market went up from 0 days last March 2024, to 0 days as of March 2025
Condos & Townhomes
The average time spent on the market went up from 0 days last March 2024, to 0 days as of March 2025.
The overbid percentage has increased from 0% last March 2024, to 0% a year later.
Wo
What's in Francisc
There were 0 providing 0 m new listings, of $0. The me with an avera
There were 0 providing 0 m new listings a price of $0. T at 0%, with an
FH
e-Family Homes
0 Sold Listings
sourced from MLS Listings Inc., InfoSparks, and Trend Graphix, includes all homes, condos, and townhomes in the California Area above from March March 2025. This may include preliminary data and may vary from the time the gathered. All data is deemed reliable but not guaranteed. DRE# 01906450. KW Advisors Peninsula Estates | Burlingame | San Mateo 2025. Each office is independently owned and operated. tings of Inventory
$0 Median Sale Price
% Sale vs List
0 Avg Days on Market
Condo & Townhomes
New Listings
Sold Listings
Months of Inventory
Median Sale Price
Median Sale vs List
Avg Days on Market
Woodside
MARCH 2024 - MARCH 2025
LISTINGS FOR SALE SOLD LISTINGS
Nodatatodispla�
gle-Family Homes st 12 months, year-over-year.
Nodatatodispla�
ndos & Townhomes st 12 months, year-over-year
Median SalesPrice
Single-Family Homes
The median sale price has increased from $0 last March 2024, to $0 as of March 2025
Condos & Townhomes
The median sale price has increased from $0 last March 2024, to $0 as of March 2025
No data to display
Overbids
Single-Family Homes
The overbid percentage has increased from 0% last March 2024, to 0% a year later
Condos & Townhomes
AVGDays OntheMarket
Single-Family Homes
No data to display No data to display
The average time spent on the market went up from 0 days last March 2024, to 0 days as of March 2025
Condos & Townhomes
The average time spent on the market went up from 0 days last March 2024, to 0 days as of March 2025.
The overbid percentage has increased from 0% last March 2024, to 0% a year later.
Smart Strategies for a Mortgage Application
Avoid paying off debts or collections without professional advice.
Don't have your credit report pulled too many times - this can hurt your credit score. 3 4 5 6 1 2
Always consult your mortgage professional before making large financial moves. Use verified funds for deposits to prevent closing delays.
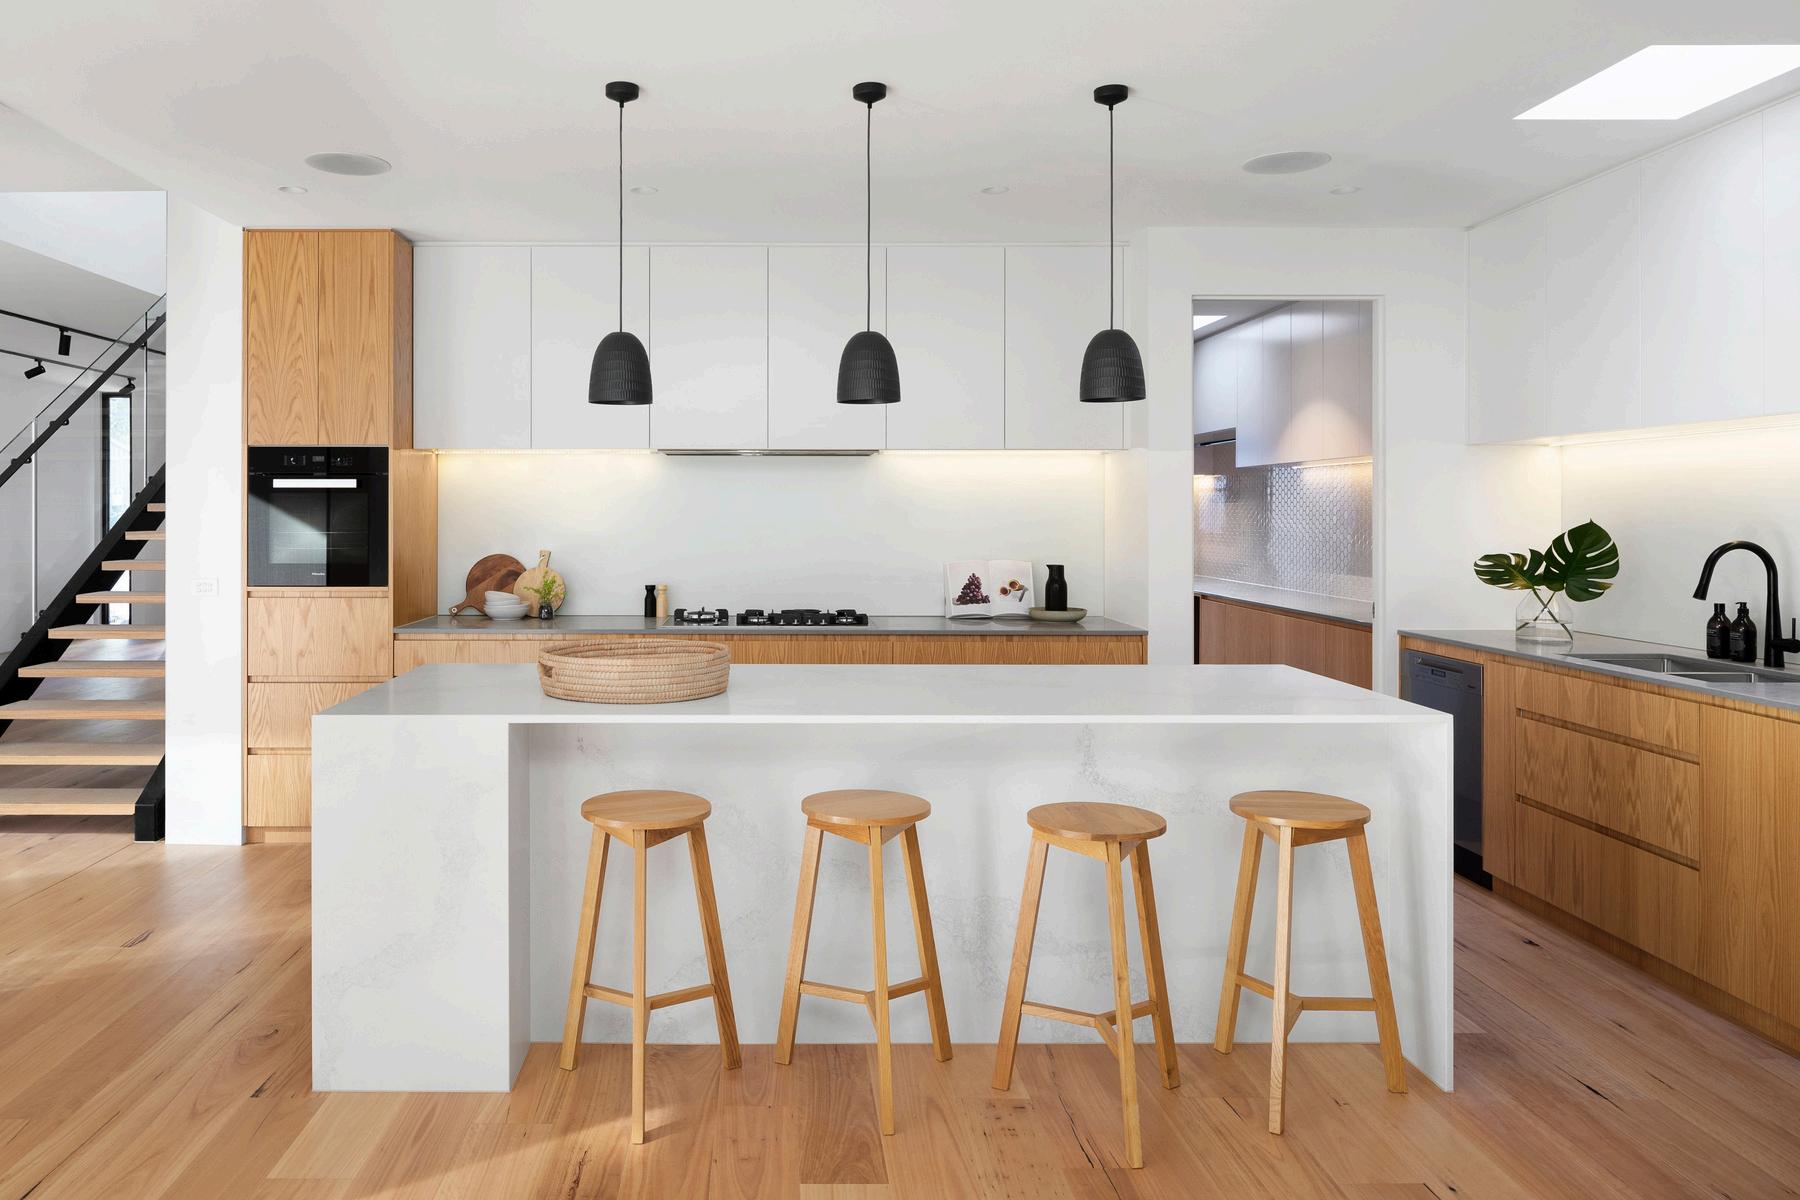
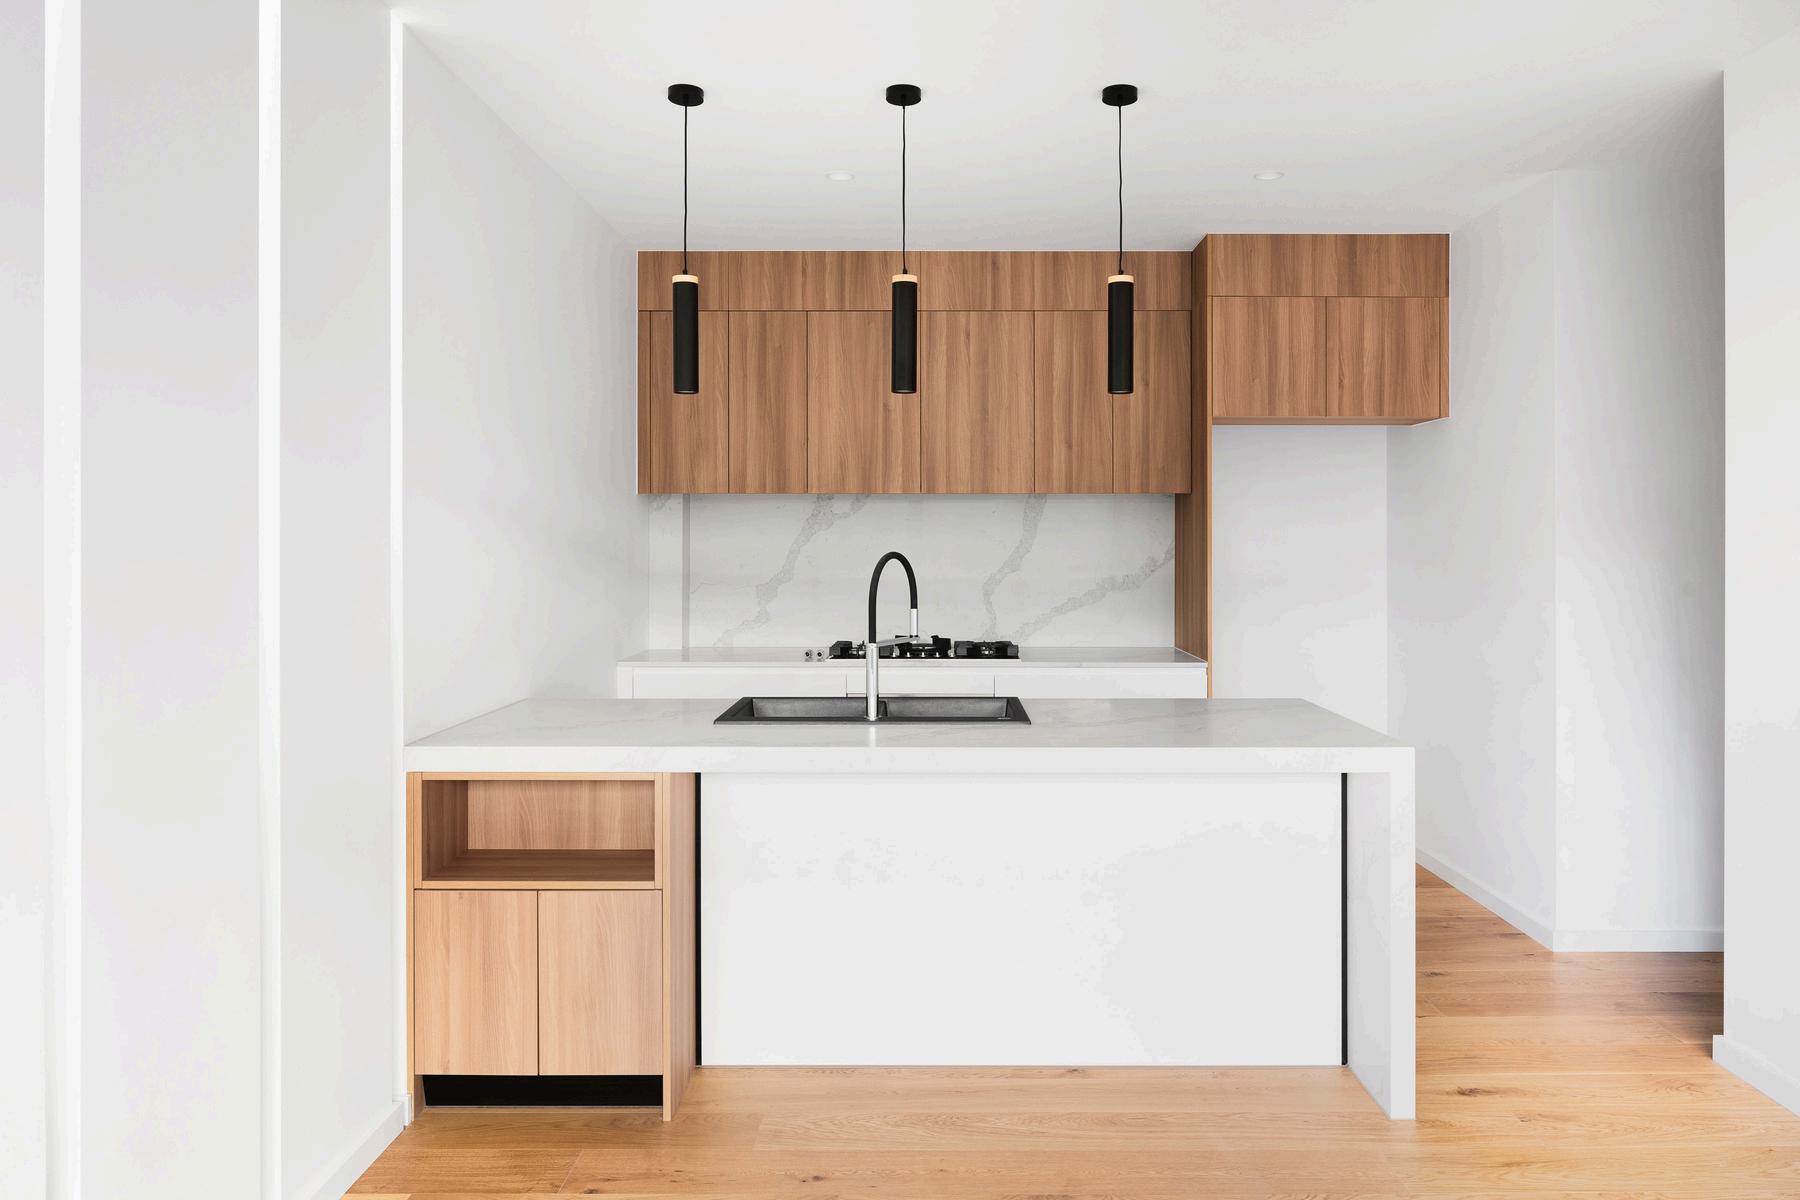
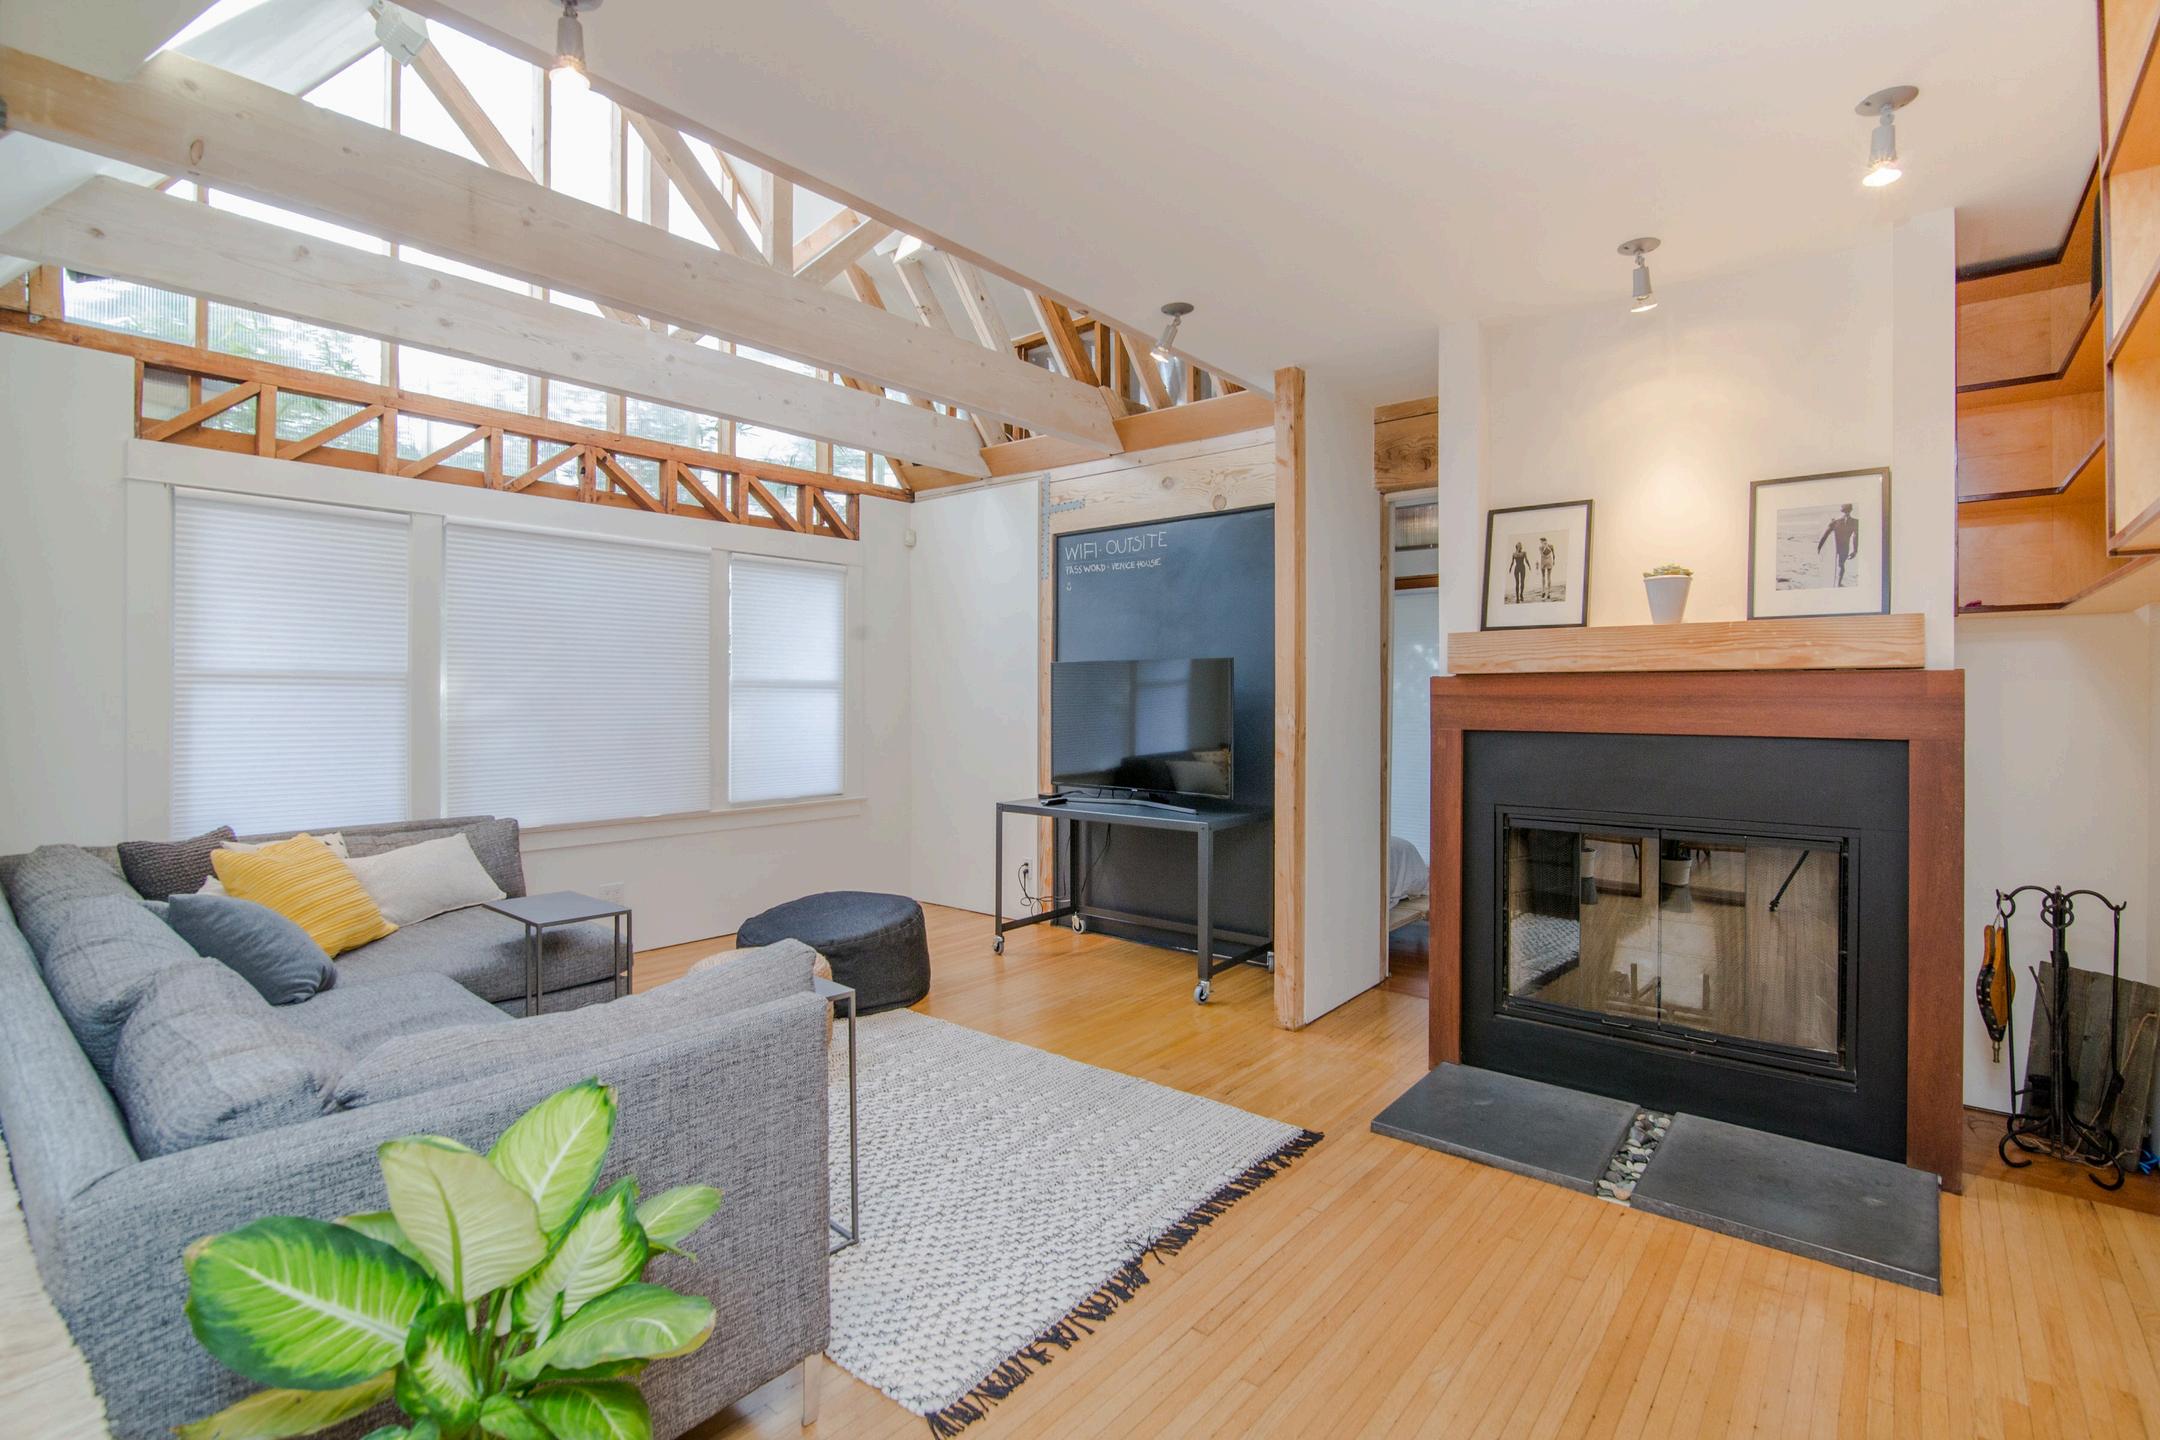
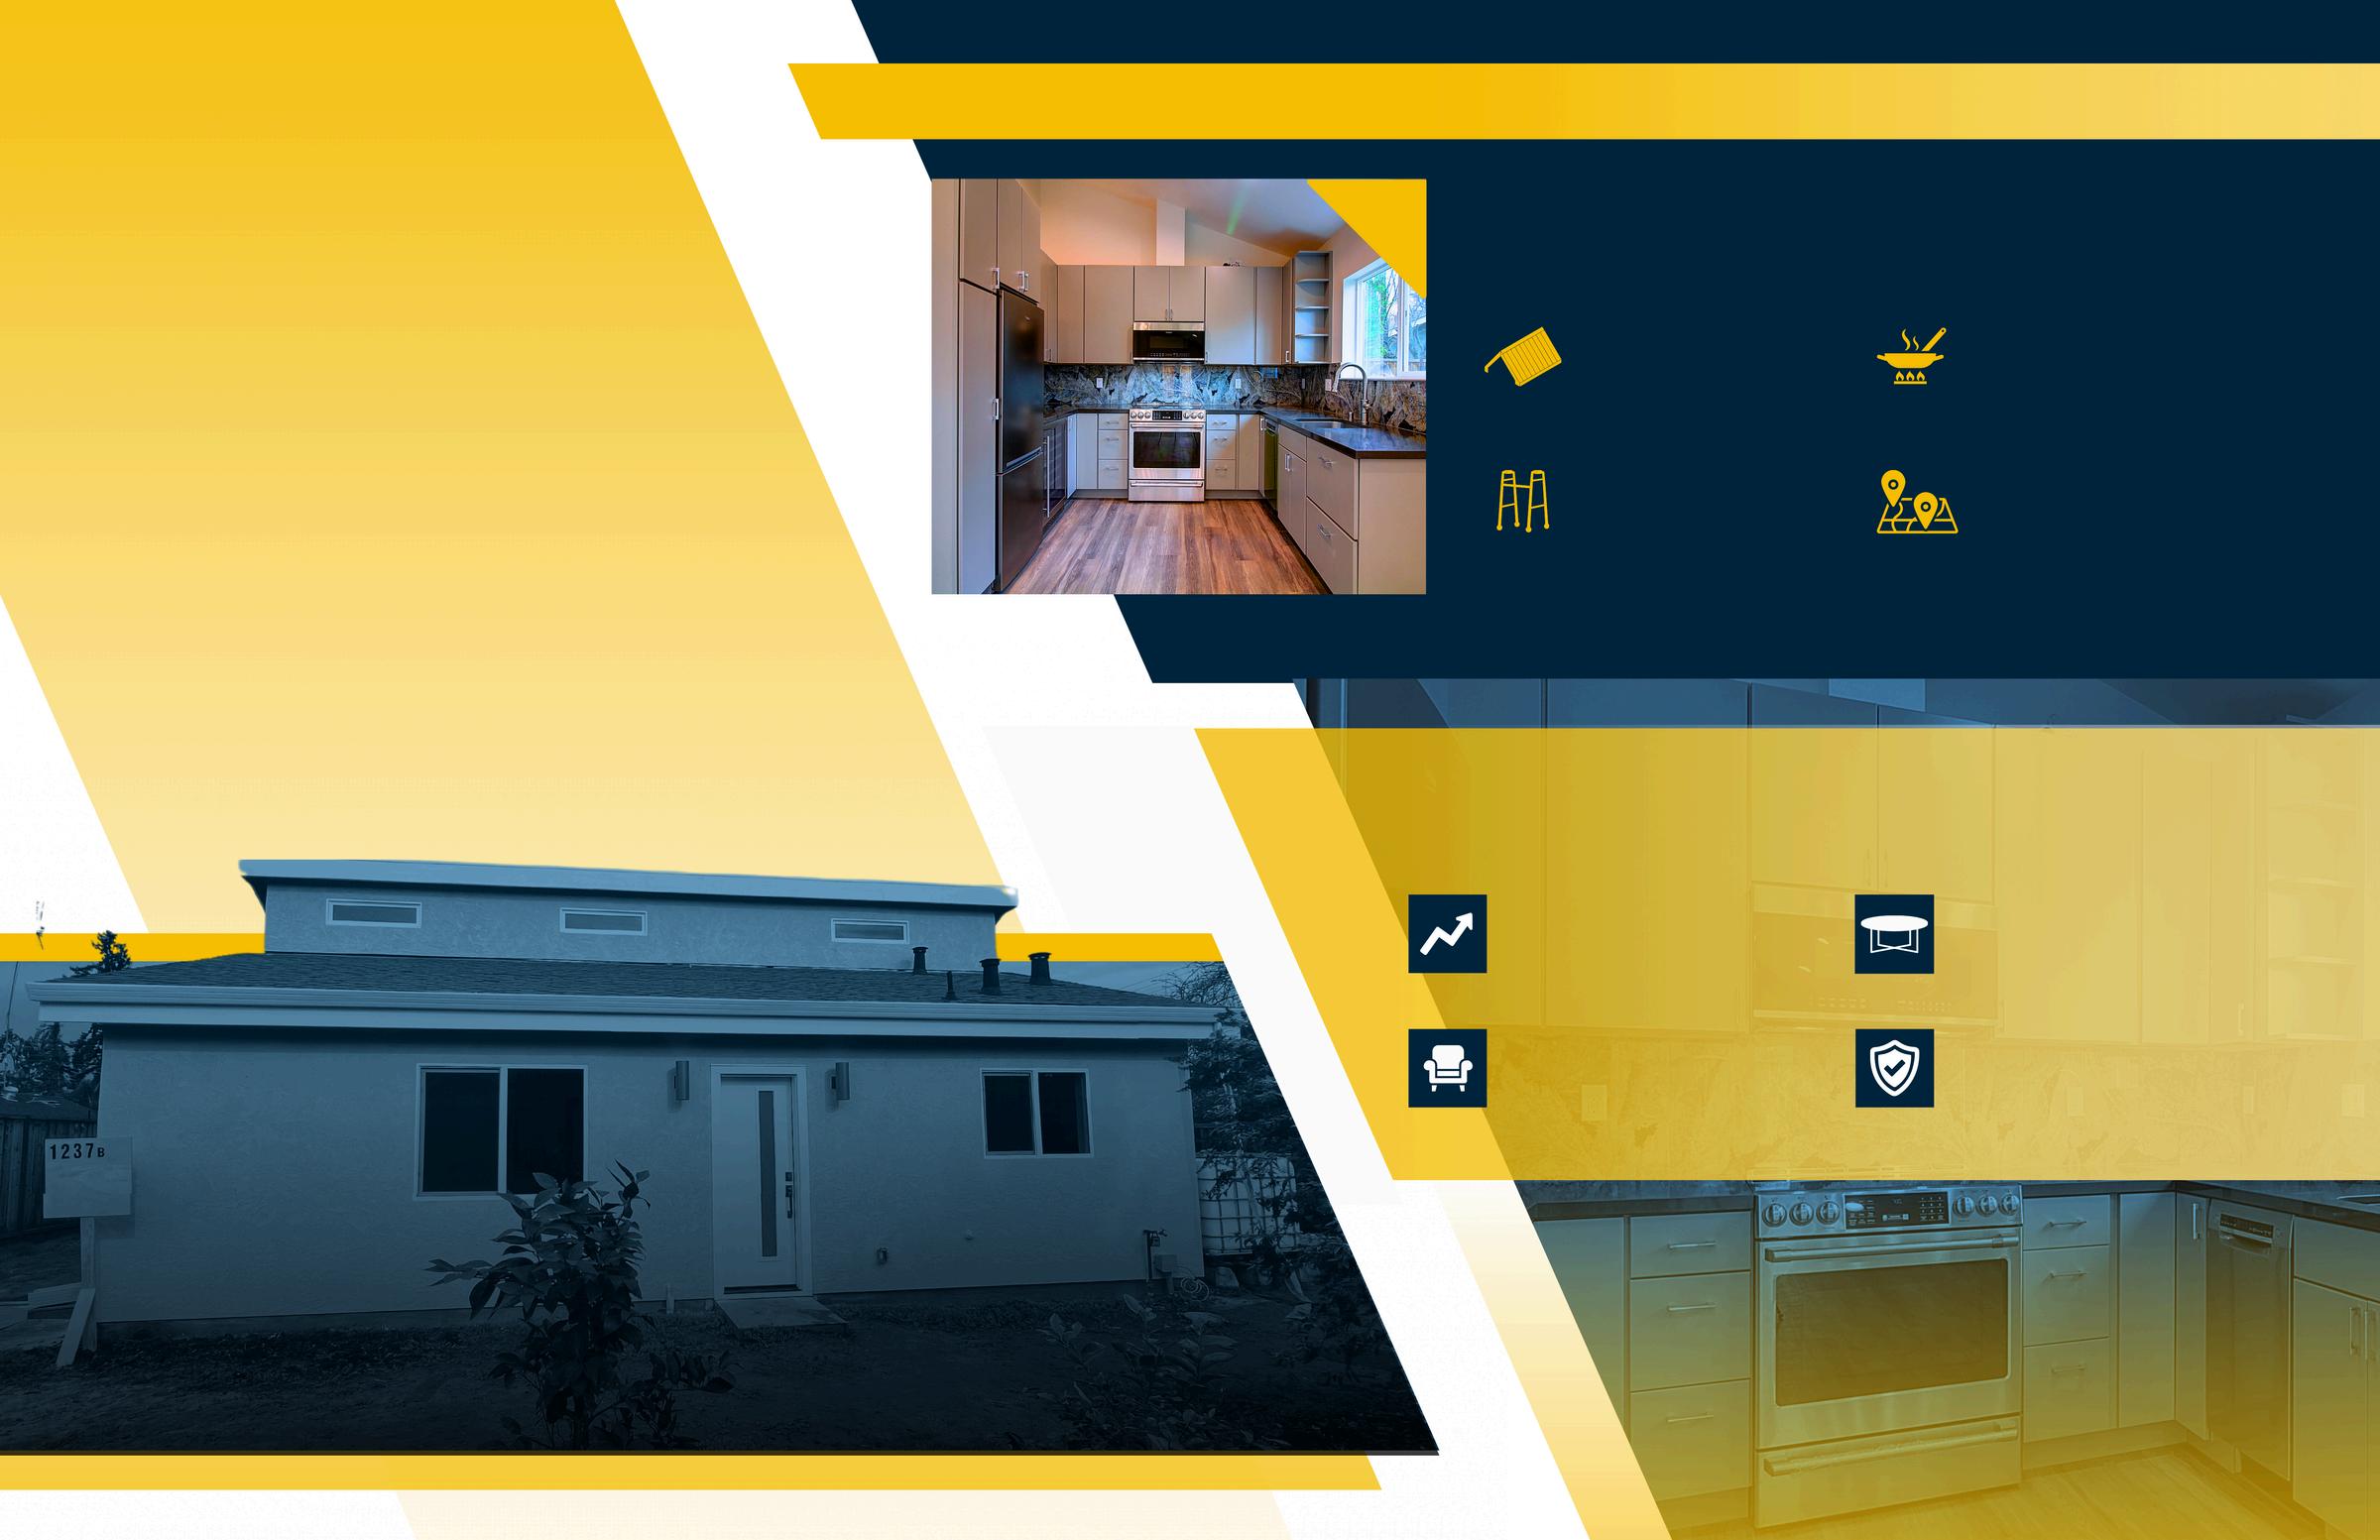
HomeRenovationsThatCanMakea BIG IMPACT AccordingtoExperts
Enhancing Property Value and Family Living Space with an Acton ADU
The Anenberg-Essert family in Campbell collaborated with Acton ADU to create a versatile, comfortable, and valuable addition to their property. This ADU project is a shining example of how a well-designed accessory dwelling unit can increase property value and serve a family’s unique needs.
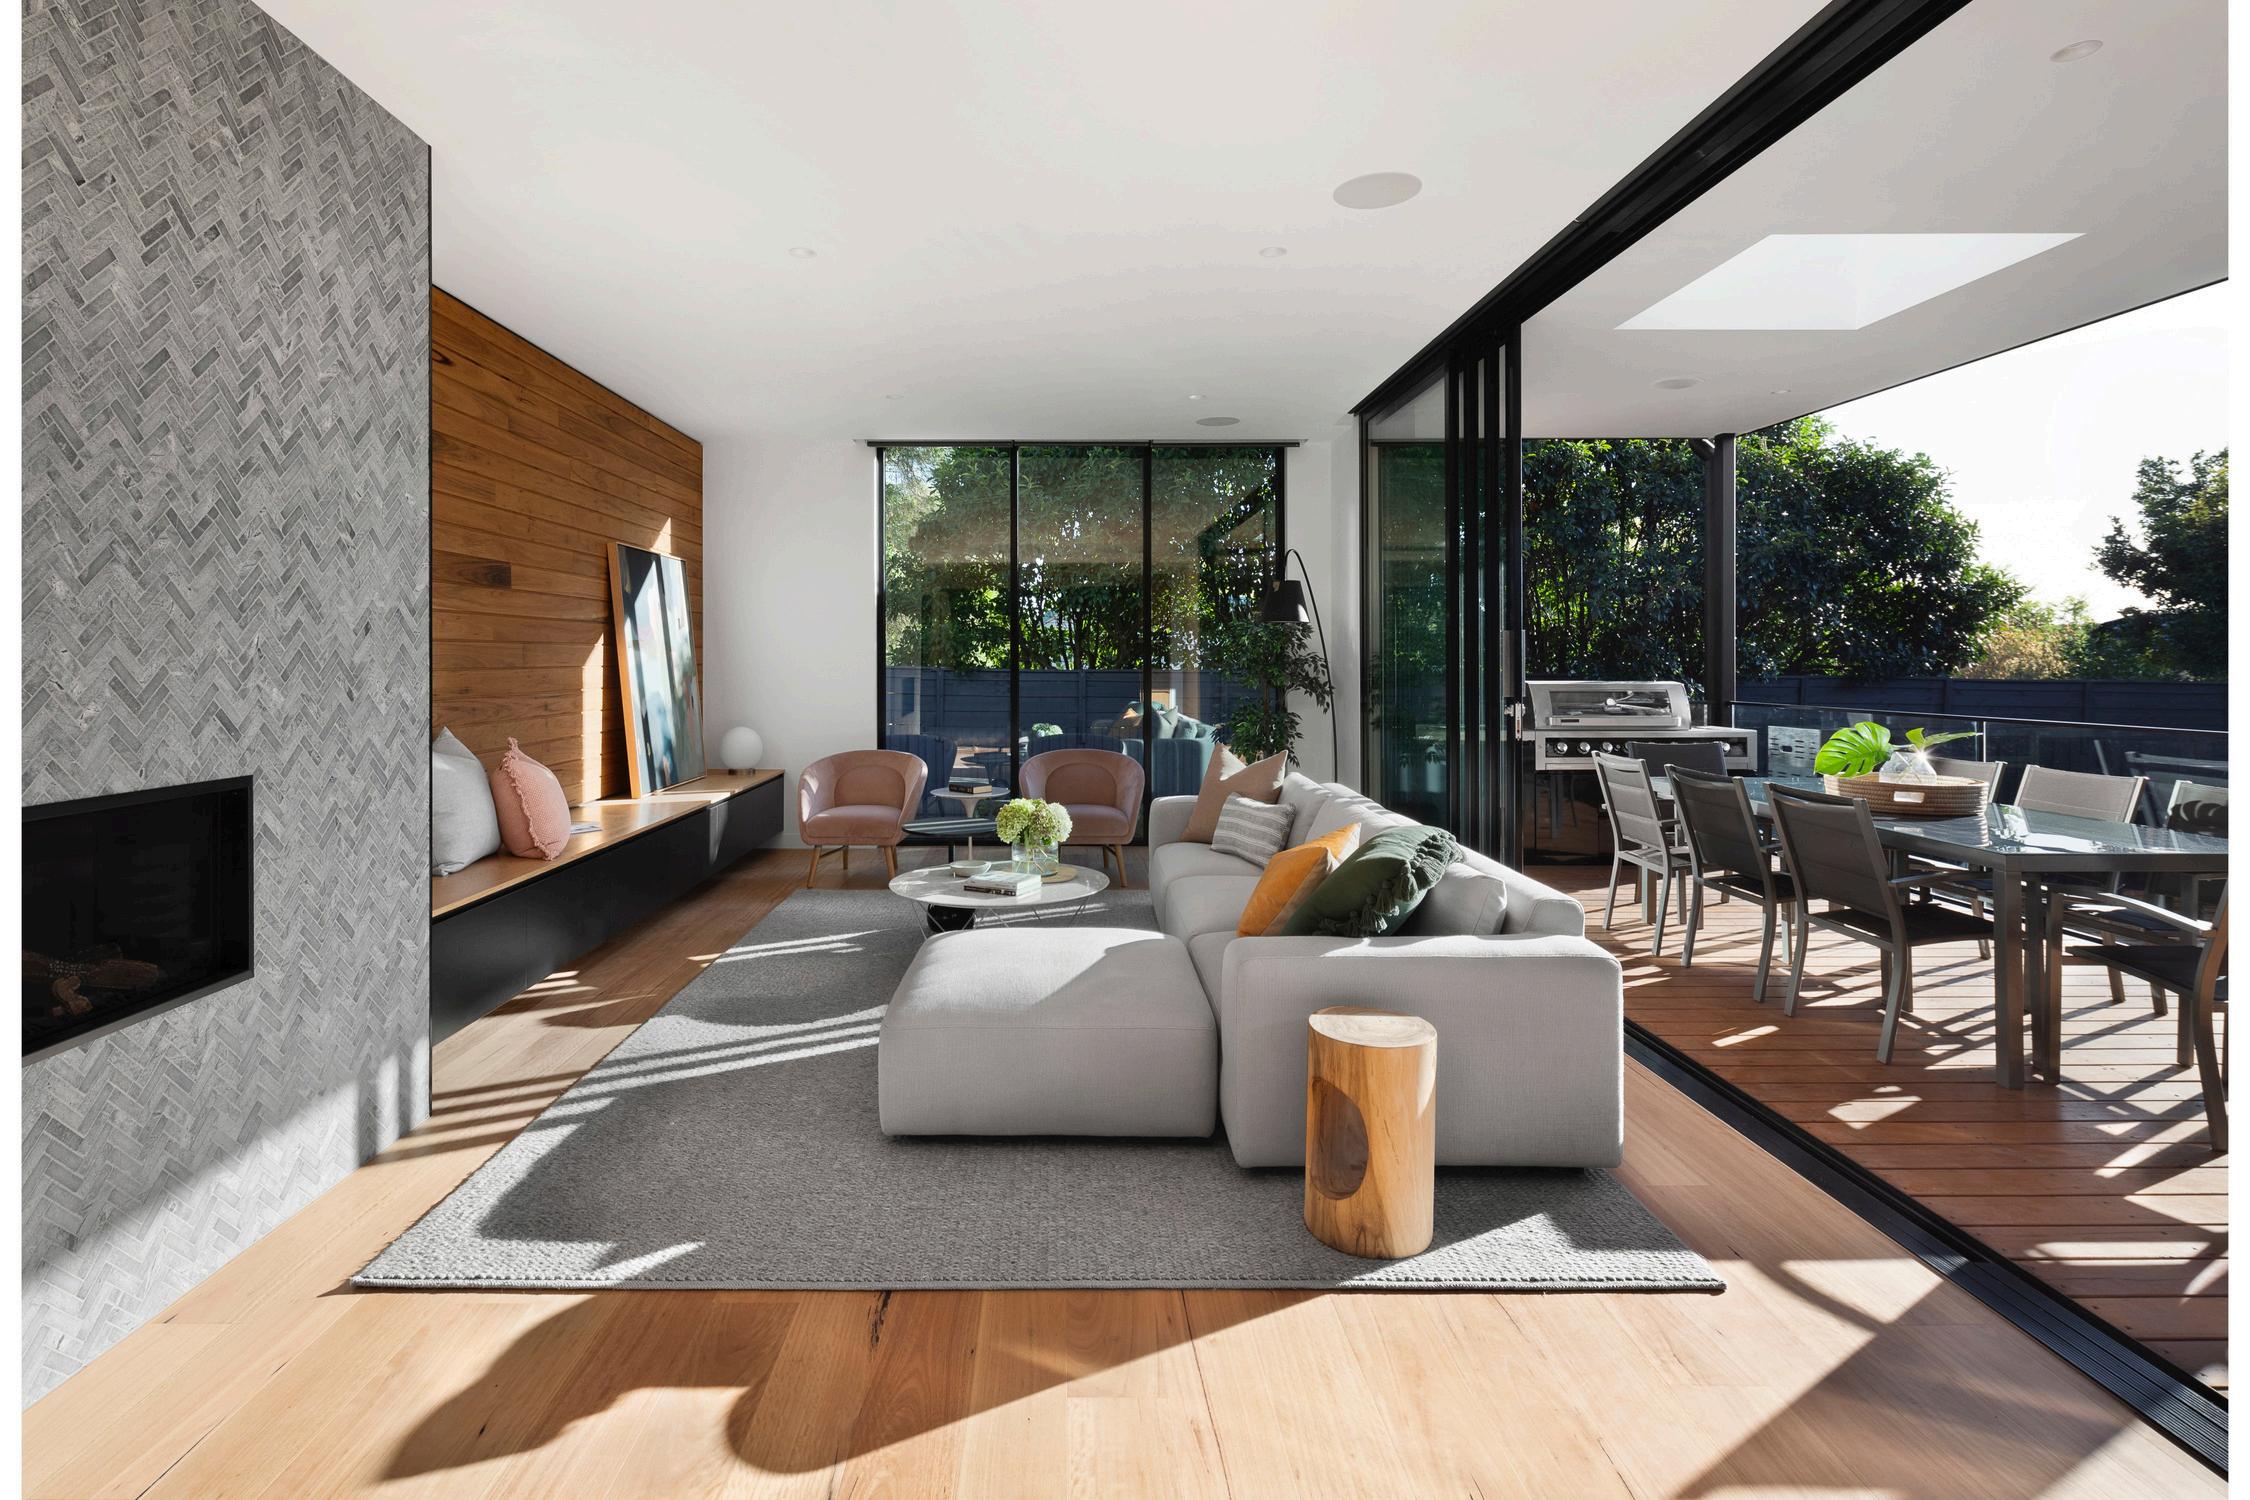
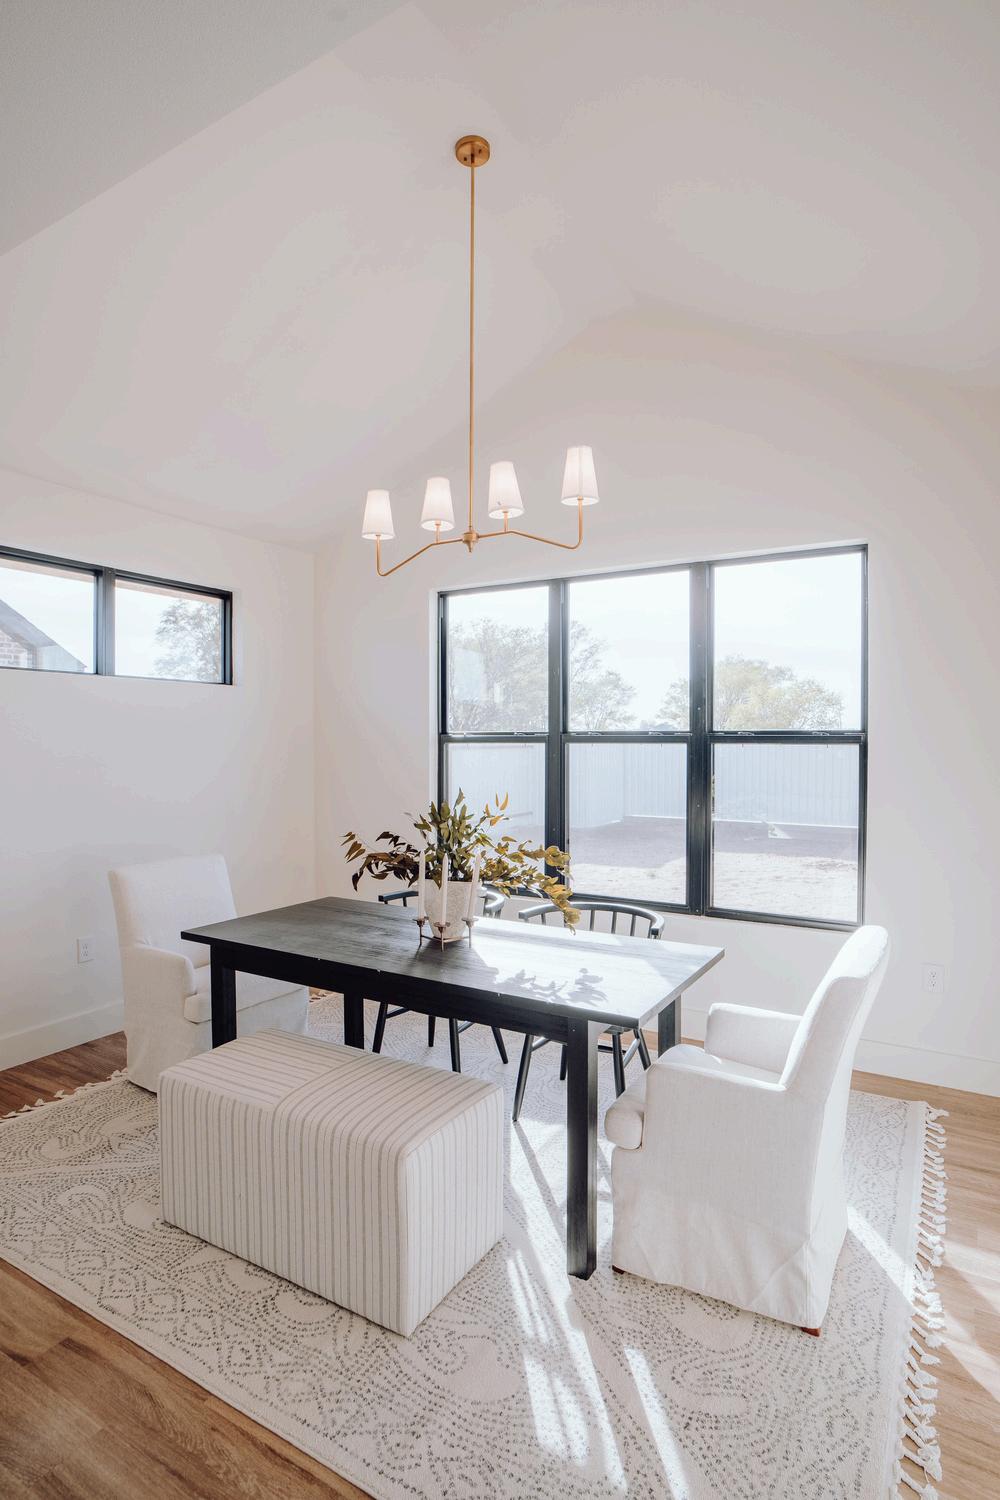
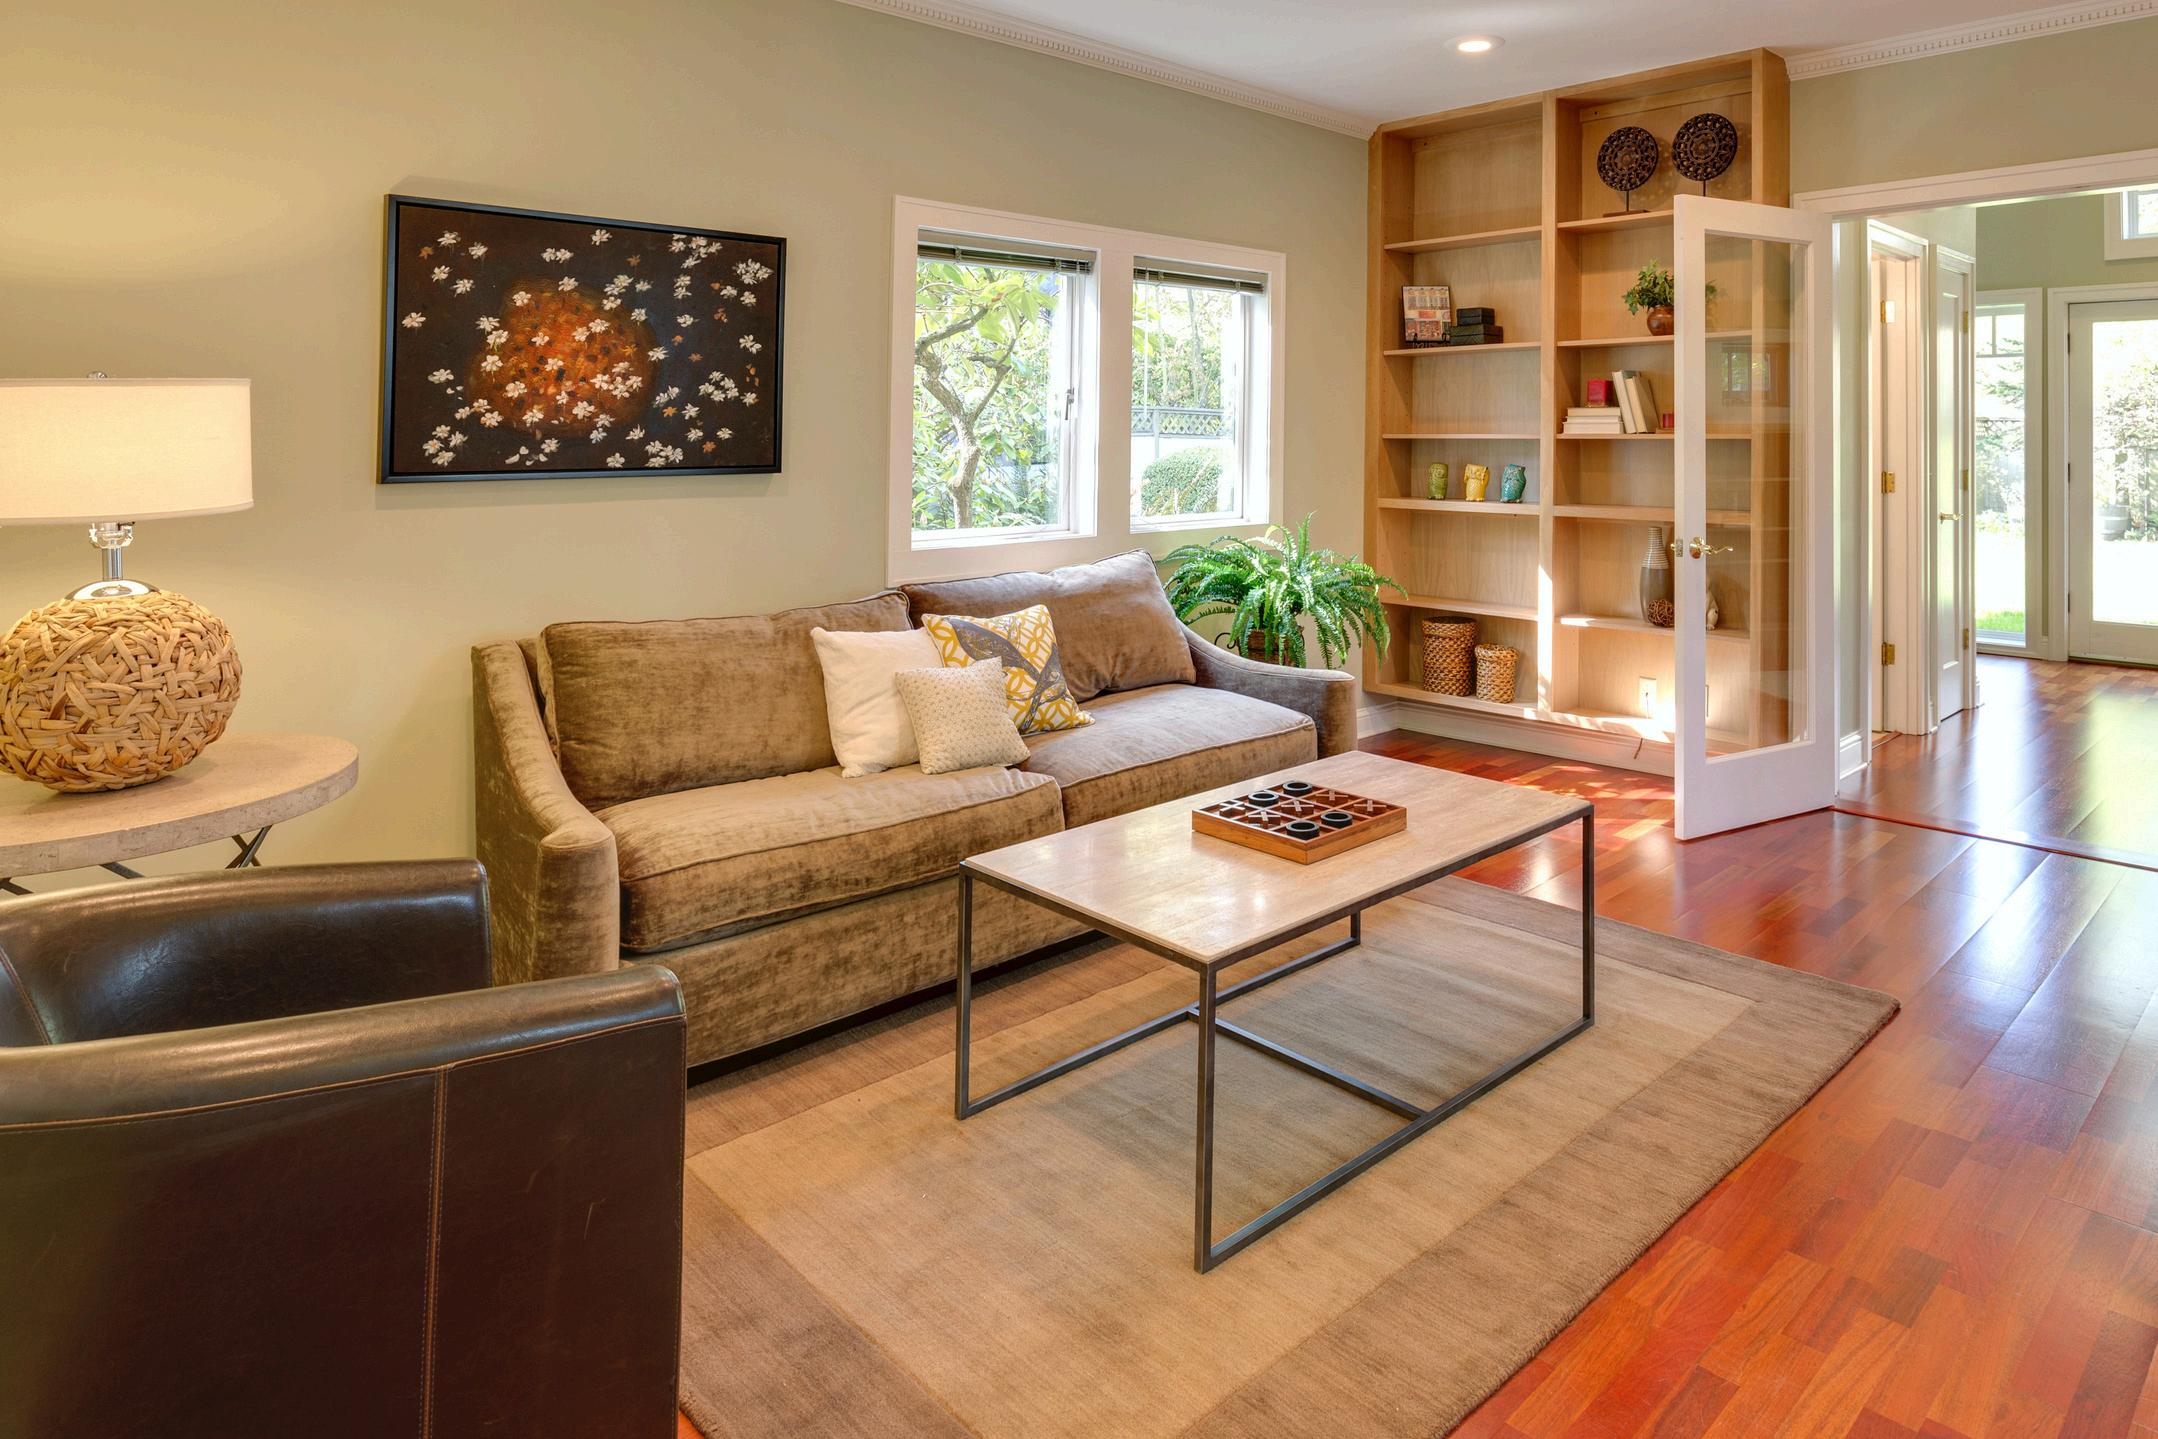
GoalsandVision
The family envisioned an ADU that would function as an independent living space for family members, enhance their property’s worth, and provide seamless integration with the main home They wanted a space that balanced privacy with connectivity, feeling like a natural extension of their residence
Design and Construction Details
Constructed at 747 square feet, this ADU was designed with modern, high-quality finishes to serve both aesthetic and practical needs. Key features include:
Vaulted Ceilings
Creates a spacious, open atmosphere
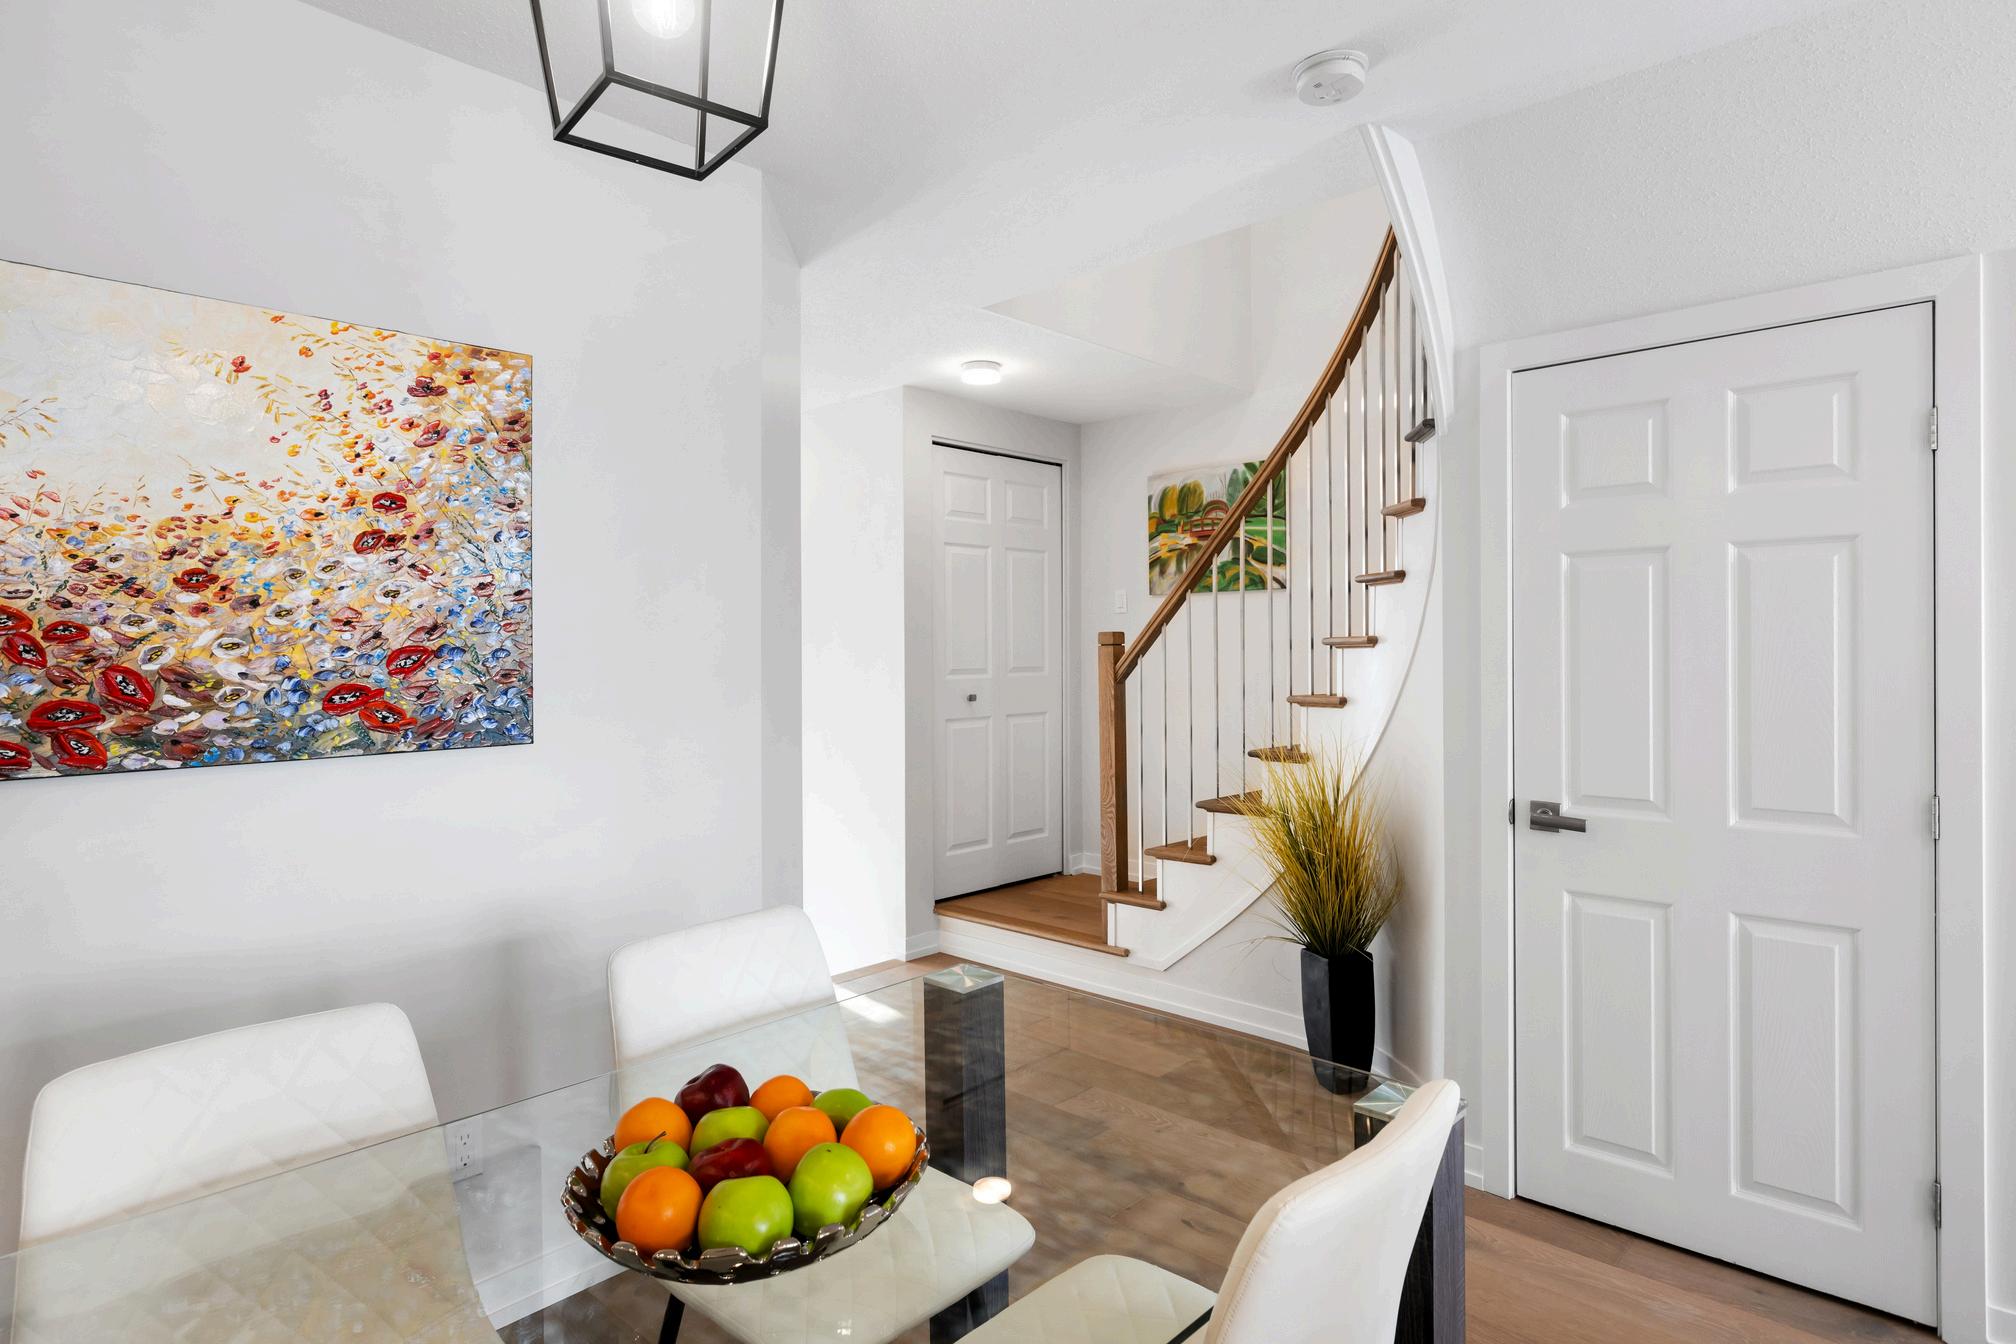
Senior-Friendly Living
Safe, independent space for elderly family members
Fully Equipped Kitchen
Modern amenities for everyday convenience
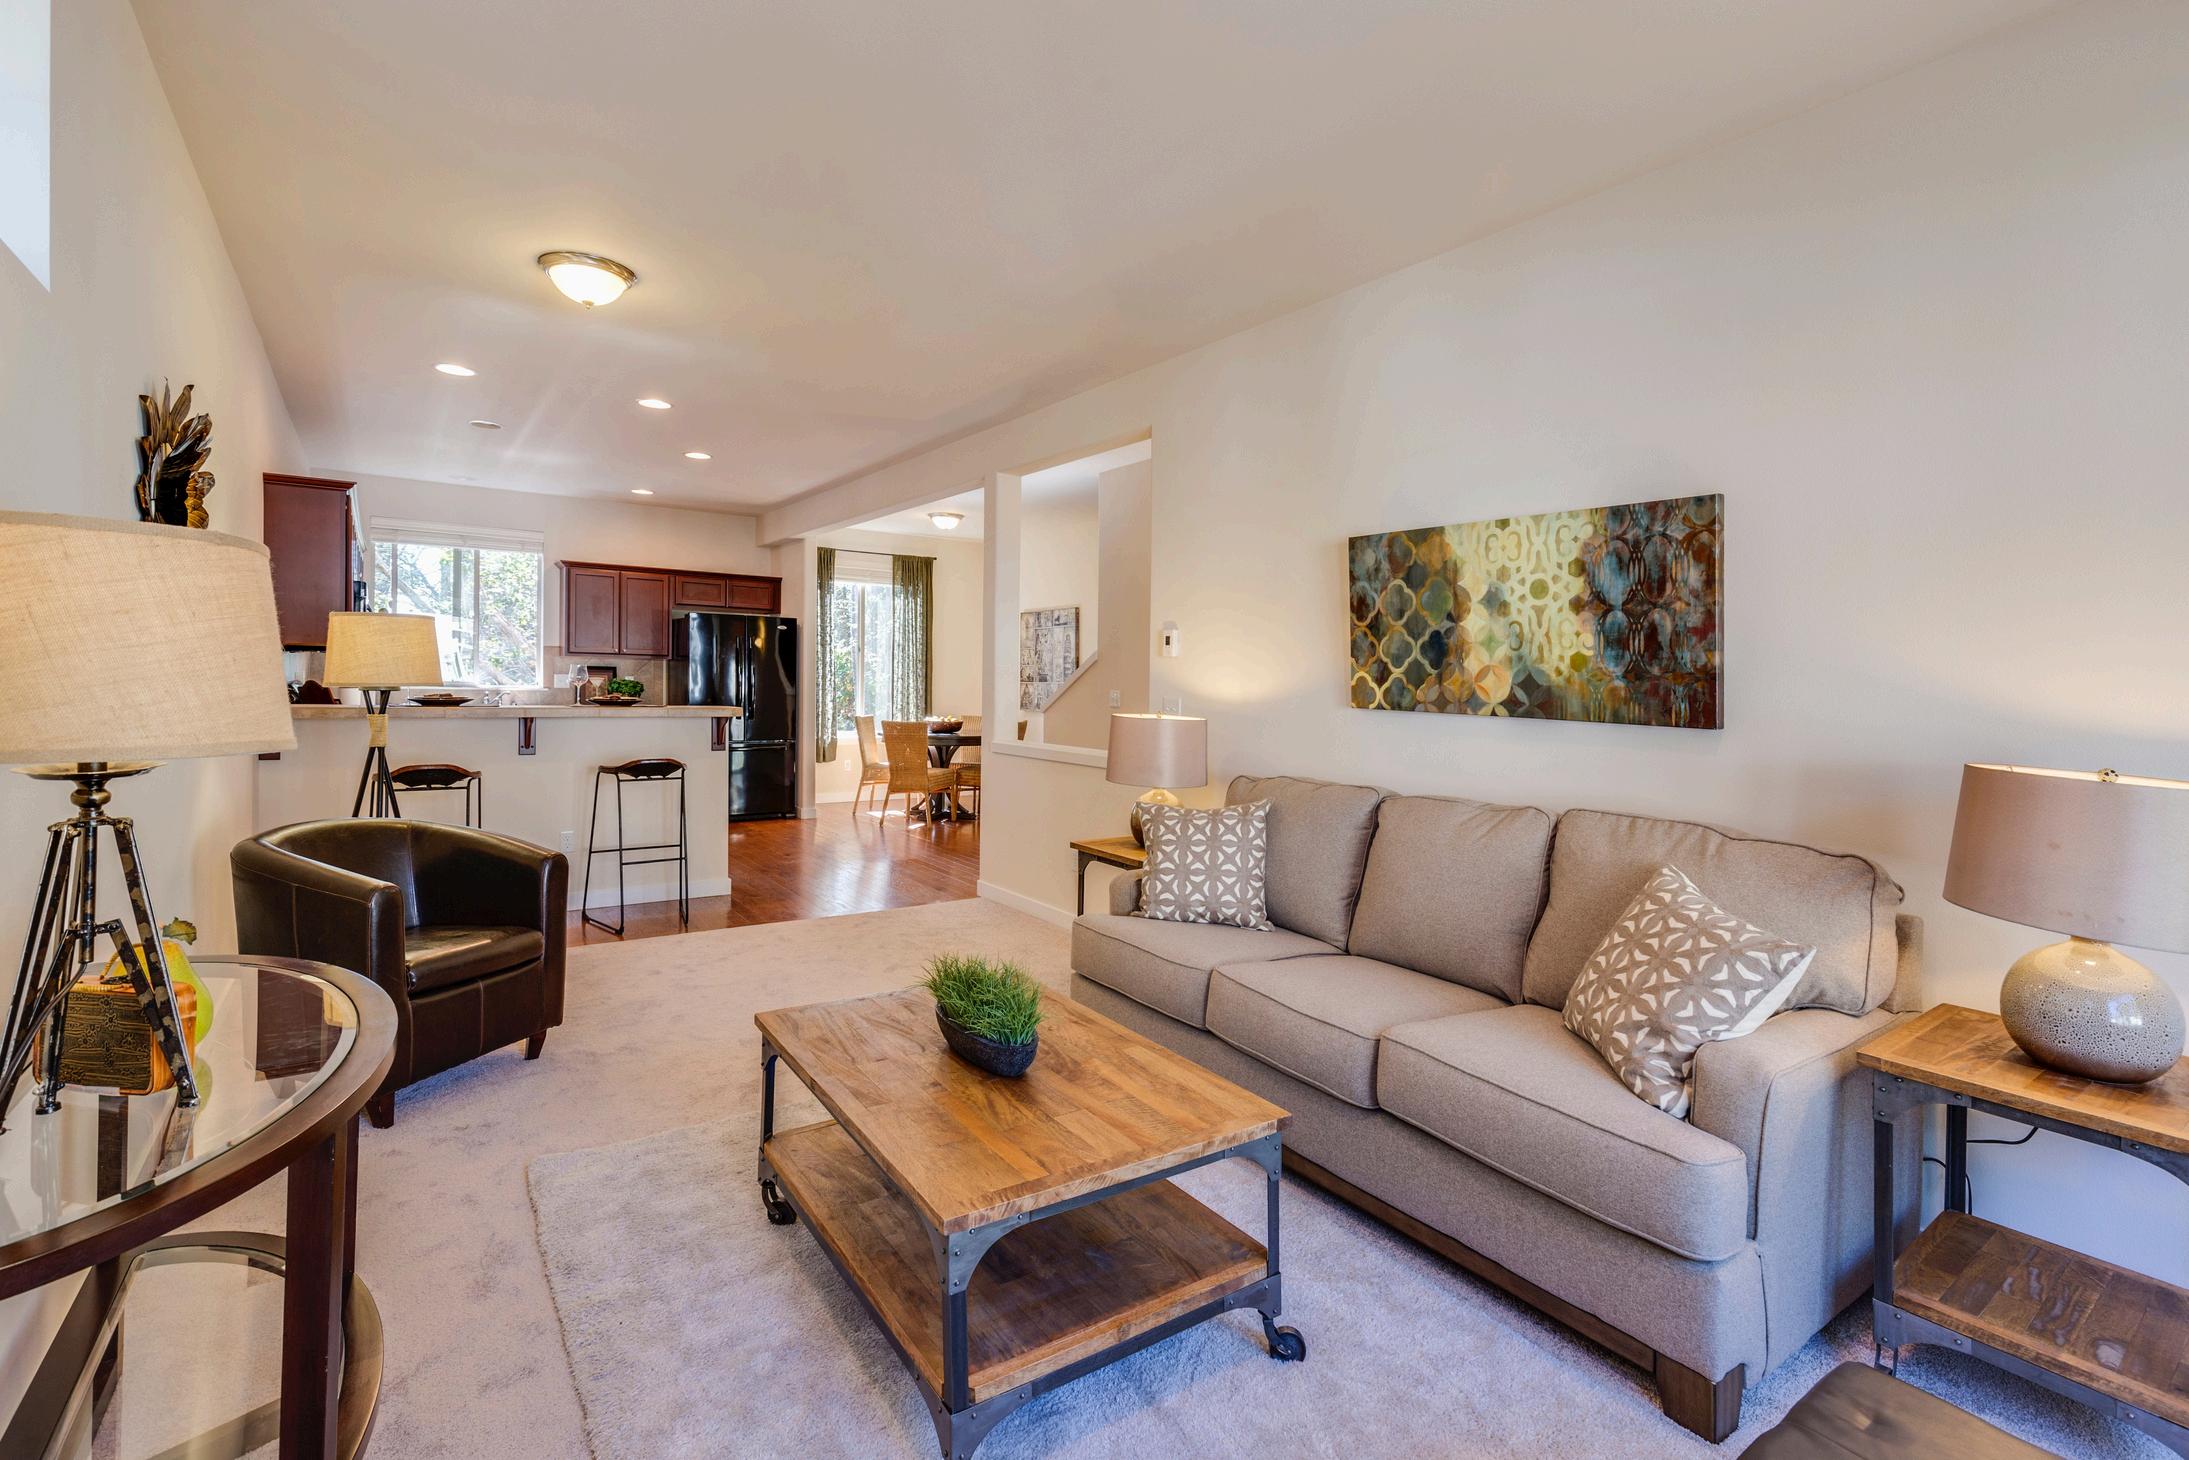
Open Living Area
Multipurpose area for relaxation and entertainment
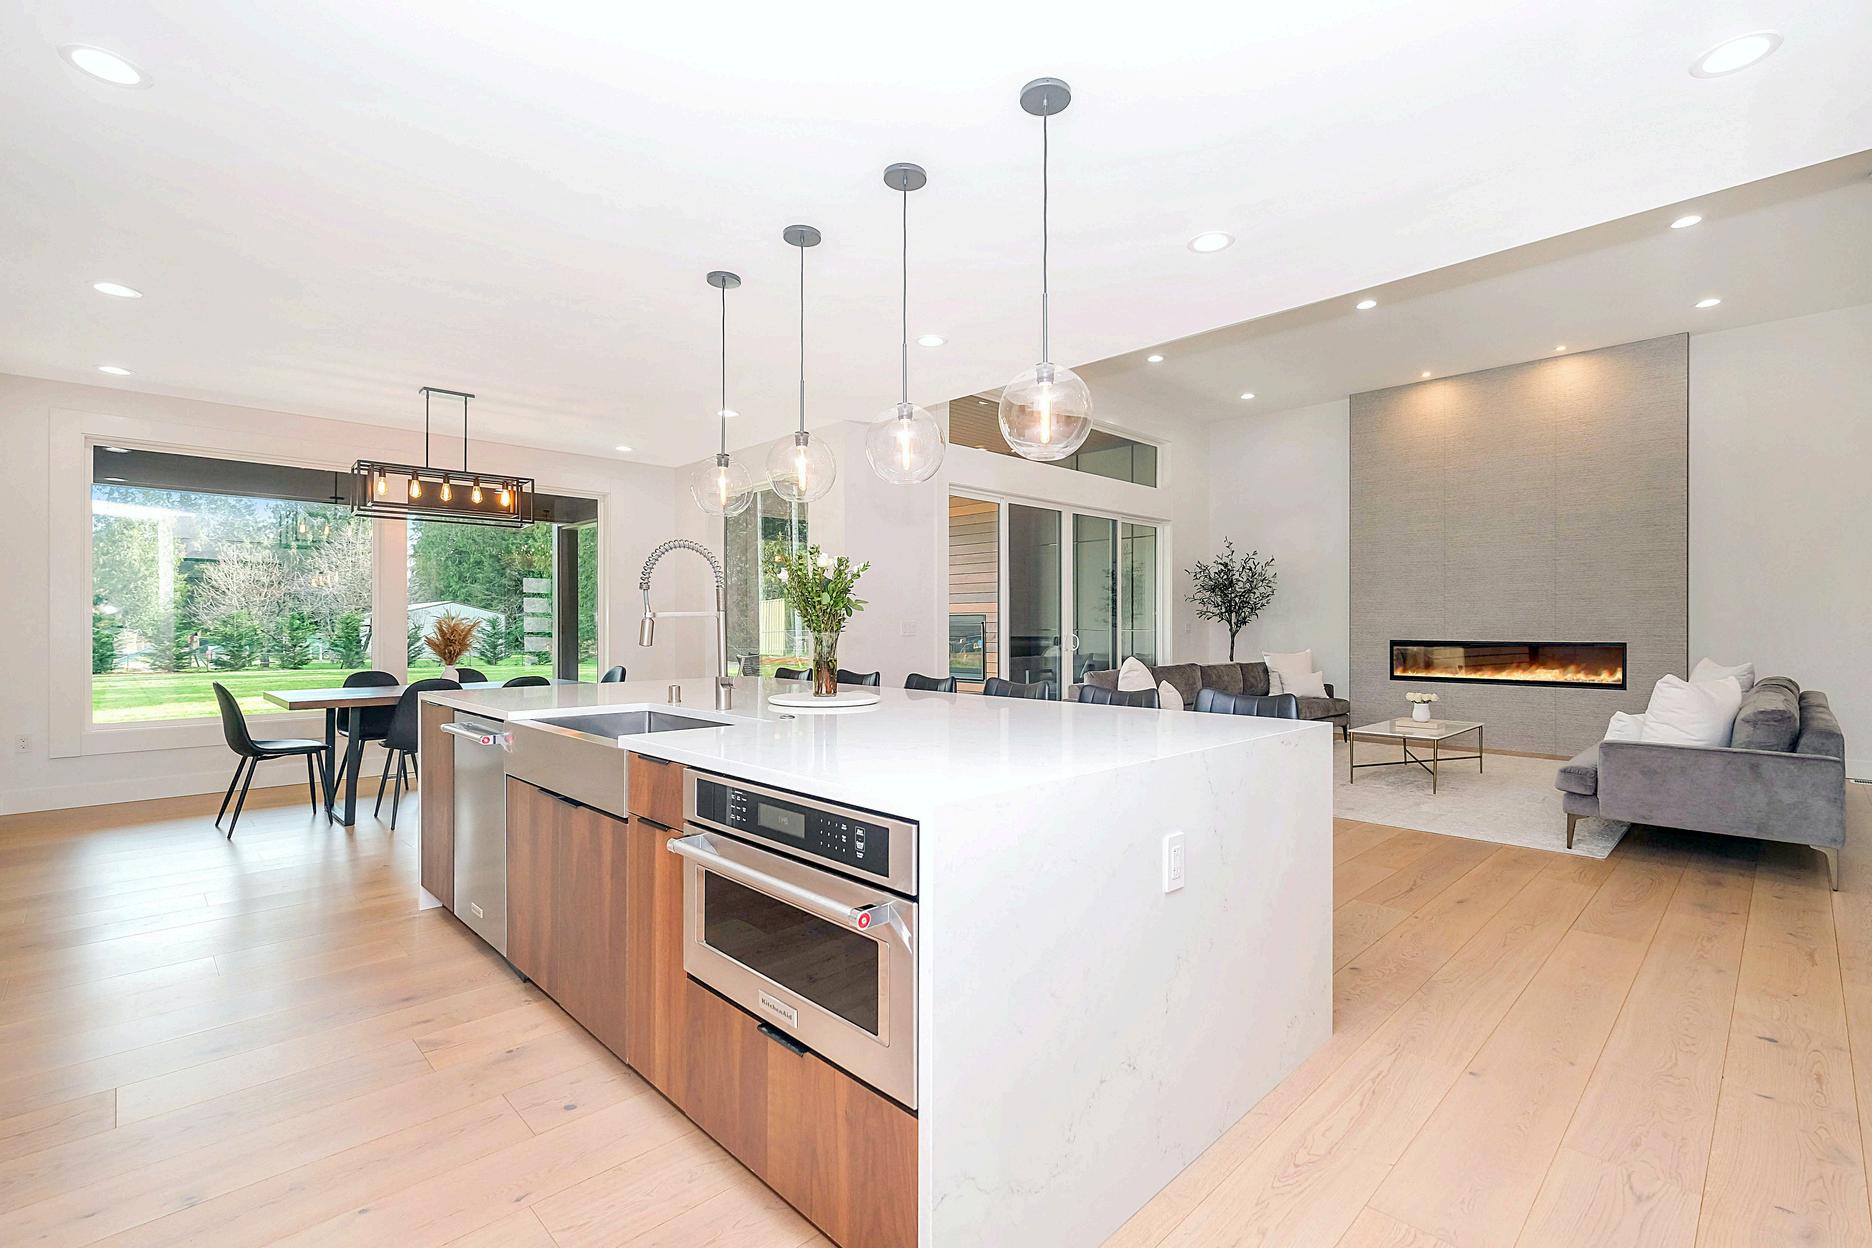
Results and Impact
The completion of the Anenberg-Essert ADU led to several valuable outcomes:
Increased Property Value
The ADU addition significantly boosted property value
Flexible Living Space
A versatile space for family, guests, or as a rental
Modern Comforts
High-end finishes and amenities enhance both function and style.
Enhanced Family Living
The ADU enriches the AnenbergEssert family’s home with both privacy and connection
VENDOR DIRECTORY
When it comes to home ownership, knowing who you can trust is crucial. That's why we've curated a select list of trusted vendors who are ready to help with your home goals.