Green Impact Report 2023
Our goal is to increase the proportion of our green finance to 25% of our long-term customer financing by 2030. “

Contents
Click
“ “
There is no doubt that affordable social housing production is the spearhead of energy-efficient and environmentally friendly housing production in Finland.

The year 2023 was the first full year under our updated Green Bond Framework. We succeeded in improving the efficiency of our review process and the transparency of our criteria, which also reflected in our record-breaking results for the year.

Rami Erkkilä, Senior Specialist, sustainable finance (p. 5)
Noronen, Sustainability Manager (p. 28)
Mikko
on the icon in the top left corner of any page to return to this page. Foreword 3 Editorial 5 Regulation is moving past the drawing board 7 MuniFin Green Bond Framework 11 Sustainable finance spearheads our new sustainability agenda 16 Green finance in figures 18 Executive summary 20 Our record-breaking green bond finances the green transition by EUR 1 billion 21 Green finance portfolio 23 The Green Finance Team 27 Reporting principles 29 The impacts of green finance 39 Buildings 41 Transportations 42 Renewable energy 43 Water and waste water management 44 Green projects promote the following UN Sustainable Development Goals 45 Other positive impacts of our projects 47 Projects approved in 2023 48 Green finance projects and impacts 59 External verification 85 2/87 Green Impact Report 2023 Municipality Finance Plc • Green Impact Report 2023
Green bond
Foreword
Green finance promotes the achievement of national and international sustainability goals
We are committed to pursuing a more sustainable society together with our customers. Responsibility and sustainability are integral elements in our work and revised strategy. The biggest impacts of our operations are created indirectly through the financing we grant to our customers, who play a major role in the achievement of Finland’s sustainability goals.
The general aim of our green finance is to improve the sustainability of the projects we finance. We have been offering our customers green finance for sustainable investments since 2016, and we last updated our criteria for green projects in 2022. In 2020, we complemented green finance by launching social finance, which is offered for projects that produce widespread social benefits. We source the funding for our green and social finance products from the international capital markets by issuing green and social bonds. For investors, these products offer a way to finance positive change and reduce their own negative impact. The demand for sustainable investment products has been increasing rapidly in recent years.
Promoting the United Nations Sustainable Development Goals (SDGs) has played an important role in the planning of our green and social finance offering. As a public sector lender, we wish to address the national challenges of sustainable development highlighted in Finland’s Voluntary National Review on the implementation of the 2030 Agenda1 , such as reducing greenhouse gas emissions, inequality and social exclusion.
According to the OECD’s policy paper entitled ‘Well-Being in Finland: Bringing together people, economy and planet2 “Finland is an established international leader in well-being and sustainability, with good outcomes for people, the economy and the planet in a wide range of well-being aspects”. However, the paper also mentions key future challenges that Finland must address to meet the conditions for maintaining a sustainable welfare society. These challenges should be addressed in a comprehensive, balanced and inclusive way.
MuniFin is signatory to the Society’s Commitment to Sustainable Development, entitled ‘The Finland We Want by 2050’, and we are thus committed to promoting national sustainability goals in all our work. The new Finnish government programme’s3 goals include Finland becoming a leader in clean energy, and the Government is committed to meeting emission reduction targets and moving towards carbon neutrality followed by carbon negativity.
https://julkaisut.valtioneuvosto.fi/handle/10024/162268
2 https://www.oecd-ilibrary.org/social-issues-migration-health/well-being-in-finland_ecf06a58-en
3 https://julkaisut.valtioneuvosto.fi/handle/10024/165044
3/87 Green Impact Report 2023 Municipality Finance Plc • Green Impact Report 2023
Foreword
Achievement of the climate targets will be promoted by concrete measures and effective climate policy at the national and EU levels and with respect to international agreements. The European Green Deal4 aims to make Europe a climate-neutral continent by 2050. The European Union’s action plan on financing sustainable growth plays a key role in the achievement of these goals.
MuniFin’s green and social finance can be granted to investments that produce widespread environmental or social benefits. The socially significant investments of the Finnish municipal sector and affordable social housing organisations play a key role in advancing solutions designed to promote the achievement of the SDGs, the Finnish welfare state and the Climate Act. According to our estimate, the public sector’s share of all of the national economy’s fixed capital investments measured by a five- or ten-year average totals about 20%. This estimate is based on Statistics Finland’s quarterly national accounts5. The Finnish Government’s publication ‘Working group on financing the green transition: Final report6 states that to achieve Finland’s climate objectives, investments of up to EUR 240 billion will be needed between 2020 and 2050, corresponding to EUR 8 billion a year. Electricity and heat
production would account for an estimated 59%, reducing emissions from buildings for 19%, cutting transport emissions for 10% and reducing process emissions from industry for 10% of the additional investments.
In terms of climate goals, Finnish municipalities are doing pioneering work: 96 municipalities have already joined the Carbon Neutral Municipalities (Hinku) network7 and are thus committed to striving for 80% reductions in their greenhouse gas emissions by 2030. These municipalities are home to more than 2.35 million people, so this work touches the lives of over 40% of Finns. Another important cooperation body is the Finnish Sustainable Communities (Fisu) network8 of Finnish municipalities committed to working towards becoming carbon neutral and waste-free and curbing overconsumption by 2050.
The aim of our green and social finance is to create significant benefits for the environment and society. We want to support our customers’ positive development and make sustainable choices even more accessible. Through our green and social finance, we aim to manage our impact and the ESG risks material to us in accordance with our sustainability agenda. In this report, we summarise the impact and calculation principles of our green finance projects. The impact of our social finance is described in a separate report.
4 https://commission.europa.eu/strategy-and-policy/priorities-2019-2024/european-green-deal_en
5 https://pxdata.stat.fi/PxWeb/pxweb/en/StatFin/StatFin__ntp/statfin_ntp_pxt_132h.px/
6 https://julkaisut.valtioneuvosto.fi/bitstream/handle/10024/164654/VN_2023_5.pdf
7 https://hiilineutraalisuomi.fi/en-US/Hinku/Hinku_municipalities
8 https://fisunetwork.fi/en/
4/87 Green Impact Report 2023 Municipality Finance Plc • Green Impact Report 2023 Foreword
The ambitious will reap the financial rewards
In 2023, the demand for our green finance grew substantially. Sustainable solutions are driven not only by environmental goals, but increasingly also by financial factors.
The demand for our green finance reached a record high in 2023. We granted green finance to about 170 projects, almost 100 of which were by our housing sector customers.
It has been a real pleasure to witness our housing sector customers grow more and more ambitious. The residential buildings that they construct increasingly achieve energy class A, and they also demand energy-efficient solutions and comprehensively sustainable construction practices from their partners. Our housing sector customers experiment daringly with their material, energy and recycling solutions: they have, for example, built wooden apartment buildings, received Nordic ecolabels for their projects, compared timber and concrete in construction and deployed extensive solar energy solutions. And they have done all this cost-effectively, with careful consideration for the environmental impact of the building’s entire life cycle. There is no doubt that affordable social housing production is the spearhead of energy-efficient and environmentally friendly housing production in Finland.
Our municipal sector customers are also increasingly interested in green finance. They are considering environmental matters throughout the entire process, starting from land use planning and plot requirements. These are things our Green Bond Framework also calls for.
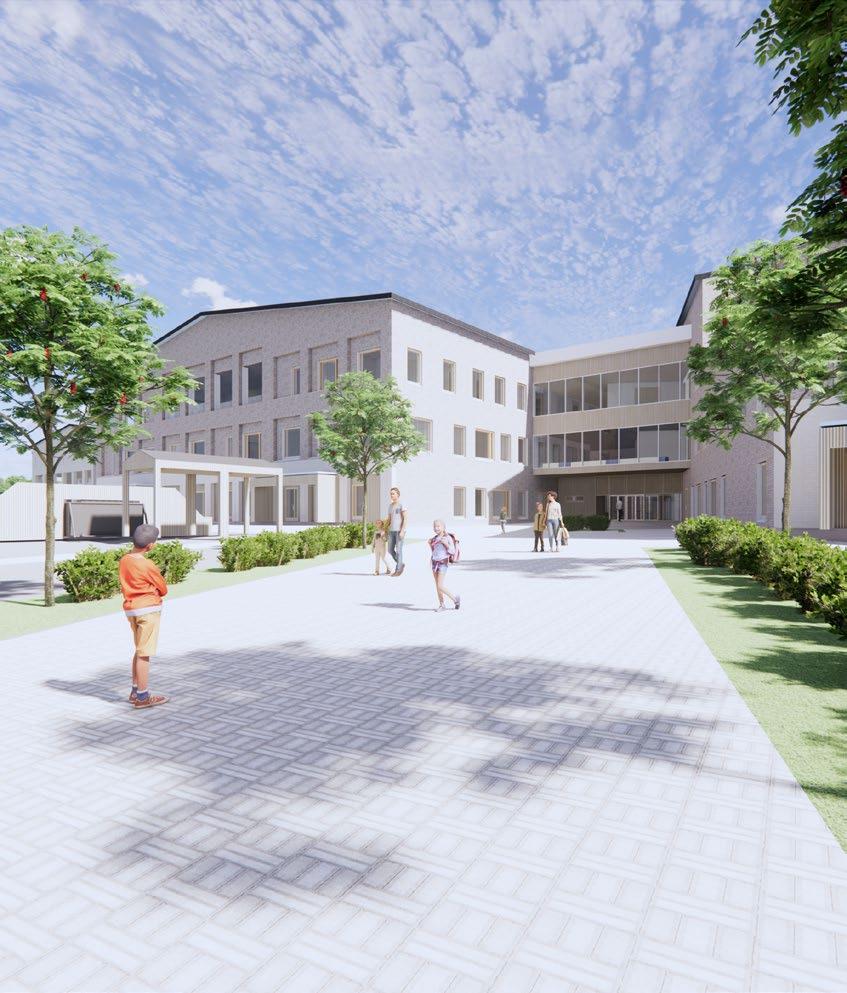
In 2023, we awarded the Green Pioneer of the Year for the second time. The winner was the City of Kokkola, whose team had documented the sustainability benefits of the Piispanmäki multipurpose building with great merit, making project assessment easy for us. The project is also exemplary because the City has changed how its organisation works and how it collaborates with its partners. These are often the prerequisites for making lasting change.
Our customers play a key role in the achievement of Finland’s climate targets. In our operations, the biggest impacts are created indirectly through our business operations, i.e. the financing we grant to our customers. We published our first sustainability agenda in October, sharing our goal of increasing the proportion of our green finance to 25% of our long-term customer financing by 2030. For the first time ever, we have also set an emission reduction goal for our financed buildings.
As we have set stricter criteria for our green finance, we have also wanted to provide stronger incentives for it: in the autumn, we raised the maximum margin discount by three basis points. The higher discount benefits especially the most ambitious projects.
The importance of reporting and disclosing the impact of investments is growing steadily, with stricter legislation also steering efforts in this direction. Pioneers set the course for others: today’s best performance is tomorrow’s baseline. As the bar rises higher, organisations across the board become increasingly prepared to face future climate challenges.
The ambitious will not only take the credit, but also reap the financial rewards.
Rami Erkkilä Senior Specialist, sustainable finance
Rami Erkkilä is responsible for green and social finance products at MuniFin

5/87 Green Impact Report 2023 Municipality Finance Plc • Green Impact Report 2023 Editorial
Case
The City of Kokkola is the 2023 Green Pioneer of the Year
MuniFin’s Green Pioneer of the Year competition celebrates projects that exemplify an outstanding consideration of climate and environmental factors. In 2023, this award was given to the City of Kokkola and its Piispanmäki multipurpose building, whose investment in self-sufficient and renewable energy is a great example of ambitious improvements in energy efficiency.
The City’s strategy emphasises sustainability, childfriendliness and inclusion and is implemented with the support of the entire city organisation. ”
Set to open in 2025, the multipurpose building will accommodate more than a thousand children, pupils and employees. It will feature a hybrid heating solution combining local geothermal heat with 80% carbon-neutral district heating. Additionally, the building’s modern glass surfaces will block solar heat and negate the need for cooling in the summer.
The City’s strategy emphasises sustainability, child-friendliness and inclusion and is implemented with the support of the entire city organisation. The project brings together employees, early childhood education, basic education and the natural surroundings, enhancing community cohesion. To make the multipurpose building easily accessible through low-carbon means, the surrounding pedestrian and bicycle routes and bus lines were improved.
bond Green 6/87 Green Impact Report 2023 Municipality
• Green Impact Report 2023
Photo: City of Kokkola
Finance Plc
Case: The City of Kokkola is the 2023 Green Pioneer of the Year
Regulation is moving past the drawing board
Regulation is moving past the drawing board
MuniFin’s history of green finance dates back to 2016, when we issued our inaugural green bond. Since then, we have been bridging the gap between international capital markets and the sustainable investments of Finnish municipalities and affordable social housing organisations.
The global proportion of sustainable finance has increased many times over in recent years. Although the global COVID-19 pandemic and the breakout of war in Europe have suppressed the markets in general, sustainable finance has stayed on a strong growth track. Our green finance portfolio has also shown significant growth, increasing by 168% since 2020. In 2023, strong demand rendered possible our largest green bond issuance to date.
The rapid development of green finance has been largely driven by pioneering organisations under market conditions. While the overall direction is promising, there is still room for improvement globally. In the COP28 UN Climate Change Conference held in 2023, one of the four key themes was fixing climate finance.
At the EU level, financial flows are directed even more strongly towards sustainable targets, and companies are encouraged to consider climate and environmental risks in the short, medium and long term. Voluntary frameworks such as the Green Bond Principles of the International Capital Markets Association (ICMA) and the Global Reporting Initiative (GRI) standards are being accompanied by binding regulation to accelerate the transition and establish common rules and practices.
In the EU, the European Green Deal and the closely related Action Plan on Financing Sustainable Growth set the course for market participants. The EU Taxonomy for Sustainable Activities, the new EU Green Bond Standard approved in 2023, the Sustainable Finance Disclosures Regulation (SFDR) and the Corporate Sustainability Reporting Directive (CSRD) are relevant to all financial sector entities. The CSRD requires companies to report on their sustainability performance against the EU Taxonomy, whereas the SFDR requires most financial market participants to disclose the taxonomy eligibility and taxonomy alignment of their products.
Reporting requirements are increasing steeply, escalating the need for investors, financiers, real economy entities and other stakeholders to exchange information. Regulation aims to ensure that information is passed effectively between market participants and that the financial system is prepared for the risks arising from climate change. This gives all market participants an opportunity to make informed decisions.
In Finland, too, legislation aims to accelerate and harmonise the concrete work that is already underway. For example, the new Building Act will enter into force on 1 January 2025, incorporating measures to combat climate change comprehensively into the building legislation. The act will also smoothen construction processes, boost a circular economy and digitalisation and improve the quality of building. Establishing common calculation, documentation and reporting methods is imperative in the promotion of a smooth and fair green transition.
7/87 Green Impact Report 2023 Municipality Finance Plc • Green Impact Report 2023
In the green finance market, the focus has traditionally been on solutions that help mitigate climate change. This focus is also reflected in the project type breakdown of our green finance portfolio. Now, however, the market is shifting towards a broader consideration of climate and environmental risks, with climate change adaptation, biodiversity and lowcarbon solutions being the next big trends. Regulation is also increasingly placing emphasis on social responsibility and human rights throughout the value chain.
Green finance is an integral part of our new sustainability agenda. We believe that by increasing the amount of our green finance, we can effectively increase the overall sustainability of our operations. Because sustainability aspects are considered already in the project design stage, green investments may also be less prone to transition risks, such as impairment losses or additional costs introduced by new regulation. Each sustainable investment plays its part in reducing vulnerability to the physical risks of climate change.
These themes are not new, but regulation is now aimed at harmonising risk assessments and increasing risk reporting. We understand how important transparent reporting is for our stakeholders. In green finance, the importance of impact reporting is particularly great. We have chosen to invest in high-quality impact reporting, and our efforts have been recognised by investors.
We are also involved in developing Nordic recommendations on green bonds impact reporting as part of the Nordic issuer group, which has jointly published the Position Paper on Green Bonds Impact Reporting. In 2023, the group convened to update the recommendations, which were last updated in 2020. The results of this work will be published in the spring of 2024. The update will not have a significant effect on our reporting, but we will describe its effects in a supplement to this report after the recommendations have been published. The section Reporting principles describes how we meet the 2020 reporting recommendations.
EU Taxonomy is harmonising activities and reporting one step at a time
We continue to closely follow the progress of the European Commission’s Action Plan on Financing Sustainable Growth, especially the EU Taxonomy for Sustainable Activities and the related EU Green Bond Standard (EUGBS) approved in 2023. The goal of the EU Taxonomy is to reorient capital flows towards sustainable investments, thus promoting sustainable economic growth and environmentally friendly developments. The aim of the EU Green Bond Standard is to increase the volume of taxonomy-aligned bond issuances and investments.
In June 2023, the European Commission adopted taxonomy criteria for economic activities making a substantial contribution to one or more of the remaining four environmental objectives, namely: sustainable use and protection of water and marine resources, transition to a circular economy, pollution prevention and control and protection and restoration of biodiversity and ecosystems.
8/87 Green Impact Report 2023 Municipality Finance Plc • Green Impact Report 2023
Regulation is moving past the drawing board
Regulation is moving past the drawing board
The Commission has also adopted amendments to the previously published criteria for the environmental objectives of climate change mitigation and adaptation. (European Commission 2023.1)
There is a need to harmonise the definitions of environmentally sustainable activities and increase sustainable investments. Compliance with the EU Taxonomy is gradually being incorporated into reporting practices, but there is still a way to go before markets are aligned with the taxonomy and can disclose their alignment in a harmonious manner. So far, there is no sign of the EUGBS replacing voluntary practices based on market standards; instead, they advance the green transition side by side.
Large non-financial listed companies were the first to fall subject to the reporting requirements of the Taxonomy Regulation. In October 2023, the European Securities and
Markets Authority (ESMA) issued a report2 on information reporting by European companies that complies with Article 8 of the Taxonomy Regulation. The focus of the study was to evaluate the quality of taxonomy data and assess how well companies have complied with the requirements of the new regulations. Due to the limited size of the sample, the outcomes of the evaluation should be considered as indicative only. The report’s key finding was that so far, the reporting volume of environmentally sustainable, taxonomy-aligned activities is low. The average figures for environmentally sustainable, taxonomy-eligible activities for the different Key Performance Indicator (KPIs) were 17% (turnover), 28% (CapEx) and 18% (OpEx). The corresponding figures for Finnish companies were 11% (turnover), 12% (CapEx) and 12% (OpEx). More information on the report is available in the market newsletter3 of the Finnish Financial Supervisory Authority, which took part in ESMA’s study.
This work requires bold pioneers. ”
Market practices and national legislation related to the EU Taxonomy are still evolving, but the availability of information, particularly on older projects, poses a market-wide challenge, making the verification of taxonomy alignment more difficult. Especially practices regarding the ‘do no significant harm’ (DNSH) principle and the minimum social safeguards (MSS) must be developed further. Reconciling technical screening criteria (TSC) with national legislation also requires more work. We are, however, now moving from the drawing board into practice, allowing for the creation and adoption of more detailed analyses, processes and interpretations. This work requires bold pioneers.
https://finance.ec.europa.eu/regulation-and-supervision/financial-services-legislation/implementing-and-delegated-acts/taxonomy-regulation_en
2 https://www.esma.europa.eu/sites/default/files/2023-10/ESMA32-992851010-1098_-_Summary_of_findings_Results_of_a_fact-finding_exercise_on_corporate_reporting_practices_under_the_Taxonomy_Regulation.pdf
3 https://www.finanssivalvonta.fi/en/publications-and-press-releases/market-newsletter/market-newsletter-32023/listed-companies-carry-out-reporting-on-environmentally-sustainable-activities-for-the-first-time/
9/87 Green Impact Report 2023 Municipality Finance Plc • Green Impact Report 2023
EU Taxonomy reporting does not currently directly obligate municipalities, but the effects of these disclosures already affect their activities indirectly. Municipalities are key players in promoting sustainable development, and the EU Taxonomy can offer them the necessary framework to achieve their own goals. A significant benefit of the EU Taxonomy is that it takes various environmental factors into broad consideration and offers a common set of criteria to be used, for example, in the competitive tendering process in public procurement.
Pioneering municipalities have already integrated the EU Taxonomy into their climate budget, for example. In future, the verification of taxonomy alignment requires that project documentation is developed further and that taxonomy criteria are considered even more explicitly in project planning and tendering. Especially in municipalities, taxonomy
alignment consideration opens opportunities for acquiring more affordable green finance or the EU’s and Ministry of the Environment’s financing. The EU Taxonomy has been linked to several EU funding programmes, such as the European Green Deal Investment Plan (EGDIP), the InvestEU programme and other relevant EU funds, which are also open to municipalities.
In 2023, we were involved in the work of Green Building Council Finland (FIGBC) seeking to solve taxonomy challenges in the building and construction sector. We are also involved in a project carried out by Rakennusteollisuuden Koulutuskeskus RATEKO, an organisation providing training in the construction industry, seeking clear implementation measures for the criteria under the EU Taxonomy and establishing a national information pool. The project is a
collaboration with the Confederation of Finnish Construction Industries RT (CFCI) and its Building Construction, Construction Product Industry, HPAC Contractors and Infrastructure branches.
10/87 Green Impact Report 2023 Municipality Finance Plc • Green Impact Report 2023
Regulation is moving past the drawing board
MuniFin Green Bond Framework
MuniFin’s Green Bond Framework1 was updated in 2022. The most notable changes concerned the introduction of more transparent and ambitious project eligibility criteria and a more streamlined project evaluation process. The purpose of these changes was to help both investors and our customers better understand the types of projects that are eligible for our green finance.
Our Green Bond Framework was designed in accordance with the Green Bond Principles of the International Capital Market Association. To guide our customers and green investments increasingly towards common practices, we have also used the EU Taxonomy for Sustainable Activities and the EU Green Bond Standard proposal available at the time of the update as guiding tools in defining our eligibility criteria and overall framework structure.
While we aim to harmonise the criteria of our framework with the EU Taxonomy where applicable and have included aspects of it in the evaluation of new buildings, our framework does not yet fully align with the Taxonomy. We closely follow when the readiness of our customers and the development of shared practices and national legislation reach a point where we will be able to assess a project’s taxonomy alignment in the project evaluation phase. Notable steps in this direction are the climate and material declarations on buildings
included in Finland’s new Building Act (751/2023) adopted in 2023. Through our pricing, we incentivise our customers to already adopt these measures so that more projects would meet the Taxonomy criteria. We also encourage our customers to include documentation under the Taxonomy in their project plans.
Cicero Shades of Green has carried out a second party opinion2 on our Green Bond Framework, including an assessment of how well our project categories align with the EU Taxonomy’s technical screening criteria. The results are summarised in the table on page 13 and can be used to assess how well projects in our portfolio align with the technical screening criteria for climate change mitigation. As a whole, Cicero Shades of Green gave our Green Bond Framework the second-best rating of Medium Green, with an excellent rating in the governance assessment.
We
also encourage our customers to include documentation under the Taxonomy in their project plans.
https://www.kuntarahoitus.fi/app/uploads/sites/2/2022/12/MuniFin-Green-Bond-framework.pdf
2 https://www.kuntarahoitus.fi/app/uploads/sites/2/2022/09/Second-Opinion-CICERO-GREEN.-final.-Munifin.-15.08.2022.pdf
”
11/87 Green Impact Report 2023 Municipality Finance Plc • Green Impact Report 2023
MuniFin Green Bond Framework
MuniFin’s green finance has many positive effects on society. The green projects are concrete proof of how we can actively reduce human impact on nature and the climate. With energyefficient construction becoming mainstream, we no longer have to make compromises between things like affordable and energy-efficient housing. We must adapt to changes caused by global warming, but sustainable lifestyle is becoming accessible to an increasing number of people. The more innovative green projects also address natural capital and risks related to climate change more broadly. This is the direction we encourage our customers to choose more and more often, and we take such broader aspects of sustainability into consideration in our project evaluation. We will introduce them in our reporting through short project descriptions.

MuniFin’s Green Bond Framework renewed in 2022 has four project categories:
Water
water
Renewable
Ratings by Cicero Shades of Green for MuniFin’s Green Bond Framework Buildings Transportation
and waste
management
energy
12/87 Green Impact Report 2023 Municipality Finance Plc • Green Impact Report 2023
MuniFin Green Bond Framework
Alignment of the Green Bond Framework criteria with the EU Green Taxonomy's technical screening criteria (objective 1. Climate change mitigation)
assess
Review conducted as part of framework second party opinion. Available at: https://www.kuntarahoitus.fi/app/uploads/sites/2/2022/09/Second-Opinion-CICERO-GREEN.-final.-Munifin.-15.08.2022.pdf
Buildings Transportation Renewable energy Water and waste water management Likely aligned 7.2 7.3 7.5 7.6 Renovation of existing buildings Installation, maintenance, and repair of energy efficiency equipment Installation, maintenance, and repair of instruments and devices for measuring, regulation and controlling energy performance of buildings Installation, maintenance, and repair of renewable energy technologies 6.1 6.3 6.5 6.7 6.8 6.10 6.11 6.14 6.15 Passenger interurban rail transport Urban and suburban transport, road passenger transport Transport by motorbikes, passenger cars and light commercial vehicles Inland passenger water transport Inland freight water transport Sea and coastal freight water transport, vessels for port operations and auxiliary activities Sea and coastal passenger water transport Infrastructure for rail transport Infrastructure enabling low carbon road transport and public transport 4.1 4.3 4.6 4.22 4.25 Electricity generation using solar photovoltaic technology Electricity generation from wind power Electricity generation from geothermal energy Production of heat/cool from geothermal energy Production of heat/cool using waste heat Likely partially aligned 7.1 7.7 Construction of new buildings Acquisition and ownership of buildings 6.13 Infrastructure for personal mobility, cycle logistics 4.24 Production of heat/cool from bioenergy
treatment
Not possible to
alignment 5.1 Construction, extension and operation of water collection, treatment and supply systems 5.2 Renewal of water collection, treatment and supply systems 5.3 Construction, extension and operation of waste water collection and
5.4 Renewal of waste water collection and treatment
13/87 Green Impact Report 2023 Municipality Finance Plc
Green Impact Report 2023 MuniFin Green Bond Framework
•
Successful first full year of operation under the updated Green Bond Framework
Our green finance was successful in 2023 even though the economic situation was challenging for all market participants throughout the year. Recovery from the COVID-19 pandemic was coupled with high inflation and rising interest rates, and the prevailing war in Ukraine made European markets unpredictable. In Finland, rising costs and interest rates had a particularly strong impact on the real estate and construction sectors and, by extension, the majority of our green finance customers. Towards the end of the year, however, inflation abated in Europe and interest rate hikes started to level off. The prolonged period of instability has further highlighted the importance of a stable social foundation and the implementation of the green transition, especially in Europe’s pursuit of energy self-sufficiency.
The year 2023 was also the first full year of operation under our updated Green Bond Framework and our internal Green Finance Team. The framework’s 2022 update proved successful, as evidenced by the sustained strong demand for our green finance. Despite the challenging markets, our customers submitted a record number of green projects for evaluation. The continued growth in the buildings category of our portfolio, despite difficulties in the real estate and construction sectors, was a particularly encouraging development.
Our green finance portfolio continued to grow by EUR 1.544 billion from EUR 3.251 billion at the end of 2022 to EUR 4.795 billion at the end of 2023. Green projects continued to be dominated by energy-efficient construction. In sustainable buildings, active companies included Helsingin kaupungin asunnot (9 projects), Niiralan Kulma Oy (4 projects) and A-Kruunu Oy (3 projects). In the transportation category, a major new project was the Jokeri Light Rail, which replaced the busiest diesel-powered trunk bus route in the Helsinki Metropolitan Area with electric rail transport, representing a significant stride towards sustainable urban mobility.
The growth of our green finance portfolio also facilitated the issuance of our first green bond under our updated Green Bond Framework. This fixed-rate green bond of EUR 1 billion was considerably larger than any of our previous green bonds and also the largest EUR green bond of all time in the Nordic SSA market. The issuance was awarded with CMD Portal’s TopDeal recognition in April 2023. In December 2023, we also won the CMD Portal’s Best SSA ESG Bond Issuer award for 2024. More information on these awards is available on page 22.
14/87 Green Impact Report 2023 Municipality Finance Plc • Green Impact Report 2023 MuniFin Green Bond Framework
Financial institutions expected to pay closer attention to climate and environmental risk management
Financial institutions are improving their management of climate and environmental risks, largely spurred on by regulatory pressure. At MuniFin, we consider climate and environmental risks as a natural part of our risk management and constantly hone our ability to detect such risks. Our business model also naturally keeps our climate and risk position low. In 2023, we conducted a materiality analysis to identify key climate and environmental risks in the short, medium and long term.
Our customers, and MuniFin as their lender, are nevertheless exposed to both the physical and transition risks of climate change, which may materialise especially in the medium and long term. Although our customers’ climate and environmental risks are not expected to
have a strong impact on MuniFin, we continue to make these risks an even more integral part of our risk management processes. We also plan to further enhance our cooperation and engagement with our customers in this regard because of their key role in managing these risks. We already routinely assess all our customers in terms of their climate and environmental risks, and our investment process follows our Sustainable Investment Framework. The risk assessment process is the same for all our finance, including our green finance.
More information on our climate and environmental risks and their management is available in our separate Pillar III Disclosure Report. We have also published a document on the ESG principles of our lending, which will be updated as needed.
15/87 Green Impact Report 2023 Municipality Finance Plc • Green Impact Report 2023 MuniFin Green Bond Framework
Sustainable finance spearheads our new sustainability agenda
Our new sustainability agenda sets the framework and goals for our impactful long-term sustainability work. Our goal is to increase the proportion of sustainable finance and reduce emissions from financed buildings.
When we revised our strategy in 2023, we also amended our strategy on sustainability. We drew up a sustainability agenda, which clarifies our long-term goals and guidelines. When formulating our sustainability agenda’s main themes and the related goals and indicators, we used the results of the materiality analysis of sustainability topics we conducted in the spring of 2023. This analysis involved gathering insights on sustainability factors and on impact and financial materiality from our own experts and our key external and internal stakeholder groups.
Our new sustainability agenda is entitled ‘Enabler of sustainable welfare in society’, and it focuses especially on our business operations and the impact achieved through them. The financial sector plays a pivotal role in advancing both national and international sustainable
development goals, and the municipal sector, wellbeing services counties and statesubsidised housing organisations play a key role in improving Finland’s environmental and climate resilience and in achieving the Paris Agreement goals.
The agenda is built around two main themes (see page 17): foundation of the Finnish welfare society and driver of the green transition. As the themes are closely interlinked, both must be addressed for basic social needs to be met within the limits of the planet’s carrying capacity and for the transition to sustainable economy to be carried out in a way that is fair to everyone.
Our customers impact sustainability through heating energy production, construction and building administration, traffic infrastructure, land use planning and water and waste water management, for example. The decisions, actions and investments of our customers make a great difference to the achievement of Finland’s sustainability goals and the progress of the green transition. Our customers also have the opportunity to take part in setting best market practices.
16/87 Green Impact Report 2023 Municipality Finance Plc • Green Impact Report 2023
Sustainable finance spearheads our new sustainability agenda
In our sustainability agenda, we set a goal of increasing the proportion of green finance to 25% of our long-term customer finance portfolio by 2030. We are making swift progress, as this figure was 14.6% in 2023. Increasing the proportion of green finance will also reduce the amount of our financed greenhouse gas emissions. Moreover, our sustainability agenda includes our first goal of reducing financed emissions – specifically financed emissions from buildings, because buildings account for more than 50% of our customer finance and are also the source of more than 40% of Finland’s greenhouse gas emissions. Energy-efficient construction and renovation therefore carries great potential in the achievement of national emission reduction targets. In 2023, buildings made up 67% of our green project finance.
Economically, climate initiatives hold great significance for municipalities through direct investments, cost savings and long-term multiplier effects. For example, reducing energy dependence on fossil fuels increases economic sustainability while also reducing risks. Increasing the proportion of our green finance and reducing the amount of our financed emissions are essential aspects of MuniFin’s climate and environmental risk management.
Enabler of sustainable welfare in society
Foundation of the Finnish welfare society
Driver of the green transition
Enabling the foundation for a sustainable welfare state
Promoting investments that benefit the climate and environment
Amount of social finance
Amount of green finance
Financed emissions from buildings
17/87 Green Impact Report 2023 Municipality Finance Plc • Green Impact Report 2023
spearheads our new
Sustainable finance
sustainability agenda
Green finance in figures
Green finance in figures
Green portfolio duration
4,795 €
EUR million
14.6 Outstanding amount of green finance
Share of all long-term customer finance
13
Total committed green finance
6,060
EUR million
Number of green projects
411
Annual energy savings (avoided/reduced)
51,736 1
Annual CO₂ emissions avoided/reduced 2
81,366 3
Annual amount of treated waste water in existing plants immediately after project completion
25,894,417
Annual amount of treated waste water with increased capacity in the future
36,048,174
Annual production of renewable energy
107,003
Renewable energy production capacity
54
Figures based on the outstanding amount of green finance on 31 December 2023
1 51,736 MWh: Equals the annual consumption of about 2,970 electrically heated single-family houses (Source: Motiva)
2 Calculated using the emission factor for electricity consumed in Finland (38 g CO₂e/kWh, Fingrid). When calculated using the emission factor recommended by the Nordic Position Paper on Green Bonds Impact Reporting (191 g CO₂e/kWh, 2024 draft), the figure stands at 84,096 tCO₂. The emission factor’s biggest impact is on the buildings category.
3 81,366 tCO₂: Equals the average annual carbon footprint of about 7,900 Finns (Source: Sitra)
m 3 m 3 MWh MWh tCO₂
MW
years
18/87 Green Impact Report 2023 Municipality Finance Plc • Green Impact Report 2023
Green finance in figures
Green finance in figures
Our green finance portfolio is composed entirely of new projects. In accordance with our Green Bond Framework, new projects are ones that have been completed less than 12 months before the Green Finance Team has approved them for our green finance portfolio. Our portfolio does not include refinanced projects, i.e. projects completed more than one year before their approval.
As an exception to our normal assessment and approval process in which each project is approved on a case-by-case basis, the Green Finance Team decided in 2022 that new electric vehicles acquired by our customers do not require approval as individual purchases, but are instead accepted into the portfolio in one go. The approval is based on the change in the number of financed items compared to the previous reporting period.
At the end of 2023, MuniFin’s outstanding amount of green finance stood at EUR 4,795 million, exceeding the outstanding amount of green bonds, which was EUR 3,330 million.
New projects
100%
Outstanding amount of green bonds
3,330
EUR million
Outstanding amount of green finance
4,795
EUR million
Figures as at 31 December 2023
€ €
19/87 Green Impact Report 2023 Municipality Finance Plc • Green Impact Report 2023
Executive summary
Green finance project breakdown
Outstanding amount of green finance
Unwithdrawn credit commitments
EUR 500M ( 10 / 2030 )
EUR 500M ( 9 / 2029 )
EUR 500M ( 5 / 2029 )
AUD 50M ( 10 / 2027 )
EUR 500M ( 9 / 2027 )
GBP 250M ( 12 / 2024 )
USD 500M ( 9 / 2021 )
EUR 1000M ( 9 / 2028 )
6 14 28 363 7% 1% 25% 67% Development of green finance and green bonds Buildings Water and waste water management Renewable energy Transportation 0 1000 2000 3000 4000 5000 6000 2023 2022 2021 2020 2019 2018 2017 2016 MEUR Other impact indicators Annual energy savings (avoided / reduced), MWh 51,736 Annual production of renewable energy, MWh 107,003 Renewable energy production capacity, MW 54 Annual amount of treated waste water in existing plants immediately after project completion, m3 25,894,417 Annual amount of treated waste water with increased capacity in the future, m3 36,048,174 Project category Outstanding amount, EUR million Annual CO₂ emissions avoided/reduced, tCO₂ Impact, tCO₂ per EUR million Buildings 3,213 5,710 2 Transportation 1 ,190 10,862 9 Renewable energy 38 64,794 1 ,705 Water and waste water management 354 - 0 Total 4,795 81,366 1,716 Impact attributable to green bond investors 69.5% Outstanding amount of green bonds divided by outstanding amount of green finance (in EUR) as of 31 Dec 2023. Capped at 100%. Amount ISIN Issue date Maturity date 500m EUR XS2242924491 14 Oct 2020 14 Oct 2030 10.4% 500m EUR XS2023679843 10 July 2019 6 Sept 2029 10.4% 500m EUR XS2480922389 17 May 2022 17 May 2029 10.4% 50m AUD XS1706174015 25 Oct 2017 25 Oct 2027 0,7% 500m EUR XS1692485912 3 Oct 2017 7 Sept 2027 10.4% 250m GBP XS2404205119 2 Nov 2021 16 Dec 2024 6.2% 1000m EUR XS2590268814 22 Feb 2023 25 Sept 2028 20.9% Basic information Green bonds frameworks applied to the green finance portfolio MuniFin Green Bonds Framework August 2022, May 2019, November 2018, August 2017 and February 2016 Reporting period The reporting is based on the green finance portfolio as at 31 Dec 2023 Report publication date 7 March 2024 Reporting frequency Annual Next report planned for March/April 2025 Reporting approach Portfolio-based and project-by-project reporting Reporting framework Nordic Public Sector Issuers: Position Paper on Green Bonds Impact Reporting (February 2020, next
to be
in
of 2024)
version
published
the spring
Executive summary number of projects %/EUR
20/87 Green Impact Report 2023 Municipality Finance Plc • Green Impact Report 2023
Our record-breaking green bond finances the green transition by EUR 1 billion
At the end of 2023, MuniFin had seven outstanding green bonds. We have issued a total of eight green bonds, the first of which was issued in 2016 and matured in 2021.
In February 2023, we issued a fixed-rate green bond of EUR 1 billion maturing in September 2028. This bond was considerably larger than any of our previous green bonds and also the largest EUR green bond of all time in the Nordic SSA market. Nearly 80% of the highquality orderbook was allocated to ESG investors, with 46% going to banks and 31% to asset managers. The allocation was geographically diverse.
Investor
Total amount of outstanding green bonds
3,330 €
Foreign currencies in euros EUR million
Outstanding green bonds
GBP 250m 12/2024
EUR 500m 9/2027
AUD 50m 10/2027
EUR 1000m 9/2028
EUR 500m 5/2029
EUR 500m 9/2029
EUR 500m 10/2030
Nordic countries
Asia-Pacific region
The Americas
Africa and Middle East
The charts describe the investor breakdown by geography of the primaryissuance of outstanding green bonds.
Figures as at 31 December 2023.
breakdown by
8% 3% 2% 21% 66% Europe
geography
21/87 Green Impact Report 2023 Municipality Finance Plc • Green Impact Report 2023
Our record-breaking green bond finances the green transition by EUR 1 billion
Our record-breaking green bond finances the green transition by EUR 1 billion
In April 2023, our record-breaking green bond received the TopDeal recognition from the British CMD Portal. In December 2023, we also won the Best SSA ESG Bond Issuer award by the CMD Portal. In its statement, the CMD Portal emphasised our commitment to sustainable development and our success as a green and social bonds issuer. The CMD Portal produces and provides information on capital markets and acts as a network connecting bond issuers, investors and brokers worldwide.
Our 2023 bond increased our total amount of outstanding green bonds from EUR 2,330 million to EUR 3,330 million. None of our green bonds matured in 2023.
The charts describe the investor breakdown of the primary issuance of outstanding green bonds.
Figures as at 31 December 2023.
Investor breakdown by investor type 12% 0,01% 25% 28% 35% Banks Central banks and official institutions Asset managers Insurance and pension funds Other
22/87 Green Impact Report 2023 Municipality Finance Plc • Green Impact Report 2023
Green finance portfolio
At the end of 2023, the number of projects in our green finance portfolio was 411, of which 360 projects had begun to withdraw finance. The outstanding amount of green finance, which means the amount of finance disbursed minus repayments, totalled EUR 4,795 million at yearend. Total committed finance, which is the sum of the outstanding amount and the amount of unwithdrawn credit commitments, was EUR 6,060 million. The green finance projects are situated in 103 different municipalities across Finland. A summary of the impacts of these projects can be found on page 40 and a detailed list of our green finance projects can be found on pages 59–82.
In 2023, we accepted a total of 134 new projects into our green finance portfolio, of which 85 had begun to withdraw finance at the end of the year. For projects approved in 2023, the outstanding amount of green finance totalled EUR 755 million and the total committed finance totalled EUR 1,772 million at the end of the year.
The largest category of projects approved in 2023 was buildings with 119 approved projects. In addition, we granted green finance to 13 transportation projects. We did not add any new renewable energy projects into our portfolio in 2023, but we did accept two new projects in the water and waste water category, which are described in more detail in the section Water and waste water management.
Outstanding amount of green finance
4,795 €
EUR million
Buildings
Transportation
Renewable energy
Water and waste water management
This map is for reference only.
23/87 Green Impact Report 2023 Municipality Finance Plc • Green Impact Report 2023 Green finance portfolio
Project compatibility under the updated Green Bond Framework 1
Because our green finance applies a portfolio approach, different projects have been approved under different versions of our Green Bond Framework. In the 2022 update, we improved the transparency of our green project eligibility criteria. The new criteria are stricter than before, which is why some projects approved under previous frameworks do not fulfil the new criteria. For the sake of transparency, we have re-evaluated past projects using the new criteria.
We are committed to maintaining a sufficient number of green finance projects in our portfolio to cover the funds raised by green bonds issued after the publication of our updated Green Bond Framework in 2022. This report’s allocation assurance only covers the projects that meet the criteria of the updated framework.
For our 2022 report, we conservatively re-evaluated projects approved under previous versions of the Green Bond Framework against the updated framework criteria. If we did not have enough information to verify a project’s compatibility with the updated criteria, we deemed the project incompatible. We also ascertained that none of our green projects contain any solutions that use fossil fuels, excluding specific exceptions in the bioenergy category (3.3) detailed in the framework. In 2023, we repeated the evaluation for projects that had been approved for green finance before the new framework was published.
https://www.kuntarahoitus.fi/app/uploads/sites/2/2022/12/MuniFin-Green-Bond-framework.pdf
Green finance project breakdown 38 354 1,190 3,213 EUR million Buildings Transportation Renewable energy Water and waste water management
6 14 28 363 number of projects
24/87 Green Impact Report 2023 Municipality Finance Plc • Green Impact Report 2023 Green finance portfolio
A total of 411 green projects out of 378 fulfil the criteria under the updated (August 2022) framework1. The combined outstanding amount for projects that meet the new criteria totalled EUR 4,426 million at the end of 2023. For each project, its alignment with the new criteria is disclosed in the separate Green Impact Report Spreadsheet published concurrently with this report on the MuniFin website.
Fossil fuels and nuclear power in projects under the updated framework 1
In the update (August 2022) to our Green Bond Framework, we specified that we will no longer accept projects involving solutions that are directly powered by fossil fuels. Notably for buildings, this also excludes hybrid solutions, peak load and backup systems. With this change, we want to make sure that investments will no longer be directed towards technologies that depend on fossil fuels. Properties with district heating can still be accepted into our portfolio even if the area’s district heating production still involves a fossil fuel component. Finnish district heating is becoming less carbon-dependent every year.
In some bioenergy heating plants, the fossil energy component cannot be completely avoided, because it may be required for the start-up of the plant and to guarantee the security of supply in situations where renewable fuel is unavailable (cf. Green Bond Framework, project category 3.3). At the end of 2023, our green finance portfolio included bioenergy heating plants in four municipalities: Kangasala, Kemi, Seinäjoki and Taipalsaari.
The Act on the Municipal Guarantee Board (487/1996) determines the types of projects and customers applicable for MuniFin’s financing services. Because this automatically excludes nuclear power, it is not specifically mentioned in our Green Bond Framework’s exclusion criteria.
https://www.kuntarahoitus.fi/app/uploads/sites/2/2022/12/MuniFin-Green-Bond-framework.pdf
Aligned with the criteria1 Not aligned with the criteria Projects MEUR Projects MEUR 1. Buildings 333 2,882 30 331 2. Transportation 27 1,165 1 25 3. Renewable energy 5 31 1 8 4. Water and waste water management 13 348 1 6 Total 378 4,426 33 369
25/87 Green Impact Report 2023 Municipality Finance Plc • Green Impact Report 2023 Green finance portfolio
Fossil fuels in exceptional projects under previous frameworks
At the end of 2023, our green finance portfolio included three projects that involve a fossil fuel component at the commissioning stage of the investment. Two of these projects are the Kvarken Archipelago car and passenger ferry1 in the transportation category and the Energy Self-Sufficient Lempäälä project2 in the renewable energy category, both of which were approved for green finance before our Green Bond Framework was updated. Both projects are looking to substitute natural gas with biogas once its availability becomes sufficient, which will make the projects even more low carbon. The reported impacts of these projects are based on the environmental impacts calculated compared to the reference scenario as presented in the project documentation.
Project documentation suggests that the environmental impact of these projects will be significantly improved compared to prior technology, even using natural gas, and
this positive effect will only increase once biogas becomes a technically and economically feasible option in sufficient capacity.
In the buildings category, Huvimäentie 16, a project by Joensuun Kodit Oy, was approved in 2021. Even though fossil fuel is used for heating in this building, the renovations we finance will reduce its overall CO₂ emissions by more than 50%.
Experimental project
In the buildings category, the construction of an apartment building for Kiinteistö Oy Oulun Tarve at Pohjantikankuja 4 by TA-Yhtymä Oy was accepted into the green finance portfolio in 2019 due to its value as an interesting pilot project, even though its energy efficiency (energy class C, 2018) did not fulfil the framework criteria. The intent of the project is to prove that by utilising brick construction and traditional architectural engineering, the original energy efficiency calculations of the project can be overturned once the
building is in use. If the project reaches its goals, it will also likely fulfil the energy efficiency criteria of our framework. On the basis of the building’s initial energy certificate, the project does not currently have any effect on the presented impact calculations. We will continue to monitor the project to verify its long-term impacts and use-phase results.
The aforementioned projects have been accepted into our green portfolio under the Green Bond Framework criteria of the time of their approval, and they do not therefore meet the current fossil-free energy criteria. We track the progress of these projects annually and will revise their impact calculations if their objectives are not met. If necessary, we can remove the projects from our portfolio. We will give out further information on the projects on request.
https://www.wasaline.com/en/portfolio-item/fuel-efficiency-improvement/
2 https://www.lempaalanenergia.fi/en/lemene-lempaala-energy-community/
26/87 Green Impact Report 2023 Municipality Finance Plc • Green Impact Report 2023 Green finance portfolio
The Green Finance Team
Projects eligible for our green finance must comply with our Green Bond Framework at the time of their approval. Our Customer Solutions division screens loan and lease applications and submits potential applications for review to our Green Finance Team (GFT).
We made substantial changes to our project assessment and approval process in 2022. These changes stemmed from the more transparent eligibility criteria set out in our updated Green Bond Framework and our long experience in customer project evaluation. Before, our green projects were assessed by a team of independent experts, but since 2022, we have relied on our GFT, which is made up of our own sustainability experts only. The work of the GFT has successfully improved not only the efficiency of the process, but also enhanced customer experience. Our customers have submitted a record number of potential green projects, and the GFT has been able to review a large number of applications quickly. Our internal assessment and approval process is subject to external verification. The verification statement is included at the end of this report.
The GFT reviews each project separately, only approving the project if it meets the requirements of our Green Bond Framework and is thereby considered a favourable option for the environment and climate. To encourage more environmentally friendly investments,
we grant approved green finance projects a margin discount of 0–15 basis points. The margin discount is determined based on the project score given by the GFT, with dark green projects typically granted 10–15 points, medium green 5–9 points and light green 1–4 points. In 2023, we raised the maximum margin discount from 10 to 15 basis points. We feel that the discount genuinely encourages our customers to make their projects more environmentally friendly. The discount is based on the project’s estimated environmental benefits and the extent of its sustainability considerations in both design and implementation. We encourage our customers to consider sustainability aspects when producing project documentation, because the documentation is used in estimating the strength of the project’s positive impact.
The GFT holds the right to remove from the green finance portfolio any eligible green projects already funded by green bond proceeds if a project for whatever reason no longer meets the eligibility criteria or is found to be or becomes controversial after its approval. The decision to remove a project from the green project portfolio requires the approval of two GFT members and appropriate documentation.
27/87 Green Impact Report 2023 Municipality Finance Plc • Green Impact Report 2023
The Green Finance Team
The past year was exceptional in the history of our green finance by all measures. I believe this speaks of the growing relevance climate and environmental targets have in our customers’ projects. Sustainable finance is on its way to becoming the mainstream.”
Rami Erkkilä Senior Specialist, sustainable finance

The year 2023 was the first full year under our updated Green Bond Framework. We succeeded in improving the efficiency of our review process and the transparency of our criteria, which also reflected in our record-breaking results for the year. The main reason for the record-year, however, is the ambition and work of our customers and the gradual development of shared rules and practices in the market. At the moment, the flood of regulation is considerable, putting even more emphasis on project design and systematic documentation. Although the majority of our customers are currently not directly subject to the EU Taxonomy, we encourage them to start reviewing project documentation and processes in their sector in light of these factors sooner rather than later.”
Mikko Noronen Sustainability Manager

I have been delighted to see that our customers do not consider environmentally friendly actions as an additional cost. On the contrary, they understand the value these actions have in increasing positive publicity for municipalities, improving resident satisfaction and genuinely promoting Finland’s climate targets. All emission reductions benefit the environment, which makes all green finance projects remarkable. ”
Venla
Laine Sustainability Trainee

28/87 Green Impact Report 2023 Municipality Finance Plc • Green Impact Report 2023 The Green Finance Team
” ” ”
Reporting principles
Our Green Bond Framework defines the contents of this annual Green Impact Report. Our impact reporting is based on the recommendations of the Nordic Position Paper on Green Bonds Impact Reporting 1. This report describes the impacts of the financed projects based on the available facts.
Our approach to impact evaluation
Our reporting applies a bond-programme-based approach, which is also known as the portfolio approach. In this approach, one dynamic portfolio consisting of green bonds is used to finance one dynamic portfolio consisting of green finance projects. We do not allocate green bond proceeds to single projects within the project portfolio. According to the portfolio approach, we may refinance a green bond at maturity in order to maintain an appropriate balance between the green bonds portfolio and the green finance project portfolio.
We carry out our impact reporting in accordance with the following principles:
• The reporting is based on the situation at the end of 2023, taking into account new withdrawals, repayments and redemptions. This report includes projects that the Green Finance Team had approved by the end of the year and whose offer of financing the customer had accepted. In the report, the project year refers to the year in which the Green Finance Team approved the project.
• Some projects in the green portfolio have not yet withdrawn any finance. Their impact is therefore not included in the impact assessment, and the outstanding amount of their finance is EUR 0. Projects that were approved before 2023 but only began to withdraw finance in 2023 are included in the total portfolio figures.
Nordic Public Sector Issuers: Position Paper on Green Bonds Impact Reporting (2017, 2019, 2020, draft 2024)
• The impacts of a financed project are calculated based on our estimated share of the project’s total finance. Our estimated share of the project’s total finance refers to our outstanding amount of green finance in relation to the project’s estimated total finance. If we are the project’s only financier, the project’s estimated total finance equals the finance that we have granted. If the project has other financiers as well, the estimated total finance is the project’s total liabilities or total cost based on information derived from the customer and public sources. This figure does not include the project’s self-financing or grants.
• Our reporting is based on ex-ante evaluation conducted prior to project implementation. The source data for the calculations is not changed annually, but the parameters used in the calculations, such as the electricity and district heating emission factors, may be updated to correspond to those of the reported year. In 2023, we applied updated emission factors for electricity, district heating, heating oil and gas.
• When calculating the relative proportion of the impact of different bonds, the notional value of foreign currency denominated bonds is converted into euros using the exchange rate of the cross-currency interest rate swap of the trade date. We have chosen this approach because upon issuance, we enter into a cross-currency interest rate swap to convert the foreign currency denominated funding into euros. The projects are financed in euros.
• Our impact assessment includes both quantitative and qualitative impacts. We have included short project descriptions in this report since 2022.
29/87 Green Impact Report 2023 Municipality Finance Plc • Green Impact Report 2023 Reporting principles
• In our most recent Green Bond Framework published in 2022, we introduced clearer eligibility criteria for project evaluation and selection. We have analysed all projects that were accepted into the green portfolio prior to the publication of the 2022 Green Bond Framework to assess whether they meet the criteria of the new framework. We present the results at the portfolio level in the section Green finance portfolio on page 24 and at a project level in an Excel spreadsheet available on our website.
• We engage in active discussion with investors and other market participants. We also constantly develop our reporting and welcome development proposals.
Terms used in this report:
• Outstanding amount = disbursed amount minus repayments
• Unwithdrawn credit commitment = amount of finance granted to the customer but not yet withdrawn
• Total committed finance = outstanding amount + unwithdrawn credit commitment
We have selected the UN 2030 Sustainable Development Goals based on the direct impact of the projects. All projects may also have indirect impacts on the environment, individuals and society at large. The SDGs and related targets are reported by project category.
Changes to impact evaluation
We carried out our first green bonds impact reporting in 2016 and have published the Green Impact Report annually ever since. In the 2016 and 2017 reports, the estimated impact was presented per year for projects financed that year. The 2018 report was the first in which we analysed the impact of the entire green finance portfolio. In 2020, we introduced new indicators for projects in the water and waste water management category. In 2021, we updated the parameters used in our calculations for the first time, including the emission factors for electricity and district heating. The developments in our reporting are driven by the harmonisation of the calculation principles that have taken place after our first evaluation.
More information on these changes is available in the corresponding year’s impact report. This report shows the status of our green finance portfolio at the end of 2023. We have updated the impact of our portfolio to reflect our estimated share of the projects’ total finance at the end of 2023. This figure represents our share of the estimated impact of the entire project, explained in more detail on the previous page.
30/87 Green Impact Report 2023 Municipality Finance Plc
Green Impact Report 2023
principles
•
Reporting
Changes to impact calculations
Compared to previous years, the key changes we have made to our impact calculations have to do with the used emission factors, and the 2018 decree on the energy efficiency of new buildings.
In 2023, the emission factor for electricity consumed in Finland was 38 g CO₂/kWh. In our previous impact reports, we adhered to the recommendation of the Nordic Public Sector Issuers for the electricity emission factor (Nordic Position Paper on Green Bonds Impact Reporting, 2020). Starting with our 2022 report, we have instead used the consumption based emission factor2 published by the transmission system operator Fingrid, whose figure is derived from data on the production, import and export of electricity. More information on these two approaches and their differences is available in the above-mentioned position paper and on Fingrid’s website . While this change in our calculation method significantly lowers the reported CO₂ emissions avoided/reduced, we believe that Fingrid’s emission factor more accurately reflects the actual impact during the reporting period. The 2024 update to the Nordic recommendations will be published in the spring. In the draft version, the updated electricity emission factor was set at 191 g CO₂/kWh. According to the updated Nordic recommendations, we may use our own approach, but we will also report avoided/ reduced emissions based on this new factor.
For district heating, we have used the latest available municipality-specific emission factors for each year. For most municipalities, the district heating emission factors have gone down from previous years. From 2021 onwards, we have used the updated emission factors for all projects in our portfolio. As energy production becomes less carbon-dependent, it reduces the emission factors and therefore decreases the calculated avoided and reduced CO₂ emissions. The updated emission factors and the recalculation of impacts do not affect the calculated annual energy savings (avoided/reduced). It should be noted that in areas where the district heating emission factor is very low, we may report the project’s avoided/reduced emissions as zero because the strong decarbonisation in district heat production, coupled with increased electricity consumption and the emission factors applied, can result in a net increase in calculated emissions despite the actual energy savings.
The impact calculations for 2019–2023 have been significantly influenced by the Decree of the Ministry of the Environment on the energy efficiency of new buildings (1010/2017), which came into effect in 2018. With the tightening of E-value limits, the relative impact of the buildings category is now considerably lower than in the previous years. Because we use the E-value to determine a reference building, the lower value affects the calculated benefit. The impact of projects that applied for a building permit before the E-value limits were tightened, but whose impact assessment has been done later, is calculated using an E-value limit that is in line with the Finnish regulation mentioned in the building’s energy certificate. We primarily refer to the energy certificate drawn up during the building permit phase or, if available, the energy certificate procured by the customer when the building was commissioned.
2 https://www.fingrid.fi/sahkomarkkinainformaatio/co2/
31/87 Green Impact Report 2023 Municipality Finance Plc • Green Impact Report 2023 Reporting principles
Changes to terms used in this report
• In our 2019 Green Bonds Impact Report, we reported a figure called disbursed amount, which we have referred to as the outstanding amount of green finance since the 2020 report. These figures are the same and thus directly comparable. In our 2016–2018 reports, we reported another figure called disbursed amount, which did not account for repayments. The figures from the 2016–2018 reports cannot therefore be compared with the disbursed amount presented in the 2019 report and the outstanding amount of green finance presented in the subsequent reports.
• In our 2016–2019 green bonds impact reports, we reported a figure called committed amount, which meant the contractual granted amount of finance. Since the 2020 report, we have instead reported the total committed finance, which is the granted amount of finance deducted with repayments. These two figures are not comparable.
Changes to report presentation
The 2022 update to our Green Bond Framework necessitated several changes to our reporting and its presentation:
• In 2022, we reduced the number of project categories and consolidated the energy efficiency category into the buildings category. Energy efficiency projects that were accepted into the green portfolio before the framework update are now reported under the buildings category.
• In 2022, we added sub-categories and the criteria based on which the projects were accepted into the green portfolio. For projects approved before the framework update, we specify the criteria that these projects meet.
• To provide a more comprehensive understanding of the projects, we have included brief description of the new projects highlighting their impacts and environmentally friendly considerations since 2022.
• Since 2023, we have reported the total figure for avoided/reduced CO₂ emissions based on both Fingrid’s emission factor and the emission factor recommended by Nordic Public Sector Issues (Nordic Position Paper on Green Bonds Impact Reporting).
Calculation principles
The calculations presented in this report are based on the Position Paper on Green Bonds Impact Reporting (2020) drawn up jointly by Nordic public sector issuers. An updated version of the position paper will be published in the spring of 2024.
Starting from the 2021 report, we have conducted the environmental impact calculations of our green finance projects internally. We have since recalculated the impacts for projects that require the use of updated emission factors. This primarily affects construction projects that use emission factors for electricity and heat. The environmental impact calculations for the other project categories in our 2016–2020 reports were carried out by the consulting company Deloitte.
The calculations are based on data of the financed projects and on pre-determined calculation assumptions. We have used information from public sources (e.g. the emission factors) as well as data and reports directly related to the projects (e.g. project-specific environmental calculations) in the calculations. Where necessary, we have requested further information from the project owners.
32/87 Green Impact Report 2023 Municipality Finance Plc • Green Impact Report 2023 Reporting principles
Reporting
In accordance with the Greenhouse Gas Protocol, the reported impacts cover scope 1 and scope 2 emissions, and in some cases possibly also the carbon handprint impact.
The weighted impact has been calculated based on our estimated share of a project’s total finance. Our estimated share of finance has been calculated based on the outstanding amount of green finance. A more detailed explanation of our estimated share of a project’s total finance is available on page 29. The calculations present the status of the outstanding portfolio as of 31 December 2023.
The calculations for the years 2016–2021 have been updated with our estimated share of finance and to correct any errors. Since 2021, we have also updated the emission factors used for electricity and district heating. More information about this is available in the section Changes to impact calculations
In some projects, the estimated impact of a project is based on calculations presented in project-specific environmental impact assessments or other preparatory documents. In these cases, the emission factors applied are those used in the original calculations of these documents. In all other cases, the emission factors are as presented below.
Emission source Emission factor Methodology and remarks Source
Consumption electricity
38g CO₂ / kWh
https://www.fingrid.fi/en/electricitymarket-information/real-timeco2-emissions-estimate/
Fingrid, CO₂ emissions estimate, emission factor for electricity consumed in Finland 2023
District heating *
Municipality-specific emission factors for district heating
Finland’s average CO₂ emission factor for district heating (2023)
Separate generation of district heating*
0–406g CO₂ / kWh depending on the project location
Efficiency method
109.9g CO₂ / kWh Efficiency method and energy method
https://www.klpaastolaskuri. fi/en
Finnish Energy
78g CO₂ / kWh
Average weighed with heat sales
Gasoil used for heating 250g CO₂ / kWh
Natural gas used for heating 199g CO₂ / kWh
Internal combustion engine vehicles
Assumed 4% biofuel component in energy content
Default net calorific value is transferred to default gross calorific value by multiplying it by 1.1088
Cars 95g CO₂ / km WLTP emission test procedure
Vans 147g CO₂ / km
https://www.motiva.fi/en
Statistics Finland, fuel classification 2023
Statistics Finland, fuel classification 2023
climate.ec.eu/eu-action/ transport-emissions_en
* The national emission factor is used because the Nordic Public Sector Issuers have not published emission factors for district heating. The generation of district heat is a regional/local activity. Whenever available, we used the municipality-specific district heating emission factor (available for 83 municipalities). When this was not available, we used an average emission factor for regions with separate generation of district heating as specified by Motiva and for regions where the separate generation of district heating is the primary method based on district heating statistics by Finnish Energy and other public information (6 municipalities). For the remaining municipalities (5), we used the Finnish average emission factor for district heating
33/87 Green Impact Report 2023 Municipality Finance Plc • Green Impact Report 2023
principles
Specific calculation principles for each project type are listed in the tables below.
The emission factors for electricity and district heating referred to in the table below are the ones presented in the table on the previous page.
Annual CO2 emissions avoided/ reduced, tCO2
buildings) or reduced (renovation and other energy efficiency measures)
New buildings
Difference in energy consumption between reference scenario and situation after project implementation (see a more detailed description below the table)
Renovation projects and other energy efficiency measures
Difference in energy consumption between reference scenario and situation after project implementation
New buildings
Consumption of electricity or district heating according to the building’s energy certificate. We primarily refer to the energy certificate drawn up during the building permit phase or, if available, the energy certificate procured
commissioned.
Renovation projects and other energy efficiency measures
Estimated new consumption of electricity, heating and fuel after the renovation or other energy efficiency measures, according to the project plans
New buildings
E-value limit, which is in line with the Finnish regulation mentioned in the building’s energy certificate. We primarily refer to the energy certificate drawn up during the building permit phase or, if available, the energy certificate procured by the customer when the building was commissioned. The share of electricity, district heating and fuel are calculated according to the building’s energy certificate.
Renovation projects and other energy efficiency measures
Consumption of electricity, heating and fuel prior to the project, based on the building’s energy certificate or plan for energy efficiency measures
Avoided (new buildings) or reduced (renovation and other energy efficiency measures)
Buildings – new construction: We assess annual energy efficiency improvements and the amount of CO₂ emissions avoided in relation to applicable energy efficiency regulation in Finland. The energy efficiency of a building is presented as an E-value. The National Building Code of Finland determines maximum E-values for different building types, which a new building cannot exceed in order to gain a building permit. We use the maximum E-value allowed for a new building as the basis for calculating the energy efficiency of buildings. With the new Ministry of the Environment decree (1010/2017), the limit values for E-value were tightened at the beginning of 2018. In the calculations, we use the E-value limit that is in line with the Finnish regulation mentioned in the building’s energy certificate. We primarily refer to the energy certificate drawn up during the building permit phase or, if available, the energy certificate procured by the customer when the building was commissioned. The E-value represents a building’s calculated annual consumption of purchased energy per the heated net area (kWh/m²/a) based on the usage default values and of the building’s intended use category and weighted by energy source coefficients. In our calculations, solar or wind energy generated on the property is treated as a reduction in the demand for purchased energy.
CO2 emissions resulting from production of avoided/reduced CO2 emissions calculated using emission factors for electricity, district heating and fuel
CO₂ emissions equivalent to energy consumption after project implementation calculated using emission factors for electricity, district heating and fuel
CO₂ emissions equivalent to energy consumption in reference scenario calculated using emission factors for electricity, district heating or fuel
The estimated emission avoidance impact is calculated by using the emission factors for electricity and district heating production. Different forms of energy are weighted according to how their proportions are presented in the building’s energy certificate.
In special cases where no E-value limit has been defined for a building category, energy savings are calculated compared to a theoretical reference building. We have used one of the following two possible methods for this calculation. The first method is based on assessing the environmental impact from using renewable energy sources. An example of this is the ice hockey arena in Äänekoski, which uses its own solar energy and geothermal heat. In such cases, we assume that the reference building has the same energy consumption as the building being examined, but that it only uses purchased energy. The second method is based on the environmental impact of new or unusual energy efficiency technology, which can be, for example, a more energy efficient cooling solution like in the Vuokatti Arena. In such cases, we calculate the CO₂ emissions avoided by comparing the project building’s emissions to those of a reference building that is the same size and otherwise similar, but that does not employ this new or unusual technology
Project category Indicator Energy or CO₂ emissions avoided/reduced compared to reference situation Methodology Situation after project implementation Reference scenario Buildings Annual energy savings (avoided/reduced), MWh Avoided (new
by the customer when the building was
34/87 Green Impact Report 2023 Municipality Finance Plc • Green Impact Report 2023 Reporting principles
Reporting principles
Transportation Annual CO2 emissions avoided/ reduced, tCO2
Annual CO2 emissions avoided/ reduced, tCO2
Renewable energy Annual production of renewable energy, MWh
Annual CO2 emissions avoided/ reduced, tCO2
Avoided or reduced depending on the project
Avoided or reduced depending on the project
Public transportation projects: calculations included in project plans
Purchase of electric cars: difference in CO2 emissions between electric car and comparable car with internal combustion engine
N / A Project plans and other project information
Avoided or reduced depending on the project
Renewable energy production capacity, MW
N / A
Water and waste water management
Annual amount of treated waste water in existing plants immediately after project completion, m3
N / A
CO₂ emissions from generating the same amount of energy calculated using emission factors for electricity and district heating or based on project documentation
Project plans and other project information
Current average inflow of waste water before possible expansions or after expansions, if they result in an immediate increase in the amount of water treated. The calculations are based on the actual flow rate when it is available and on the rated value when actual flow rate is not available.
N / A N / A
Standardised electricity consumption as specified by manufacturer, with emission factor for electricity accounted for
N / A
EU fleet-wide CO2 emission targets (2020-2024) set under Regulations (EC) No 443/2009 and (EU) No 510/2011.
N / A
N / A CO₂ emissions from generating the same amount of energy calculated using emission factors for electricity and district heating
N / A
N / A
Annual amount of treated waste water with increased capacity in the future, m3
N / A
New purification plant
The rated value of the average inflow of waste water in the future (review year depends on project plan and may vary between projects)
Expansion of existing purification plant
Difference in average inflow after project completion compared to the reference scenario
New purification plant
N / A
Expansion of existing purification plant
Future rated value of the average flow of waste water after expansion measures (review year depends on the project plan and may vary between projects)
N / A
N / A
New purification plant
N / A
Expansion of existing purification plant
Average flow of waste water before expansion. The calculations are based on the actual flow rate when it is available and on the rated value when actual flow rate is not available.
Annual production of renewable energy, MWh
N / A
Project plans and other project information
N / A
N / A
Project category Indicator Energy or CO₂ emissions avoided/reduced compared to reference situation Methodology Situation after project implementation Reference scenario
35/87 Green Impact Report 2023 Municipality Finance Plc • Green Impact Report 2023
Reporting principles
Nordic reporting recommendations harmonise the green bonds market
MuniFin is one of ten Nordic public sector issuers who have jointly published the Position Paper on Green Bonds Impact Reporting. The position paper was first published in October 2017 and last updated in February 2020. The next update will be published in the spring of 2024, but only after the publication of our 2023 impact report.
The reporting recommendations were drawn up by Nordic green bond issuers specialising in the public sector, with MuniFin as the only Finnish issuer in the group. The other signatories from 2020 include Kommunalbanken and Kommuninvest, MuniFin’s counterparts in Norway and Sweden, as well as several Swedish public sector entities that have issued bonds.
Over the years, the Norwegian research institute CICERO, the Nordic Investment Bank, SEB, Crédit Agricole CIB and a group of international investors have also taken part in preparing the guidelines. The aim of the Nordic issuers’ guide on green bonds impact reporting is to facilitate the work of green finance applicants, lower the threshold for new issuers entering the green bond market and provide international investors with a tool for evaluating green portfolios.
The Nordic guidelines are based on the international Green Bond Principles and the recommendations of multilateral development banks, but they complement these with impact indicators for projects focusing on issues such as public transportation and sustainable buildings.
On this and the following page, we present how we follow the Nordic recommendations.
Because the 2024 update for the position paper will be published after the publication of this impact report, the information on the following page conforms with the 2020 position paper. The 2024 updates will not cause significant changes to our reporting. After the latest version of the position paper is published, we will publish a supplement to this report detailing our compliance with the updated recommendations.
36/87 Green Impact Report 2023 Municipality Finance Plc • Green Impact Report 2023
Reporting principles
The Nordic reporting recommendations* in the MuniFin Green Impact Report
1 Report expected impact, aiming for actual impact
Our reporting is based on ex-ante evaluation conducted prior to project implementation.
2 Report based on annual impact
As recommended, our impact report describes the annual impact of the reporting year as opposed to lifetime results. More information about this is available in the section Calculation principles on page 32.
3 Provide annual reporting
We use a portfolio approach in our green finance, which means that the contents of our portfolio change annually. We report the status and impact of our portfolio by the calendar year.
4 Provide quantitative and qualitative reporting
We have determined quantitative indicators for each project category, and we report these for each project. More information about our indicators is available in the section Calculation principles on page 32. We have also included short project descriptions in this report since 2022. More information about the qualitative impact of the projects is available in the section Other impacts of our projects on page 47.
5 Report based on the share financed
We calculate the impacts of the financed projects based on our estimated share of the project’s total finance. More information about this is available in the section Reporting principles on page 29.
6 Focus on environmental impact
Our selected indicators focus on environmental impact.
7 Report project-by-project, where feasible
We report the impact of each financed project in the section Green finance projects and impacts and in a separately published spreadsheet.
8 Report impact by $ only when quantifiable and relevant
We report the annual CO₂ emissions avoided/reduced per invested monetary unit in all other project categories except the water and waste water management category. We do not consider it relevant to report the impact of the other indicators in relation to the share of finance. More information about this is available in the section Executive summary on page 20.
9 Report bond-by-bond or on bond-programme basis
We use a portfolio approach in our reporting. Our reporting covers all the projects that are included in our green finance portfolio at the end of the reporting year. More information about our approach is available in the section Reporting principles on page 29.
*This information is in line with the 2020 Position Paper on Green Bonds Impact Reporting. MuniFin will publish a separate supplement after the 2024 update has been published.
37/87 Green Impact Report 2023 Municipality Finance Plc • Green Impact Report 2023
10 Provide both allocation and impact reporting
Our impact report includes both allocation and impact reporting. In 2022, we had our allocation reporting verified by an independent external verifier for the first time.
11 Distinguish between financing and refinancing
We use a portfolio approach. We do not allocate green bond proceeds to single projects within the project portfolio, nor do we distinguish between financing and refinancing. Our green finance portfolio consists 100% of new projects. More information is available in the section Green finance in figures on page 18.
12 Provide breakdowns on asset type, geography and sector
Our reporting includes a list of the projects that we finance, all of which are investments in tangible assets and located in Finland. The category of the project indicates the sector of the investment.
13 Maximize transparency and useability
We provide extensive aggregate information and data on individual projects in our reporting. We also provide an executive summary of the key information. In addition to this impact report, we have also compiled the impact data in spreadsheet format. We publish both the report and the green finance spreadsheet in Finnish at www.kuntarahoitus.fi and in English at www.munifin. fi. In addition to our own channels, we also publish the impact of our green finance portfolio on the Green Assets Wallet and the Nasdaq Sustainable Bond Network platforms.
14 Incorporate climate-related physical risks when possible
We discuss the impact of environmental and climate risks on MuniFin in the section Financial institutions expected to pay closer attention to climate and environmental risk management. We improved our environmental and climate risk management in 2022. We discuss our approach and risks in more detail in our separate Pillar III Disclosure Report.
15 Report contributions to the Sustainable Development Goals ( SDGs )
For each green finance project category, we describe the UN SDGs that these projects promote. More information about this is available in the section The impacts of green finance on page 39.
16 Consider reporting contributions to the EU Environmental Objectives
Our green finance projects contribute to the EU Environmental Objectives. In 2022, we updated our Green Bond Framework and evaluated the compatibility of our criteria with the EU Taxonomy. More information on this is available in the section EU Taxonomy is harmonising activities and reporting one step at a time
*This information is in line with the 2020 Position Paper on Green Bonds Impact Reporting. MuniFin will publish a separate supplement after the 2024 update has been published.
We comply with the reporting recommendations We partly comply with the reporting recommendations We do not comply with the reporting recommendations
38/87 Green Impact Report 2023 Municipality Finance Plc • Green Impact Report 2023
principles
Reporting
The impacts of green finance
Buildings, transportation, renewable energy, water and waste water management
39/87 Green Impact Report 2023 Municipality Finance Plc • Green Impact Report 2023
The impacts of green finance
Project category Number of projects Outstanding amount on 31 Dec 2023, EUR Annual energy savings (avoided/ reduced, MWh) Annual CO2 emissions avoided/reduced (tCO₂) Annual amount of treated waste water in existing plants immediately after project completion (m3) Annual amount of treated waste water with increased capacity in the future (m3) Annual production of renewable energy (MWh) Renewable energy production capacity (MW) Buildings 363 3,212,697,904 51,736 5,710 - - 149Transportation 28 1,190,112,179 - 10,862 - - -Renewable energy 6 38,083,519 - 64,794 - - 106,357 54 Water and waste water management 14 354,110,906 - - 25,894,417 36,048,174 496Entire portfolio 411 4,795,004,508 51,736 81,366 25,894,417 36,048,174 107,003 54
40/87 Green Impact Report 2023 Municipality Finance Plc • Green Impact Report 2023
The impacts of green finance
Buildings
Construction is a necessity in modern society because people need homes, hospitals, schools, workplaces and many other facilities. The built environment has a significant impact on national emissions and the carbon footprint of municipalities and individual people through the use of energy. There is an ongoing effort to better understand emissions, including those generated during construction. The low-carbon roadmaps, the development of national and uniform carbon assessment methods of buildings, the Land Use and Building Act Reform, as well as regulations on the climate assessment and material statement of buildings are all indications of the prominence of sustainable construction. In sustainable construction, environmental impacts are taken into account already in the design stage, for example by carefully choosing between new and repair construction and by leveraging new energy solutions and environmentally friendly, low-carbon building materials, such as wood and recycled materials. Buildings in our green projects employ local renewable energy production, life cycle thinking, smart control systems and other environmentally sound technologies.
In the property and construction sectors, 2023 was a challenging year as the rise in material costs and interest rates slowed the market down in general. Towards the end of the year, however, the demand for financing started to pick up as construction costs and interest rate hikes levelled off. Also of relevance to our customers in 2023 were the new government programme’s entries concerning subsidies for right-of-occupancy homes. Despite the challenging market, the buildings category continued on a strong growth track in 2023, which is a testament to our customers’ strong commitment to energy-efficient construction also
during difficult times. Traditionally, affordable social housing production supported by the Housing Finance and Development Centre of Finland (Ara) has been instrumental in evening out economic fluctuation in the market. Projects in this category include both housing and public construction as well as the renovation of existing buildings.
Entire portfolio
Number of projects
Projects approved in 2023
Annual CO₂ emissions
Annual production of renewable energy
Renewable energy production capacity
363 Number of
119 Total committed finance EUR 4,478,000,616 Annual energy savings (avoided/reduced) 8,527 MWh Outstanding amount EUR 3,212,697,904 Annual CO₂ emissions (avoided/reduced) 1,139 tCO₂
(avoided/reduced) 51,736 MWh
projects
Annual energy savings
(avoided/reduced) 5,710
tCO₂
149
MWh
0.2
41/87 Green Impact Report 2023 Municipality Finance Plc • Green Impact Report 2023
MW
The impacts of green finance
Transportation
Transportation projects reduce traffic emissions and the need for private cars through projects that invest in low-emission public transportation or directly support it. Examples of past projects include the West Metro Extension in the capital region, the Crown Bridges project of the City of Helsinki and the Tampere Tramway. In addition to reducing emissions, modern public transportation solutions often have wide-reaching indirect impacts: for example, they can allow a denser and safer urban environment and thus make the city more welcoming for its residents.
In 2023, one new significant project for emission-free public transport was added into our portfolio, namely the Jokeri Light Rail project in the Helsinki Metropolitan Area, which we had approved in 2022. In regular service since late October 2023, the 25-kilometre Helsinki light rail line 15 connects Keilaniemi in Espoo and Itäkeskus in Helsinki, replacing the region’s busiest bus service, trunk bus line 550. In 2025, approximately 88,000 passengers are expected to use the light rail line on weekdays, with the number projected to reach 91,000 in 2030.
In addition to public transportation projects, we have also financed the acquisition of electric cars that help the organisation of public services, for example. In 2023, the amount of transportation project financing in our portfolio grew by EUR 289 million.
Entire portfolio Projects approved in 2023
Number of projects 28
Number of projects 13
EUR 1 ,190,112,179 Annual CO₂ emissions (avoided/reduced) 26 tCO₂
Total committed finance
EUR 1 ,190,112,179 Annual CO₂ emissions (avoided/reduced) 10,862 tCO₂
Outstanding amount
42/87 Green Impact Report 2023 Municipality Finance Plc • Green Impact Report 2023
The impacts of green finance
Renewable energy
Renewable energy production plays a key role in mitigating global climate change. Renewable energy generates zero or close to zero greenhouse gas emissions at the production stage, and it directly cuts down greenhouse gas emissions by reducing fossil fuel use. Moreover, energy can be produced locally, reducing delivery, distribution and transmission losses. This has both environmental and economic implications for society. By financing renewable energy projects, we promote Finland’s long-term goal of becoming a carbon neutral society by 2035.
Our renewable energy category include projects such as the Kangasalan Lämpö Ltd biomass heating plant, which produces thermal energy from forest industry side streams, the Kemi Energy and Water bioheating plant and the Energy Self-Sufficient Lempäälä project. In 2023, we did not add any new renewable energy projects into our portfolio.
Entire portfolio Projects approved in 2023
Number of
6 Number of projects 0 Total committed finance EUR 38,083,519 Annual CO₂ emissions (avoided/reduced) 0 tCO₂ Outstanding amount EUR 38,083,519 Annual production of renewable energy 0 MWh Annual CO₂ emissions (avoided/reduced) 64,794 tCO2 Renewable energy production capacity 0 MWh Annual production of renewable energy 106,357 MWh Renewable energy production capacity 54 MW
projects
43/87 Green Impact Report 2023 Municipality Finance Plc • Green Impact Report 2023
The impacts of green finance
Water and waste water management
Our green finance promotes projects that ensure the availability of safe and clean drinking water and the effective treatment of waste water across Finland. Climate change and migration pose new challenges to water and waste water management, and preparing for them requires substantial investments. Water purification helps to maintain high waste water quality, prevent the eutrophication of waterways and enable the reuse of nutrients, such as phosphorus and nitrogen. In addition, sludge separated from waste water can be composted and utilised in biogas production.
Since 2016, we have financed 14 projects in the water and waste water management category, all of which were part of our portfolio on 31 December 2023. These projects support the water treatment capacity extensions of existing water purification plants, the introduction of more efficient purification technologies and methods, and the construction of new water purification plants. Example projects include waste water treatment plants of Kalajokilaakso (Vesikolmio Ltd), Blominmäki (Helsinki Region Environmental Services) and Sahanniemi (City of Heinola). In 2023, we accepted two new projects in the water and waste water management category into our portfolio: the waste water pretreatment plant in Pyhäntä and the Sulkavuori Central Wastewater Treatment Plant in Tampere. More information about these projects is available on page 57.
Entire portfolio Projects approved in 2023
Number
14 Number of
2 Total committed finance EUR 354,110,906 Annual amount of treated waste water in existing plants immediately after project completion 0 m3 Outstanding amount EUR 354,110,906 Annual amount of treated waste water with increased capacity in the future 8,854,447 m3 Annual amount of treated waste water in existing plants immediately after project completion 25,894,417 m3 Annual production of renewable energy 159 MWh
amount of treated waste water with increased capacity in the future 36,048,174 m3
production of renewable energy 496 MWh
of projects
projects
Annual
Annual
44/87 Green Impact Report 2023 Municipality Finance Plc • Green Impact Report 2023
The impacts of green finance
Green projects promote the following UN Sustainable Development Goals
6.3 By 2030, improve water quality by reducing pollution, eliminating dumping and minimising release of hazardous chemicals and materials, halving the proportion of untreated wastewater and substantially increasing recycling and safe reuse globally
6.4 By 2030, substantially increase water-use efficiency across all sectors and ensure sustainable withdrawals and supply of freshwater to address water scarcity and substantially reduce the number of people suffering from water scarcity
6.6 By 2020, protect and restore water-related ecosystems, including mountains, forests, wetlands, rivers, aquifers and lakes
7.2 By 2030, increase substantially the share of renewable energy in the global energy mix
7.3 By 2030, double the global rate of improvement in energy efficiency
9.1 Develop quality, reliable, sustainable and resilient infrastructure, including regional and transborder infrastructure, to support economic development and human wellbeing, with a focus on affordable and equitable access for all
9.4 By 2030, upgrade infrastructure and retrofit industries to make them sustainable, with increased resource-use efficiency and greater adoption of clean and environmentally sound technologies and industrial processes, with all countries taking action in accordance with their respective capabilities
45/87 Green Impact Report 2023 Municipality Finance Plc • Green Impact Report 2023
The impacts of green finance
11.1 By 2030, ensure access for all to adequate, safe and affordable housing and basic services and upgrade slums
11.2 By 2030, provide access to safe, affordable, accessible and sustainable transport systems for all, improving road safety, notably by expanding public transport, with special attention to the needs of those in vulnerable situations, women, children, persons with disabilities and older persons
11.3 By 2030, enhance inclusive and sustainable urbanisation and capacity for participatory, integrated and sustainable human settlement planning and management in all countries
11.6 By 2030, reduce the adverse per capita environmental impact of cities, including by paying special attention to air quality and municipal and other waste management
11.7 By 2030, provide universal access to safe, inclusive and accessible, green and public spaces, in particular for women and children, older persons and persons with disabilities
12.2 By 2030, achieve the sustainable management and efficient use of natural resources
13.1 Strengthen resilience and adaptive capacity to climate-related hazards and natural disasters in all countries
14.1 By 2025, prevent and significantly reduce marine pollution of all kinds, in particular from land-based activities, including marine debris and nutrient pollution
15.5
Take urgent and significant action to reduce the degradation of natural habitats, halt the loss of biodiversity and, by 2020, protect and prevent the extinction of threatened species
46/87 Green Impact Report 2023 Municipality Finance Plc • Green Impact Report 2023
The impacts of green finance
Other positive impacts of our projects
Besides the quantitative impacts discussed in this report, our green finance projects also have other wide-ranging benefits. In addition to their environmental benefits, all the projects include various social and economic impacts, both locally and regionally.
Through our finance, we support regional vitality and attractiveness. We enable projects aimed at improving individual wellbeing and promoting the introduction of new, more environmentally friendly technologies and materials. For example, our green portfolio includes several wooden schools, which help tackle indoor air problems.
All categories
• Climate change mitigation and adaptation
• Regional vitality and attractiveness
• Support for employment
• Innovations, new environmental technologies and pilot projects
• Wide-ranging cooperation with stakeholders Buildings
• Support for early education and teaching
• Welcoming green and communal urban spaces
• Flexible multipurpose facilities that serve diverse population groups
• Safe and healthy premises and the renovation of old premises
• Pilot projects for sustainable buildings
• The use of the Green Factor as a tool for land use planning, climate change mitigation and adaptation and promotion of urban biodiversity
Transportation
• More pleasant and welcoming urban environment
• Accessibility of services and ease of everyday life
• Denser city structure
• Reduced noise pollution
Renewable energy
• Efforts to pilot and deploy new environmental technologies
• Improved health through better air quality
• Regional competitiveness
• Finland’s energy self-sufficiency and the minimisation of energy distribution and transfer losses
Water and waste water management
• Recovery of bioenergy for energy production
• Improved water quality
• Climate change adaptation
47/87 Green Impact Report 2023 Municipality Finance Plc
Green Impact Report 2023
•
Projects approved in 2023
Projects approved in 2023
Avara Vuokrakodit Ky/Avara Deka Oy Apartment building, As.oy. Helsingin Tulistimenkatu
TA-Yhtymä Oy Apartment building, As.oy Helsingin Vanha Talvitie 29
Asuntosäätiön Asumisoikeus Oy Apartment building, As.oy. Kangasrinteen sananjalka
Avain Asumisoikeus Oy Apartment building, As.oy. Jyväskylän Timoteiraitti 9-11
Avain Asumisoikeus Oy Apartment building, As.oy. Kirkkonummen Pilvijärventie 15
Toivo Group Oyj/Elämäni Kodit 40 Oy Apartment building, As.oy. Vantaan Nahkuri
Hausjärvi Municipality Comprehensive school of Oitti
City of Heinola School and daycare centre of Kailaa
City of Järvenpää School and daycare centre of Harjula, 1st phase of Jyk building, School and daycare centre of Oinaskatu
building permit (90).
1.1a Buildings New apartment building of energy class A. Its E-value of 73 kWhE/m²/year is 19% better than the level required by the building permit (90).
1.1a Buildings Apartment building of energy class A. Its E-value of 75 kWhE/m²/year is 17% better than the level required by the building permit (90).
1.1a Buildings New seven-storey concrete apartment building for right-of-occupancy homes. Its energy class is A, and its E-value of 75 kWhE/m²/year is 17% better than the level required by the building permit (90).
1.1a Buildings Two new apartment buildings of energy class A. Their E-values are 70 and 74 kWhE/m²/year, which are 22% and 18% better than the level required by the building permit (90).
1.1a Buildings New terraced house complex consisting of ten units. The entire complex will be of energy class A, and the E-values of the individual units will fall in a range of 74–80 kWhE/m²/year. The average E-value will be 76.9 kWhE/m²/year, which is 27% better than the level required by the building permit (105).
1.1a Buildings Apartment building with an E-value of 72 kWhE/m²/year, which is 20% better than the level required by the building permit (90).
1.1a Buildings Educational building of energy class A. Its E-value of 88 kWhE/m²/year is 12% better than the level required by the building permit (100).
1.1a Buildings New school building with an E-value of 75 kWhE/m²/year, which is 25% better than the level required by the building permit (100).
1.1a Buildings Three school and daycare buildings of energy class A. Their E-values fall in a range of 74–82 kWhE/m²/year, which is 18–26% better than the level required by the building permit (100).
Buildings Number approved: 119 Share of all projects approved in 2023: 88 % Customer Project Subcategory Description City of Äänekoski School of Koulumäki, Building C 1.1a Buildings New school building with an E-value of 68 kWhE/m²/year, which is 32% better than the level required by the building permit (100). A-Kruunu Oy Apartment building, Konttinosturinkuja 4 1.1a Buildings Apartment building of energy class A. Its E-value of 75 kWhE/m²/year is 17% better than the level required by the building permit (90). Suomen Kaupunkikodit ARA Oy Apartment building, As.oy. Helsingin Frakki, Kutomotie 14c 1.1a Buildings New apartment building of energy class A. Its E-value of 75 kWhE/m²/year is 17% better than the level required by the building permit (90). TA-Yhtymä Oy Apartment building, As.oy. Helsingin Rullakkotori 1.1a Buildings Apartment building of energy class A. Its E-value of 74 kWhE/m²/year is 17.7% better than the level required by the
48/87 Green Impact Report 2023 Municipality Finance Plc • Green Impact Report 2023
Projects approved in 2023
Kärkölä Municipality Comprehensive school of Kärkölä
TA-Yhtymä Oy Apartment building, KOY Haukiputaan Herralankulma
Kiinteistö Oy Nikkarinkruunu Apartment building, Riimutie 1, Kerava
Kiinteistö Oy Nikkarinkruunu Apartment building, Sorsakorventie 11-13, Kerava
Kiinteistö Oy Nikkarinkruunu Apartment building, Varsatie 2, Kerava
City of Seinäjoki School of Kärki
Kiinteistöosakeyhtiö Keskiväli Apartment building, Koukkutie 9, Mäntyharju
Kiinteistöosakeyhtiö Keskiväli Apartment building, Pekonpirtti
City of Kokkola Community centre of Piispanmäki
Kolari Municipality Community centre of Kirkonkylä
Mustasaari Municipality School of Smedsby
Kouvolan Asunnot Oy Apartment building, Halkotorinkuja 4
City of Kouvola Community centre of Inkeroinen
building of energy class A. Its E-value of 89 kWhE/m²/year is 11% better than the level required by the building permit (100).
1.1a Buildings New school building of energy class A. Its E-value of 87 kWhE/m²/year is 13% better than the level required by the building permit (100).
1.1a Buildings Apartment building with an E-value of 75 kWhE/m²/year, which is 17% better than the level required by the building permit (90).
1.2 Renovations Renovation including switching from natural gas into geothermal heating, renewal of the energy management system and installation of remote monitoring. Energy efficiency improved by nearly 60%.
1.2 Renovations Renovation including switching from natural gas into geothermal heating, renewal of the energy management system and installation of remote monitoring. Energy efficiency improved by nearly 60%.
1.2 Renovations Renovation including switching from natural gas into geothermal heating, renewal of the energy management system and installation of remote monitoring. Energy efficiency improved by nearly 60%.
1.1a Buildings School building of energy class A. Its E-value of 72 kWhE/m²/year is 28% better than the level required by the building permit (100).
1.2 Renovations Renovation of three apartment buildings, including switching from oil to geothermal heating. Energy efficiency improved by 55–56%.
1.2 Renovations Renovation of four apartment buildings, including switching from oil to geothermal heating. Energy efficiency improved by 44–47%.
1.1a Buildings Educational building for basic and early childhood education. The building has energy class A with an E-value of 69 kWhE/m²/year, which is 31% better than the level required by the building permit (100).
1.1a Buildings School building of energy class A. Its E-value of 75 kWhE/m²/year is 25% better than the level required by the building permit (100).
1.1a Buildings A new school centre of energy class A. Its E-value of 68 kWhE/m²/year is 32% better than the level required by the building permit (100).
1.1a Buildings Apartment building of energy class A. Its E-value of 74 kWhE/m²/year is 17% better than the level required by the building permit (90).
1.1a Buildings Comprehensive school and multipurpose building of energy class A, made of cross-laminated timber. Its E-value of 73 kWhE/m²/year is 27% better than the level required by the permit (100).
Buildings Number approved: 119 Share of all projects approved in 2023: 88 % Customer Project Subcategory Description City of Jyväskylä Daycare centre and school of Kortepohja, Daycare centre and school of Pohjalampi 1.1a Buildings Three school and daycare buildings of energy class A. Their E-values fall in a range of 74–82 kWhE/m²/year, which is 18–26% better than the level required by the building permit (100). The Student Union of the University of Jyväskylä Apartment building, Kartanonkuja 11 1.1a Buildings Hybrid building combining apartments and a grocery store. The apartment building has an E-value of 66 kWhE/m²/year, which is 27% better than the level required by the building permit (90). The grocery store has energy class A with an E-value of 79 kWhE/m²/year. This building type does not have a specific E-value building permit requirement. Kaavi Municipality Daycare centre of Kaavi 1.1a Buildings Daycare centre of energy class A. Its E-value of 90 kWhE/m²/year is 14% better than the level required by the building permit (105). City of Kangasala School of Ruutana 1.1a Buildings School
49/87 Green Impact Report 2023 Municipality Finance Plc • Green Impact Report 2023
Projects approved in 2023
Apartment building of energy class A. Its E-value of 73 kWhE/m²/year is 19% better than the level required by the building permit (90).
Niiralan Kulma Oy Apartment building, Tasavallankatu 18 1.1a Buildings Building for service housing, classified as two storeys or less. The building’s E-value is 73 kWhE/m²/year, which is 30% better than the level required by the building permit (105).
City of Nivala School of Haikara 1.1a Buildings New school building of energy class A. Its E-value of 89 kWhE/m²/year is 11% better than the level required by the building permit (100).
Nokian Vuokrakodit Oy Apartment building, Poutuntie 8 1.1a Buildings Apartment building of energy class A. Its E-value of 70 kWhE/m²/year is 22% better than the level required by the building permit (90).
Oulun Sivakka Oy Apartment building, Hiirihaukantie 12 b 1.1a Buildings Apartment building of energy class A. Its E-value of 67 kWhE/m²/year is 26% better than the level required by the building permit (90).
Oulun Sivakka Oy Apartment building, Kauppiaantie 18 1.1a Buildings Apartment building of energy class A. Its E-value of 70 kWhE/m²/year is 22% better than the level required by the building permit (90).
Oulun Sivakka Oy Apartment building, Menninkäisentie 3 c 1.1a Buildings Apartment building of energy class A. Its E-value of 70 kWhE/m²/year is 22% better than the level required by the building permit (90).
Perho Municipality Perho sports hall 1.1a Buildings New sports hall of energy class A. Its E-value of 87 kWhE/m²/year is 13% better than the level required by the building permit (100).
City of Riihimäki Riihimäki swimming hall
City of Rovaniemi Community centre of Vaaralampi
Savon Koulutuskuntayhtymä Savilahti campus
Seinäjoen koulutuskuntayhtymä School of Törnävä
Sonkakoti Oy Apartment buildings, Männikkötie 26 a-c, Särkitie 1 and 3, Sonkajärvi
Sotkamo Municipality Middle school of Tenetti
1.2 Renovations Renovation of a swimming hall’s building technology and surface materials. The renovation will reduce the swimming hall’s purchased energy by 36% and CO₂ emissions by 34%.
1.1a Buildings New school building of energy class A. Its E-value of 89 kWhE/m²/year is 11% better than the level required by the building permit (100).
1.1a Buildings New vocational school campus of energy class A. Its E-value falls in a range of 74–81 kWhE/m²/year, depending on the building, which is 19–26% better than the level required by the building permit (100).
1.1a Buildings New school building with an E-value of 85 kWhE/m²/year, which is 15% better than the level required by the building permit (100).
1.2 Renovations Renovation of five buildings, including switching from oil to geothermal heating. Energy efficiency improved by more than 60% on average.
1.1a Buildings New school building with an E-value of 78 kWhE/m²/year, which is 22% better than the level required by the building permit (100).
Buildings Number approved: 119 Share of all projects approved in 2023: 88 % Customer Project Subcategory Description Lahden Asunnot Oy Apartment buildings, Jaksonkatu 3 and 5 1.1a Buildings Two new apartment buildings of energy class A. Their E-values of 75 kWhE/m²/year are 17% better than the level required by the building permit (90). Both buildings have solar energy systems. The project includes carbon footprint calculations. Lahden Asunnot Oy Community centre of Renkomäki 1.1a Buildings New multipurpose building for education and library. Its energy class is A, and its E-value of 60 kWhE/m²/year is 40% better than the level required by the building permit (100). Muuramen Vuokra-asunnot Oy Apartment building, Kinkoriutantie 14-18 1.2 Renovations Renovation of four buildings, including switching from oil to geothermal heating. Energy efficiency improved by more than 60%. Muuramen Vuokra-asunnot Oy Apartment building, Männikkötie 6 1.2 Renovations Renovation of three buildings, including switching from oil to geothermal heating. Energy efficiency improved by more than 60%. Niiralan Kulma Oy Apartment building, Kaartokatu 3 1.1a Buildings
50/87 Green Impact Report 2023 Municipality Finance Plc • Green Impact Report 2023
Projects approved in 2023
Foundation (TOAS)
Apartment buildings, Uimalankatu 3 e and f
Tampere Student Housing Foundation (TOAS) Apartment building, Vanha Domus, Väinämöisenkatu 11
Tampereen Vuokratalosäätiö sr Apartment building, Rollikankatu 2
Tuusula Municipality School campus of Kirkonkylä
City of Valkeakoski School of Sorrila
VAV Asunnot Oy Apartment building, Peltolantie 42
1.1a Buildings
1.2 Renovations
1.1a Buildings
Two wooden apartment buildings of energy class A. Their E-value of 75 kWhE/m²/year is 17% better than the level required by the building permit (90). The project uses the RTS Environmental Classification Tool by the Building Information Group to manage the project in an environmentally responsible manner.
Renovation of an apartment building, which improves the E-value from 140 to 81 kWhE/m²/year. Energy efficiency is improved by 42%.
Concrete apartment building of energy class A. Its E-value of 75 kWhE/m²/year is 17% better than the level required by the building permit (90). The building uses geothermal heating.
1.1a Buildings School building of energy class A. Its E-value of 81 kWhE/m²/year is 19% better than the level required by the building permit (100).
1.1a Buildings New school building with an E-value of 64 kWhE/m²/year, which is 36% better than the level required by the building permit (100).
1.1a Buildings Two apartment buildings of energy class A. Their E-value of 75 kWhE/m²/year is 17% better than the level required by the building permit (90).
City of Ylivieska School of Taanila 1.1a Buildings New school building of energy class A. Its E-value of 74 kWhE/m²/year is 26%
extension
extension’s energy class
E-value is 72 kWhE/m²/year, which is 28% better than the level required by the building permit (100).
TVT Asunnot Oy Apartment building, Toivolankatu 10 e-g, Mäntymäki
1.1a Buildings Apartment building of energy class A.
Helsingin kaupungin asunnot Oy Apartment building, Sakara 2 1.2 Renovations
Helsingin kaupungin asunnot Oy Apartment building, Arhotie 20 1.2 Renovations
Helsingin kaupungin asunnot Oy Apartment building, Kasöörinkatu 3 1.2 Renovations
Helsingin kaupungin asunnot Oy Apartment building, Mäkelänkatu 45 1.2 Renovations
Helsingin kaupungin asunnot Oy Apartment building, Svanströminkuja 5 1.1a Buildings
Renovation of four concrete apartment buildings, improving energy efficiency by 46% on average.
Renovation of an apartment building, improving energy efficiency by 46%.
Renovation of an apartment building, improving energy efficiency by 45%.
Renovation of three concrete apartment buildings, improving energy efficiency by 35%.
New apartment building of energy class A. Its E-value of 73 kWhE/m²/year is 19% better than the level required by the building permit (90).
Buildings Number approved: 119 Share of all projects approved in 2023: 88 % Customer Project Subcategory Description TA-Asumisoikeus Oy Apartment building, Vuoksi 4 1.1a Buildings Two apartment buildings of energy class A. Their E-values are 72 and 71 kWhE/m²/year, which are 20% and 21% better than the level required by the building permit (90). TA-Asumisoikeus Oy Apartment building, Kalasatamankatu 29 1.1a Buildings Apartment building of energy class A. Its E-value of 75 kWhE/m²/year is 17% better than the level required by the building permit (90). City of Tampere School of Sampo, School of South-Hervanta 1.1a Buildings Two school buildings of energy class A. Their E-values are 80 and 81 kWhE/m²/year, which are 19% and 20% better than the level required by the building permit (100). Tampere Student Housing Foundation (TOAS) Apartment buildings, Uimalankatu 1a and 1d 1.1a Buildings Two apartment buildings of energy class A. Their E-value of 75 kWhE/m²/year is 17% better than the level required by the building permit (90). Tampere Student Housing
better than the level required by the building permit
City of Ylöjärvi
of Vuorentausta 1.1a
Renovation
(100).
School
Buildings
and
of a school building. The
is A and its
Its E-value
74 kWhE/m²/year
building
of
is 18% better than the level required by the
permit (90).
51/87 Green Impact Report 2023 Municipality Finance Plc • Green Impact Report 2023
Projects approved in 2023
City of Hämeenlinna Comprehensive school and sports hall of Hämeenlinna
1.1a Buildings
City of Pori Community centre of Northern Pori, 2nd phase
City of Turku Turku Music Hall Fuuga and Wäinö Aaltonen School
TA-Yhtymä Oy Apartment building, KOY Oulun Tarve, Soikkotie 2
Central Finland Student Housing Foundation (Koas) Apartment building, T ourulan Hahlo 9, Jyväskylä
Kiinteistö Oy Nikkarinkruunu Apartment building, Pajukatu 2
Ranua Municipality Secondary school and high school of Ranua
is 39% better than the level required by the building permit (147).
New school building and sports hall of energy class A. The school building has an E-value of 60 kWhE/m²/year, which is 40% better than the level required by the building permit (100). The sports hall has an E-value of 75 kWhE/m²/year, which is 25% better than the level required by the building permit (100).
1.1a Buildings Extension of a multipurpose building. The extension has energy class A with an E-value of 86 kWhE/m²/year, which is 14% better than the level required by the building permit (100).
1.1a Buildings New music hall and school building of energy class A. The music hall has an E-value of 86 kWhE/m²/year, which is 36% better than the level required by the building permit (135). The school building has an E-value of 83 kWhE/m²/year, which is 17% better than the level required by the building permit (100).
1.1a Buildings Three new terraced houses of energy class A. Their E-value 80 kWhE /m²/year is 24% better than the level required by the building permit (105).
1.1a Buildings New apartment building of energy class A. Its E-value of 72 kWhE/m²/year is 20% better than the level required by the building permit (90).
1.2 Renovations
1.1a Buildings
City of Sastamala Comprehensive school of Mouhijärvi 1.1a Buildings
City of Vantaa Daycare centre of Kelokuusi, Daycare centre of Korso, Daycare centre of Latopuisto, Daycare centre of Patotie
Järvenpään Mestari-Asunnot Oy Apartment building, As.oy. Wärtsilänkatu 4, Pajalan Helmi
1.1a Buildings
1.1a Buildings
Renovation including switching from oil to district heating and modernising ventilation equipment. Energy efficiency improved by nearly 60%.
Educational building with an E-value of 88 kWhE/m²/year, which is 12% better than the level required by the building permit (100).
Educational building of energy class A. Its E-value of 75 kWhE/m²/year is 25% better than the level required by the building permit (100).
Four daycare centres of energy class A. Their E-values fall in a range of 68–83 kWhE/m²/year, which is 17–32% better than the level required by the building permit (100).
Two seven-storey apartment buildings with an E-value of 75 kWhE/m²/year, which is 17% better than the level required by the building permit (90).
Buildings Number approved: 119 Share of all projects approved in 2023: 88 % Customer Project Subcategory Description Kiinteistö Oy Enontekiön kunnan asunnot Apartment buildings, Öhmannintie 4, Ounastie 3162, Pulkkatie 19 and Sopulikuja 4 1.2 Renovations Renovation of four apartment buildings, including switching from oil to geothermal heating. Energy efficiency is improved by 54% on average. Tampereen Kotilinnasäätiö sr Apartment building, As.oy. Niemenrannan Kotilinna 1.1a Buildings Apartment building of energy class A. Its E-value of 72 kWhE/m²/year is 20% better than the level required by the building permit (90). Espoon Asunnot Oy Apartment building, Riihitontuntie 7 1.1a Buildings Two apartment buildings of energy class A, with E-values of 71 kWhE/m²/year for the A building and 70 kWhE/m²/year for the BC building. Kiinteistö Oy Nikkarinkruunu Apartment building, Myllylenkki 2, Kerava 1.1a Buildings A total of 15 small detached houses of energy class A. Their E-value of 90 kWhE/m²/year
52/87 Green Impact Report 2023 Municipality Finance Plc • Green Impact Report 2023
Projects approved in 2023
Asuntosäätiön Asumisoikeus Oy Apartment building, Saaristolaivastonkatu 18
TVT Asunnot Oy Apartment building, Kousankuja 4,Turku
KAS asunnot Oy Apartment building, KOY Rovatalo, Kaartokatu 11d
Kiinteistö Oy Jämsänmäki Apartment buildings, Huikkolanraitti 2 and Kanervakatu 5
Foundation for student housing in the Helsinki region Apartment building, HOAS Huippu, Höyrykatu 1
Central Finland Student Housing Foundation (Koas) Apartment buildings, Taitoniekantie 2 a and b
Porvoon A-Asunnot Oy Apartment buildings, Vaskenvalajankatu 8b and 8c
TVT Asunnot Oy Apartment buildings, Raastuvankatu 3 a and b, Turku
Kuopio Student Housing Company (Kuopas) Apartment building, Kuopas Kampus, Savilahdenranta
Helsingin Asumisoikeus Oy Apartment building, Samoansaari, Jätkäsaari
1.1a Buildings Apartment building of energy class A. Its E-value 69 kWhE /m²/year is 23% better than the level required by the building permit (90).
1.2 Renovations
Renovation of three apartment buildings, improving energy efficiency by 41%. The buildings’ E-values will improve from 184 to 87 kWhE/m²/ year and energy class from D to B.
1.2 Renovations Renovation of an apartment building, improving energy efficiency by 35% from energy class E to C.
1.2 Renovations
1.1a Buildings
1.2 Renovations
1.1a Buildings
1.2 Renovations
1.1a Buildings
1.1a Buildings
Renovation of 12 apartment buildings, including switching from oil to geothermal heating and installation of building-specific solar electricity systems. Energy efficiency improved by 48%.
New apartment building of energy class A. Its E-value of 75 kWhE/m²/year is 17% better than the level required by the building permit (90).
Renovation of two apartment buildings, improving energy efficiency by 50% on average.
Two apartment buildings of energy class A. Their E-values of 65 and 66 kWhE/m²/year are 28% and 27% better than the level required by the building permit (90).
Renovation of two apartment buildings, including the installation of air source heat pumps and solar electricity systems and repairs to the building’s envelope. Energy efficiency is improved by approx. 44%.
Two apartment buildings with E-values of 70 and 72 kWhE/m²/year, which are 22% and 20% better than the level required by the building permit (90).
Apartment building of energy class A. Its E-value of 74 kWhE/m²/year is 18% better than the level required by the building permit (90).
Buildings Number approved: 119 Share of all projects approved in 2023: 88 % Customer Project Subcategory Description Espoon Asunnot Oy Apartment building, Anna Sahlsteninkatu 13 1.1a Buildings Apartment building of energy class A. Its E-value 68 kWhE /m²/year is 24% better than the level required by the building permit (90). Avara Vuokrakodit I Ky Apartment building, As.oy. Helsingin veturitie 18 1.1a Buildings Apartment building of energy class A. Its E-value 75 kWhE /m²/year is 17% better than the level required by the building permit (90). TVT Asunnot Oy Apartment building, Savonkedonkatu 7,Turku 1.1a Buildings Five apartment buildings of energy class A. Their E-value of 75 kWhE/m²/year is 22% better than the level required by the building permit (90). A-Kruunu Oy Apartment building, As.oy. Tampereen Valonkajo, Reuharinviitta 2 1.1a Buildings Apartment building of energy class A. Its E-value of 75 kWhE/m²/year is 17% better than the level required by the building permit (90). A-Kruunu Oy Apartment
Apartment building of energy class A. Its E-value of 75 kWhE/m²/year is 17% better than the level required by the building
building, As.oy. Tampereen Satamanvartija, Reuharinviitta 4 1.1a Buildings
permit (90).
53/87 Green Impact Report 2023 Municipality Finance Plc • Green Impact Report 2023
Projects approved in 2023
Oy Apartment building, Tahitinkatu 2
Helsingin kaupungin asunnot Oy Apartment building, Käskynhaltijantie 38
Helsingin kaupungin asunnot Oy Apartment buildings, Saariseläntie 1 and 7
Helsingin kaupungin asunnot Oy Apartment building, Tongankuja 1
Siilinjärven Kotipolku Oy Apartment buildings, Vuorelantie 7a and b
Helsingin kaupungin asunnot Oy Apartment building, Mäenlaskijantie 4
Helsingin kaupungin asunnot Oy Apartment building, Myllypurontie 22
Helsingin kaupungin asunnot Oy Apartment building, Hämeentie 122, Toukola
Mangrove Yhtiöt Oy Apartment building, As.oy. Pirkkalan Torninjuuri 9b
TVT Asunnot Oy Apartment building, As.oy. Turun Hiidenpuoti Ristinpaltankatu 11
Niiralan Kulma Oy Apartment building, Neulastie 6
1.1a Buildings Two apartment buildings of energy class A. Their E-values of 65 and 70 kWhE/m²/year are 28% and 22% better than the level required by the building permit (90).
1.1a Buildings Apartment building of energy class A. Its E-value of 75 kWhE/m²/year is 17% better than the level required by the building permit (90).
1.1a Buildings Two apartment buildings of energy class A. Their E-values of 70 and 72 kWhE/m²/year are 22% and 20% better than the level required by the building permit (90).
1.1a Buildings Apartment building of energy class A. Its E-value of 73 kWhE/m²/year is 19% better than the level required by the building permit (90).
1.1a Buildings Five-storey apartment building of energy class A. Its E-value of 75 kWhE/m²/year is 17% better than the level required by the building permit (90).
1.2 Renovations
1.2 Renovations
1.2 Renovations
1.1a Buildings
1.1a Buildings
1.1a Buildings
Renovation of a concrete building, including switching from oil heating to a hybrid system combining geothermal and district heating. The E-value will improve from 213 to 67 kWhE/m²/year, representing an improvement of 69% in energy efficiency.
Renovation of three apartment buildings, improving energy efficiency by 55%
Renovation of an apartment building, including switching into a combination of geothermal and district heating. Energy efficiency is improved by 32%.
Apartment building of energy class A. Its E-value of 72 kWhE/m²/year is 20% better than the level required by the building permit (90).
Apartment building of energy class A. Its E-value of 75 kWhE/m²/year is 17% better than the level required by the building permit (90).
Terraced house of energy class A. Its E-value of 79 kWhE/m²/year is 25% better than the level required by the building permit (105).
Buildings Number approved: 119 Share of all projects approved in 2023: 88 % Customer Project Subcategory Description Helsingin Asumisoikeus Oy Apartment building, Verkkosaari, Kalasatama 1.1a Buildings Apartment building of energy class A. Its E-value of 75 kWhE/m²/year is 17% better than the level required by the building permit (90). Helsingin kaupungin asunnot Oy Apartment building, Maustetehtaankatu 2 1.1a Buildings Apartment building of energy class A. Its E-value of 68 kWhE/m²/year is 24% better than the level required by the building permit (90). Helsingin kaupungin asunnot Oy Apartment building, Pilkkikuja 2 1.1a Buildings Two apartment buildings of energy class A. Their E-value of 74 kWhE/m²/year is 18% better than the level required by the building permit (90). Helsingin kaupungin asunnot Oy Apartment building, Verkkosaarenkatu 6 1.1a Buildings Apartment building of energy class A. Its E-value of 69 kWhE/m²/year is 23% better than the level required by the building permit. Helsingin kaupungin asunnot
54/87 Green Impact Report 2023 Municipality Finance Plc • Green Impact Report 2023
Projects approved in 2023
Kiinteistö Oy Sotkanmaa Apartment building, Konstankuja 2
Helsingin kaupungin asunnot Oy Apartment building, Maapadontie 2
Avain Asumisoikeus Oy Apartment building, Kotirinteentie 3
Varsinais-Suomen Asumisoikeus Oy Apartment building, Kirstinpuisto, Kirstintasku 2
TA-Yhtymä Oy Apartment building, As.oy. Espoon Karakalliontie 10
of 68 kWhE/m²/year is 24% better than the level required by the building permit (90). The project pilots a unique method of recycling biowaste.
1.1a Buildings Apartment building of energy class A. Its E-value of 71 kWhE/m²/year is 21% better than the level required by the building permit (90).
1.1a Buildings Apartment building of energy class A. Its E-value of 66 kWhE/m²/year is 27% better than the level required by the building permit (90).
1.1a Buildings Three-unit terraced house complex of energy class A. The units’ E-values of 66–68 kWhE/m²/year are 35–37% better than the level required by the building permit (105).
1.1a Buildings Two apartment buildings of energy class A. Their E-value of 72 kWhE/m²/year is 20% better than the level required by the building permit (90).
1.1a Buildings Apartment building of energy class A. Its E-value of 70 kWhE/m²/year is 22% better than the level required by the building permit (90).
Buildings Number approved: 119 Share of all projects approved in 2023: 88 % Customer Project Subcategory Description Niiralan Kulma Oy Apartment building, Urheilukatu 5 1.1a Buildings Apartment building of energy class A. Its E-value of 71 kWhE/m²/year is 21% better than the level required by the building permit (90). Avain Yhtiöt Oy Apartment building, As.oy. Sipoon Kalliomäenkaari 5 1.1a Buildings Apartment building of energy class A. Its E-value of 70 kWhE/m²/year is 22% better than the level required by the building permit (90). The project includes carbon calculations. Y-Säätiö/Kiinteistö Oy M2-Kodit Apartment building, As.oy. Espoon Kokinniityn Poimulehti 1.1a Buildings Apartment building of energy class A. Its E-value of 75 kWhE/m²/year is 17% better than the level required by the building permit (90). Pirkan Opiskelija-asunnot Oy Apartment building, Hipposkylänkuja 6 (hipposkylä) 1.1a Buildings New apartment building of energy class A. Its E-value
55/87 Green Impact Report 2023 Municipality Finance Plc • Green Impact Report 2023
Case: Sivakka provides affordable housing that puts environmental values first
Case
Sivakka provides affordable housing that puts environmental values first
Owned by the City of Oulu, Sivakka provides affordable rental apartments in the Oulu region. The company has integrated environmental goals into its daily work and has a fifteen-year track record in investments into energy savings.
Sivakka takes an ambitious approach to energy efficiency: energy class A is its minimum requirement for new properties. Built using MuniFin’s green finance, the housing complex at Hiirihaukantie 12 A uses a new innovative hybrid heating system that is hoped to spread across Europe. It is part of an EU-level research project with the goal of producing replicable and scalable heating solutions.
The hybrid system utilises heat pumps, recaptured district heating and various types of waste heat. Complementary technological solutions such as waste water heat recovery, precise room monitoring, air volume control, and preheating and cooling from ground sources all help to optimise energy consumption and enhance living conditions.
Energy class A is the minimum requirement for new properties. “
Sivakka has significantly reduced water consumption across its 8,400 apartments by investing in remotely readable water meters and creating a new billing and measurement system. The company has also paid special attention to its waste management: the recycling rate in its buildings is well above national and EU targets, reaching up to 62%.
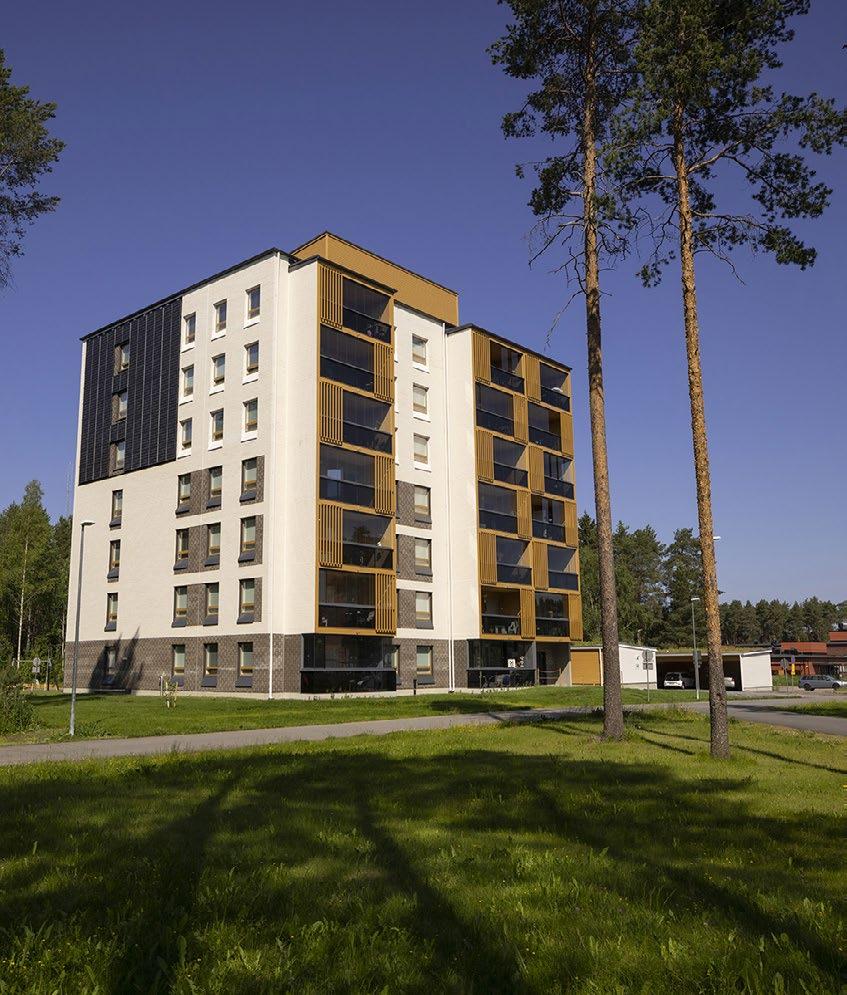
bond Green 56/87 Green Impact Report 2023 Municipality Finance Plc • Green Impact Report 2023
Photo: Oulun Sivakka
Transportation Number approved: 13 Share of all projects approved in 2023 10 % Customer Project Sub-category Description Luoto Municipality Citroën ë-Jumpy (BEV) 2.3 Passenger cars and light commercial vehicles Leasing of electric cars. Luoto Municipality Citroën ë-Berlingo (BEV, 2 vehicles) 2.3 Passenger cars and light commercial vehicles Leasing of electric cars. City of Raasepori BYD ETP 3 (BEV) 2.3 Passenger cars and light commercial vehicles Leasing of electric cars. City of Savonlinna Ford E-Transit (BEV) 2.3 Passenger cars and light commercial vehicles Leasing of electric cars. City of Seinäjoki Nissan Van Electric (BEV) 2.3 Passenger cars and light commercial vehicles Leasing of electric cars. City of Seinäjoki Citroën ë-Jumpy (BEV, 4 vehicles) 2.3 Passenger cars and light commercial vehicles Leasing of electric cars. City of Turku Ford E-Transit (BEV) 2.3 Passenger cars and light commercial vehicles Leasing of electric cars. City of Turku Renault Zoe (BEV, 5 vehicles) 2.3 Passenger cars and light commercial vehicles Leasing of electric cars. City of Turku MB EQE (BEV) 2.3 Passenger cars and light commercial vehicles Leasing of electric cars. City of Turku Citroën ë-Jumpy (BEV, 3 vehicles) 2.3 Passenger cars and light commercial vehicles Leasing of electric cars. City of Turku GOUPIL G4 (BEV, 3 vehicles) 2.3 Passenger cars and light commercial vehicles Leasing of electric cars. Wellbeing services county of Kymenlaakso Volkswagen ID.4 Pro (BEV) 2.3 Passenger cars and light commercial vehicles Leasing of electric cars. Wellbeing services county of Kymenlaakso Audi Q4 e-tron (BEV) 2.3 Passenger cars and light commercial vehicles Leasing of electric cars. Water and waste water management Number approved: 2 Share of all projects approved in 2023 1 % Customer Project Sub-category Description Pyhäntä Municipality Waste water pretreatment plant of Pyhäntä 4.2 Existing waste water facilities Waste water pretreatment plant built as a part of a circular economy project. The plant improves the efficiency of wastewater treatment and reduces the load on the central plant (50% of the estimated load for 2027), thereby improving its available capacity. The plant can recover nutrients from waste water and use them to produce fertiliser. The plant also has a separate biogas facility which can recover energy. Tampereen Seudun Keskuspuhdistamo Oy Waste water treatment plant of Sulkavuori 4.1 New waste water facilities Central waste water treatment plant, which treats water mechanically, chemically and biologically, reaching a daily capacity of 100,000 m3 of waste water upon completion. The plant will increase the amount of water treated and decrease the load on the receiving water bodies. The anaerobic digestion process produces biogas, which is converted into electricity and heat for the plant’s own needs. 57/87 Green Impact Report 2023 Municipality Finance Plc • Green Impact Report 2023
Case
Jokeri Light Rail speeds up low-emission public transport in the Helsinki Metropolitan Area
In October 2023, the Helsinki Metropolitan Area received a significant upgrade to its busiest bus service, trunk line 550, when it was replaced by the Jokeri Light Rail, line 15.
The region’s population has been growing steadily for decades and is expected to only keep growing. The bus line 550 was no longer able to meet the growing number of passengers although it served more than 40,000 passengers on weekdays. The Jokeri Light Rail more than doubles the passenger capacity and travels mostly on its own lane with traffic signal priority, ensuring faster, smoother and more sustainable transport.
As one of the region’s first significant rail investments in years, the project is not only profitable through its land use benefits, but it is also expected to increase the appeal of the districts connected by the rail line. The City of Helsinki, the City of Espoo and Metropolitan Area Transport Ltd implemented the project using an alliance model and secured partial financing through MuniFin’s green finance.
Factors contributing to MuniFin’s decision to grant the project green finance included the comprehensive consideration of biodiversity in the project plans and the establishment of a dedicated environmental working group, environmental training and environmental guidebook
Rail traffic is not only a sustainable but also a reliable form of transport. “
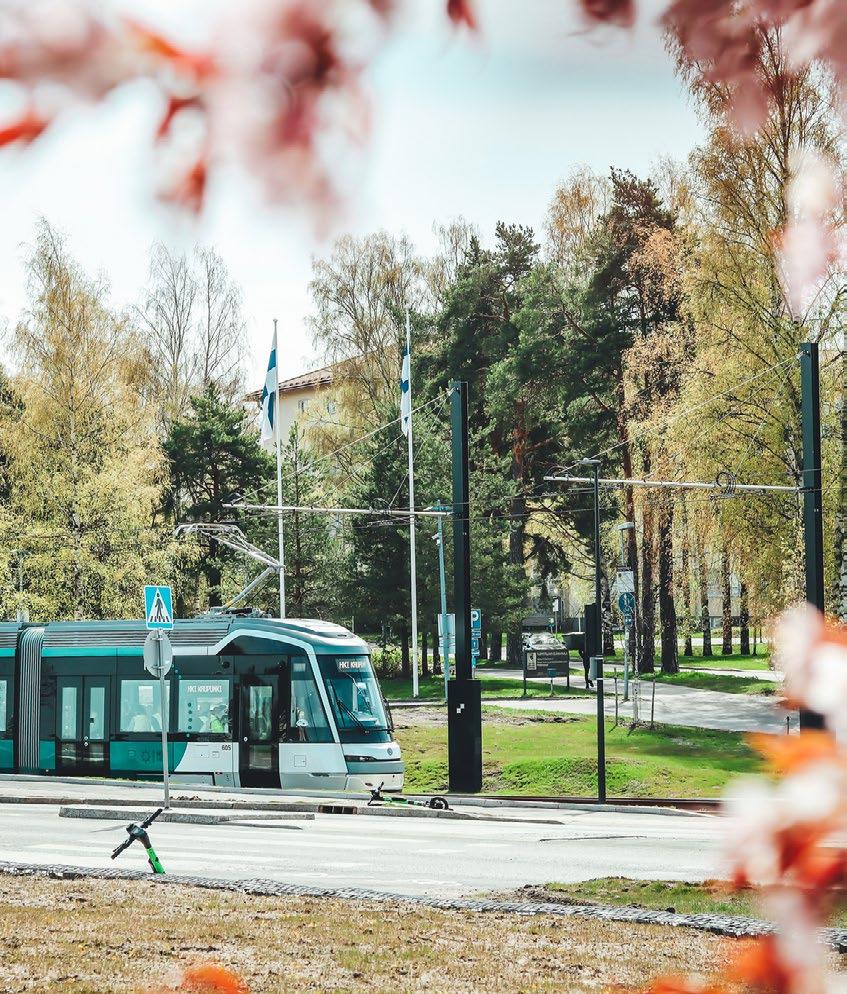
bond Green 58/87 Green Impact Report 2023 Municipality Finance Plc • Green Impact Report 2023
Photo: Raide-Jokeri / Metropolitan Area Transport
Case: Jokeri Light Rail speeds up low-emission public transport in the Helsinki Metropolitan Area
Green finance projects and impacts
Green finance projects and impacts
1 The new law of 2018 concerning energy performance certificates reduced the coefficients of certain energy types used in the calculation of E-values and made the legal threshold of energy efficiency for new buildings stricter. Using new coefficients, the E-values of the buildings built under the old law of 2013 would decrease, which could enhance their EPC classes.
2 The E-value represents a building’s calculated annual consumption of purchased energy per the heated net area (kWhE/m2/year) based on the usage default values and of the building’s intended use category and weighted by energy source coefficients.
3 Impacts calculated only for the new construction part of the project.
4 Experimental project, please see additional information on page 26
Buildings: New buildings Customer Project Sub-category Year of approval Energy Performance Certificate class EPC year1 E-value2 (kWh/m2/ year) Outstanding amount 31 Dec 2023 (€) Unwithdrawn credit commitment 31 Dec 2023 (€) Total committed finance 31 Dec 2023 (€) MuniFin’s estimated share of finance 31 Dec 2023 Annual energy savings (avoided / reduced MWh) Annual CO₂ emissions (avoided / reduced tCO₂) City of Akaa Comprehensive school of Viiala with Nordic ecolabel 1.1a Buildings 2022 A 2018 87 29,150,000 - 29,150,000 97% 109 4 A-Kruunu Oy Apartment building, As.oy. Tampereen Satamanvartija, Reuharinviitta 4 1.1a Buildings 2023 A 2018 75 - 5,130,000 5,130,000 0% -A-Kruunu Oy Apartment building, As.oy. Tampereen Valonkajo, Reuharinviitta 2 1.1a Buildings 2023 A 2018 75 - 5,272,500 5,272,500 0% -A-Kruunu Oy Apartment building, Konttinosturinkuja 4 1.1a Buildings 2023 A 2018 75 2,890,000 6,194,000 9,084,000 32% 11 2 A-Kruunu Oy Apartment building, Lavakatu 9b, Helsinki 1.1a Buildings 2022 A 2018 75 3,900,000 16,773,617 20,673,617 19% 8 1 A-Kruunu Oy Apartment building, Syvänsalmenkatu 5 b 1.1a Buildings 2020 A 2018 71 8,744,489 - 8,744,489 99% 61 5 A-Kruunu Oy Apartment building, Verkkosaarenranta 18 1.1a Buildings 2022 A 2018 75 7,800,000 10,901,155 18,701,155 42% 36 5 Asuntosäätiön Asumisoikeus Oy Apartment building, As.oy. Kangasrinteen sananjalka 1.1a Buildings 2023 A 2018 75 4,650,000 1,392,625 6,042,625 77% 30 2 Asuntosäätiön Asumisoikeus Oy Apartment building, Helsingin verkkoneula 4 1.1a Buildings 2022 A 2018 74 5,300,000 3,956,071 9,256,071 57% 26 4 Asuntosäätiön Asumisoikeus Oy Apartment building with Nordic Ecolabel, Karakalliontie 1 1.1a Buildings 2020 A 2018 75 7,235,178 - 7,235,178 99% 45 2 Asuntosäätiön Asumisoikeus Oy Apartment building, Klaavuntie 13 1.1a Buildings 2022 A 2018 75 7,140,000 553,132 7,693,132 93% 103 16
59/87 Green Impact Report 2023 Municipality Finance Plc • Green Impact Report 2023
1 The new law of 2018 concerning energy performance certificates reduced the coefficients of certain energy types used in the calculation of E-values and made the legal threshold of energy efficiency for new buildings stricter. Using new coefficients, the E-values of the buildings built under the old law of 2013 would decrease, which could enhance their EPC classes.
2 The E-value represents a building’s calculated annual consumption of purchased energy per the heated net area (kWhE/m2/year) based on the usage default values and of the building’s intended use category and weighted by energy source coefficients.
3 Impacts calculated only for the new construction part of the project.
4 Experimental project, please see additional information on page 26
Customer Project Sub-category Year of approval Energy Performance Certificate class EPC year1 E-value2 (kWh/m2/ year) Outstanding amount 31 Dec 2023 (€) Unwithdrawn credit commitment 31 Dec 2023 (€) Total committed finance 31 Dec 2023 (€) MuniFin’s estimated share of finance 31 Dec 2023 Annual energy savings (avoided / reduced MWh) Annual CO₂ emissions (avoided / reduced tCO₂) Asuntosäätiön Asumisoikeus Oy Apartment building, Kuormakatu 6 1.1a Buildings 2022 A 2018 75 16,000,000 3,834,756 19,834,756 81% 26 4 Asuntosäätiön Asumisoikeus Oy Apartment building, Saaristolaivastonkatu 18 1.1a Buildings 2023 A 2018 69 - 15,167,813 15,167,813 0% -Asuntosäätiön Vuokra-asunnot Oy Apartment building, Hannuksenkuja 17 1.1a Buildings 2022 A 2018 71 16,100,000 3,621,944 19,721,944 82% 114 9 Avain Asumisoikeus Oy Apartment building, As.oy .Tuusulan Pioni 1.1a Buildings 2022 A 2018 74 5,369,267 - 5,369,267 88% 32 1 Avain Asumisoikeus Oy Apartment building, As.oy. Hyvinkään Yli-Jurvankatu 5 1.1a Buildings 2021 A 2018 75 7,936,510 41,070 7,977,580 99% 47 2 Avain Asumisoikeus Oy Apartment building, As.oy. Jyväskylän Timoteiraitti 9-11 1.1a Buildings 2023 A 2018 70-74 870,776 6,385,691 7,256,467 12% 8Avain Asumisoikeus Oy Apartment building, As.oy. Järvenpään Kultapiisku 1.1a Buildings 2021 A 2018 75 14,570,283 - 14,570,283 99% 25 1 Avain Asumisoikeus Oy Apartment building, As.oy. Keravan Niittäjänkatu 2 ja 4 1.1a Buildings 2021 A 2018 78-79 5,209,763 - 5,209,763 99% 42 2 Avain Asumisoikeus Oy Apartment building, As.oy. Kirkkonummen Pilvijärventie 15 1.1a Buildings 2023 A 2018 74-80 1,957,339 7,829,354 9,786,693 20% 7Avain Asumisoikeus Oy Apartment building, As.oy. Opistokuja 5 1.1a Buildings 2022 A 2018 74 11,881,716 - 11,881,716 100% 77 5 Avain Asumisoikeus Oy Apartment building, As.oy. Tuusulan Freesia 1.1a Buildings 2022 A 2018 74 7,560,882 - 7,560,882 89% 41 2 Avain Asumisoikeus Oy Apartment building, As.oy. Vantaan Ajoportti 1.1a Buildings 2021 A 2018 73 22,121,535 308,685 22,430,220 98% 155 6 Avain Asumisoikeus Oy Apartment building, Kotirinteentie 3 1.1a Buildings 2023 A 2018 66-68 - 9,317,807 9,317,807 0% -Avain Vuokra10 Oy Apartment building, As.oy. Helsingin Asemalaituri, Lautatarhantie 8b 1.1a Buildings 2022 A 2018 74 10,317,762 8,021,979 18,339,741 56% 46 7 Avain Vuokra10 Oy Apartment building, Alhotie 19 1.1a Buildings 2022 A 2018 74-75 20,146,208 1,951,114 22,097,322 91% 110 4
Buildings: New buildings
60/87 Green Impact Report 2023 Municipality Finance Plc • Green Impact Report 2023
1 The new law of 2018 concerning energy performance certificates reduced the coefficients of certain energy types used in the calculation of E-values and made the legal threshold of energy efficiency for new buildings stricter. Using new coefficients, the E-values of the buildings built under the old law of 2013 would decrease, which could enhance their EPC classes.
2 The E-value represents a building’s calculated annual consumption of purchased energy per the heated net area (kWhE/m2/year) based on the usage default values and of the building’s intended use category and weighted by energy source coefficients.
3 Impacts calculated only for the new construction part of the project.
4 Experimental project, please see additional information on page 26
Customer Project Sub-category Year of approval Energy Performance Certificate class EPC year1 E-value2 (kWh/m2/ year) Outstanding amount 31 Dec 2023 (€) Unwithdrawn credit commitment 31 Dec 2023 (€) Total committed finance 31 Dec 2023 (€) MuniFin’s estimated share of finance 31 Dec 2023 Annual energy savings (avoided / reduced MWh) Annual CO₂ emissions (avoided / reduced tCO₂) Avain Vuokra10 Oy Apartment building, As.oy. Kuopion Kuikkalampi 1.1a Buildings 2021 A 2018 75 5,103,901 - 5,103,901 98% 38 1 Avain Yhtiöt Oy Apartment building, As.oy. Sipoon Kalliomäenkaari 5 1.1a Buildings 2023 A 2018 70 - 4,914,777 4,914,777 0% -Avara Vuokrakodit I Ky Apartment building, As.oy. Helsingin veturitie 18 1.1a Buildings 2023 A 2018 75 - 35,484,132 35,484,132 0% -Avara Vuokrakodit Ky/Avara Deka Oy Apartment building, As.oy. Helsingin Tulistimenkatu 1.1a Buildings 2023 A 2018 73 2,327,640 7,370,857 9,698,497 24% 11 2 EAI Vuokra-asunnot Oy Apartment building, As.oy. Helsingin Vetonaula 1.1a Buildings 2020 A 2018 68-75 6,805,556 - 6,805,556 97% 66 2 Espoon Asunnot Oy Apartment building, Anna Sahlsteninkatu 13 1.1a Buildings 2023 A 2018 68 - 14,316,400 14,316,400 0% -Espoon Asunnot Oy Apartment building, Riihitontuntie 7 1.1a Buildings 2023 A 2018 70-71 - 19,070,000 19,070,000 0% -Espoon Asunnot Oy Apartment building, Syvänsalmenkatu 1 1.1a Buildings 2021 A 2018 72 15,485,527 - 15,485,527 99% 109 9 Etelä-Suomen Kodit Oy Apartment building, As.oy. Turun Löytöretkeilijä 1.1a Buildings 2019 A 2018 74 5,318,685 - 5,318,685 97% 40 2 Etelä-Suomen Kodit Oy Apartment building, As.oy. Turun Viridi 1.1a Buildings 2020 A 2018 73 5,144,054 - 5,144,054 98% 41 2 City of Forssa Community centre Akvarelli 1.1a Buildings 2019 A 2018 73 20,618,920 - 20,618,920 90% 232 8 City of Haapavesi Secondary school and high school of Haapavesi 1.1a Buildings 2020 A 2018 89 14,640,000 - 14,640,000 94% 74 6 Hausjärvi Municipality Comprehensive school of Oitti 1.1a Buildings 2023 A 2018 88 5,000,000 - 5,000,000 100% 23City of Heinola School and daycare centre of Kailaa 1.1a Buildings 2023 A 2018 75 14,625,000 - 14,625,000 98% 174 7 Heinävesi Municipality Middle school of Heinävesi 1.1a Buildings 2020 A 2018 72 8,105,299 - 8,105,299 90% 80 5 Helsingin Asumisoikeus Oy Apartment building, Asetelmanpolku 3 1.1a Buildings 2021 A 2018 72 8,330,000 2,082,500 10,412,500 80% 60 10 Helsingin Asumisoikeus Oy Apartment buildings, Atlantinkaari and Länsisatamankatu 37 1.1a Buildings 2020 A 2018 74 42,364,850 - 42,364,850 100% 239 35
Buildings: New buildings
61/87 Green Impact Report 2023 Municipality Finance Plc • Green Impact Report 2023
1 The new law of 2018 concerning energy performance certificates reduced the coefficients of certain energy types used in the calculation of E-values and made the legal threshold of energy efficiency for new buildings stricter. Using new coefficients, the E-values of the buildings built under the old law of 2013 would decrease, which could enhance their EPC classes.
2 The E-value represents a building’s calculated annual consumption of purchased energy per the heated net area (kWhE/m2/year) based on the usage default values and of the building’s intended use category and weighted by energy source coefficients.
3 Impacts calculated only for the new construction part of the project.
4 Experimental project, please see additional information on page 26
Customer Project Sub-category Year of approval Energy Performance Certificate class EPC year1 E-value2 (kWh/m2/ year) Outstanding amount 31 Dec 2023 (€) Unwithdrawn credit commitment 31 Dec 2023 (€) Total committed finance 31 Dec 2023 (€) MuniFin’s estimated share of finance 31 Dec 2023 Annual energy savings (avoided / reduced MWh) Annual CO₂ emissions (avoided / reduced tCO₂) Helsingin Asumisoikeus Oy Apartment buildings, Fannynkallio and Kuninkaankierto 4 1.1a Buildings 2017 B 2013 98-108 15,876,965 - 15,876,965 97% 251 38 Helsingin Asumisoikeus Oy Apartment building, Gunillanpuisto 1.1a Buildings 2022 A 2018 70-71 - 17,812,031 17,812,031 0% -Helsingin Asumisoikeus Oy Apartment buildings, Jamaika Haitinkuja 3, Jamaikankatu 1 and Kanariankatu 7 1.1a Buildings 2019 B 2018 79 14,900,872 - 14,900,872 98% 31 5 Helsingin Asumisoikeus Oy Apartment building, Kettutie 10 1.1a Buildings 2021 A 2018 73 10,769,698 - 10,769,698 99% 71 10 Helsingin Asumisoikeus Oy Apartment building, Koskelantie 66b 1.1a Buildings 2020 B 2018 77-79 27,100,125 3,011,125 30,111,250 90% 128 19 Helsingin Asumisoikeus Oy Apartment building, Yläkiventie 11 1.1a Buildings 2021 A 2018 75 6,046,350 359,665 6,406,015 93% 36 6 Helsingin Asumisoikeus Oy Apartment buildings, Postiljooni Lavakatu 3 1.1a Buildings 2019 A 2018 75 20,573,834 - 20,573,834 99% 126 16 Helsingin Asumisoikeus Oy Apartment buildings, Postimies Lavakatu 3 1.1a Buildings 2019 A 2018 75 16,890,203 - 16,890,203 97% 100 13 Helsingin Asumisoikeus Oy Apartment building, Samoansaari, Jätkäsaari 1.1a Buildings 2023 A 2018 74 - 16,334,938 16,334,938 0% -Helsingin Asumisoikeus Oy Apartment building, Smoltinkuja 3 1.1a Buildings 2021 A 2018 67 16,263,866 - 16,263,866 100% 103 4 Helsingin Asumisoikeus Oy Apartment building, Verkkosaari, Kalasatama 1.1a Buildings 2023 A 2018 75 - 22,731,867 22,731,867 0% -Helsingin Asumisoikeus Oy Apartment building, Lavakatu 12/Veturitie 58 1.1a Buildings 2020 A 2018 72 18,547,000 - 18,547,000 100% 151 19 Helsingin Asumisoikeus Oy Apartment building, Yläkivenrinne 2 1.1a Buildings 2021 A 2018 74 7,578,631 - 7,578,631 100% 50 8 Helsingin kaupungin asunnot Oy Apartment building, Asetelmankatu 1 1.1a Buildings 2021 A 2018 73-75 8,596,000 3,684,000 12,280,000 70% 51 8 Helsingin kaupungin asunnot Oy Apartment building, Gunillantie 3 1.1a Buildings 2022 A 2018 65-66 12,609,886 8,412,000 21,021,886 60% 95 4 Helsingin kaupungin asunnot Oy Apartment building, Haakoninlahdenkatu 5-7 1.1a Buildings 2019 B 2018 80 24,693,438 - 24,693,438 97% 94 14 Helsingin kaupungin asunnot Oy Apartment building, Isonnevankuja 1 1.1a Buildings 2019 B 2018 85 7,889,935 - 7,889,935 97% 15 2
Buildings: New buildings
62/87 Green Impact Report 2023 Municipality Finance Plc • Green Impact Report 2023
1 The new law of 2018 concerning energy performance certificates reduced the coefficients of certain energy types used in the calculation of E-values and made the legal threshold of energy efficiency for new buildings stricter. Using new coefficients, the E-values of the buildings built under the old law of 2013 would decrease, which could enhance their EPC classes.
2 The E-value represents a building’s calculated annual consumption of purchased energy per the heated net area (kWhE/m2/year) based on the usage default values and of the building’s intended use category and weighted by energy source coefficients.
3 Impacts calculated only for the new construction part of the project.
4 Experimental project, please see additional information on page 26
Customer Project Sub-category Year of approval Energy Performance Certificate class EPC year1 E-value2 (kWh/m2/ year) Outstanding amount 31 Dec 2023 (€) Unwithdrawn credit commitment 31 Dec 2023 (€) Total committed finance 31 Dec 2023 (€) MuniFin’s estimated share of finance 31 Dec 2023 Annual energy savings (avoided / reduced MWh) Annual CO₂ emissions (avoided / reduced tCO₂) Helsingin kaupungin asunnot Oy Apartment building, Kalasatama Kaljaasi, Fortunankatu 6 1.1a Buildings 2021 A 2018 67 17,839,542 - 17,839,542 100% 129 14 Helsingin kaupungin asunnot Oy Apartment building, Kanariankatu 3 1.1a Buildings 2019 B 2018 79 15,924,459 - 15,924,459 97% 57 9 Helsingin kaupungin asunnot Oy Apartment building, Kaupinmäenpolku 15 1.1a Buildings 2019 B 2018 80 5,861,870 - 5,861,870 97% 23 3 Helsingin kaupungin asunnot Oy Apartment buildings, Kettutie 8 a-c 1.1a Buildings 2021 A 2018 73-75 17,092,244 - 17,092,244 99% 99 15 Helsingin kaupungin asunnot Oy Apartment building, Koskelantie 66 1.1a Buildings 2020 B 2018 76-78 24,764,050 4,414,644 29,178,694 84% 115 17 Helsingin kaupungin asunnot Oy Apartment building, Kustinpolku 7 1.1a Buildings 2019 A 2018 75 23,001,286 - 23,001,286 98% 135 16 Helsingin kaupungin asunnot Oy Apartment building, Kyösti Kallion tie 1a 1.1a Buildings 2019 A 2018 75-77 8,937,294 397,449 9,334,743 92% 43 7 Helsingin kaupungin asunnot Oy Apartment building, Käskynhaltijantie 38 1.1a Buildings 2023 A 2018 75 - 22,673,185 22,673,185 0% -Helsingin kaupungin asunnot Oy Apartment building, Lavakatu 10 1.1a Buildings 2020 A 2018 72-75 23,724,173 2,661,365 26,385,538 89% 153 20 Helsingin kaupungin asunnot Oy Apartment building, Maapadontie 2 1.1a Buildings 2023 A 2018 71 - 10,880,000 10,880,000 0% -Helsingin kaupungin asunnot Oy Apartment building, Maununnevantie 3 1.1a Buildings 2021 A 2018 70-74 25,886,000 2,880,000 28,766,000 90% 164 6 Helsingin kaupungin asunnot Oy Apartment building, Maustetehtaankatu 2 1.1a Buildings 2023 A 2018 68 - 29,090,681 29,090,681 0% -Helsingin kaupungin asunnot Oy Apartment building, Pilkkikuja 2 1.1a Buildings 2023 A 2018 74 - 16,581,744 16,581,744 0% -Helsingin kaupungin asunnot Oy Apartment building, Postiljooninkatu 2 1.1a Buildings 2021 A 2018 73 27,506,166 11,788,360 39,294,526 70% 165 21 Helsingin kaupungin asunnot Oy Apartment building, Pyhätunturintie 2 1.1a Buildings 2019 B 2018 77-88 22,113,238 - 22,113,238 97% 89 13 Helsingin kaupungin asunnot Oy Apartment buildings, Saariseläntie 1 and 7 1.1a Buildings 2023 A 2018 70-72 - 17,437,777 17,437,777 0% -Helsingin kaupungin asunnot Oy Apartment building, Salavakuja 2 1.1a Buildings 2021 A 2018 69-70 16,852,072 - 16,852,072 99% 82 3 Helsingin kaupungin asunnot Oy Apartment building, Sienakuja 4 1.1a Buildings 2017 B 2013 95-103 9,360,530 - 9,360,530 97% 141 21 Helsingin kaupungin asunnot Oy Apartment building, Smoltinkaari 6 1.1a Buildings 2021 A 2018 67 13,014,613 - 13,014,613 100% 96 4
Buildings: New buildings
63/87 Green Impact Report 2023 Municipality Finance Plc • Green Impact Report 2023
1 The new law of 2018 concerning energy performance certificates reduced the coefficients of certain energy types used in the calculation of E-values and made the legal threshold of energy efficiency for new buildings stricter. Using new coefficients, the E-values of the buildings built under the old law of 2013 would decrease, which could enhance their EPC classes.
2 The E-value represents a building’s calculated annual consumption of purchased energy per the heated net area (kWhE/m2/year) based on the usage default values and of the building’s intended use category and weighted by energy source coefficients.
3 Impacts calculated only for the new construction part of the project.
4 Experimental project, please see additional information on page 26
Customer Project Sub-category Year of approval Energy Performance Certificate class EPC year1 E-value2 (kWh/m2/ year) Outstanding amount 31 Dec 2023 (€) Unwithdrawn credit commitment 31 Dec 2023 (€) Total committed finance 31 Dec 2023 (€) MuniFin’s estimated share of finance 31 Dec 2023 Annual energy savings (avoided / reduced MWh) Annual CO₂ emissions (avoided / reduced tCO₂) Helsingin kaupungin asunnot Oy Apartment building, Svanströminkuja 5 1.1a Buildings 2023 A 2018 73 - 14,810,046 14,810,046 0% -Helsingin kaupungin asunnot Oy Apartment building, Tahitinkatu 2 1.1a Buildings 2023 A 2018 65-70 - 19,820,247 19,820,247 0% -Helsingin kaupungin asunnot Oy Apartment building, Taidemaalarinkatu 2 1.1a Buildings 2017 B 2013 71-105 13,845,331 - 13,845,331 97% 217 34 Helsingin kaupungin asunnot Oy Apartment building, Tongankuja 1 1.1a Buildings 2023 A 2018 73 - 15,613,543 15,613,543 0% -Helsingin kaupungin asunnot Oy Apartment building, Tullivuorentie 22 1.1a Buildings 2019 B 2018 78-82 12,435,010 - 12,435,010 97% 73 11 Helsingin kaupungin asunnot Oy Apartment building, Verkkosaarenkatu 6 1.1a Buildings 2023 A 2018 69 - 26,262,888 26,262,888 0% -Helsingin kaupungin asunnot Oy Apartment building, Yläkiventie 14 1.1a Buildings 2021 A 2018 75 6,491,955 246,475 6,738,430 95% 37 6 Foundation for student housing in the Helsinki region Apartment building, HOAS Huippu, Höyrykatu 1 1.1a Buildings 2023 A 2018 75 - 56,443,599 56,443,599 0% -Hollola Municipality School of Heinsuo 1.1a Buildings 2016 B 2013 109 14,556,531 - 14,556,531 85% 430 18 Hollola Municipality School of Kalliola 1.1a Buildings 2016 B 2013 116 13,772,711 - 13,772,711 85% 300 13 City of Hyvinkää Community centre Hangonsiltatalo 1.1a Buildings 2019 B 2018 93 20,000,000 - 20,000,000 80% 60 5 Hämeenkyrö Municipality Environmental school of Mahnala 1.1a Buildings 2017 B 2013 95 3,966,671 - 3,966,671 57% 138 5 City of Hämeenlinna Comprehensive school and sportshall of Hämeenlinna (The Building Information Foundation (RTS) certfication) 1.1a Buildings 2023 A 2018 60-75 20,000,000 - 20,000,000 100% 186 6 City of Hämeenlinna Service centre of Nummi 1.1a Buildings 2016 A 2013 88 21,481,959 - 21,481,959 86% 703 21 Ii Municipality Daycare centre of Hamina 1.1a Buildings 2021 A 2018 86 3,400,000 - 3,400,000 85% 17 2 City of Imatra School campus of Mansikkala (LEED certification) 1.1a Buildings 2018 B 2013 102 38,571,430 - 38,571,430 86% 909 20 Inari Municipality Ivalo education centre (The Building Information Foundation (RTS) certfication) 1.1a Buildings 2020 A 2018 73 25,684,335 - 25,684,335 95% 220 14 Ingå Municipality Kyrkfjärdens School of Ingå 1.1a Buildings 2022 A 2018 70 9,000,000 - 9,000,000 90% 78 3
Buildings: New buildings
64/87 Green Impact Report 2023 Municipality Finance Plc • Green Impact Report 2023
1 The new law of 2018 concerning energy performance certificates reduced the coefficients of certain energy types used in the calculation of E-values and made the legal threshold of energy efficiency for new buildings stricter. Using new coefficients, the E-values of the buildings built under the old law of 2013 would decrease, which could enhance their EPC classes.
2 The E-value represents a building’s calculated annual consumption of purchased energy per the heated net area (kWhE/m2/year) based on the usage default values and of the building’s intended use category and weighted by energy source coefficients.
3 Impacts calculated only for the new construction part of the project.
4 Experimental project, please see additional information on page 26
Customer Project Sub-category Year of approval Energy Performance Certificate class EPC year1 E-value2 (kWh/m2/ year) Outstanding amount 31 Dec 2023 (€) Unwithdrawn credit commitment 31 Dec 2023 (€) Total committed finance 31 Dec 2023 (€) MuniFin’s estimated share of finance 31 Dec 2023 Annual energy savings (avoided / reduced MWh) Annual CO₂ emissions (avoided / reduced tCO₂) Janakkala Municipality Janakkala fire department 1.1a Buildings 2016 B 2013 103-109 5,523,285 - 5,523,285 85% 121 5 Janakkala Municipality Sportshall, Tervakoski 1.1a Buildings 2019 A 2018 73 3,477,500 - 3,477,500 65% 48 2 Janakkala Municipality School and community centre of Turenki, 1st phase 1.1a Buildings 2021 A 2018 68 20,462,997 - 20,462,997 92% 219 7 City of Joensuu Daycare centre of Hammaslahti 1.1a Buildings 2018 A 2013 80 2,441,738 - 2,441,738 77% 85 1 City of Joensuu Middle school of Heinävaara, modular unit 1.1a Buildings 2018 B 2013 107 3,301,421 - 3,301,421 77% 90 3 City of Joensuu Daycare centre of Hukanhauta 1.1a Buildings 2018 A 2013 90 3,447,518 - 3,447,518 83% 121 1 City of Joensuu School of Karhumäki 1.1a Buildings 2016 A 2013 89 7,565,123 - 7,565,123 80% 302 4 City of Joensuu Mehtimäki sportshall and School of Karsikko 1.1a Buildings 2020 A 2018 80-87 8,905,264 - 8,905,264 95% 216 4 City of Joensuu School of Nepenmäki 1.1a Buildings 2016 B 2013 96 17,597,454 - 17,597,454 87% 692 14 City of Joensuu School of Rantakylä 1.1a Buildings 2018 A 2013 88 11,684,649 - 11,684,649 84% 465 8 City of Jyväskylä Daycare centre and school of Kortepohja, Daycare centre and school of Pohjalampi 1.1a Buildings 2023 A 2018 85 32,600,000 - 32,600,000 100% 42 4 The Student Union of the University of Jyväskylä Apartment building, Kartanonkuja 11 1.1a Buildings 2023 A 2018 68 1,000,000 5,800,000 6,800,000 15% 12 1 City of Jämsä Comprehensive school of Jämsänkoski 1.1a Buildings 2017 B 2013 111 8,470,336 - 8,470,336 86% 223 9 City of Järvenpää School and daycare centre of Harjula, 1st phase of Jyk building, School and daycare centre of Oinaskatu 1.1a Buildings 2023 A 2018 74-82 44,125,000 - 44,125,000 98% 328 13 Järvenpään Mestari-Asunnot Oy Apartment building, As.oy. Wärtsilänkatu 4, Pajalan Helmi 1.1a Buildings 2023 A 2018 75 - 11,800,000 11,800,000 0% -City of Kaarina School of Hoviranta 1.1a Buildings 2022 A 2018 86 14,250,000 - 14,250,000 95% 86 5 City of Kaarina The main library, Kaarinatalo 1.1a Buildings 2017 A 2013 90 5,625,000 - 5,625,000 63% 103 4
Buildings: New buildings
65/87 Green Impact Report 2023 Municipality Finance Plc • Green Impact Report 2023
1 The new law of 2018 concerning energy performance certificates reduced the coefficients of certain energy types used in the calculation of E-values and made the legal threshold of energy efficiency for new buildings stricter. Using new coefficients, the E-values of the buildings built under the old law of 2013 would decrease, which could enhance their EPC classes.
2 The E-value represents a building’s calculated annual consumption of purchased energy per the heated net area (kWhE/m2/year) based on the usage default values and of the building’s intended use category and weighted by energy source coefficients.
3 Impacts calculated only for the new construction part of the project.
4 Experimental project, please see additional information on page 26
Customer Project Sub-category Year of approval Energy Performance Certificate class EPC year1 E-value2 (kWh/m2/ year) Outstanding amount 31 Dec 2023 (€) Unwithdrawn credit commitment 31 Dec 2023 (€) Total committed finance 31 Dec 2023 (€) MuniFin’s estimated share of finance 31 Dec 2023 Annual energy savings (avoided / reduced MWh) Annual CO₂ emissions (avoided / reduced tCO₂) Kaavi Municipality Daycare centre of Kaavi 1.1a Buildings 2023 A 2018 90 2,925,000 - 2,925,000 98% 12 1 City of Kalajoki Fire station of Kalajoki 1.1a Buildings 2017 B 2013 111 1,200,000 - 1,200,000 40% 23 1 City of Kalajoki School of Merenoja 1.1a Buildings 2019 A 2018 81 21,936,779 - 21,936,779 88% 169 6 City of Kangasala Comprehensive school of Lamminrahka 1.1a Buildings 2022 A 2018 67 17,000,000 - 17,000,000 85% 292 19 City of Kangasala School of Ruutana 1.1a Buildings 2023 A 2018 89 17,100,000 - 17,100,000 95% 50 2 City of Kauhava Education centre of Kortesjärvi 1.1a Buildings 2022 A 2018 83 5,600,000 - 5,600,000 93% 54 1 Central Finland Student Housing Foundation (Koas) Multi-generation block, Kankaan Ilona, Ailakinkatu 10 1.1a Buildings 2019 B 2018 76 8,474,458 - 8,474,458 97% 132 11 Central Finland Student Housing Foundation (Koas) Apartment building, Tourulan Hahlo 9, Jyväskylä 1.1a Buildings 2023 A 2018 72 2,604,000 10,473,488 13,077,488 20% 20 2 Kiinteistö Oy Helsingin Toimitilat Comprehensive school of Maatulli 1.1a Buildings 2022 A 2018 62 10,000,000 - 10,000,000 100% 346 22 Kiinteistö Oy Helsingin Toimitilat STAO Myllypuro Campus 1.1a Buildings 2022 A 2018 63 22,000,000 - 22,000,000 46% 156 24 Kiinteistö Oy Helsingin Toimitilat STAO Roihupelto Campus 1.1a Buildings 2022 A 2018 63 40,000,000 - 40,000,000 23% 358 37 Kiinteistö Oy Kuopion Koulutilat School of Jynkkä 1.1a Buildings 2016 B 2013 101 10,239,335 - 10,239,335 71% 294 15 Kiinteistö Oy Kuopion Koulutilat School of Karttula 1.1a Buildings 2016 B 2013 97 9,726,080 - 9,726,080 80% 287 15 Kiinteistö Oy Nikkarinkruunu Apartment building, Myllylenkki 2, Kerava 1.1a Buildings 2023 A 2018 90 1,958,000 2,742,000 4,700,000 42% 31 1 Kiinteistö Oy Sotkanmaa Apartment building, Konstankuja 2 1.1a Buildings 2023 A 2018 71 - 3,531,500 3,531,500 0% -Kiinteistö Oy Turun Syvälahden koulu School of Syvälahti 1.1a Buildings 2017 B 2013 99-204 19,500,000 - 19,500,000 98% 725 37 Kirkkonummi Municipality School centre of Gesterby (The Building Information Foundation (RTS) certfication) 1.1a Buildings 2022 A 2018 63 21,100,416 43,899,584 65,000,000 32% 156 14 Kirkkonummen Vuokra-asunnot Oy Apartment building, Masalan tinapuisto 1.1a Buildings 2020 A 2018 75 14,017,529 - 14,017,529 99% 82 3 City of Kokkola School of Chydenius (Leed certification) 1.1a Buildings 2018 B 2013 127 10,383,572 - 10,383,572 90% 210 14
Buildings: New buildings
66/87 Green Impact Report 2023 Municipality Finance Plc • Green Impact Report 2023
1 The new law of 2018 concerning energy performance certificates reduced the coefficients of certain energy types used in the calculation of E-values and made the legal threshold of energy efficiency for new buildings stricter. Using new coefficients, the E-values of the buildings built under the old law of 2013 would decrease, which could enhance their EPC classes.
2 The E-value represents a building’s calculated annual consumption of purchased energy per the heated net area (kWhE/m2/year) based on the usage default values and of the building’s intended use category and weighted by energy source coefficients.
3 Impacts calculated only for the new construction part of the project.
4 Experimental project, please see additional information on page 26
Customer Project Sub-category Year of approval Energy Performance Certificate class EPC year1 E-value2 (kWh/m2/ year) Outstanding amount 31 Dec 2023 (€) Unwithdrawn credit commitment 31 Dec 2023 (€) Total committed finance 31 Dec 2023 (€) MuniFin’s estimated share of finance 31 Dec 2023 Annual energy savings (avoided / reduced MWh) Annual CO₂ emissions (avoided / reduced tCO₂) City of Kokkola Community centre of Piispanmäki 1.1a Buildings 2023 A 2018 69 13,539,945 30,460,055 44,000,000 30% 143 6 Kolari Municipality Community centre of Kirkonkylä 1.1a Buildings 2023 A 2018 75 8,374,505 13,125,495 21,500,000 36% 57 7 Kontiolahti Municipality School of Lehmo 1.1a Buildings 2022 A 2018 73-86 7,000,000 - 7,000,000 100% 205 13 Mustasaari Municipality School of Smedsby 1.1a Buildings 2023 A 2018 63 18,000,000 - 18,000,000 100% 107 9 Kouvolan Asunnot Oy Apartment building, Halkotorinkuja 4 1.1a Buildings 2023 A 2018 74 9,800,000 - 9,800,000 100% 9 1 City of Kouvola Community centre of Inkeroinen 1.1a Buildings 2023 A 2018 73 7,878,586 27,121,414 35,000,000 23% 52 4 City of Kouvola Daycare centre of Naukio 1.1a Buildings 2021 A 2018 90 3,499,679 321 3,500,000 100% 13 1 City of Kouvola Valkeala community centre 1.1a Buildings 2021 A 2018 69 28,607,360 2,392,640 31,000,000 92% 214 16 City of Kuhmo Wooden comprehensive school of Tuupala 1.1a Buildings 2016 B 2013 120 7,800,000 - 7,800,000 65% 180 14 City of Kuopio Community centre of Riistavesi, Daycare centre of Alava 1.1a Buildings 2022 A 2018 77-88 19,166,668 - 19,166,668 96% 88 6 Kuopio Student Housing Company (Kuopas) Construction of apartment building for students, Ahkio 1.1a Buildings 2019 A 2018 75 5,377,680 - 5,377,680 97% 40 3 Kuopio Student Housing Company (Kuopas) Apartment building, Kuopas Kampus, Savilahdenranta 1.1a Buildings 2023 A 2018 70-72 - 22,207,995 22,207,995 0% -Kuopio Student Housing Company (Kuopas) Apartment building, Minari 1.1a Buildings 2019 A 2018 73 3,896,672 - 3,896,672 99% 35 3 Kuopio Student Housing Company (Kuopas) Construction of apartment building for students, Taivaanpankko 1.1a Buildings 2019 A 2018 63 6,940,350 - 6,940,350 97% 95 8 Kärkölä Municipality Comprehensive school of Kärkölä 1.1a Buildings 2023 A 2018 87 6,365,000 - 6,365,000 71% 32 2 Lahden Asunnot Oy Apartment building, As.oy lahden iisakki 1.1a Buildings 2017 B 2013 99 3,427,328 - 3,427,328 98% 52 2 Lahden Asunnot Oy Apartment building, As.oy lahden valtteri 1.1a Buildings 2017 B 2013 100 5,499,474 - 5,499,474 97% 82 4 Lahden Asunnot Oy Apartment buildings, Jaksonkatu 3 and 5 1.1a Buildings 2023 A 2018 75 14,260,862 - 14,260,862 99% 102 5
Buildings: New buildings
67/87 Green Impact Report 2023 Municipality Finance Plc • Green Impact Report 2023
Buildings: New buildings
1 The new law of 2018 concerning energy performance certificates reduced the coefficients of certain energy types used in the calculation of E-values and made the legal threshold of energy efficiency for new buildings stricter. Using new coefficients, the E-values of the buildings built under the old law of 2013 would decrease, which could enhance their EPC classes.
2 The E-value represents a building’s calculated annual consumption of purchased energy per the heated net area (kWhE/m2/year) based on the usage default values and of the building’s intended use category and weighted by energy source coefficients.
3 Impacts calculated only for the new construction part of the project.
4 Experimental project, please see additional information on page 26
Customer Project Sub-category Year of approval Energy Performance Certificate class EPC year1 E-value2 (kWh/m2/ year) Outstanding amount 31 Dec 2023 (€) Unwithdrawn credit commitment 31 Dec 2023 (€) Total committed finance 31 Dec 2023 (€) MuniFin’s estimated share of finance 31 Dec 2023 Annual energy savings (avoided / reduced MWh) Annual CO₂ emissions (avoided / reduced tCO₂) Lahden Asunnot Oy Apartment building, Kivakatu 2 1.1a Buildings 2020 A 2018 73 8,781,401 - 8,781,401 97% 66 3 Lahden Asunnot Oy Apartment buildings, Laatikkotehtaankatu 5 b and c 1.1a Buildings 2019 A 2018 71 11,263,180 - 11,263,180 96% 101 5 Lahden Asunnot Oy Apartment building, Svinhufvudinkatu 11 1.1a Buildings 2022 A 2018 61 6,168,615 - 6,168,615 99% 74 3 Lahden Asunnot Oy Building for elderly, Uudenpellonkatu 1 1.1a Buildings 2017 B 2013 98 8,144,732 - 8,144,732 98% 97 4 Lahden Asunnot Oy Construction of apartment building, Vanhatie 53 1.1a Buildings 2017 B 2013 100 3,368,384 - 3,368,384 97% 60 3 Lahden Asunnot Oy Construction of apartment building, Vasarantie 2 ja 4 1.1a Buildings 2019 A 2018 68 11,705,333 - 11,705,333 96% 124 6 Lahden Asunnot Oy Community centre of Renkomäki 1.1a Buildings 2023 A 2018 60 25,000,000 - 25,000,000 78% 228 10 Lahden vanhusten asuntosäätiö Senior home, Saimaankatu 29 1.1a Buildings 2019 A 2018 75 7,311,707 - 7,311,707 96% 50 2 Lapinlahti Municipality Matti and Liisa's school in Lapinlahti 1.1a Buildings 2020 A 2018 87 3,300,000 - 3,300,000 83% 44 4 Lappeenrannan Asuntopalvelu Oy Apartment building, Kiviharjunkatu 2 1.1a Buildings 2020 A 2018 74 4,438,555 - 4,438,555 97% 31 2 Laukaa Municipality School of Lievestuore 1.1a Buildings 2017 B 2013 124 10,693,572 - 10,693,572 85% 268 10 Leppävirta Municipality New primary school of Leppävirta 1.1a Buildings 2017 B 2013 127 7,516,286 - 7,516,286 88% 149 15 Liminka Municipality School of Linnukka 1.1a Buildings 2017 B 2013 123 2,000,000 - 2,000,000 40% 112 15 Liperi Municipality School of Kirkonkylä [3] 1.1a Buildings, 1.2 Renovations 2021 A 2018 99 2,400,000 - 2,400,000 80% 2Liperi Municipality School of Ylämylly 1.1a Buildings 2021 A 2018 90 5,250,000 - 5,250,000 75% 60 1 Luksia, Länsi-Uudenmaan koulutuskuntayhtymä Construction and renovation of Toivonkatu campus 1.1a Buildings 2020 B 2018 95 10,978,724 - 10,978,724 91% 34 1 Mangrove Asumisoikeus Oy Apartment building, Asumisoikeus Oy Tampereen Ilokkaanrinne 5-6 1.1a Buildings 2021 A 2018 28 9,084,225 - 9,084,225 100% 223 8 Mangrove Asumisoikeus Oy Apartment buildings, Kuurankatu 2 and 4 1.1a Buildings 2022 A 2018 74 9,824,000 349,729 10,173,729 97% 76 4
68/87 Green Impact Report 2023 Municipality Finance Plc • Green Impact Report 2023
1 The new law of 2018 concerning energy performance certificates reduced the coefficients of certain energy types used in the calculation of E-values and made the legal threshold of energy efficiency for new buildings stricter. Using new coefficients, the E-values of the buildings built under the old law of 2013 would decrease, which could enhance their EPC classes.
2 The E-value represents a building’s calculated annual consumption of purchased energy per the heated net area (kWhE/m2/year) based on the usage default values and of the building’s intended use category and weighted by energy source coefficients.
3 Impacts calculated only for the new construction part of the project.
4 Experimental project, please see additional information on page 26
Customer Project Sub-category Year of approval Energy Performance Certificate class EPC year1 E-value2 (kWh/m2/ year) Outstanding amount 31 Dec 2023 (€) Unwithdrawn credit commitment 31 Dec 2023 (€) Total committed finance 31 Dec 2023 (€) MuniFin’s estimated share of finance 31 Dec 2023 Annual energy savings (avoided / reduced MWh) Annual CO₂ emissions (avoided / reduced tCO₂) Mangrove Yhtiöt Oy Apartment building, As.oy. Pirkkalan Torninjuuri 9b 1.1a Buildings 2023 A 2018 72 - 5,272,678 5,272,678 0% -City of Mikkeli Daycare centre of Kalevankangas 1.1a Buildings 2019 A 2018 88 4,200,000 - 4,200,000 100% 20 1 City of Mikkeli Southern regional School of Mikkeli 1.1a Buildings 2022 A 2018 77.5 29,000,000 - 29,000,000 100% 254 13 Mäntsälä Municipality School of Ehnroos 1.1a Buildings 2019 A 2018 87 16,775,588 - 16,775,588 80% 75 5 Mäntsälä Municipality Daycare centre Amanda 1.1a Buildings 2022 A 2018 53 6,600,930 - 6,600,930 96% 83 3 NAL Asunnot Oy Apartment building, Gibraltarinaukio 4 1.1a Buildings 2021 A 2018 74 10,005,107 - 10,005,107 99% 82 12 Nemoy Rakennuttaja Oy Apartment building, As.oy. Tuusulan Oiva 1.1a Buildings 2020 A 2018 75-80 6,328,509 - 6,328,509 97% 53 2 Niiralan Kulma Oy Apartment building, Hatsalankatu 37 1.1a Buildings 2020 A 2018 75 6,904,552 - 6,904,552 96% 46 2 Niiralan Kulma Oy Apartment building, Kaartokatu 3 1.1a Buildings 2023 A 2018 73 6,137,950 - 6,137,950 99% 52 3 Niiralan Kulma Oy Apartment building, Keskikaari 48 1.1a Buildings 2020 A 2018 71 4,591,735 - 4,591,735 98% 42 2 Niiralan Kulma Oy Apartment building, Neulastie 6 1.1a Buildings 2023 A 2018 79 - 3,652,000 3,652,000 0% -Niiralan Kulma Oy Apartment building, Raviradantie 8 1.1a Buildings 2020 A 2018 70 6,154,483 - 6,154,483 96% 60 5 Niiralan Kulma Oy Apartment building, Kuopio Puijonlaakso 1.1a Buildings 2017 C 2013 107 9,492,833 - 9,492,833 98% 108 9 Niiralan Kulma Oy Apartment building, Tasavallankatu 18 1.1a Buildings 2023 A 2018 73 2,017,323 - 2,017,323 99% 27 2 Niiralan Kulma Oy Apartment building, Urheilukatu 5 1.1a Buildings 2023 A 2018 71 - 7,794,889 7,794,889 0% -City of Nivala School of Haikara 1.1a Buildings 2023 A 2018 89 5,300,000 - 5,300,000 100% 23 1 City of Nivala School of Junttila 1.1a Buildings 2022 A 2018 87 4,605,263 - 4,605,263 92% 27 1 City of Nokia Welfare centre of Nokia 1.1a Buildings 2021 A 2018 78 24,800,000 - 24,800,000 87% 204 10 Nokian Vuokrakodit Oy Apartment building, Poutuntie 8 1.1a Buildings 2023 A 2018 70 528,000 6,063,968 6,591,968 8% 4Oulun Moniasunnot Oy Apartment building, Siirtolantie 6 1.1a Buildings 2021 A 2018 74 7,213,192 - 7,213,192 99% 45 3 Oulun Sivakka Oy Apartment building, Hiirihaukantie 12 a 1.1a Buildings 2020 A 2018 60 6,587,689 - 6,587,689 98% 106 6
Buildings: New buildings
69/87 Green Impact Report 2023 Municipality Finance Plc • Green Impact Report 2023
1 The new law of 2018 concerning energy performance certificates reduced the coefficients of certain energy types used in the calculation of E-values and made the legal threshold of energy efficiency for new buildings stricter. Using new coefficients, the E-values of the buildings built under the old law of 2013 would decrease, which could enhance their EPC classes.
2 The E-value represents a building’s calculated annual consumption of purchased energy per the heated net area (kWhE/m2/year) based on the usage default values and of the building’s intended use category and weighted by energy source coefficients.
3 Impacts calculated only for the new construction part of the project.
4 Experimental project, please see additional information on page 26
Customer Project Sub-category Year of approval Energy Performance Certificate class EPC year1 E-value2 (kWh/m2/ year) Outstanding amount 31 Dec 2023 (€) Unwithdrawn credit commitment 31 Dec 2023 (€) Total committed finance 31 Dec 2023 (€) MuniFin’s estimated share of finance 31 Dec 2023 Annual energy savings (avoided / reduced MWh) Annual CO₂ emissions (avoided / reduced tCO₂) Oulun Sivakka Oy Apartment building, Hiirihaukantie 12 b 1.1a Buildings 2023 A 2018 67 3,747,669 2,498,446 6,246,115 60% 32 2 Oulun Sivakka Oy Apartment building, Jalohaukantie 5 1.1a Buildings 2020 A 2018 59 5,652,633 - 5,652,633 96% 86 5 Oulun Sivakka Oy Apartment building, Kauppiaantie 18 1.1a Buildings 2023 A 2018 70 1,623,635 3,788,480 5,412,115 30% 12 1 Oulun Sivakka Oy Apartment building, Kiilankatu 5 1.1a Buildings 2020 A 2018 66-74 7,997,844 - 7,997,844 97% 87 5 Oulun Sivakka Oy Apartment building, Menninkäisentie 3 c 1.1a Buildings 2023 A 2018 70 3,150,986 3,150,986 6,301,972 50% 26 2 Oulun Sivakka Oy Apartment building, Menninkäisentie 3a 1.1a Buildings 2021 A 2018 68 3,900,262 - 3,900,262 99% 41 3 Oulun Sivakka Oy Apartment building, Myllytullinkatu 5 1.1a Buildings 2021 A 2018 62 7,250,686 - 7,250,686 99% 96 6 Oulun Sivakka Oy Apartment building, Valmutie 3 1.1a Buildings 2021 A 2018 79-80 3,468,891 - 3,468,891 99% 33 2 City of Parainen Creativity and learning centre of Parainen [3] 1.1a Buildings, 1.2 Renovations 2022 A 2018 82 13,500,000 - 13,500,000 79% 54 1 Parikkala Municipality Kirjola school, 1st phase 1.1a Buildings 2021 A 2018 83 8,450,000 - 8,450,000 70% 55 2 City of Parkano School campus of Parkano 1.1a Buildings 2017 B 2013 102 13,125,749 - 13,125,749 84% 430 63 Perho Municipality Sportshall, Perho 1.1a Buildings 2023 A 2018 87 2,800,000 - 2,800,000 47% 15 1 Perho Municipality Daycare centre Perhonkoti 1.1a Buildings 2020 A 2018 89 2,447,060 - 2,447,060 76% 12 1 Pielavesi Municipality Pielakoti (building for elderly and renovation of the central commercial kitchen) [3] 1.1a Buildings, 1.2 Renovations 2017 B 2013 138 4,932,774 - 4,932,774 97% 313 18 Pirkan Opiskelija-asunnot Oy Apartment building, Hipposkylänkuja 6 (hipposkylä) 1.1a Buildings 2023 A 2018 68 - 7,000,000 7,000,000 0% -Pirkan Opiskelija-asunnot Oy Apartment building, Vaahterakuja 3 1.1a Buildings 2019 A 2018 72 6,143,342 - 6,143,342 97% 44 2 Pirkkala Municipality Pirkkala campus 1.1a Buildings 2021 A 2018 48 42,185,590 7,814,410 50,000,000 84% 831 50 Pohjois-Suomen opiskelija-asuntosäätiö sr Apartment building, Välkkylän Tornitalo, Psoas Uno 1.1a Buildings 2022 A 2018 71 10,173,619 4,380,916 14,554,535 70% 91 5 City of Pori Community centre of Northern Pori 1.1a Buildings 2022 A 2018 76 21,250,000 - 21,250,000 85% 159 6
Buildings: New buildings
70/87 Green Impact Report 2023 Municipality Finance Plc • Green Impact Report 2023
1 The new law of 2018 concerning energy performance certificates reduced the coefficients of certain energy types used in the calculation of E-values and made the legal threshold of energy efficiency for new buildings stricter. Using new coefficients, the E-values of the buildings built under the old law of 2013 would decrease, which could enhance their EPC classes.
2 The E-value represents a building’s calculated annual consumption of purchased energy per the heated net area (kWhE/m2/year) based on the usage default values and of the building’s intended use category and weighted by energy source coefficients.
3 Impacts calculated only for the new construction part of the project.
4 Experimental project, please see additional information on page 26
Customer Project Sub-category Year of approval Energy Performance Certificate class EPC year1 E-value2 (kWh/m2/ year) Outstanding amount 31 Dec 2023 (€) Unwithdrawn credit commitment 31 Dec 2023 (€) Total committed finance 31 Dec 2023 (€) MuniFin’s estimated share of finance 31 Dec 2023 Annual energy savings (avoided / reduced MWh) Annual CO₂ emissions (avoided / reduced tCO₂) City of Pori Community centre of Northern Pori, 2nd phase 1.1a Buildings 2023 A 2018 86 17,500,000 - 17,500,000 100% 38 2 Porvoon A-Asunnot Oy Apartment buildings, Vaskenvalajankatu 8b and 8c 1.1a Buildings 2023 A 2018 65-66 - 21,093,302 21,093,302 0% -City of Porvoo Jokilaakso school, Porvoo 1.1a Buildings 2021 A 2018 86 2,650,102 - 2,650,102 80% 15 1 Premico Vuokra-asunnot ll Oy Apartment building, As. oy. Vantaan Metsäkissa 2 1.1a Buildings 2020 B 2018 86 13,082,345 - 13,082,345 96% 20 2 Ranua Municipality Secondary school and high school of Ranua 1.1a Buildings 2023 A 2018 88 3,500,000 - 3,500,000 58% 23 1 City of Rovaniemi Community centre of Vaaralampi 1.1a Buildings 2023 A 2018 89 17,000,000 - 17,000,000 85% 68 6 City of Saarijärvi School and culture centre of Saarijärvi, 1st phase 1.1a Buildings 2019 A 2018 78 12,031,729 - 12,031,729 94% 253 38 City of Saarijärvi School and culture centre of Saarijärvi, 2nd phase 1.1a Buildings 2021 A 2018 78 13,968,019 - 13,968,019 98% 263 39 City of Sastamala Comprehensive school of Mouhijärvi 1.1a Buildings 2023 A 2018 75 8,000,000 - 8,000,000 100% 80 2 Savon Koulutuskuntayhtymä Savilahti campus with Nordic ecolabel 1.1a Buildings 2023 A 2018 74-81 8,000,000 - 8,000,000 80% 414 32 Savuskoski Municipality School of Savukoski 1.1a Buildings 2019 A 2018 83 3,664,208 - 3,664,208 91% 23 1 City of Seinäjoki School of Kärki 1.1a Buildings 2023 A 2018 72 6,000,000 14,000,000 20,000,000 30% 52 4 Seinäjoen koulutuskuntayhtymä School of Törnävä 1.1a Buildings 2023 A 2018 85 7,000,000 - 7,000,000 64% 30 2 Siilinjärven Kotipolku Oy Apartment buildings, Vuorelantie 7a and b 1.1a Buildings 2023 A 2018 75 - 8,021,202 8,021,202 0% - 0 Sipoo Municipality Fire station of Sipoo (office building) 1.1a Buildings 2021 A 2018 80 8,278,260 1,521,740 9,800,000 84% 21 1 Sodankylä Municipality Community centre of Sodankylä 1.1a Buildings 2021 A 2018 72 21,924,072 - 21,924,072 88% 199 17 Sotkamo Municipality Middle school of Tenetti 1.1a Buildings 2023 A 2018 78 10,000,000 - 10,000,000 100% 140 15 Sotkamo Municipality Vuokatti-arena, ice hockey arena 1.1b Other buildings 2021 N/A N/A N/A 7,301,570 - 7,301,570 90% 470 48
Buildings: New buildings
71/87 Green Impact Report 2023 Municipality Finance Plc • Green Impact Report 2023
Buildings: New buildings
1 The new law of 2018 concerning energy performance certificates reduced the coefficients of certain energy types used in the calculation of E-values and made the legal threshold of energy efficiency for new buildings stricter. Using new coefficients, the E-values of the buildings built under the old law of 2013 would decrease, which could enhance their EPC classes.
2 The E-value represents a building’s calculated annual consumption of purchased energy per the heated net area (kWhE/m2/year) based on the usage default values and of the building’s intended use category and weighted by energy source coefficients.
3 Impacts calculated only for the new construction part of the project.
4 Experimental project, please see additional information on page 26
Customer Project Sub-category Year of approval Energy Performance Certificate class EPC year1 E-value2 (kWh/m2/ year) Outstanding amount 31 Dec 2023 (€) Unwithdrawn credit commitment 31 Dec 2023 (€) Total committed finance 31 Dec 2023 (€) MuniFin’s estimated share of finance 31 Dec 2023 Annual energy savings (avoided / reduced MWh) Annual CO₂ emissions (avoided / reduced tCO₂) Suomen Kaupunkikodit ARA Oy Apartment building, As.oy. Helsingin Frakki, Kutomotie 14c 1.1a Buildings 2023 A 2018 75 2,289,957 6,118,657 8,408,614 27% 9 1 Suomen Kaupunkikodit ARA Oy Apartment building, Hakatie 1 1.1a Buildings 2021 A 2018 76-77 11,756,910 - 11,756,910 99% 129 5 Taaleri Vuokrakoti ARA lll Oy Apartment building, As. oy. Tampereen Hervantajärven Hilpi 1.1a Buildings 2021 A 2018 74 6,337,934 - 6,337,934 99% 43 2 TA- Asumisoikeus Oy Apartment buildings, Espoon Peijinkatu 1b-1c buildings A2 and B2 1.1a Buildings 2021 A 2018 70-72 15,356,902 876,137 16,233,039 95% 125 5 TA-Asumisoikeus Oy Apartment building, Kalasatamankatu 29 1.1a Buildings 2023 A 2018 75 9,700,000 7,958,409 17,658,409 55% 49 8 TA- Asumisoikeus Oy Apartment building, Koy Heikinketo/Kanslerintie 17 1.1a Buildings 2020 A 2018 72 4,498,546 - 4,498,546 99% 44 2 TA-Asumisoikeus Oy Apartment building, Lohjan Sahapiha/Sahapiha 6 1.1a Buildings 2020 A 2018 73 6,218,270 - 6,218,270 98% 46 2 TA- Asumisoikeus Oy Apartment building, Metsäläntie 10 1.1a Buildings 2022 A 2018 75 9,000,000 10,049,580 19,049,580 47% 28 4 TA-Asumisoikeus Oy Apartment building, Metsäläntie 6 b in Pasilan Porttipuisto 1.1a Buildings 2019 A 2018 71-75 14,497,362 - 14,497,362 97% 97 4 TA-Asumisoikeus Oy Apartment building, Pellonreuna 7 1.1a Buildings 2019 B 2018 84 8,022,900 - 8,022,900 97% 12 1 TA-Asumisoikeus Oy Apartment building Nordic Ecolabel, Rapukuja 2 1.1a Buildings 2022 A 2018 75 6,104,836 - 6,104,836 100% 39 1 TA-Asumisoikeus Oy Apartment building, Tuulensuunkatu 27 1.1a Buildings 2021 A 2018 75 4,193,334 - 4,193,334 99% 38 2 TA-Asumisoikeus Oy Apartment building, Vuoksi 4 1.1a Buildings 2023 A 2018 71-72 3,900,000 4,695,860 8,595,860 45% 29 1 City of Tampere School of Sampo, School of South-Hervanta 1.1a Buildings 2023 A 2018 80-81 40,000,000 - 40,000,000 100% 497 43 Tampereen Kotilinnasäätiö sr Apartment building, As.oy. Niemenrannan Kotilinna 1.1a Buildings 2023 A 2018 72 - 5,627,022 5,627,022 0% - -
72/87 Green Impact Report 2023 Municipality Finance Plc • Green Impact Report 2023
1 The new law of 2018 concerning energy performance certificates reduced the coefficients of certain energy types used in the calculation of E-values and made the legal threshold of energy efficiency for new buildings stricter. Using new coefficients, the E-values of the buildings built under the old law of 2013 would decrease, which could enhance their EPC classes.
2 The E-value represents a building’s calculated annual consumption of purchased energy per the heated net area (kWhE/m2/year) based on the usage default values and of the building’s intended use category and weighted by energy source coefficients.
3 Impacts calculated only for the new construction part of the project.
4 Experimental project, please see additional information on page 26
Customer Project Sub-category Year of approval Energy Performance Certificate class EPC year1 E-value2 (kWh/m2/ year) Outstanding amount 31 Dec 2023 (€) Unwithdrawn credit commitment 31 Dec 2023 (€) Total committed finance 31 Dec 2023 (€) MuniFin’s estimated share of finance 31 Dec 2023 Annual energy savings (avoided / reduced MWh) Annual CO₂ emissions (avoided / reduced tCO₂) Tampere Student Housing Foundation (TOAS) Apartment building, Kourutaltankatu 8 1.1a Buildings 2020 A 2018 75 8,310,900 - 8,310,900 97% 64 3 Tampere Student Housing Foundation (TOAS) Apartment buildings, Uimalankatu 1 buildings 1b and 1c 1.1a Buildings 2022 A 2018 75 11,850,000 5,936,000 17,786,000 67% 62 6 Tampere Student Housing Foundation (TOAS) Apartment buildings, Uimalankatu 1a and 1d 1.1a Buildings 2023 A 2018 75 2,750,000 15,185,000 17,935,000 15% 13 1 Tampere Student Housing Foundation (TOAS) Apartment buildings, Uimalankatu 3 e and f 1.1a Buildings 2023 A 2018 75 9,350,000 12,383,000 21,733,000 43% 34 4 Tampereen Vuokratalosäätiö sr Apartment building, Heittoniitynkuja 2 1.1a Buildings 2022 A 2018 75 7,398,690 4,730,310 12,129,000 61% 47 2 Tampereen Vuokratalosäätiö sr Apartment building, Rollikankatu 2 1.1a Buildings 2023 A 2018 75 8,539,400 5,482,600 14,022,000 61% 53 2 TA-Yhtymä Oy Apartment building, As.oy Helsingin Vanha Talvitie 29 1.1a Buildings 2023 A 2018 75 7,290,000 7,214,160 14,504,160 50% 33 5 TA-Yhtymä Oy Apartment building, As.oy. Espoon Karakalliontie 10 1.1a Buildings 2023 A 2018 70 - 7,132,846 7,132,846 0% -TA-Yhtymä Oy Apartment building, As.oy. Espoon Luoteisrinne 1.1a Buildings 2022 A 2018 75 25,000,000 4,349,036 29,349,036 85% 100 8 TA-Yhtymä Oy Apartment building, As.oy. Helsingin Rullakkotori 1.1a Buildings 2023 A 2018 74 11,222,270 2,126,934 13,349,204 84% 63 10 TA-Yhtymä Oy Apartment building, KOY Haukiputaan Herralankulma 1.1a Buildings 2023 A 2018 75 3,210,210 356,690 3,566,900 90% 18 1 TA-Yhtymä Oy Apartment building, KOY Oulun Tarve, Paraatikatu 10 1.1a Buildings 2017 B 2013 100 5,758,470 - 5,758,470 98% 91 6 TA-Yhtymä Oy Apartment building, KOY Oulun Tarve, Pohjantikankuja 4 [4] 1.1a Buildings 2019 C 2018 N/A 7,120,650 - 7,120,650 96% -TA-Yhtymä Oy Apartment building, KOY Oulun Tarve, Soikkotie 2 1.1a Buildings 2023 A 2018 80 461,296 2,252,208 2,713,504 17% 5Tohmajärvi Municipality Daycare centre of Tikkala, Tohmajärvi 1.1a Buildings 2018 A 2018 84 1,450,000 - 1,450,000 73% 7Tohmajärvi Municipality School centre of Tohmajävi 1.1a Buildings 2022 A 2018 66 12,019,433 - 12,019,433 95% 172 47
Buildings: New buildings
73/87 Green Impact Report 2023 Municipality Finance Plc • Green Impact Report 2023
Buildings: New buildings
1 The new law of 2018 concerning energy performance certificates reduced the coefficients of certain energy types used in the calculation of E-values and made the legal threshold of energy efficiency for new buildings stricter. Using new coefficients, the E-values of the buildings built under the old law of 2013 would decrease, which could enhance their EPC classes.
2 The E-value represents a building’s calculated annual consumption of purchased energy per the heated net area (kWhE/m2/year) based on the usage default values and of the building’s intended use category and weighted by energy source coefficients.
3 Impacts calculated only for the new construction part of the project.
4 Experimental project, please see additional information on page 26
Customer Project Sub-category Year of approval Energy Performance Certificate class EPC year1 E-value2 (kWh/m2/ year) Outstanding amount 31 Dec 2023 (€) Unwithdrawn credit commitment 31 Dec 2023 (€) Total committed finance 31 Dec 2023 (€) MuniFin’s estimated share of finance 31 Dec 2023 Annual energy savings (avoided / reduced MWh) Annual CO₂ emissions (avoided / reduced tCO₂) Toivo Group Oyj/ Elämäni Kodit 10 Oy Apartment building, As.oy. Helsingin Blackstone 1.1a Buildings 2021 A 2018 66-78 11,284,284 - 11,284,284 98% 106 4 Toivo Group Oyj/ Elämäni Kodit 10 Oy Apartment building, As.oy. Nokian Fabriikki 1.1a Buildings 2020 A 2018 75 5,885,400 - 5,885,400 97% 36 1 Toivo Group Oyj/ Elämäni Kodit 40 Oy Apartment building, As.oy. Vantaan Nahkuri 1.1a Buildings 2023 A 2018 72 5,792,878 1,976,525 7,769,403 75% 30 1 Toivo Group Oyj/ Elämäni Kodit 40 Oy Apartment building, As. oy kirkkonummen atlas 1.1a Buildings 2021 A 2018 72 5,214,457 162,760 5,377,217 96% 30 1 Toivo Group Oyj/ Elämäni Kodit 40 Oy Apartment building, As.oy. Vantaan Nahkuri 1.1a Buildings 2022 A 2018 71 15,360,553 1,708,625 17,069,178 90% 85 3 City of Turku Temporary/movable school facilities for school of Mikael 1.1a Buildings 2022 A 2018 87 2,179,598 120,402 2,300,000 83% 10 1 City of Turku School of Pääskyvuori and Sirkkala, community centre of Runosmäki, school and daycare centre of Suikkila ja and daycare centre Tommilankatu[3] 1.1a Buildings, 1.2 Renovations 2016 A 2018 75-90 40,000,000 - 40,000,000 100% 293 15 City of Turku Turku Music Hall Fuuga and Wäinö Aaltonen School 1.1a Buildings 2023 A 2018 83-86 60,000,000 - 60,000,000 100% 651 33 Tuusula Municipality School campus of Kirkonkylä 1.1a Buildings 2023 A 2018 81 25,000,000 - 25,000,000 86% 126 12 Tuusula Municipality Martta Wendelin daycare centre and Kirkonkylä school with Nordic Ecolabel 1.1a Buildings 2020 B 2018 88-94 25,000,000 - 25,000,000 100% 97 7 TVT Asunnot Oy Apartment building, As.oy. Turun Hiidenpuoti Ristinpaltankatu 11 1.1a Buildings 2023 A 2018 75 - 11,312,866 11,312,866 0% -TVT Asunnot Oy Apartment building, Savonkedonkatu 7,Turku 1.1a Buildings 2023 A 2018 75 - 24,158,302 24,158,302 0% -TVT Asunnot Oy Apartment building, Toivolankatu 10 e-g, Mäntymäki 1.1a Buildings 2023 A 2018 74-75 - 35,646,494 35,646,494 0% -Tyrnävä Municipality School of Rantarousti 1.1a Buildings 2016 B 2013 101 9,219,518 - 9,219,518 66% 281 37
74/87 Green Impact Report 2023 Municipality Finance Plc • Green Impact Report 2023
1 The new law of 2018 concerning energy performance certificates reduced the coefficients of certain energy types used in the calculation of E-values and made the legal threshold of energy efficiency for new buildings stricter. Using new coefficients, the E-values of the buildings built under the old law of 2013 would decrease, which could enhance their EPC classes.
2 The E-value represents a building’s calculated annual consumption of purchased energy per the heated net area (kWhE/m2/year) based on the usage default values and of the building’s intended use category and weighted by energy source coefficients.
3 Impacts calculated only for the new construction part of the project.
4 Experimental project, please see additional information on page 26
Customer Project Sub-category Year of approval Energy Performance Certificate class EPC year1 E-value2 (kWh/m2/ year) Outstanding amount 31 Dec 2023 (€) Unwithdrawn credit commitment 31 Dec 2023 (€) Total committed finance 31 Dec 2023 (€) MuniFin’s estimated share of finance 31 Dec 2023 Annual energy savings (avoided / reduced MWh) Annual CO₂ emissions (avoided / reduced tCO₂) City of Valkeakoski School of Sorrila 1.1a Buildings 2023 A 2018 64 20,000,000 - 20,000,000 67% 212 8 City of Vantaa Daycare centre of Kelokuusi, Daycare centre of Korso, Daycare centre of Latopuisto, Daycare centre of Patotie 1.1a Buildings 2023 A 2018 68-83 30,000,000 - 30,000,000 100% 187 11 Varsinais-Suomen Asumisoikeus Oy Apartment building, Kirstinpuisto, Kirstintasku 2 1.1a Buildings 2023 A 2018 72 - 12,321,500 12,321,500 0% -Varttuneiden asumisoikeusyhdistys Jaso Multi-generation block, Kankaan Ilona, Ailakinkatu 10 1.1a Buildings 2019 B 2018 76 9,760,725 - 9,760,725 97% 132 11 VAV Asunnot Oy Apartment building with Nordic Ecolabel, Kaskelantie 1 1.1a Buildings 2018 B 2018 77 18,036,530 - 18,036,530 94% 400 44 VAV Asunnot Oy Apartment building, Peltolantie 42 1.1a Buildings 2023 A 2018 75 17,592,878 - 17,592,878 100% 106 11 VAV Asunnot Oy Apartment building, Perintötie 9 1.1a Buildings 2022 A 2018 75 22,409,142 2,340,000 24,749,142 90% 132 14 VAV Yhtymä Oy Apartment building with Nordic Ecolabel, Veturikuja 8 1.1a Buildings 2019 A 2018 74-75 18,016,284 - 18,016,284 93% 110 12 Vesanto Municipality School campus of Vesanto 1.1a Buildings 2019 A 2018 85 5,691,820 - 5,691,820 93% 31 2 Vihti Municipality School and daycare centre of Etelä-Nummela (The building information foundation (RTS) certification) 1.1a Buildings 2021 A 2018 66 27,000,000 - 27,000,000 90% 252 10 Vilusen Rinne Vuokra-asunnot Oy, Tampere Apartment buildings, Hikivuorenkatu 20 a and b 1.1a Buildings 2021 A 2018 72 11,098,010 - 11,098,010 99% 53 2 City of Virrat Comprehensive school of Virrat 1.1a Buildings 2019 A 2018 73 7,385,967 - 7,385,967 49% 92 7 City of Ylivieska School of Taanila 1.1a Buildings 2023 A 2018 74 12,000,000 - 12,000,000 100% 172 9 City of Ylöjärvi Comprehensive school of Siltatie 1.1a Buildings 2022 A 2018 75 9,000,000 - 9,000,000 90% 163 9 City of Ylöjärvi School of Vuorentausta 1.1a Buildings 2023 A 2018 72 12,300,000 - 12,300,000 100% 57 7
Buildings: New buildings
75/87 Green Impact Report 2023 Municipality Finance Plc • Green Impact Report 2023
1 The new law of 2018 concerning energy performance certificates reduced the coefficients of certain energy types used in the calculation of E-values and made the legal threshold of energy efficiency for new buildings stricter. Using new coefficients, the E-values of the buildings built under the old law of 2013 would decrease, which could enhance their EPC classes.
2 The E-value represents a building’s calculated annual consumption of purchased energy per the heated net area (kWhE/m2/year) based on the usage default values and of the building’s intended use category and weighted by energy source coefficients.
3 Impacts calculated only for the new construction part of the project.
4 Experimental project, please see additional information on page 26
Customer Project Sub-category Year of approval Energy Performance Certificate class EPC year1 E-value2 (kWh/m2/ year) Outstanding amount 31 Dec 2023 (€) Unwithdrawn credit commitment 31 Dec 2023 (€) Total committed finance 31 Dec 2023 (€) MuniFin’s estimated share of finance 31 Dec 2023 Annual energy savings (avoided / reduced MWh) Annual CO₂ emissions (avoided / reduced tCO₂) Yrjö ja Hanna Kiinteistöt Oy Apartment buildings, Kuokkalan Kalon buildings 2, 3 and 4 1.1a Buildings 2022 A 2018 70-71 11,160,711 4,783,163 15,943,874 70% 98 4 Yrjö ja Hanna-säätiö/Asoasunnot Uusimaa Oy Apartment building, Hermannin Rantatie 23, Helsinki 1.1a Buildings 2022 A 2018 75 11,471,627 4,957,876 16,429,503 70% 112 17 Yrjö ja Hanna-säätiö/Asoasunnot Uusimaa Oy Apartment building, Kuokkalan kalon, building 1 1.1a Buildings 2022 A 2018 69 3,027,346 159,334 3,186,680 95% 25 1 Y-Säätiö Apartment building, Koy järvenpään myllytie 14 1.1a Buildings 2022 A 2018 68 9,347,100 - 9,347,100 100% 71 3 Kiinteistö Oy M2-Kodit Construction of apartment building KOY Tampereen Jallukka 1.1a Buildings 2020 A 2018 75 6,005,420 - 6,005,420 97% 39 4 Y-Säätiö/Kiinteistö Oy M2-Kodit Apartment building, As.oy. Espoon Kokinniityn Poimulehti 1.1a Buildings 2023 A 2018 75 - 18,332,496 18,332,496 0% -Y-Säätiö/Kiinteistö Oy M2-Kodit Apartment building, Lyyranpyrstö 2 1.1a Buildings 2022 A 2018 74 13,759,714 - 13,759,714 99% 104 10 Y-Säätiö/Kiinteistö Oy M2-Kodit Apartment buildings, Nihtisillankuja 2 H and I 1.1a Buildings 2022 A 2018 74 13,956,111 3,273,655 17,229,766 81% 69 3 Y-Säätiö/Kiinteistö Oy M2-Kodit Apartment building, Postiljooninkatu 1 1.1a Buildings 2020 A 2018 75 10,647,110 - 10,647,110 97% 56 8 Y-Säätiö/Kiinteistö Oy M2-Kodit Apartment building, Rullakkokuja 14 1.1a Buildings 2022 A 2018 75 13,216,933 5,901,441 19,118,374 69% 74 11 City of Ähtäri Comprehensive school of Ähtäri 1.1a Buildings 2022 A 2018 75 11,350,000 - 11,350,000 99% 109 14 City of Äänekoski School of Koulumäki, Building C 1.1a Buildings 2023 A 2018 68 3,215,236 20,784,764 24,000,000 13% 26 1 City of Äänekoski Äänekoski Ice hockey arena 1.1b Other buildings 2018 N/A N/A N/A 3,740,267 - 3,740,267 83% 1,492 395
Buildings: New buildings
76/87 Green Impact Report 2023 Municipality Finance Plc • Green Impact Report 2023
Buildings: Renovation projects
5 Project has a fossile fuel element, please see additional detail on page 26
6 Avoided emissions (tCO₂) reported as zero. The project saves net energy, but due to the recent strong decarbonization of district heating in the region, the increase in electricity consumption and the emission coefficients used would cause an increase in the calculated emissions.
Customer Project Subcategory Year of approval Outstanding amount 31 Dec 2023 (€) Unwithdrawn credit commitment 31 Dec 2023 (€) Total committed finance 31 Dec 2023 (€) MuniFin’s estimated share of finance 31 Dec 2023 Annual energy savings (avoided / reduced MWh) Annual CO₂ emissions (avoided / reduced tCO₂) Helsingin kaupungin asunnot Oy Apartment building, Arhotie 20 1.2 Renovations 2023 - 7,986,004 7,986,004 0% -Helsingin kaupungin asunnot Oy Apartment building, Hämeentie 122, Toukola 1.2 Renovations 2023 - 27,727,734 27,727,734 0% -Helsingin kaupungin asunnot Oy Apartment building, Jakomäentie 10 1.2 Renovations 2022 - 23,955,760 23,955,760 0% -Helsingin kaupungin asunnot Oy Apartment building, Jollaksentie 87 1.2 Renovations 2020 7,035,431 - 7,035,431 98% 691 177 Helsingin kaupungin asunnot Oy Apartment building, Kasöörinkatu 3 1.2 Renovations 2023 - 16,791,560 16,791,560 0% -Helsingin kaupungin asunnot Oy Apartment building, Koivikkotie 5 1.2 Renovations 2021 11,346,061 1,279,150 12,625,211 89% 385 15 Helsingin kaupungin asunnot Oy Apartment building, Myllypurontie 22 1.2 Renovations 2023 - 34,316,667 34,316,667 0% -Helsingin kaupungin asunnot Oy Apartment building, Mäenlaskijantie 4 1.2 Renovations 2023 - 24,166,969 24,166,969 0% -Helsingin kaupungin asunnot Oy Apartment building, Mäkelänkatu 45 1.2 Renovations 2023 - 15,619,550 15,619,550 0% -Helsingin kaupungin asunnot Oy Apartment building, Perhekunnantie 10 1.2 Renovations 2021 13,037,789 3,259,448 16,297,237 79% 676 145 Helsingin kaupungin asunnot Oy Apartment building, Rusthollarintie 10 1.2 Renovations 2020 19,106,417 - 19,106,417 98% 547 92 Helsingin kaupungin asunnot Oy Apartment building, Sakara 2 1.2 Renovations 2023 - 36,057,950 36,057,950 0% -Hyvinkään Vuokra-asunnot Oy Apartment building, Jussilankatu 2 1.2 Renovations 2021 7,952,210 - 7,952,210 99% 1,138 98 Hyvinkään Vuokra-asunnot Oy Apartment building, Jussilankatu 4 1.2 Renovations 2021 8,009,341 - 8,009,341 99% 1,163 100 Joensuun Kodit Oy Apartment building, Huvimäentie 16 [5] 1.2 Renovations 2021 2,362,890 - 2,362,890 98% 250 75 Joensuun Kodit Oy Apartment building, Latolankatu 23, 2nd phase [6] 1.2 Renovations 2021 5,318,125 - 5,318,125 98% 533Joensuun Kodit Oy Apartment building, Latolankatu 3 [6] 1.2 Renovations 2020 2,526,656 - 2,526,656 96% 316Joensuun Kodit Oy Apartment building, Noljakankaari 10 1.2 Renovations 2021 2,959,786 - 2,959,786 99% 287 3 Joensuun Kodit Oy Apartment building, Äkkiväärä 10 [6] 1.2 Renovations 2020 2,701,876 - 2,701,876 97% 282Jyväskylän Vuokra-asunnot Oy Apartment building, Kiljaderinkatu 8 1.2 Renovations 2022 4,583,336 - 4,583,336 92% 159 17 The Student Union of the University of Jyväskylä Apartment building, Taitoniekantie 9 b 1.2 Renovations 2018 7,481,206 - 7,481,206 95% 229 13 The Student Union of the University of Jyväskylä Apartment building, Taitoniekantie 9 c 1.2 Renovations 2019 7,464,360 - 7,464,360 97% 430 45 The Student Union of the University of Jyväskylä Apartment building, Taitoniekantie 9 d 1.2 Renovations 2020 8,487,911 - 8,487,911 99% 454 49 77/87 Green Impact Report 2023 Municipality Finance Plc • Green Impact Report 2023
5 Project has a fossile fuel element, please see additional detail on page 26
6 Avoided emissions (tCO₂) reported as zero. The project saves net energy, but due to the recent strong decarbonization of district heating in the region, the increase in electricity consumption and the emission coefficients used would cause an increase in the calculated emissions.
Customer Project Subcategory Year of approval Outstanding amount 31 Dec 2023 (€) Unwithdrawn credit commitment 31 Dec 2023 (€) Total committed finance 31 Dec 2023 (€) MuniFin’s estimated share of finance 31 Dec 2023 Annual energy savings (avoided / reduced MWh) Annual CO₂ emissions (avoided / reduced tCO₂) The Student Union of the University of Jyväskylä Apartment building Taitoniekantie 9 e 1.2 Renovations 2021 7,165,882 - 7,165,882 98% 421 44 KAS asunnot Oy Apartment building, KOY Rovatalo, Kaartokatu 11d 1.2 Renovations 2023 - 3,860,317 3,860,317 0% -Central Finland Student Housing Foundation (Koas) Apartment building, Kopparintie 1 1.2 Renovations 2021 3,521,256 - 3,521,256 98% 470 54 Central Finland Student Housing Foundation (Koas) Apartment buildings, Taitoniekantie 2 a and b 1.2 Renovations 2023 - 2,592,446 2,592,446 0% -Kiinteistö Oy Enontekiön kunnan asunnot Apartment buildings, Öhmannintie 4, Ounastie 3162, Pulkkatie 19 and Sopulikuja 4 1.2 Renovations 2023 - 400,000 400,000 0% -Kiinteistö Oy Jämsänmäki Apartment buildings, Huikkolanraitti 2 and Kanervakatu 5 1.2 Renovations 2023 - 240,000 240,000 0% -Kiinteistö Oy Nikkarinkruunu Apartment building, Pajukatu 2 1.2 Renovations 2023 185,000 - 185,000 100% 119 107 Kiinteistö Oy Nikkarinkruunu Apartment building, Riimutie 1, Kerava 1.2 Renovations 2023 177,940 39,060 217,000 82% 277 70 Kiinteistö Oy Nikkarinkruunu Apartment building, Sorsakorventie 11-13, Kerava 1.2 Renovations 2023 178,185 47,365 225,550 79% 465 116 Kiinteistö Oy Nikkarinkruunu Apartment building, Varsatie 2, Kerava 1.2 Renovations 2023 67,488 157,472 224,960 30% 107 27 Kiinteistöosakeyhtiö Keskiväli Apartment building, Koukkutie 9, Mäntyharju 1.2 Renovations 2023 60,000 - 60,000 100% 221 79 Kiinteistöosakeyhtiö Keskiväli Apartment building, Pekonpirtti 1.2 Renovations 2023 60,000 - 60,000 100% 154 55 Kouvolan Asunnot Oy Apartment building, Viialankatu 5 1.2 Renovations 2022 6,283,334 - 6,283,334 97% 689 63 Mikalo Oy Apartment building, Yrjönkatu 19, Mikkeli 1.2 Renovations 2022 1,995,000 - 1,995,000 100% 55 57 Muuramen Vuokra-asunnot Oy Apartment building, Kinkoriutantie 14-18 1.2 Renovations 2023 68,828 - 68,828 100% 227 70 Muuramen Vuokra-asunnot Oy Apartment building, Männikkötie 6 1.2 Renovations 2023 85,325 - 85,325 100% 188 62 Oulun Sivakka Oy Apartment building, Makasiininkatu 6 1.2 Renovations 2020 1,663,200 - 1,663,200 88% 295 31 City of Riihimäki Riihimäki swimming hall 1.2 Renovations 2023 15,000,000 - 15,000,000 100% 1,333 130 Savonlinnan Vuokratalot Oy Apartment buildings, Aholahdentie 113 and Aholahdentie 115 1.2 Renovations 2022 174,503 1,082 175,585 99% 200 63
Buildings: Renovation projects
78/87 Green Impact Report 2023 Municipality Finance Plc • Green Impact Report 2023
Buildings: Renovation projects
5 Project has a fossile fuel element, please see additional detail on page 26
6 Avoided emissions (tCO₂) reported as zero. The project saves net energy, but due to the recent strong decarbonization of district heating in the region, the increase in electricity consumption and the emission coefficients used would cause an increase in the calculated emissions.
Customer Project Subcategory Year of approval Outstanding amount 31 Dec 2023 (€) Unwithdrawn credit commitment 31 Dec 2023 (€) Total committed finance 31 Dec 2023 (€) MuniFin’s estimated share of finance 31 Dec 2023 Annual energy savings (avoided / reduced MWh) Annual CO₂ emissions (avoided / reduced tCO₂) Savonlinnan Vuokratalot Oy Apartment buildings, Hilkanhaka 6 and 7 1.2 Renovations 2022 251,782 24,902 276,684 91% 808 276 Savonlinnan Vuokratalot Oy Apartment buildings, Kirstintupa and Marintupa 1.2 Renovations 2022 229,532 1,427 230,959 99% 563 188 Savonlinnan Vuokratalot Oy Apartment building, Repolankaari 2 1.2 Renovations 2022 128,809 - 128,809 100% 275 88 Savonlinnan Vuokratalot Oy Apartment building, Sorvaslahdentie 16 1.2 Renovations 2022 114,904 8,649 123,553 93% 97 31 Savonlinnan Vuokratalot Oy Apartment building, Sorvaslahdentie 29 1.2 Renovations 2022 121,140 9,118 130,258 93% 144 45 Savonlinnan Vuokratalot Oy Apartment building, Sorvaslahdentie 8 1.2 Renovations 2022 121,847 9,172 131,019 93% 165 53 Sonkakoti Oy Apartment buildings, Männikkötie 26 a-c, Särkitie 1 and 3, Sonkajärvi 1.2 Renovations 2023 113,458 - 113,458 100% 237 80 Tampere Student Housing Foundation (TOAS) Apartment building, Vanha Domus, Väinämöisenkatu 11 1.2 Renovations 2023 960,000 2,240,000 3,200,000 30% 114 15 TVT Asunnot Oy Apartment building, Kousankuja 4,Turku 1.2 Renovations 2023 - 14,220,621 14,220,621 0% -TVT Asunnot Oy Apartment buildings, Raastuvankatu 3 a and b, Turku 1.2 Renovations 2023 - 13,302,175 13,302,175 0% -Ääneseudun Asunnot Oy Apartment building, Lönnrotinkatu 1 1.2 Renovations 2019 5,255,439 - 5,255,439 95% 256 156 Buildings: Renewable energy in buildings Customer Project Subcategory Year of approval Outstanding amount 31 Dec 2023 (€) Unwithdrawn credit commitment 31 Dec 2023 (€) Total committed finance 31 Dec 2023 (€) MuniFin’s estimated share of finance 31 Dec 2023 Annual energy savings (avoided / reduced MWh) Annual CO₂ emissions (avoided / reduced tCO₂) Vihti Municipality Solar panels in Vihti 1.4 Renewable energy in buildings 2020 119,238 - 119,238 71% 149 21
79/87 Green Impact Report 2023 Municipality Finance Plc • Green Impact Report 2023
Buildings: Individual energy efficiency measures
7 An energy saving project (ESCO) concerning several buildings. An ESCO (Energy Service Company) is a procedurein which an ESCO assumes operational responsibility for an investment to be made to an end customer so that the investment can be financed in whole or in part by the savings it generates.
Customer Project Subcategory Year of approval Outstanding amount 31 Dec 2023 (€) Unwithdrawn credit commitment 31 Dec 2023 (€) Total committed finance 31 Dec 2023 (€) MuniFin’s estimated share of finance 31 Dec 2023 Annual energy savings (avoided / reduced MWh) Annual CO₂ emissions (avoided / reduced tCO₂) City of Jyväskylä Jyväskylä Esco projects [7] 1.5 Energy saving project (Esco) 2018 849,663 - 849,663 78% 2767 250 City of Kotka Renewal of street lightning in the area of Otsola 1.5 Energy saving project (Esco) 2017 123,784 - 123,784 44% 113 4 City of Kotka Renewal of street lightning in the area of Rauhala 1.5 Energy saving project (Esco) 2018 276,185 - 276,185 54% 157 6 City of Kotka Renewal of street lightning in the area of Ristikallio 1.5 Energy saving project (Esco) 2016 114,741 - 114,741 35% 78 3 Liperi Municipality Renewal of street lightning in the area of Ruuska 1.5 Energy saving project (Esco) 2021 84,673 - 84,673 75% 13 1 Mäntyharju Municipality Renewal of street lighting in Mäntyharju 1.5 Energy saving project (Esco) 2019 330,000 - 330,000 100% 185 7 City of Pieksämäki Renewal of lighting along Uhomäki fitness track 1.5 Energy saving project (Esco) 2019 95,210 - 95,210 52% 26 1 Pielavesi Municipality Renewal of street lightning in Pielavesi 1.5 Energy saving project (Esco) 2018 202,939 797,061 1,000,000 20% 19 1 City of Tampere Tampere Esco-projects [7] 1.5 Energy saving project (Esco) 2017 420,445 1,579,555 2,000,000 21% 692 78 80/87 Green Impact Report 2023 Municipality Finance Plc • Green Impact Report 2023
Transportation Customer Project Subcategory Year of approval Outstanding amount 31 Dec 2023 (€) Unwithdrawn credit commitment 31 Dec 2023 (€) Total committed finance 31 Dec 2023 (€) MuniFin’s estimated share of finance 31 Dec 2023 Annual CO₂ emissions (avoided / reduced tCO₂) City of Helsinki Crown Bridges Light Rail (CEEQUAL sustainability assesment) 2.2 Supporting infrastructure for public transportation 2022 115,000,000 - 115,000,000 35% 1,446 The Wellbeing Services County of Kymenlaakso Fully electric car, Audi Q4 e-tron 2.3 Passenger cars and light commercial vehicles 2023 48,609 - 48,609 95% 1 The Wellbeing Services County of Kymenlaakso Fully electric car, Volkswagen id.4 pro 2.3 Passenger cars and light commercial vehicles 2023 44,722 - 44,722 95% 1 Kymsote-Kiinteistöt Oy (social and healthcare services) Fully electric cars, VW e-up (24 vehicles) 2.3 Passenger cars and light commercial vehicles 2022 364,816 - 364,816 71% 14 Luoto Municipality Fully electric cars, Citroen e-Berlingo ( 2 vehicles) 2.3 Passenger cars and light commercial vehicles 2023 60,196 - 60,196 92% 2 Luoto Municipality Fully electric car, Citroen e-Jumpy 2.3 Passenger cars and light commercial vehicles 2023 47,236 - 47,236 89% 1 Länsimetro Oy Western Metro extension, 1st phase Ruoholahti-Matinkylä 2.1 Public transportation 2017 385,320,078 - 385,320,078 32% 2,210 Länsimetro Oy Western Metro extension, 2nd phase Matinkylä-Kivenlahti 2.1 Public transportation 2018 159,509,804 - 159,509,804 14% 206 City of Orivesi Fully electric car, Citroen e-Berlingo 2.3 Passenger cars and light commercial vehicles 2022 19,711 - 19,711 63% 1 Pääkaupunkiseudun Kaupunkiliikenne Oy Jokeri light Rail 2.1 Public transportation 2022 200,000,000 - 200,000,000 52% 2,025 Pääkaupunkiseudun Kaupunkiliikenne Oy Depot of Ruskeasuo (Breeam) 2.2 Supporting infrastructure for public transportation 2022 100,000,000 - 100,000,000 58%City of Raasepori Fully electric car, BYD ETP 3 van 2.3 Passenger cars and light commercial vehicles 2023 30,951 - 30,951 89% 1 City of Savonlinna Fully electric car, Ford E-Transit 2.3 Passenger cars and light commercial vehicles 2023 51,513 - 51,513 97% 1 City of Seinäjoki Fully electric cars, Citroen e-Jumpy (4 vehicles) 2.3 Passenger cars and light commercial vehicles 2023 178,713 - 178,713 91% 4.4 City of Seinäjoki Fully electric car, Nissan Van Electric 2.3 Passenger cars and light commercial vehicles 2023 31,658 - 31,658 85% 1 8 Project has a fossile fuel element, please see additional detail on page 26. 81/87 Green Impact Report 2023 Municipality Finance Plc • Green Impact Report 2023
Transportation Customer Project Subcategory Year of approval Outstanding amount 31 Dec 2023 (€) Unwithdrawn credit commitment 31 Dec 2023 (€) Total committed finance 31 Dec 2023 (€) MuniFin’s estimated share of finance 31 Dec 2023 Annual CO₂ emissions (avoided / reduced tCO₂) Seinäjoki Joint Municipal Authority for Education Fully electric car, Skoda Enyaq 2.3 Passenger cars and light commercial vehicles 2022 22,595 - 22,595 65% 1 Tampereen Infra Oy Fully electric cars, Kia s-Soul (2 vehicles) 2.3 Passenger cars and light commercial vehicles 2022 35,129 - 35,129 61% 1 Tampereen Raitiotie Oy City of Tampere tramway 2.1 Public transportation 2017 140,096,160 - 140,096,160 45% 2,041 Tampereen Raitiotie Oy City of Tampere tramway, 2nd phase 2.1 Public transportation 2022 63,333,334 - 63,333,334 20% 923 City of Turku Fully electric cars, Citroen e-Jumpy (3 vehicles) 2.3 Passenger cars and light commercial vehicles 2023 118,094 - 118,094 94% 3 City of Turku Fully electric car, Ford E-Transit 2.3 Passenger cars and light commercial vehicles 2023 51,628 - 51,628 80% 1 City of Turku Fully electric cars, GOUPIL G4 (3 vehicles) 2.3 Passenger cars and light commercial vehicles 2023 106,106 - 106,106 95% 4 City of Turku Fully electric car, MB EQE 2.3 Passenger cars and light commercial vehicles 2023 41,954 - 41,954 63% 1 City of Turku Fully electric cars, Renault Zoe (5 vehicles) 2.3 Passenger cars and light commercial vehicles 2023 145,078 - 145,078 91% 3 City of Turku, Turku Vocational Institute Fully electric cars, VW e-up (3 vehicles) 2.3 Passenger cars and light commercial vehicles 2022 42,059 - 42,059 71% 2 City of Turku, Procurement Services of the City of Turku Fully electric cars, Citroen e-Berlingo ( 2 vehicles) 2.3 Passenger cars and light commercial vehicles 2022 43,633 - 43,633 74% 1 City of Turku, Procurement Services of the City of Turku (Social and healthcare services) Fully electric cars, VW e-up (25 vehicles) 2.3 Passenger cars and light commercial vehicles 2022 368,404 - 368,404 79% 16 City of Vaasa Kvarken Archipelago car and passenger ferry, M/S Aurora Botnia [8] 2.1 Public transportation 2020 25,000,000 - 25,000,000 21% 1,950 8 Project has a fossile fuel element, please see additional detail on page 26. 82/87 Green Impact Report 2023 Municipality Finance Plc • Green Impact Report 2023
Renewable energy
Customer Project Subcategory Year of approval Outstanding amount 31 Dec 2023 (€) Unwithdrawn credit commitment 31 Dec 2023 (€) Total committed finance 31 Dec 2023 (€) MuniFin’s estimated share of finance 31 Dec 2023 Annual production of renewable energy (MWh) Renewable energy production capacity (MW) Annual CO₂ emissions avoided / reduced (tCO₂) Kangasalan Lämpö Oy Bioenergy heating plant 3.3 Bioenergy 2018 7,586,211 - 7,586,211 76% - 9 9,103 Kemin Energia ja Vesi Oy Cental bioheating plant 3.3 Bioenergy 2019 7,560,000 - 7,560,000 84% - 15 20,446 Lempäälän Energia Oy Energy self-sufficiency project of Lempäälä [9] 3.3 Bioenergy 2017 7,544,448 - 7,544,448 78% 14,050 6 3,509 Lempäälän Energia Oy Viialantie heating plant, fuel storing and unloading concept 3.3 Bioenergy 2017 3,342,860 - 3,342,860 64% - - 5,286 Seinäjoen Energia Oy Kapernaum 50 mw bioenergy heating plant 3.3 Bioenergy 2021 12,000,000 - 12,000,000 46% 92,308 23 26,308 Taipalsaaren Lämpö Oy Kuivaketvele bioenergy heating plant 3.3 Bioenergy 2021 50,000 - 50,000 50% - 0 143 9 Project has a fossile fuel element, please see additional detail on page 26. 83/87 Green Impact Report 2023 Municipality Finance Plc • Green Impact Report 2023
Water and waste water management Customer Project Subcategory Year of approval Outstanding amount 31 Dec 2023 (€) Unwithdrawn credit commitment 31 Dec 2023 (€) Total committed finance 31 Dec 2023 (€) MuniFin’s estimated share of finance 31 Dec 2023 Annual production of renewable energy (MWh) Renewable energy production capacity (MW) Annual CO₂ emissions avoided / reduced (tCO₂) City of Heinola Waste water treatment plant of Sahaniemi, Heinola 4.2 Existing waste water facilities 2018 4,000,000 - 4,000,000 50% 1,158,875 -Helsinki Region Environmental Services HSY Waste water treatment plant of Blominmäki 4.1 New waste water facilities 2020 165,750,000 - 165,750,000 43% - 23,268,750Hämeenlinnan Seudun Vesi Oy Waste water treatment plant of Paroinen 4.2 Existing waste water facilities 2021 12,400,000 - 12,400,000 64% 5,172,571 -City of Imatra Waste water treatment plant of Meltola 4.2 Existing waste water facilities 2020 15,733,500 - 15,733,500 75% 3,805,067 -Jyväskylän Seudun Puhdistamo Oy Purification plant centre of Jyväskylä region 4.2 Existing waste water facilities 2016 8,181,824 - 8,181,824 82% 11,116,747 2,144,808City of Jämsä Central purification plant of Jämsä 4.2 Existing waste water facilities 2020 2,600,000 - 2,600,000 65% 1,222,075 -City of Mikkeli Water and waste water treatment plant of Metsä-sairila 4.1 New waste water facilities 2016 17,666,676 - 17,666,676 30% - 1,721,039Pyhäntä Municipality Pretreatment plant, Pyhäntä [10] 4.2 Existing waste water facilities 2023 2,000,000 - 2,000,000 66% - -Savukoski Municipality Waste water treatment plant of Mukkavaara 4.1 New waste water facilities 2020 1,142,859 - 1,142,859 85% 30,591 -Tampereen Seudun Keskuspuhdistamo Oy Waste water treatment plant of Sulkavuori 4.1 New waste water facilities 2023 90,000,000 - 90,000,000 24% - 8,854,447 159 Tunturi-Lapin Vesi Oy Central purification plant of Ylläs 4.1 New waste water facilities 2018 4,680,007 - 4,680,007 90% 230,936 59,130Turun Seudun Puhdistamo Oy Waste water purification plant of Kakolanmäki 4.2 Existing waste water facilities 2018 23,100,000 - 23,100,000 77% - -City of Uusikaupunki Waste water purification plant of Häpönniemi 4.2 Existing waste water facilities 2018 1,231,040 - 1,231,040 72% 2,032,556 -Vesikolmio Oy Central purification plant of Kalajokilaakso 4.1 New waste water facilities 2016 5,625,000 - 5,625,000 38% 1,125,000 - 338 10 The project will increase the capacity of the region’s central waste water treatment plant. The estimated amount (m3) will be reported when it is available. 84/87 Green Impact Report 2023 Municipality Finance Plc • Green Impact Report 2023
External verification
To the Management of Municipality Finance Plc
We have been engaged by the Management of Municipality Finance Plc (hereinafter also the “Company”) to perform a limited assurance engagement on selected information for the reporting period ended 31 December 2023, disclosed in Municipality Finance Plc Green Impact Report 2023 (hereinafter the Selected information).
Selected information
The Selected information within the scope of assurance covers:
• The disclosed information on the allocation of the Green Bond proceeds for the reporting period ended 31 December 2023 as disclosed in the Municipality Finance Plc Green Impact Report 2023 under section “Project compatibility under the updated Green Bond Framework” in table on page 25 in accordance with the Municipality Finance Plc Green Bond Framework (August 2022).
Management’s responsibility
The Management of the Company is responsible for preparing the Selected information in accordance with the reporting criteria as set out in the Company’s reporting instructions (described in Company’s Green Impact Report 2023), Eligibility Criteria set out in the Municipality Finance Plc Green Bond Framework (August 2022). The Management of the Company is also responsible for such internal control as the management determines is necessary to enable the preparation of the Selected information that is free from material misstatement, whether due to fraud or error.
Practitioner’s independence and quality management
We have complied with the independence and other ethical requirements of the International Code of Ethics for Professional Accountants (including International Independence Standards) issued by the International Ethics Standards Board for Accountants (IESBA code), which is founded on fundamental principles of integrity, objectivity, professional competence and due care, confidentiality and professional behavior.
PricewaterhouseCoopers Oy applies International Standard on Quality Management (ISQM) 1, which requires the firm to design, implement and operate a system of quality management including policies or procedures regarding compliance with ethical requirements, professional standards and applicable legal and regulatory requirements.
Practitioner’s responsibility
Our responsibility is to express a limited assurance conclusion on the Selected information based on the procedures we have performed and the evidence we have obtained. We conducted our limited assurance engagement in accordance with the International Standard on Assurance Engagements (ISAE) 3000 (revised) “Assurance Engagements Other than Audits or Reviews of Historical Financial Information”. This standard requires that we plan and perform the engagement to obtain limited assurance about whether the Selected information is free from material misstatement.
85/87 Green Impact Report 2023 Municipality Finance Plc • Green Impact Report 2023 External verification
In a limited assurance engagement, the evidence-gathering procedures are more limited than for a reasonable assurance engagement, and therefore less assurance is obtained than in a reasonable assurance engagement. An assurance engagement involves performing procedures to obtain evidence about the amounts and other information in the Selected information. The procedures selected depend on the practitioner’s judgment, including an assessment of the risks of material misstatement of the Selected information.
Our work consisted of, amongst others, the following procedures:
• Interviewing employees responsible for collecting and reporting the Selected information.
• Assessing how employees apply the reporting instructions and procedures of the Company with regards to whether the disclosures have been prepared in accordance with the Municipality Finance Plc Green Bond Framework (August 2022).
• Inspecting the documentation of the Green Finance Team to confirm that the allocation of Green Bond proceeds to eligible green projects had been considered and approved according to the process described in the Municipality Finance Plc Green Bond Framework (August 2022).
• Performing substantive testing to verify the existence of eligible green projects and accurate allocation of green bond proceeds per eligible green projects in accordance with the Municipality Finance Plc Green Bond Framework (August 2022).
• Testing the consolidation of information and performing recalculations on a sample basis.
• Considering the disclosure and presentation of the Selected information.
Limited assurance conclusion
Based on the procedures we have performed and the evidence we have obtained, nothing has come to our attention that causes us to believe that Municipality Finance
Plc’s Selected information for the reporting period ended 31 January 2023 is not properly prepared, in all material respects, in accordance with the Reporting criteria.
When reading our limited assurance report, the inherent limitations to the accuracy and completeness of the Selected information should be taken into consideration.
Our assurance report has been prepared in accordance with the terms of our engagement. We do not accept, or assume responsibility to anyone else, except to Municipality Finance Plc.
Helsinki 7 March 2024
PricewaterhouseCoopers Oy
Tiina Puukkoniemi
Partner, Authorised Public Accountant (KHT)
Sustainability Reporting & Assurance
86/87 Green Impact Report 2023 Municipality Finance Plc • Green Impact Report 2023
verification
External
All information expressed in this document reflects the situation at the time of writing and may change without notice. MuniFin holds no obligation to update, modify or amend this publication. To the extent the material herein pertains to parties other than MuniFin, such information is based on material made available to MuniFin by third parties, and MuniFin does not make any representations or warranties as to the accuracy or completeness of such information. The material is informative in nature, and should not be interpreted as a recommendation to take, or not to take, any particular investment action. The material is intended for private use and may not be copied, in part or in whole, without written permission from MuniFin. This document or copies of it must not be distributed in the United States or to recipients who are citizens of the United States against restrictions stated in the United States legislation. Laws and regulations of other jurisdictions may also restrict the distribution of this document.
Municipality Finance Plc
Jaakonkatu 3 A, PL 744
00101 Helsinki
Tel. +358 9 6803 5666
www.munifin.fi
info@munifin.fi
