Green Impact Report 2022


Contents 3 Green investments help to build a socially, economically and ecologically sustainable Finland 4 Change presents new opportunities 7 Regulation cultivates the green finance market 9 Renewed Green Bond Framework 11 EU Taxonomy boosts green investments 13 Green finance in figures 15 Executive summary 16 Our seventh green bond was again well received by investors 17 Green finance portfolio 20 The Green Finance Team 22 Reporting principles 22 Our approach 23 Changes to impact evaluation 24 Changes to report presentation 25 Calculation principles 28 Nordic reporting recommendations harmonise the green bonds market 30 The impacts of green finance 32 Buildings 33 Transportation 34 Renewable energy 35 Water and waste water management 36 Green projects promote the following UN Sustainable Development Goals 38 Other impacts of our projects 39 Projects approved in 2022 46 Green finance projects and impacts 62 External verification Cover and page 2: Äänekoski Ice hockey arena Green Impact Report 2022 Municipality Finance Plc • Green Impact Report 2022 2/64
Green investments help to build a socially, economically and ecologically sustainable Finland
We are committed to building a better and more sustainable future with our customers. Sustainability is a key part of our strategy and work, best made concrete through our business operations. We have offered our customers green finance for sustainable investments since 2016. In 2020, we complemented it by launching social finance, which is offered for projects that produce widespread social benefits. We source the funding for our green and social finance products from the international capital markets by issuing green and social bonds. For investors, these products offer a way to finance positive change.
Promoting the United Nations Sustainable Development Goals (SDGs) has played an important role in the planning of our green and social finance offering. As a public sector lender, we wish to address the national challenges of sustainable development highlighted in Finland’s Voluntary National Review on the implementation of the 2030 Agenda1, such as reducing greenhouse gas emissions, inequality and social exclusion.
MuniFin is signatory to the Society’s Commitment to Sustainable Development, entitled The Finland We Want by 2050, and we are thus committed to promoting national sustainability goals in all our work. The projects funded with
our green and social finance promote the strategic themes of the Finnish Government Programme2 that builds on sustainability. One of these themes is to strive for a carbon neutral Finland that protects biodiversity. This includes the objective of Finland achieving carbon neutrality by 2035. With the amendment of Finland’s Climate Act in 2022, the objectives of carbon neutrality and carbon negativity after 2035 were set down also in Finnish legislation.
MuniFin’s green and social finance can be granted to investments that produce widespread environmental or social benefits. The socially significant investments of the Finnish municipal sector and affordable social housing organisations
play a key role in advancing solutions designed to promote the achievement of the SDGs, the Finnish Government Programme and the Climate Act. In terms of climate goals, Finnish municipalities are doing pioneering work: 92 municipalities have already joined the Carbon Neutral Municipalities (Hinku) network3 and are thus committed to striving for 80% reductions in their greenhouse gas emissions by 2030. These municipalities are home to more than 2.3 million people, so this work touches the lives of over 40% of Finns. Another important cooperation body is the Finnish Sustainable Communities (Fisu) network of Finnish municipalities committed to working towards becoming carbon neutral and waste-free and curbing overconsumption by 20504
The aim of our green and social finance is to create significant benefits for the environment and society. We want to enable our customers’ positive development and make sustainable choices even more accessible. In this report, we summarise the impact of our green finance projects. The impact of our social finance is described in a separate report.
1 https://julkaisut.valtioneuvosto.fi/handle/10024/162268
2 https://valtioneuvosto.fi/en/marin/government-programme
3 https://hiilineutraalisuomi.fi/en-US/Hinku/Hinku_municipalities
4 https://www.fisunetwork.fi/en-US
Foreword
Green Impact Report 2022 Municipality Finance Plc • Green Impact Report 2022 3/64
Change presents new opportunities
Green finance has solidified its position in MuniFin’s product range. In customer conversations, we often find ourselves not just discussing green finance, but also exploring the topics of responsibility, sustainability and climate work more broadly. At the end of 2022, we had committed EUR 3,9 billion to financing our customers’ green projects and were steadily on our desired growth path. This is largely thanks to our highly committed customers, bold trailblazers who have chosen to open-mindedly adopt new solutions instead of settling for the old.
A few years ago, I wrote a column about why new developments all too often require a crisis, a black swan that forces us to change our ways because we have no other options left. Russia’s invasion of Ukraine has quickly induced changes that were previously considered unlikely or even impossible by many. The price of the unjustified war is inconceivable by all standards – especially humane – so we must do everything in our power to turn what we can of the crisis into an opportunity to create a better tomorrow.
All over Europe, the most concrete effects of the war are surfacing through the energy crisis. MuniFin’s customers play a key role in finding solutions to this crisis. Many of our customers had already invested in energy efficiency and fossil-free energy before it, making them better equipped to not only

Editorial
Green Impact Report 2022 Municipality Finance Plc • Green Impact Report 2022 4/64
adapt to the growing costs, but also seize new opportunities. Municipalities can also make their carbon neutrality work a competitive advantage with businesses: when they can offer companies a low-carbon operating environment, their vitality improves both directly and indirectly.
In my opinion, the hot topics of 2022 have further underlined the importance of the goals that our green finance promotes: efficient and fossil-free energy use and the extensive consideration of sustainable implementation, not forgetting the protection of biodiversity.
In order for rapid developments to continue, we need even closer collaboration and dialogue between different parties. Positive examples of such collaboration include the Finnish construction sector, led by the Green Building Council Finland (FIGBC), starting to work on more specific interpretations of what activities in the national context are aligned with the EU Taxonomy for Sustainable Activities. This work is crucial for finding shared ways to determine
and interpret criteria originally created for the entire continent and to reach a shared understanding for investors, constructors and financiers alike.
The need for stakeholders to interact with each other is increasingly related to information needs. Various stakeholder groups have a growing need to acquire information about the environmental impacts of projects and project participants. The importance of knowledge-based management and especially of the ability to establish and communicate a clear link between financial and environmental sustainability will only keep increasing.
In 2022, MuniFin updated its Green Bond Framework.
As part of the changes, we decided to start using only our own experts in project evaluation and incorporated EU Taxonomy requirements in the eligibility criteria. We believe this will increase our customers’ understanding of the objectives the EU seeks to achieve through the financial markets as part of its climate policy.
Change always presents new opportunities. An effective and non-violent measure we can collectively take as a response to the war is to transfer to a fossil-free world as quickly as possible. The same measure will also help contribute to the more long-lasting battle against climate change. The latter crisis is our own making, but it is also one that we can solve together if we are prepared to put in the effort.
Rami Erkkilä Senior Specialist,
sustainable finance
The author is responsible for green and social finance products at MuniFin.
Editorial
Green Impact Report 2022 Municipality Finance Plc • Green Impact Report 2022 5/64
Cost-effective emission reductions and cross-municipal collaboration – in Vihti, climate work cuts across municipal sectors
The Municipality of Vihti is committed to Finland’s national climate and environmental goals and aims to cut greenhouse gas emissions by 50% per resident by 2030. In Vihti, climate work is guided by the municipality’s climate strategy working group, and its implementation is coordinated by an interadministrative climate team. The municipality drafted its first ever climate budget for 2023, including an emissions budget and the operative goals of climate work.
In April 2021, the Ministry of the Environment granted funding for the Municipal Climate Solutions Programme developing a cost-effective model for climate work in small and medium-sized municipalities. Vihti works closely with its neighbouring municipality Kirkkonummi in climate matters, and the municipalities have hired a joint climate coordinator tasked with mapping cost-effective ways to reduce emissions in both municipalities.
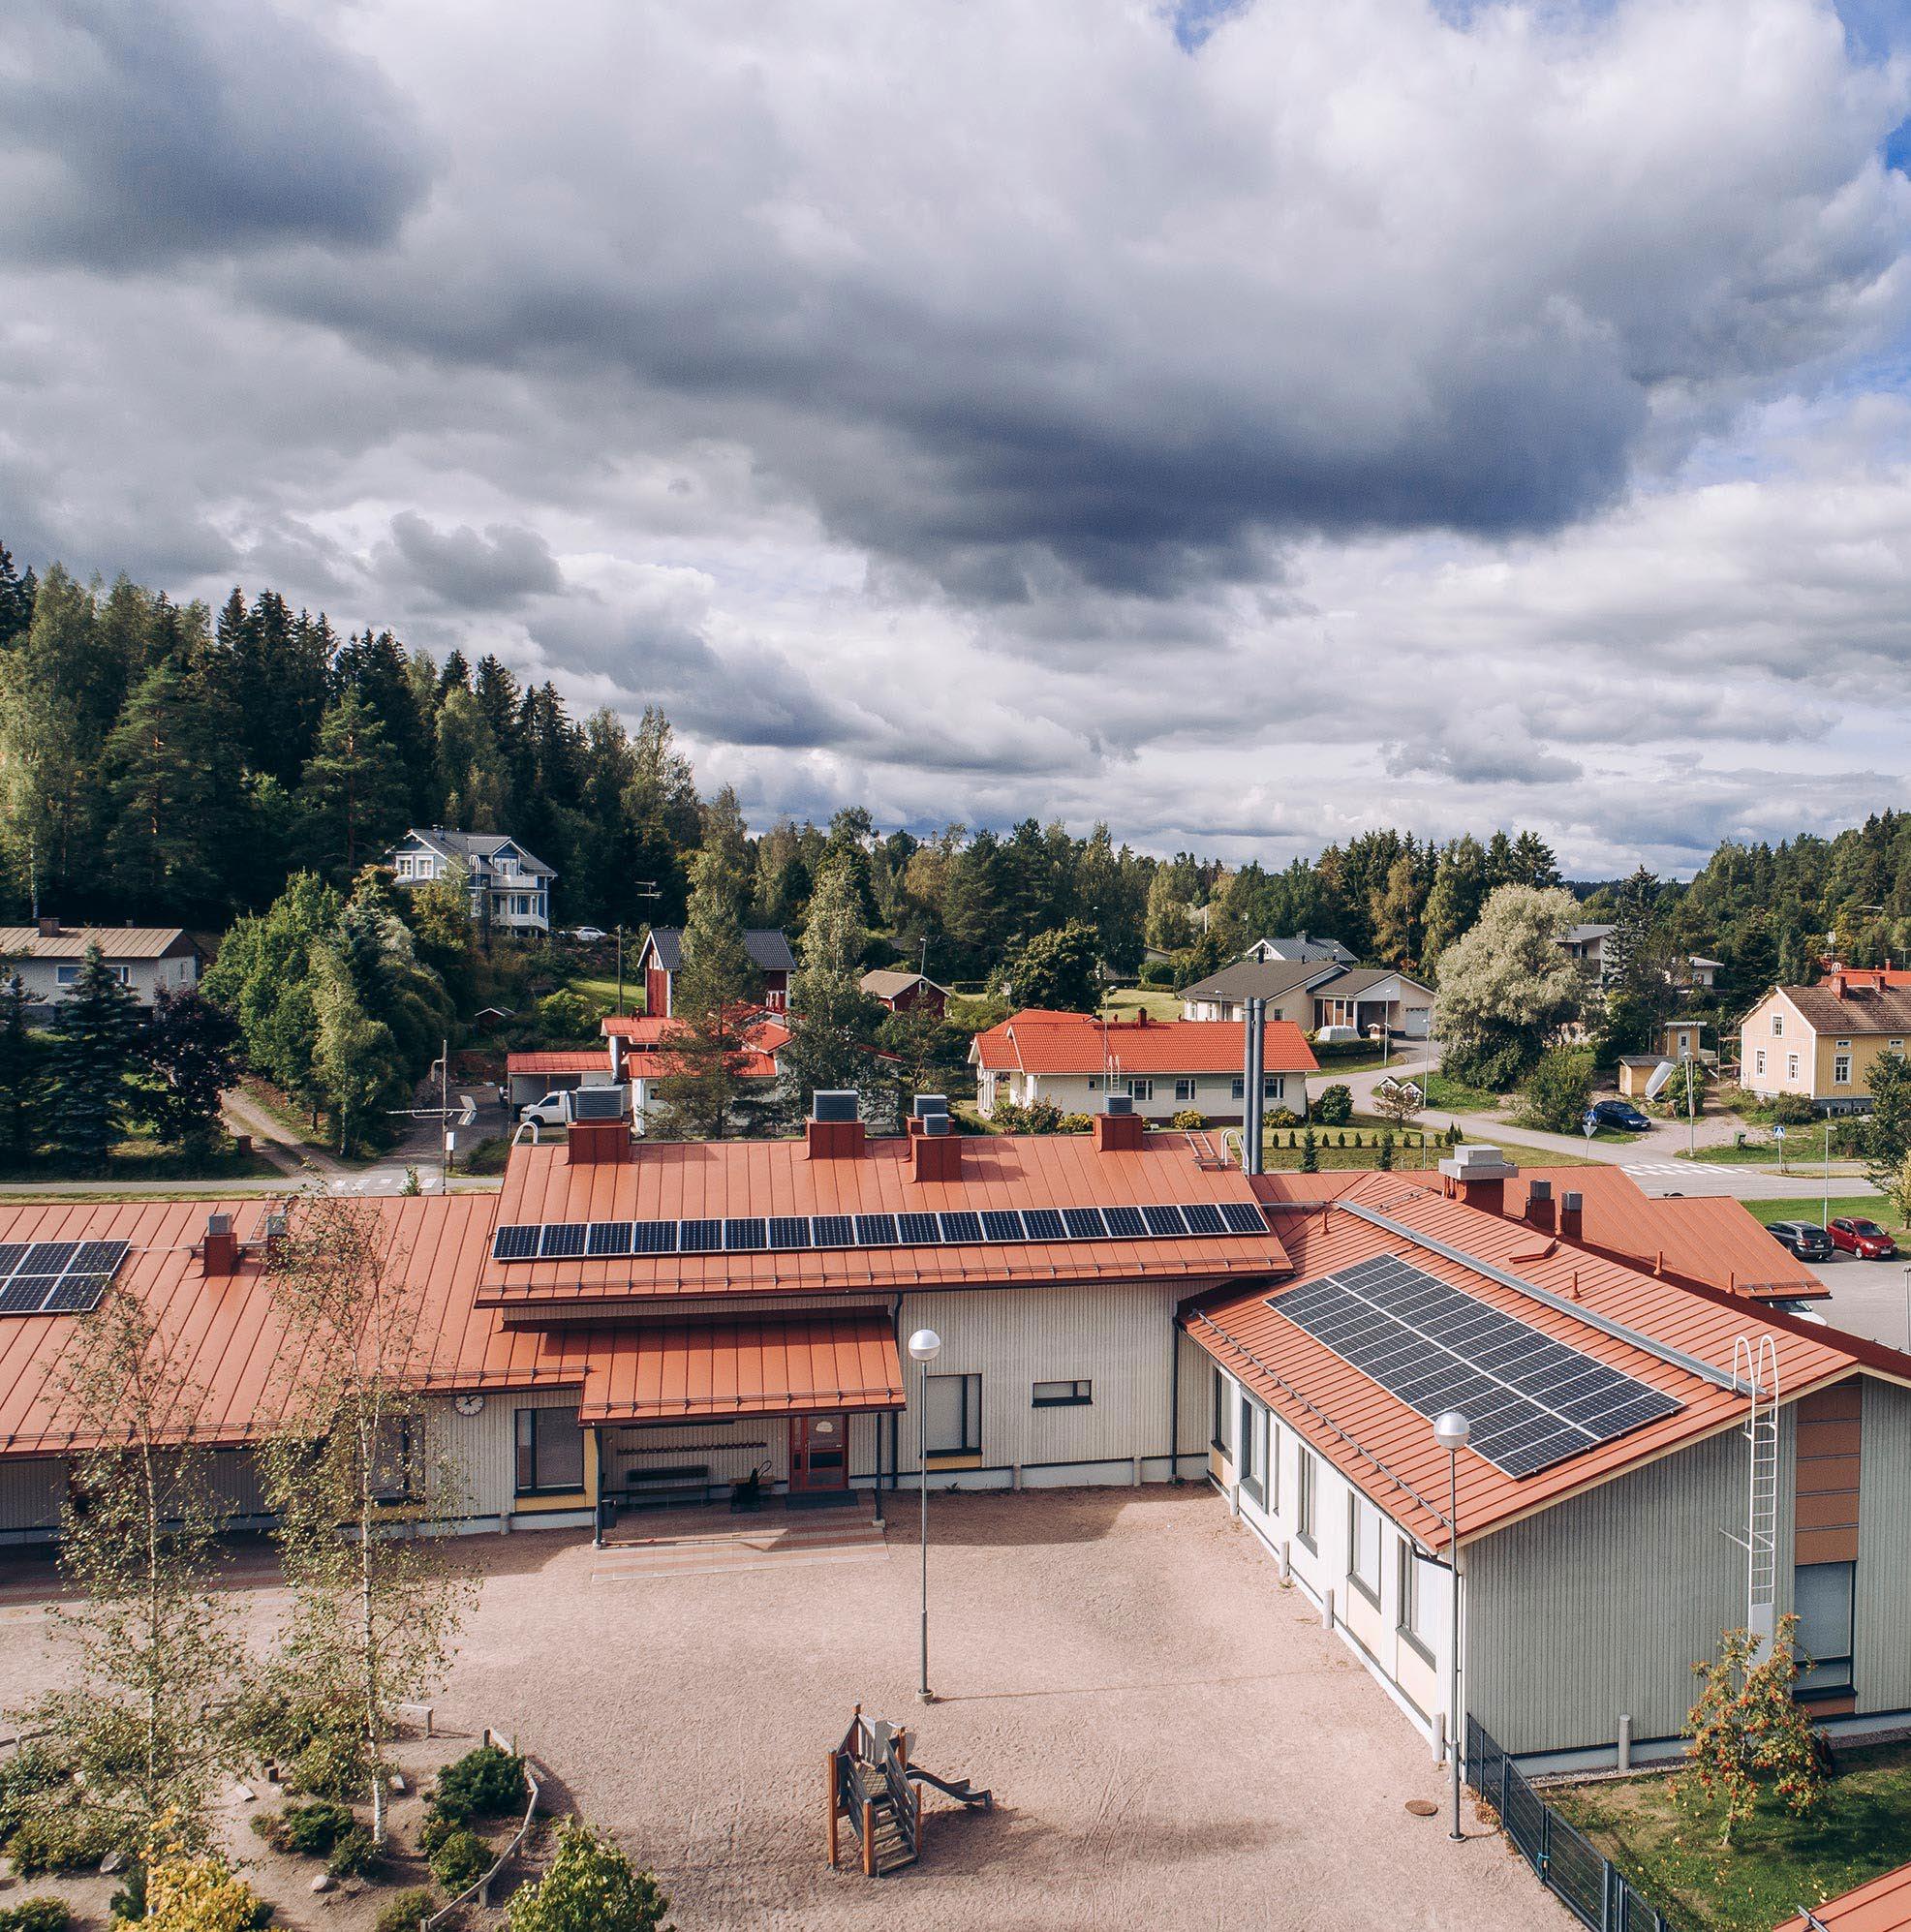
Climate work has been a success in Vihti. The municipality is currently building an EUR 36.5 million school and day-care centre that will have geothermal heating and cooling. The building will have LED lights, and solar panels will be installed on the roof. Solar panels have already been installed at the Myrskylänmäki day-care centre and child health clinic, the Kuoppanummi school and the municipal hall’s support services building. The solar panels have been financed with MuniFin’s green finance.
CASE
climate
: Vihti’s
work
Case
Green Impact Report 2022 Municipality Finance Plc • Green Impact Report 2022 6/64
Regulation cultivates the green finance market
Regulation cultivates the green finance market
MuniFin’s history of green finance dates back to 2016, when we issued our inaugural green bond. Since then, we have been bridging the gap between international capital markets and the sustainable investments of Finnish municipalities and affordable social housing organisations. Between 2016 and today, the global proportion of green finance has increased many times over thanks to investors increasingly looking for sustainable investments and organisations such as MuniFin’s customers making investments with sustainability in mind.
The rapid development of green finance has been largely driven by pioneering organisations under market conditions. Now that green finance is quickly becoming mainstream, voluntary frameworks such as the Green Bond Principles of the International Capital Markets Association (ICMA) are being accompanied by regulation. The EU Taxonomy for Sustainable Activities and the EU Green Bond Standard, which is still being prepared, aim to create a regulated playing field for green finance. Regulation also pushes financial institutions to consider climate-related and environmental risks even more extensively in all their operations. With
the increased reporting requirements, investors and stakeholders have access to more information than ever before.
In MuniFin’s green finance and in the green finance market more generally, the focus has mainly been on solutions that are sustainable for the environment and climate. Less focus has been placed on the risk aspect, but because sustainability aspects are priced more rigorously in green investments, they may also be less prone to transition risks, such as additional costs introduced by new regulation, or impairment losses. Each sustainable investment plays its part in reducing the vulnerability of physical risks of climate change. These themes are not new, but regulation is now aimed at harmonising risk assessments and increasing risk reporting.
We understand how important transparent reporting is for our stakeholders. In green finance, the importance of impact reporting is particularly great. We have chosen to invest in high-quality impact reporting, and our efforts have been recognised by investors. We are also involved in developing Nordic recommendations on green bonds impact reporting
as part of the Nordic issuer group, which has jointly published the Position Paper on Green Bonds Impact Reporting. The section Reporting principles of this report describes how we meet these reporting recommendations.
Improvements in climate-related and environmental risk management
Financial institutions are improving their management of climate-related and environmental risks, largely spurred on by regulatory pressure. At MuniFin, we consider climate-related and environmental risks as a natural part of our risk management and continuously hone our ability to detect such risks. Our business model also naturally keeps our climate-related and environmental risk position low.
Our customers, and MuniFin as their lender, are nevertheless exposed to both the physical and the transition risks of climate change, which may materialise especially in the medium and long term. Although our customers’ climaterelated and environmental risks are not expected to have a strong impact on MuniFin, we continue to make these risks an
Green Impact Report 2022 Municipality Finance Plc • Green Impact Report 2022 7/64
even more integral part of our risk management processes. We also plan to further enhance our cooperation and engagement with our customers in this regard because of their key role in managing these risks. We already routinely assess all our customers in terms of their climate-related and environmental risks, and our investment process follows our Sustainable Investment Framework. The risk assessment process is the same for all of our finance, including our green finance.
More information on our climate and environmental risks and their management is available in our separate Pillar III Disclosure Report.
A successful year despite the challenging market situation
Despite the challenging market situation marked by the gradually subsiding pandemic, the accelerating inflation, the energy crisis and the war in Ukraine, the past year was successful for our green finance. Our green finance portfolio continued to grow by EUR 923 million from EUR 2.328 billion at the end of 2021 to EUR 3.251 billion at the end of 2022. This year’s green projects were dominated by construction and renovation. Active companies in sustainable building included TA Companies, Avain Yhtiöt Oy, Asuntosäätiö sr and M2-Kodit. In the transportation category, a major new project was the Crown Bridges, which promotes emission-free
transport by creating new routes for walkers, bicyclists and public transport in Helsinki while allowing for dynamic urban development and denser city structure.
In May 2022, we continued our green funding operations by issuing a green bond of EUR 500 million maturing in 2029. This many times oversubscribed bond attracted as high as 80% participation from dedicated ESG investors. The successful issuance and the ‘2022 Green Bond of the Year’ award by Environmental Finance that we won in the local authority or municipality category are again testament to the high confidence the market has in our green finance.
MuniFin’s green finance has many positive effects on society. The green projects are concrete proof of how we can actively reduce human impact on nature and the climate. With energyefficient construction becoming mainstream, we no longer have to make compromises between things like affordable and energy-efficient housing. We must adapt to changes caused by global warming, but sustainable lifestyle is becoming accessible to an increasing number of people. The more innovative green projects also address natural capital and risks related to climate change more broadly. This the direction we encourage our customers to choose more and more often, and we take such broader aspects of
sustainability into consideration in our project evaluation. Starting from this report, we will introduce them in our reporting through short project descriptions.
Regulation cultivates the green finance market Green Impact Report 2022 Municipality Finance Plc • Green Impact Report 2022 8/64
Renewed Green Bond Framework
To keep up with the evolving market, we continued to develop our green finance in 2022. The most visible result of this work was the renewal of our Green Bond Framework1 in September. The framework was originally published in 2016 and updated in 2017, 2018 and 2019. In the 2022 update, the most notable changes concerned the introduction of more transparent and ambitious project eligibility criteria and a more streamlined project evaluation process. The purpose of these changes was to help both investors and our customers better understand the types of projects that are eligible for our green finance.
To improve the clarity of our framework, we reduced the number of project categories from seven to four. One of the categories that we took out was energy efficiency, but investments in energy efficiency continue to be eligible under the buildings category also under the new framework. The other two removed categories were waste management and environmental management. We have
never had any projects in these categories in all our years of green finance, so we decided to leave them out for the time being. To allow us to finance projects related to biodiversity and climate change adaptation, we added a new subcategory for them under buildings and transportation categories.
Our Green Bond Framework was designed in accordance with the Green Bond Principles of the International Capital Market Association. To guide our customers and green investments increasingly towards common practices, we have also used the EU Taxonomy for Sustainable Activities and the proposed EU Green Bond Standard as guiding tools in defining our eligibility criteria and overall framework structure.
1 https://www.kuntarahoitus.fi/app/uploads/sites/2/2022/12/MuniFin-Green-Bond-framework.pdf
MuniFin’s renewed Green Bond Framework has four project categories:
Renewed Green Bond Framework BUILDINGS TRANSPORTATION WATER AND WASTE WATER MANAGEMENT RENEWABLE ENERGY
Green Impact Report 2022 Municipality Finance Plc • Green Impact Report 2022 9/64
Although we used the EU Taxonomy as a guiding tool when we updated our framework, we believe that it is still too early to fully align our framework with it. In its external review of our Green Bond Framework, Cicero Shades of Green assessed how well our project categories currently align with the EU Taxonomy’s technical screening criteria. This assessment is available in the second opinion on the Green Bond Framework2 on our website. We also summarise its results in this report in the section EU Taxonomy boosts green investments.
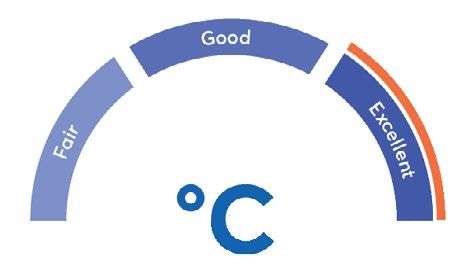
In its Second Party Opinion, Cicero Shades of Green gave MuniFin’s Green Bond Framework the second-best rating of Medium Green, with an excellent rating in the governance assessment.
In updating our Green Bond Framework, we also improved our project impact reporting. In this report, we mainly present direct and measurable environmental impacts. We also report the criteria that new projects have met in order to be approved for green finance. In addition, we respond to our stakeholders’ wishes by providing short descriptions of new projects to better allow our stakeholders to understand the funded investments.
2 https://www.kuntarahoitus.fi/app/uploads/sites/2/2022/09/Second-Opinion-CICERO-GREEN.-final.-Munifin.-15.08.2022.pdf
Renewed Green Bond Framework
Ratings by Cicero Shades of Green for MuniFin's Green Bond Framework
Green Impact Report 2022 Municipality Finance Plc • Green Impact Report 2022 10/64
EU Taxonomy boosts green investments
EU Action Plan on Financing Sustainable Growth MuniFin closely follows the progress of the European Commission’s Action Plan on Financing Sustainable Growth, especially the EU Green Bond Standard and the EU Taxonomy for Sustainable Activities. We consider both initiatives very welcome. The definitions of environmentally sustainable activities need to be harmonised, and investments in such activities need to be increased.
Market practices regarding the EU Taxonomy are evolving constantly, but the availability of information poses a market-wide challenge, making the verification of taxonomy alignment more difficult. Especially practices regarding the ‘do no significant harm’ (DNSH) principle and the minimum social safeguards (MSS) must be developed further. MuniFin participates actively in developing these practices. In 2022, we were involved in the work of Green Building Council Finland (FIGBC) seeking to solve taxonomy challenges in the building and construction sector.
We also considered the EU Taxonomy as a guiding tool when we updated our Green Bond Framework, seeking to harmonise our eligibility criteria with taxonomy requirements where applicable. For example, we included taxonomy considerations in our project assessment for new buildings, but we do not yet require the testing of air-tightness and thermal integrity or the calculation of the life-cycle global warming potential (GWP). By doing so, we want to monitor how these measures start gaining ground and encourage our customers to leverage them in their projects. We believe that this will encourage our customers to increasingly consider taxonomy criteria in their green projects.
Cicero Shades of Green has carried out an external review of our Green Bond Framework, including an assessment of how well its eligibility criteria align with the EU Taxonomy’s technical screening criteria for climate change mitigation. The assessment found most of our project subcategories to be likely aligned with the technical screening criteria.
1 https://www.kuntarahoitus.fi/app/uploads/sites/2/2022/09/Second-Opinion-CICERO-GREEN.-final.-Munifin.-15.08.2022.pdf
Some project subcategories were found to be likely partially aligned. The alignment of water and waste water management project criteria could not be assessed because Finland’s practices and therefore also our framework criteria differ significantly from the taxonomy criteria. A more detailed assessment is available in the second opinion on the Green Bond Framework1 on our website. The results are summarised in the tables below. The alignment of the projects in our green portfolio with the EU Taxonomy’s technical screening criteria can be read against this information.
EU Taxonomy boosts green investments
Green Impact Report 2022 Municipality Finance Plc • Green Impact Report 2022 11/64
of the Green Bond Framework criteria with the EU Green Taxonomy's technical screening criteria
EU Taxonomy boosts green investments Buildings Transportation Renewable energy Water and waste water management Likely aligned 7.2 Renovation of existing buildings 6.1 Passenger interurban rail transport 4.1 Electricity generation using solar photovoltaic 7.3 Installation, maintenance, and repair of energy efficiency equipment 6.3 Urban and suburban transport, road passenger 4.3 Electricity generation from wind power
Installation, maintenance, and repair of instruments and devices for measuring, regulation and controlling energy performance of buildings 6.5 Transport by motorbikes, passenger cars and light commercial vehicle 4.6 Electricity generation from geothermal energy 7.6 Installation, maintenance, and repair of renewable energy technologies 6.7 Inland passenger water transport 4.22 Production of heat/cool from geothermal energy 6.8 Inland freight water transport 4.25 Production of heat/cool using waste heat 6.10 Sea and coastal freight water transport, vessels for port operations and auxiliary activities 6.11 Sea and coastal passenger water transport 6.14 Infrastructure for rail transport 6.15 Infrastructure enabling low carbon road transport and public transport Likely partially aligned 7.1 Construction of new buildings 6.13 Infrastructure for personal mobility, cycle logistics 4.24 Production of heat/cool from bioenergy 7.7 Acquisition and ownership of buildings Not possible to assess alignment 5.1 Construction, extension and operation of water collection, treatment and supply systems 5.2 Renewal of water collection, treatment and supply systems 5.3 Construction, extension and operation of waste water collection and treatment 5.4 Renewal of waste water collection and treatment
7.5
Green Impact Report 2022 Municipality Finance Plc • Green Impact Report 2022 12/64
Alignment
Green finance in figures
263 Number of green projects
Outstanding amount of green finance EUR million
3,251
Total committed green finance EUR million
3,883
Green portfolio duration
13 years
Annual energy savings (avoided/reduced)
39,2151 MWh
Annual production of renewable energy
191,695 MWh
Annual amount of treated waste water in existing plants immediately after project completion
27,896,515 m³
104,7392
Annual amount of treated waste water with increased capacity in the future
30,407,158 m³
Figures based on the outstanding amount of green finance on 31 December 2022
1) 39,215 MWh: Equals the annual consumption of about 2,252 electrically heated single-family houses (Source Motiva) 2) 104,739 tCO₂: Equals the average annual carbon footprint of about 10,169 Finns (Source: Sitra)
tCO2
CO₂ emissions avoided/reduced
Annual
Green finance in figures
production capacity Green Impact Report 2022 Municipality Finance Plc • Green Impact Report 2022 13/64
78 MW Renewable energy
Our green finance portfolio is composed entirely of new projects. In accordance with our Green Bond Framework, new projects are ones that have been completed less than 12 months before the Green Finance Team has approved them for our green finance portfolio. Our portfolio does not include refinanced projects, i.e. projects completed more than one year before their approval.*
As an exception to our normal assessment and approval process in which each project is approved on a case-bycase basis, the Green Finance Team decided in early 2022 that new electric vehicles acquired by our customers do not require approval as individual purchases, but are instead accepted into the portfolio as updated figures, based on the
change in the financed amount from to the time of the previous reporting. At the time of the decision, this included electric cars purchased by our customers in late 2021. In accordance with our normal approval and reporting practices, we report these projects in the 2022 impact report.
At the end of 2022, MuniFin’s outstanding amount of green finance stood at EUR 3,251 million, exceeding the outstanding amount of green bonds, which was EUR 2,330 million.
*Nordic Public Sector Issuers: Position Paper on Green Bonds Impact Reporting (2020) recommends reporting the financing/refinancing share as per the EU Green Bond Standard. MuniFin does not report this figure because the EU Green Bond Standard is not yet valid.
Outstanding amount of green bonds, EUR million
2,330 New projects 100%
Outstanding amount of green finance, EUR million
3,251
Figures as at 31 December 2022
Green finance in figures
Green Impact Report 2022 Municipality Finance Plc • Green Impact Report 2022 14/64
amount
USD 500M ( 9 / 2021 )
GBP 250M ( 12 / 2024 ) EUR 500M ( 9 / 2027 )
AUD 50M ( 10 / 2027 )
EUR 500M ( 5 / 2029 )
EUR 500M ( 9 / 2029 )
EUR 500M ( 10 / 2030 )
12 6 15 230 9% 1% 28% 62%
Green finance project breakdown Development of green finance and green bonds Buildings Water and waste water management Renewable energy Transportation 0 500 1000 1500 2000 2500 3000 3500 4000 2022 2021 2020 2019 2018 2017 2016 M€ Other impact indicators Annual energy savings (avoided / reduced MWh) 39,215 Annual production of renewable energy (MWh) 191,695 Renewable energy production capacity (MW) 78 Annual amount of treated waste water in existing plants immediately after project completion (m3) 27,896,515 Annual amount of treated waste water with increased capacity in the future (m3) 30,407,158 Project category Outstanding amount, EUR million Annual CO₂ emissions avoided/reduced, tCO₂ Impact, tCO₂ per EUR million Buildings 2,009 3,597 2 Transportation 901 8,813 10 Renewable energy 51 92,329 1,799 Water and waste water management 290 0Total 3,251 104,739 N / A Impact attributable to green bond investors 71.7% Outstanding amount of green bonds divided by outstanding amount of green finance (in EUR) as of 31 Dec 2022. Capped at 100%. Amount ISIN Issue date Maturity date 500m EUR XS2242924491 14 Oct 2020 14 Oct 2030 15.4% 500m EUR XS2023679843 10 July 2019 6 Sept 2029 15.4% 500m EUR XS2480922389 17 May 2022 17 May 2029 15.4% 50m AUD XS1706174015 25 Oct 2017 25 Oct 2027 1.0% 500m EUR XS1692485912 3 Oct 2017 7 Sept 2027 15.4% 250 m GBP XS2404205119 2 Nov 2021 16 Dec 2024 9.1% Basic information Green bonds frameworks applied to the green finance portfolio MuniFin Green Bonds Framework August 2022, May 2019, November 2018, August 2017 and February 2016 Reporting period The reporting is based on the green finance portfolio as at 31 Dec 2022 Report publication date 7 March 2022 Reporting frequency Annual Next report planned for March/April 2024 Reporting approach Portfolio-based and project-by-project reporting Reporting framework Nordic Public Sector Issuers: Position Paper on Green Bonds Impact Reporting (February 2020) Executive summary number of projects %/EUR
Executive summary
Outstanding
of green finance Unwithdrawn credit commitments
Green Impact Report 2022 Municipality Finance Plc • Green Impact Report 2022 15/64
was again well received by investors
Our seventh green bond was again well received by investors
At the end of 2022, MuniFin had six outstanding green bonds. We have issued a total of seven green bonds, the first of which matured in September 2021.
In May 2022, we issued our fourth green bond denominated in euros. The EUR 500 million, 7-year green benchmark was quickly over three times oversubscribed and attracted nearly 80% participation from dedicated ESG investors. This issuance increased the total amount of our outstanding green bonds from EUR 1,830 million to EUR 2,330 million. None of our green bonds matured in 2022.
GBP 250m 12/2024
EUR 500m 9/2027
AUD 50m 10/2027
EUR 500m 5/2029
EUR 500m 9/2029
EUR 500m 10/2030
The charts describe the investor breakdown of the primaryissuance of outstanding green bonds. Figures as at 31 December 2022
Outstanding green bonds Investor breakdown by geography Investor breakdown by investor type 2% 5% 10% 14% 69% 15% 22% 30% 33%
Total amount of outstanding green bonds €m
Foreign currencies in euros Europe Nordic countries Asia-Pacific region The Americas Africa and Middle East Central banks and official institutions Banks Asset managers Insurance and pension funds Green Impact Report 2022 Municipality Finance Plc • Green Impact Report 2022 16/64
Our seventh green bond
2,330
Green finance portfolio
At the end of 2022, the number of projects in our green finance portfolio was 263, of which 246 projects had begun to withdraw finance. The outstanding amount of green finance, which means the amount of finance disbursed minus repayments, totalled EUR 3,251 million at year-end. Total committed finance, which is the sum of the outstanding amount and the amount of unwithdrawn credit commitments, was EUR 3,883 million. The green finance projects are situated in 84 different municipalities across Finland. A summary of the impacts of these projects can be found on page 31 and a detailed list of our green finance projects can be found on pages 46-61.
In 2022, we accepted a total of 55 new projects into our green finance portfolio, of which 41 had begun to withdraw finance at the end of the year. For projects approved in 2022, the outstanding amount of green finance totalled EUR 424 million and the credit commitments totalled EUR 798 million at the end of the year.
The largest category of projects approved in 2022 was buildings with 45 approved projects. In addition, we granted green finance to 10 transportation projects. There were no new renewable energy projects or water and waste water management projects in 2022.
Vihreän rahoituksen hankkeiden jakauma 290 51 901 2,009 12 6 15 230 number of projects EUR million Outstanding amount of green finance EUR million 3,251 This map is for reference only. Green finance portfolio Buildings Transportation Renewable energy Water and waste water management Green Impact Report 2022 Municipality Finance Plc • Green Impact Report 2022 17/64
Project compatibility under the updated Green Bond Framework1
Because our green finance applies a portfolio approach, different projects have been approved under different versions of our Green Bond Framework. In the 2022 update, we improved the transparency of our green project eligibility criteria. The new criteria are stricter than before, which is why some projects approved under previous frameworks do not fulfil the new criteria. For the sake of transparency, we re-evaluated past projects using the new criteria.
We are committed to maintaining a sufficient number of green finance projects in our portfolio to cover the funds raised by green bonds issued after the publication of our updated Green Bond Framework. We have not yet issued new green bonds after the update.
A total of 263 projects out of 228 fulfil the new Green Bond Framework1 criteria. The combined outstanding amount of these projects was EUR 2,885 million at the end of 2022. For each project, its compatibility with the new criteria is disclosed in the separate Green Impact Report Spreadsheet published concurrently with this report on the MuniFin website. This report’s allocation assurance covers only the projects that are aligned with the criteria included in the Green Bond Framework published in 2022.
We re-evaluated projects approved under previous versions of the Green Bond Framework, now applying the updated framework and a conservative approach. If we did not have enough information to verify a project’s compatibility with the updated criteria, the project was deemed incompatible. We ascertained that none of our green projects contain any solutions that use fossil fuels, excluding specific exceptions in the bioenergy category (3.3) detailed in the framework.
Most projects approved under previous versions of our Green Bond Framework belonged to the sustainable buildings category. For these projects, the most important thing was to verify that they do not include any solutions that use fossil fuels as their source of energy, and that the energy efficiency of these buildings corresponds to energy class A in the updated national energy efficiency decree (1010/2017) that took effect in 2018. To achieve this, we re-calculated their energy consumption using the coefficients for forms of energy according to the updated Government Decree (788/2017). For other buildings, such as ice hockey arenas and swimming halls, we examined the share of the building’s own renewable energy production compared to the building’s total energy demand, as well as other proven environmental benefits. For renovation projects, we verified that the energy efficiency of buildings improved by at least 30%, measured as an average across all buildings in the same project. We used
1 https://www.kuntarahoitus.fi/app/uploads/sites/2/2022/12/MuniFin-Green-Bond-framework.pdf
the same approach in other individual projects related to improving energy efficiency, such as ESCO projects.
In sustainable public transportation projects, we checked that they serve traffic with zero tailpipe emissions. In renewable energy projects, we focused mainly on the project’s primary energy source. In water and waste water management projects, we made sure that they exceed the quality requirements specified in their environmental permit and that the facilities are not heated with fossil energy sources. For existing facilities we ensured checked that the purification becomes more efficient or the purification quality improves as a result of the changes made.
Green finance portfolio
Aligned with the criteria1 Not aligned with the criteria1 Projects MEUR Projects MEUR 1. Buildings 198 1,683 32 326 2. Transportation 14 876 1 25 3. Renewable energy 5 43 1 8 4. Water and waste water management 11 282 1 7 Total 228 2,885 35 367
Green Impact Report 2022 Municipality Finance Plc • Green Impact Report 2022 18/64
Fossil fuels and nuclear power in projects under the updated framework
When updating our Green Bond Framework, we specified that we will no longer accept projects involving solutions that are directly powered by fossil fuels. Notably for buildings, this also excludes hybrid solutions, peak load and backup systems. With this change, we want to make sure that investments will no longer be directed towards technologies that depend on fossil fuels. Properties with district heating can still be accepted into our portfolio even if the area’s district heating production still involves a fossil fuel component. Finnish district heating is becoming less carbon-dependent every year.
In some bioenergy heating plants, the fossil energy component cannot be completely avoided, because it may be required for the start-up of the plant and to guarantee the security of supply in situations where renewable fuel is unavailable (cf. Green Bond Framework, project category 3.3).
At the end of 2022, our green finance portfolio included bioenergy heating plants in four municipalities: Kangasala, Kemi, Seinäjoki and Taipalsaari.
MuniFin’s business model does not allow financing of nuclear power. Because this automatically excludes nuclear power from green finance projects, it is not mentioned in our Green Bond Framework.
Fossil fuels in exceptional projects under previous frameworks
At the end of 2022, our green finance portfolio included two projects that involve a fossil fuel component at the commissioning stage of the investment. These two projects are the Kvarken Archipelago car and passenger ferry in the sustainable public transportation category and the Energy Self-Sufficient Lempäälä project in the renewable energy category, both of which were approved for green finance before our Green Bond Framework was updated. Both projects are looking to substitute natural gas with biogas once its availability becomes sufficient. Project documentation suggests that the environmental impact of these projects will be significantly improved compared to prior technology, even using natural gas, and this positive effect will only increase once biogas becomes a technically and economically feasible option.
In the sustainable buildings category, Huvimäentie 16, a project by Joensuun Kodit Oy, was approved in 2021. Even though fossil fuel is used for heating in this building, the renovations we finance will reduce its overall CO₂ emissions by more than 50%.
Experimental project
In the sustainable buildings category, the construction of apartment building for Kiinteistö Oy Oulun Tarve at Pohjantikankuja 4 by TA-Yhtymä Oy was accepted into the green finance portfolio in 2019 due to its value as an interesting pilot project, even though its energy efficiency (energy class C, 2018) did not fulfil the framework criteria. The intent of the project is to prove that by utilising brick construction and traditional architectural engineering, the original energy efficiency calculations of the project can be overturned once the building is in use. If the project reaches its goals, it will also fulfil the energy efficiency criteria of our framework. On the basis of the building’s initial energy certificate, the project does not currently have any effect on the presented impact calculations.
The first year’s experiences and measurements cannot be used to estimate the project’s long-term impacts because the implementation phase involves technical and operational specifications and testing that cannot be used as a reference point for the building’s efficiency in the long term. We continued to monitor the project in 2022.
We are committed to monitoring and reporting on the usephase experiences and measurement results from each of the aforementioned projects, as well as to making sure that the original aims of the projects are fulfilled and in line with our Green Bond Framework. We will give out further information on the projects if requested.
Green finance portfolio
Green Impact Report 2022 Municipality Finance Plc • Green Impact Report 2022 19/64
The Green Finance Team
Projects eligible for MuniFin’s green finance must comply with our Green Bond Framework at the time of their approval. MuniFin’s Customer Solutions division screens loan and lease applications and submits potential applications for review to MuniFin’s Green Finance Team (GFT).
We made substantial changes to our project assessment and approval process in autumn 2022. These changes stemmed from the more transparent eligibility criteria set out in our updated Green Bond Framework and our long experience in customer project evaluation. Before, our green projects were assessed by a team of independent experts, but from now on, we will rely on our newly established Green Finance Team, which is made up of internal sustainability experts only. This improves not only the efficiency of the process, but also enhances customer experience and allows us to accumulate our own sustainability expertise. In addition to adopting
the internal assessment and approval process, we will also introduce an external verification for it. A statement of this is included at the end of this report.
Each project is reviewed independently and approved by the GFT only if it meets the requirements of our updated Green Bond Framework and is thereby considered a favourable option for the environment and climate. To make environmentally friendly investments more attractive to our customers, we grant approved green finance projects a margin discount of 0–10 basis points. The discount is based on the project’s estimated environmental benefits and the extent of its sustainability considerations in both design and implementation. We encourage our customers to consider sustainability aspects when producing project documentation, because the documentation is used in estimating the strength of the project’s positive impact. The GFT scores each project on
a scale of 0 to 10 points. Dark green projects are typically granted 7–10 points, medium green 4–6 points, and light green 1–3 points.
The GFT holds the right to remove any eligible green projects already funded by green bond proceeds if a project for whatever reason no longer meets the eligibility criteria or is found to be or becomes controversial after its approval. The decision to remove a project from the green project portfolio requires the approval of two GFT members and appropriate documentation.
The Green Finance Team
Green Impact Report 2022 Municipality Finance Plc • Green Impact Report 2022 20/64
Members of the Green Finance Team

”Despite the difficult year, our customers have been able to continue planning and launching new green projects. Energy-efficient construction is now widely seen as a profitable endeavour, and other aspects of sustainability have gradually begun to gain ground through the introduction of concrete indicators in project management, planning and budgeting. Natural capital has also been getting increasing consideration in large projects. The sooner climate and nature goals are brought to the design table and incorporated into the tendering criteria, the better. This way the business models of all project participants change in sync and no bottlenecks are created.”
Mikko Noronen Sustainability Analyst, Funding and sustainability

"Especially during a crisis, it is essential to keep your eye on long-term goals and focus on the things you have control over. Many of the benefits of our green finance projects are particularly prominent in the current situation, which is challenging especially in terms of energy. The principles of sustainability create resilience and benefits for decades to come.”
Rami Erkkilä Senior Specialist, Green finance

”Our customers have been making a voluntary effort to build a more sustainable society for many years now. At the moment, regulatory developments in the financial sector also put a strong emphasis on sustainability. We are doing our part to support the green transition, regardless of whether the change takes place voluntarily or through regulation. Both approaches are needed to accelerate the transition.”
Kalle Kinnunen Sustainability Manager, Funding and sustainability
The Green Finance Team
Green Impact Report 2022 Municipality Finance Plc • Green Impact Report 2022 21/64
Reporting principles
Our Green Bond Framework defines the contents of this annual Green Impact Report. Our impact reporting is based on the recommendations of the Nordic Position Paper on Green Bonds Impact Reporting1. This report describes the impacts of the financed projects based on the available facts.
Our approach to impact evaluation
Our reporting applies a bond-programme-based approach, which is also known as the portfolio approach. In this approach, one dynamic portfolio consisting of green bonds is used to finance one dynamic portfolio consisting of green finance projects. We do not allocate green bond proceeds to single projects within the project portfolio. According to the portfolio approach, we may refinance a green bond at maturity in order to maintain an appropriate balance between the green bonds portfolio and the green finance project portfolio.
We carry out our impact reporting in accordance with the following principles:
• The reporting is based on the situation at the end of 2022, taking into account new withdrawals, repayments and redemptions. This report includes projects that the Green Evaluation Team had approved by the end of the year and whose offer of financing the customer had accepted. In the report, the project year refers to the year in which the evaluation team approved the project.
• Some projects in the green portfolio have not yet withdrawn any finance. Their impact is therefore not included in the impact assessment, and the outstanding amount of their finance is EUR 0. Projects that were approved before 2022 but only began to withdraw finance in 2022 are included in the total portfolio figures.
• The impacts of a financed project are calculated based on our estimated share of
the project’s total finance. Our estimated share of the project’s total finance refers to our outstanding amount of green finance in relation to the project’s estimated total finance. If we are the project’s only financier, the project’s estimated total finance equals the finance that we have granted. If the project has other financiers as well, the estimated total finance is the project’s total liabilities or total cost based on information derived from the customer and public sources. This figure does not include the project’s self-financing or grants.
• Our reporting is based on ex-ante evaluation conducted prior to project implementation. The source data for the calculations is not changed annually, but the parameters used in the calculations, such as the electricity and district heating emission factors, may be updated to correspond to those of the reported year. In 2022, we applied updated emission factors for electricity and district heating.
• When calculating the relative proportion of the impact of different bonds, the notional value of foreign currency denominated bonds is converted into euros using the exchange rate of the cross-currency interest rate swap of the trade date. We have chosen this approach because upon issuance, we enter into a cross-currency interest rate swap to convert the foreign currency denominated funding into euros. The projects are financed in euros.
• Our impact assessment includes both quantitative and qualitative impacts. In 2022, we started including short project descriptions in this report.
• In the most recent Green Bond Framework that was published in 2022, we introduced clearer eligibility criteria for project evaluation and selection than before. We have analysed all projects that were approved into the green portfolio prior to publication of the new Green Bond Framework to assess whether those meet the criteria of the new framework. We present the results on a portfolio level in the chapter Green finance portfolio on page 18. On a project level the alignment information can be found in the Excel spreadsheet available on our website.
Reporting principles
1 Nordic Public Sector Issuers: Position Paper on Green Bonds Impact Reporting (2017, 2019, 2020)
Green Impact Report 2022 Municipality Finance Plc • Green Impact Report 2022 22/64
• We engage in active discussion with investors and other market participants. We also constantly develop our reporting and welcome development proposals.
Terms used in this report:
• Outstanding amount = disbursed amount minus repayments
• Unwithdrawn credit commitment = amount of finance granted to the customer but not yet withdrawn
• Total committed finance = outstanding amount + unwithdrawn credit commitment
We have selected the UN 2030 SDGs based on the direct impact of the projects. All projects may also have indirect impacts on the environment, individuals and society at large. The SDGs and related targets are reported by project category.
Changes to impact evaluation
We carried out our first green bonds impact reporting in 2016 and have published the Green Impact Report annually ever since. In the 2016 and 2017 reports, the estimated impact was presented per year for projects financed that year. The 2018 report was the first in which we analysed the impact of the entire green finance portfolio. In 2020, we introduced new indicators for projects in the water and waste water management category. In 2021, we updated the parameters used in our calculations for the first time, including the emission factors for electricity and district heating. The developments in our reporting are driven by the harmonisation of the calculation principles that have taken place after our first evaluation. More information on these changes is available in the corresponding year’s impact report. This report shows the status of our green finance portfolio at the end of 2022. We have updated the impact of our portfolio to reflect our estimated share of the projects’ total finance at the end
of 2022. This figure represents our share of the estimated impact of the entire project, explained in more detail on previous page .
Changes to impact calculations
Compared to previous years, the key changes we have made to our impact calculations have to do with the used emission factors, and the 2018 decree on the energy efficiency of new buildings.
In the previous years’ impact reporting we’ve followed the Nordic Public Sector Issuers recommendation (Nordic Position Paper on Green Bonds Impact Reporting, 2020) for the electricity emission factor, which was 315 gCO₂/kWh. In 2022 impact report we use Finland’s transmission system operator Fingrid’s published emission factor for electricity consumed in Finland2 that is based on production, import and export data. In 2022, the emission factor for electricity consumed in Finland was 60 gCO₂/kWh. Change of the used emission factor for electricity reduces significantly the CO2 avoided/reduced. In our view the Fingrid’s emission factor better reflects the realized impact during the reporting period.
For district heating, we have previously used the latest available municipality-specific emission factors for each year. For most municipalities, the district heating emission factors have gone down from previous years. From 2021 onwards, we have used the updated emission factors for all projects in the portfolio. As energy production becomes less carbon-dependent, it reduces the emission factors and therefore decreases the calculated avoided and reduced CO₂ emissions. The updated emission factors and the recalculation of impacts do not affect the annual energy savings (avoided/reduced).
2 https://www.fingrid.fi/en/electricity-market-information/real-time-co2-emissions-estimate/
Reporting principles
Green Impact Report 2022 Municipality Finance Plc • Green Impact Report 2022 23/64
We changed the approach for calculating avoided emissions for electric vehicles. In the calculation, we shifted to use average emission target for car manufacturers set by the EU. This harmonised the calculation with EU’s target and reflects the impacts of the electric vehicles in the portfolio more equally.
The impact calculations for 2019–2022 have been significantly influenced by the Decree of the Ministry of the Environment on the energy efficiency of new buildings (1010/2017), which came into effect in 2018. With the tightening of E-value limits, the relative impact of the buildings category is now considerably lower than in the previous years. Because we use the E-value to determine a reference building, the lower value affects the calculated benefit. The impact of projects that applied for a building permit before the E-value limits were tightened, but whose impact assessment has been done later, is calculated using an E-value limit that is in line with the Finnish regulation mentioned in the building’s energy certificate. We primarily refer to the energy certificate drawn up during the building permit phase or, if available, the energy certificate procured by the customer when the building was commissioned.
Changes to terms used in this report
• In our 2019 Green Bonds Impact Report, we reported a figure called disbursed amount, which we have referred to as the outstanding amount of green finance since the 2020 report. These figures are the same and thus directly comparable. In our 2016–2018 reports, we reported another figure called disbursed amount, which did not account for repayments. The figures
from the 2016–2018 reports cannot therefore be compared with the disbursed amount presented in the 2019 report and the outstanding amount of green finance presented in the subsequent reports.
• In our 2016–2019 green bonds impact reports, we reported a figure called committed amount which meant the contractual granted amount of finance. Since the 2020 report, we have instead reported the total committed finance, which is the granted amount of finance deducted with repayments. These two figures are not comparable.
Changes
to report presentation
The renewal of the Green Bond Framework triggered needs to make some changes to the reporting and its presentation
• In the renewal of the Green Bond Framework, we reduced project categories and combined energy efficiency category into the buildings category. We present the energy efficiency projects approved into the portfolio prior to the framework renewal under the building category.
• In the report, we present sub-category and the criteria, based on which the project has been included in the green portfolio or which the project meets (the projects approved into the portfolio prior to the framework renewal).
• We include into the report brief descriptions of the projects which gives the reader more comprehensive picture of the projects impacts and the environmentally friendly aspects that were taken into consideration in the project.
Reporting principles
Green Impact Report 2022 Municipality Finance Plc • Green Impact Report 2022 24/64
Calculation principles
The calculations presented in this report are based on the Position Paper on Green Bonds Impact Reporting (2020) drawn up jointly by Nordic public sector issuers.
Since 2021, we have carried out the environmental impact calculations of our green finance ourselves. Since then, we’ve recalculated the impacts for projects which impact calculation should use updated calculation parameters. Primarily these projects include Building category’s projects which impact calculation utilises emission factors for electricity and heat. The environmental impact calculations of the 2016–2020 projects in the other project categories were carried out by the consultancy firm Deloitte.
The calculations are based on data of the financed projects and on pre-determined calculation assumptions. We have used information from public sources (e.g. the emission factors) as well as data and reports directly related to the projects (e.g. project-specific environmental calculations) in the calculations. Where necessary, we have requested further information from the project owners.
In accordance with the Greenhouse Gas Protocol, the reported impacts cover scope 1 and scope 2 emissions, and in some cases possibly also the carbon handprint impact.
The weighted impact has been calculated based on our estimated share of a project’s total finance. Our estimated share of finance has been calculated based on the outstanding amount of green finance on 31 December 2022. A more detailed explanation of our estimated share of a project’s total finance is available on page 22. The calculations present the status of the outstanding portfolio as of 31 December 2022.
The calculations for the years 2016–2021 have been updated with our estimated share of finance and to correct any errors. Since 2021, we have also updated the emission factors used for electricity and district heating. More information is available in the section Changes to impact calculations.
In some projects, the estimated impact of a project is based on calculations presented in project-specific environmental impact assessments or other preparatory documents. In these
cases, the emission factors applied are those used in the original calculations of these documents. In all other cases, the emission factors are as presented below.
Location specific emission factors for district heating
Average district heating CO2-emission factor in Finland (2022)
district
depending on the project location
https://www.fingrid.fi/en/electricity-market-information/real-time-co2emissionsestimate/
* Regions with separate generation of district heating include 1) regions specified as such by Motiva and 2) regions where the separate generation of district heating is the primary method based on district heating statistics by Finnish Energy and other public information. The emission factor for the separate generation of district heating is applied for these regions, while the Finnish average emission factor for district heating is used for other regions.
Emission source Emission factor Methodology and remarks Source Consumption electricity 60 g CO₂ / kWh
District
Fingrid, CO2 emissions estimate, Emission factor for electricity consumed in Finland 2022
heating*
0–393 g CO₂
kWh
Benefit sharing method klpaastolaskuri.fi/en
/
102 g CO₂ / kWh Benefit sharing method and energy method Finnish Energy Separate generation of
heating* 103 g CO₂ / kWh Heat sales weighted average Motiva.fi Gasoil 253 g CO₂ / kWh Assumed to contain average 4.0% biofuel share of the energy content. Stat.fi; Fuel classification (2022) Internal combustion engine vehicles Cars 95 gCO₂ / km WLTP emission test procedure climate.ec.eu/eu-action/ transport-emissions_en Vans 147 gCO₂ / km Reporting principles
Green Impact Report 2022 Municipality Finance Plc • Green Impact Report 2022 25/64
Specific calculation principles for each project type are listed in the tables below.
The emission factors for electricity and district heating referred to in the table below are the ones presented in the table on the previous page.
Annual energy savings (avoided/reduced), MWh
Avoided (new buildings) or reduced (renovation and other energy efficiency measures)
New buildings
Difference in energy consumption between reference scenario and situation after project implementation (see a more detailed description below the table)
Renovation projects and other energy efficiency measures
Difference in energy consumption between reference scenario and situation after project implementation
New buildings
Consumption of electricity or district heating according to the building’s energy certificate. We primarily refer to the energy certificate drawn up during the building permit phase or, if available, the energy certificate procured by the customer when the building was commissioned.
Renovation projects and other energy efficiency measures
Estimated new consumption of electricity, heating and fuel after the renovation or other energy efficiency measures, according to the project plans
New buildings
E-value limit, which is in line with the Finnish regulation mentioned in the building’s energy certificate. We primarily refer to the energy certificate drawn up during the building permit phase or, if available, the energy certificate procured by the customer when the building was commissioned. The share of electricity, district heating and fuel are calculated according to the building’s energy certificate.
Renovation projects and other energy efficiency measures
Consumption of electricity, heating and fuel prior to the project, based on the building’s energy certificate or plan for energy efficiency measures
Annual CO2 emissions avoided/ reduced, tCO2
Avoided (new buildings) or reduced (renovation and other energy efficiency measures)
Buildings – new construction: We assess annual energy efficiency improvements and the amount of CO₂ emissions avoided in relation to applicable energy efficiency regulation in Finland. The energy efficiency of a building is presented as an E-value. The National Building Code of Finland determines maximum E-values for different building types, which a new building cannot exceed in order to gain a building permit. We use the maximum E-value allowed for a new building as the basis for calculating the energy efficiency of buildings. With the new Ministry of the Environment decree (1010/2017), the limit values for E-value were tightened at the beginning of 2018. In the calculations, we use the E-value limit that is in line with the Finnish regulation mentioned in the building’s energy certificate. We primarily refer to the energy certificate drawn up during the building permit phase or, if available, the energy certificate procured by the customer when the building was commissioned.
The E-value represents a building’s calculated annual consumption of purchased energy per the heated net area (kWh/m²/a) based on the usage default values and of the building’s intended use category and weighted by energy source coefficients. In our calculations, solar or wind energy generated on the property is treated as a reduction in the demand for purchased energy.
CO2 emissions resulting from production of avoided/reduced CO2 emissions calculated using emission factors for electricity, district heating and fuel
CO₂ emissions equivalent to energy consumption after project implementation calculated using emission factors for electricity, district heating and fuel
CO₂ emissions equivalent to energy consumption in reference scenario calculated using emission factors for electricity, district heating or fuel
The estimated emission avoidance impact is calculated by using the emission factors for electricity and district heating production. Different forms of energy are weighted according to how their proportions are presented in the building’s energy certificate.
In special cases where no E-value limit has been defined for a building category, energy savings are calculated compared to a theoretical reference building. We have used one of the following two possible methods for this calculation. The first method is based on assessing the environmental impact from using renewable energy sources. An example of this is ice hockey arena in Äänekoski, which uses its own solar energy and geothermal heat. In such cases, we assume that the reference building has the same energy consumption as the building being examined, but that it only uses purchased energy. The second method is based on the environmental impact of new or unusual energy efficiency technology, which can be, for example, a more energy efficient cooling solution like in the Vuokatti Arena. In such cases, we calculate the CO2 emissions avoided by comparing the project building’s emissions to those of a reference building that is the same size and otherwise similar, but that does not employ this new or unusual technology.
Reporting principles Project category Indicator Energy
CO2 emissions
Methodology Situation after project implementation Reference scenario
or
avoided/ reduced compared to reference situation
Buildings
Green Impact Report 2022 Municipality Finance Plc • Green Impact Report 2022 26/64
Project
Transportation
Annual CO2 emissions avoided/ reduced, tCO2
Annual CO2 emissions avoided/ reduced, tCO2
Renewable energy
Water and waste water management
avoided/ reduced compared to reference situation
Avoided or reduced depending on the project
Avoided or reduced depending on the project
Annual production of renewable energy, MWh N / A
Annual CO2 emissions avoided/ reduced, tCO2
Avoided or reduced depending on the project
Renewable energy production capacity, MW N / A
Annual amount of treated waste water in existing plants immediately after project completion, m3
Annual amount of treated waste water with increased capacity in the future, m3 N / A
Annual production of renewable energy, MWh N / A
Public transportation projects: calculations included in project plans
Purchase of electric cars: difference in CO2 emissions between electric car and comparable car with internal combustion engine
Project plans and other project information
CO₂ emissions from generating the same amount of energy calculated using emission factors for electricity and district heating or based on project documentation
Project plans and other project information
Standardised electricity consumption as specified by manufacturer, with emission factor for electricity accounted for
EU fleet-wide CO2 emission targets (2020-2024) set under Regulations (EC) No 443/2009 and (EU) No 510/2011.
N / A
CO₂ emissions from generating the same amount of energy calculated using emission factors for electricity and district heating
Current average inflow of waste water before possible expansions or after expansions, if they result in an immediate increase in the amount of water treated. The calculations are based on the actual flow rate when it is available and on the rated value when actual flow rate is not available. N / A N / A
New purification plant
The rated value of the average inflow of waste water in the future (review year depends on project plan and may vary between projects)
Expansion of existing purification plant
Difference in average inflow after project completion compared to the reference scenario
New purification plant N / A
Expansion of existing purification plant
Future rated value of the average flow of waste water after expansion measures (review year depends on the project plan and may vary between projects)
New purification plant N / A
Expansion of existing purification plant
Average flow of waste water before expansion. The calculations are based on the actual flow rate when it is available and on the rated value when actual flow rate is not available.
Project plans and other project information N / A N / A
Reporting principles
category Indicator Energy or CO2 emissions
Methodology Situation after project imple-
Reference scenario
mentation
N / A N / A
N / A
N / A
N / A N / A
N / A
Green Impact Report 2022 Municipality Finance Plc • Green Impact Report 2022 27/64
Nordic reporting recommendations harmonise the green bonds market
MuniFin is one of ten Nordic public sector issuers who have jointly published the Position Paper on Green Bonds Impact Reporting. The position paper was first published in October 2017 and most recently updated in February 2020.
The recommendations were drawn up by Nordic green bond issuers specialising in the public sector, with MuniFin as the only Finnish issuer in the group. The other signatories include two of MuniFin’s counterparts – Kommunalbanken in Norway and Kommuninvest in Sweden – as well as several Swedish public sector entities that have issued bonds. The aim of the Nordic issuers’ guide on green bonds impact reporting is to facilitate the work of green finance applicants, lower the threshold for new issuers entering the green bond market and provide international investors with a tool for evaluating green portfolios.
The Nordic guidelines are based on the international Green Bond Principles and the recommendations of multilateral development banks, but they complement these with an interpretation of impact indicators for projects focusing on issues such as public transportation and sustainable buildings. The Norwegian research institute CICERO, the Nordic Investment Bank, SEB, Crédit Agricole CIB and a group of international investors also took part in preparing the guidelines with the group of public sector issuers.
On this and the following page we present how we follow the Nordic recommendations. In addition, we deem worth mentioning that in this years report we deviate for the first time from the emission factor for electricity suggested by the recommendations. Instead we use the emission factor for electricity consumed in Finland published by Fingrid. Read more about the change and the used emission factor in section Changes to impact calculations.
The
Nordic reporting recommendations
in the MuniFin Green Impact Report
1 Report expected impact, aiming for actual impact
Our reporting is based on ex-ante evaluation conducted prior to project implementation.
2 Report based on annual impact
As recommended, our impact report describes the annual impact of the reporting year as opposed to lifetime results. More information about this is available in the section Calculation principles on page 25.
3
Provide annual reporting
We use a portfolio approach in our green finance, which means that the contents of our portfolio change annually. We report the status and impact of our portfolio by the calendar year.
4
Provide quantitative and qualitative reporting
We have determined quantitative indicators for each project category, and we report these for each project. More information about our indicators is available in the section Calculation principles on page 25. In 2022, we started including short project descriptions in this report. More information about the qualitative impact of the projects is available in the section Other impacts of our projects on page 38.
Reporting principles
Green Impact Report 2022 Municipality Finance Plc • Green Impact Report 2022 28/64
5 Report based on the share financed
We calculate the impacts of the financed projects based on our estimated share of the project’s total finance. More information about this is available in the section Reporting principles on page 22.
6 Focus on environmental impact
Our selected indicators focus on environmental impact.
7 Report project-by-project, where feasible
We report the impact of each financed project in the section Green finance projects and impacts and in a separately published spreadsheet.
8 Report impact by $ only when quantifiable and relevant
We report the annual CO2 emissions avoided/reduced per invested monetary unit in all other project categories except the water and waste water management category. We do not consider it relevant to report the impact of the other indicators in relation to the share of finance. More information about this is available in the section Executive summary on page 15.
9 Report bond-by-bond or on bond-programme basis
We use a portfolio approach in our reporting. Our reporting covers all the projects that are included in our green finance portfolio at the end of the reporting year. More information about our approach is available in the section Reporting principles on page 22.
10 Provide both allocation and impact reporting
Our impact report includes both allocation and impact reporting. In 2022, we had our allocation reporting verified by an independent external verifier for the first time.
11 Distinguish between financing and refinancing
We use a portfolio approach. We do not allocate green bond proceeds to single projects within the project portfolio, nor do we distinguish between financing and refinancing. Our green finance portfolio consists 100% of new projects. More information is available in the section Green finance in figures on page 13.
12 Provide breakdowns on asset type, geography and sector
Our reporting includes a list of the projects that we finance, all of which are investments in tangible assets and located in Finland. The category of the project indicates the sector of the investment.
13 Maximise transparency and useability
We provide extensive aggregate information and data on individual projects in our reporting. We also provide an executive summary of the key information. In addition to this impact report, we have also compiled the impact data in spreadsheet format. We publish both the report and the green finance spreadsheet in Finnish at www.kuntarahoitus.fi and in English at www.munifin.fi. In addition to our own channels, we also publish the impact of our green finance portfolio on the Green Assets Wallet and the Nasdaq Sustainable Bond Network platforms.
14 Incorporate climate-related physical risks when possible
We discuss the impact of environmental and climate risks on MuniFin in the section Regulation cultivates the green finance market also in terms of our risk management. We improved our environmental and climate risk management in 2022. We discuss our approach and risks in more detail in our separate Pillar III Disclosure Report.
15 Report contributions to the Sustainable Development Goals (SDGs) For each green finance project category, we describe the UN SDGs that these projects promote. More information about this is available in the section The impacts of green finance on page 30.
16 Consider reporting contributions to the EU Environmental Objectives
Our green finance projects contribute to the EU Environmental Objectives. In 2022, we updated our Green Bond Framework and evaluated the compatibility of our criteria with the EU Taxonomy. More information on this is available in the section EU Taxonomy boosts green investments.
We comply with the reporting recommendations We partly comply with the reporting recommendations We do not comply with the reporting recommendations
Reporting principles
Green Impact Report 2022 Municipality Finance Plc • Green Impact Report 2022 29/64
The impacts of green finance
BUILDINGS
TRANSPORTATION
RENEWABLE ENERGY
WATER AND WASTE WATER MANAGEMENT

The impacts of green finance
Green Impact Report 2022 Municipality Finance Plc • Green Impact Report 2022 30/64
Photo: City of Tampere tramway
Project category Number of projects Outstanding amount on 31 Dec 2022, EUR Annual energy savings (avoided/ reduced, MWh) Annual CO2 emissions avoided/reduced (tCO₂) Annual amount of treated waste water in existing plants immediately after project completion (m3) Annual amount of treated waste water with increased capacity in the future (m3) Annual production of renewable energy (MWh) Renewable energy production capacity (MW) Buildings 230 2,009,431,765 39,215 3,597 - - 170Transportation 15 900,737,496 - 8,813 - - -Renewable energy 6 51,309,204 - 92,329 - - 191,097 78 Water and waste water management 12 289,580,799 - - 27,896,515 30,407,158 428Entire portfolio 263 3,251,059,264 39,215 104,739 27,896,515 30,407,158 191,695 78 The impacts of green finance Green Impact Report 2022 Municipality Finance Plc • Green Impact Report 2022 31/64
Buildings
Projects in this category include both housing and public construction as well as the renovation of existing buildings. In 2022, we accepted a wide range of energy-efficient housing projects into our portfolio, such as the two separate projects of energy class A apartment buildings equipped with geothermal energy in Gunillantie street in Helsinki. We also won the tendering to finance the Etelä-Nummela school and day-care centre in Vihti, which was exceptional in terms of its energy efficiency and use of the Finnish RTS environmental classification and carbon footprint calculation. The impacts of
Construction is a necessity in modern society because people need homes, hospitals, schools, workplaces and many other facilities. The built environment has a significant impact on national emissions and the carbon footprint of municipalities and individual people through the use of energy. There is an ongoing effort to better understand emissions, including those generated during construction. The low-carbon roadmaps, the development of national and uniform carbon assessment methods of buildings, the Land Use and Building Act Reform, as well as regulations on the climate assessment and material statement of buildings are all indications of the prominence of sustainable construction. In sustainable construction, environmental impacts are taken into account already in the design stage, for example by carefully choosing between new and repair construction and by leveraging new energy solutions and environmentally friendly, low-carbon building materials, such as wood and recycled materials. Buildings in our green projects employ local renewable energy production, life cycle thinking, smart control systems and other environmentally sound technologies.
green finance
of projects 230 Number of projects 45 Total committed finance EUR 2,641,862,167 Annual energy savings (avoided/reduced) 3,091 MWh Outstanding amount EUR 2,009,431,765 Annual CO2 emissions (avoided/reduced) 374 tCO₂ Annual energy savings (avoided/reduced) 39,215 MWh Annual CO2 emissions (avoided/reduced) 3,597 tCO₂ Annual production of renewable energy 170 MWh Renewable energy production capacity 0.2 MW Green Impact Report 2022 Municipality Finance Plc • Green Impact Report 2022 32/64
Entire portfolio Projects approved in 2022
Number
Transportation
Transportation projects reduce traffic emissions and the need for private cars through projects that invest in low-emission public transportation or directly support it. Examples of past projects include the West Metro Extension in the capital region and the Tampere Tramway. West Metro Extension (from Lauttasaari to Matinkylä) had on average 83,200 users per day in 2022 and it is estimated that Tampere Tramway will have 55,000 users per day by 2025. In addition to reducing emissions, modern public transportation solutions often have wide-reaching indirect impacts: for example, they can allow a denser and safer urban environment and thus make the city more welcoming for its residents.
In 2022, we accepted one new important project for emission-free public transport to our portfolio, namely the Crown Bridges project of the City of Helsinki. According to estimates, the new light rail connection over the bridge would serve around 23,000 passengers every day after the Kruunuvuorenranta and Kalasatama districts are completed. Currently the shortest way from Kruunuvuorenranta to the city centre is 11 kilometres by car, but the bridge over the bay will shorten this significantly.
In addition to public transportation projects, we have also financed the acquisition of electric cars that help organise public services, for example. In 2022, the amount of transportation project financing grew by EUR 152,263,442 in our portfolio.
impacts of green finance
The
of projects 15 Number of projects 10 Total committed finance EUR 900,737,496 Annual CO₂ emissions (avoided/reduced) 2,212 tCO₂ Outstanding amount EUR 900,737,496 Annual CO₂ emissions (avoided/reduced) 8,813 tCO₂ Green Impact Report 2022 Municipality Finance Plc • Green Impact Report 2022 33/64
Entire portfolio Projects approved in 2022
Number
The impacts of green finance
Renewable energy
Renewable energy production has key importance in mitigating global climate change. Renewable energy generates zero or close to zero greenhouse gas emissions at the production stage, and it directly cuts down greenhouse gas emissions by reducing fossil fuel use. Moreover, energy can be produced locally, reducing delivery, distribution and transmission losses. This has both environmental and economic implications for society. By financing renewable energy projects, we promote Finland’s long-term goal of becoming a carbon neutral society by 2035.
Our renewable energy projects include the Kangasalan Lämpö Ltd biomass heating plant, which produces thermal energy from forest industry side streams, the Kemi Energy and Water bioheating plant and the Energy Self-Sufficient Lempäälä project. In 2022, we did not add new renewable energy projects into our portfolio.
Projects approved in 2022 Number of projects 6 Number of projects 0 Total committed finance EUR 51,309,204 Annual CO₂ emissions (avoided/reduced) 0 m3 Outstanding amount EUR 51,309,204 Annual production of renewable energy 0 MWh Annual CO₂ emissions (avoided/reduced) 92,329 tCO2 Renewable energy production capacity 0 MWh Annual production of renewable energy 191,097 MWh Renewable energy production capacity 78 MW Green Impact Report 2022 Municipality Finance Plc • Green Impact Report 2022 34/64
Entire
portfolio
Water and waste water management
Our green finance promotes projects that ensure the availability of safe and clean drinking water and the effective treatment of waste water across Finland. Climate change and migration pose new challenges to water and waste water management, and preparing for them requires substantial investments. Water purification helps to maintain high waste water quality, prevent the eutrophication of waterways and enable the reuse of nutrients, such as phosphorus and nitrogen. In addition, sludge separated from waste water can be composted and utilised in biogas production.
Since 2016, we have financed twelve projects in the water and waste water management category, all of which were part of our portfolio on 31 December 2022. These projects support the water treatment capacity extensions of existing water purification plants, the introduction of more efficient purification technologies and methods, and the construction of new water purification plants. Example projects include waste water treatment plants of Kalajokilaakso (Vesikolmio Ltd), Blominmäki (Helsinki Region Environmental Services) and Sahanniemi (City of Heinola). No new water or waste water management projects were added into our portfolio during 2022.
The impacts of green finance
portfolio Projects approved in 2022 Number of projects 12 Number of projects 0 Total committed finance EUR 289,580,799 Annual amount of treated waste water in existing plants immediately after project completion 0 m3 Outstanding amount EUR 289,580,799 Annual amount of treated waste water with increased capacity in the future 0 MWh Annual amount of treated waste water in existing plants immediately after project completion 27,896,515 m3 Annual production of renewable energy 0 MWh Annual amount of treated waste water with increased capacity in the future 30,407,158 m3 Annual production of renewable energy 428 MWh Green Impact Report 2022 Municipality Finance Plc • Green Impact Report 2022 35/64
Entire
Green projects promote the following UN Sustainable Development Goals
6.3 By 2030, improve water quality by reducing pollution, eliminating dumping and minimising release of hazardous chemicals and materials, halving the proportion of untreated wastewater and substantially increasing recycling and safe reuse globally
6.4 By 2030, substantially increase water-use efficiency across all sectors and ensure sustainable withdrawals and supply of freshwater to address water scarcity and substantially reduce the number of people suffering from water scarcity
6.6 By 2020, protect and restore water-related ecosystems, including mountains, forests, wetlands, rivers, aquifers and lakes
7.2 By 2030, increase substantially the share of renewable energy in the global energy mix
7.3 By 2030, double the global rate of improvement in energy efficiency
9.1 Develop quality, reliable, sustainable and resilient infrastructure, including regional and transborder infrastructure, to support economic development and human wellbeing, with a focus on affordable and equitable access for all
9.4 By 2030, upgrade infrastructure and retrofit industries to make them sustainable, with increased resource-use efficiency and greater adoption of clean and environmentally sound technologies and industrial processes, with all countries taking action in accordance with their respective capabilities
The impacts of green finance
Green Impact Report 2022 Municipality Finance Plc • Green Impact Report 2022 36/64
11.1 By 2030, ensure access for all to adequate, safe and affordable housing and basic services and upgrade slums
11.2 By 2030, provide access to safe, affordable, accessible and sustainable transport systems for all, improving road safety, notably by expanding public transport, with special attention to the needs of those in vulnerable situations, women, children, persons with disabilities and older persons
11.3 By 2030, enhance inclusive and sustainable urbanisation and capacity for participatory, integrated and sustainable human settlement planning and management in all countries
11.6 By 2030, reduce the adverse per capita environmental impact of cities, including by paying special attention to air quality and municipal and other waste management
11.7 By 2030, provide universal access to safe, inclusive and accessible, green and public spaces, in particular for women and children, older persons and persons with disabilities
12.2 By 2030, achieve the sustainable management and efficient use of natural resources
13.1 Strengthen resilience and adaptive capacity to climate-related hazards and natural disasters in all countries
14.1 By 2025, prevent and significantly reduce marine pollution of all kinds, in particular from land-based activities, including marine debris and nutrient pollution
15.5 Take urgent and significant action to reduce the degradation of natural habitats, halt the loss of biodiversity and, by 2020, protect and prevent the extinction of threatened species
The impacts of green finance
Green Impact Report 2022 Municipality Finance Plc • Green Impact Report 2022 37/64
Other impacts of our projects
Besides the quantitative impacts discussed in this report, our green finance projects also have other wide-ranging benefits. In addition to their environmental benefits, all the projects include various social and economic impacts, both locally and regionally.
Through our finance, we support regional vitality and attractiveness. We enable projects aimed at improving individual wellbeing and promoting the introduction of new, more environmentally friendly technologies and materials. For example, our green portfolio includes several wooden schools, which help tackle indoor air problems.
All categories
• Climate change mitigation and adaptation
• Regional vitality and attractiveness
• Support for employment
• Innovations, new environmental technologies and pilot projects
• Wide-ranging cooperation with stakeholders Buildings
• Support for early education and teaching
• Welcoming green and communal urban spaces
• Flexible multipurpose facilities that serve diverse population groups
• Safe and healthy premises and the renovation of old premises
• The use of green factor as a tool for land use planning, climate change mitigation and adaptation, and for promotion of city nature.
Transportation
• More pleasant and welcoming urban environment
• Accessibility of services and ease of everyday life
• Denser city structure
• Reduced noise pollution
Renewable energy
• Efforts to pilot and deploy new environmental technologies
• Improved health through better air quality
• Regional competitiveness
• Finland’s energy self-sufficiency and the minimisation of energy distribution and transfer losses
Water and waste water management
• Recovery of bioenergy for energy production
• Improved water quality
• Climate change adaptation
The impacts of green finance
Green Impact Report 2022 Municipality Finance Plc • Green Impact Report 2022 38/64
Projects approved in 2022
Oy
building, Lavakatu 9b, Helsinki
Yrjö ja Hanna-säätiö/ Asoasunnot Uusimaa Oy
Apartment building, Kuokkalan kalon, building 1
A Housing Reform Helsinki 2020 competition entry. The project is a wooden apartment
The building’s energy class is A, and its E-value (75 kWhE/m2/year) is 17% better than the level required by the building permit (90). The building has a green roof with solar panels, and space for heat pumps has been reserved on the balconies. The yard has been designed with the green factor method, which promotes climate change adaptation and mitigation as well as the diversity of urban nature. The project will include a carbon footprint assessment.
Buildings The winning entry to the Housing Reform 2018 competition. It aims to be a model for eco-friendliness and communality. The project promotes lifecycle thinking and circular economy and reduces the carbon footprint of construction by using solid wood.
Mangrove Asumisoikeus Oy Apartment building, Kuurankatu 2 ja 4 1.1a Buildings A six-storey apartment building heated by a hybrid solution of geothermal and district heating. The building’s energy class is A, and its E-value (74 kWhE/m2/year) is 18% better than the level required by the building permit (90).
TA-Asumisoikeus Oy Apartment building Nordic Ecolabel, Rapukuja 2 1.1a Buildings The site adheres to the criteria of the Nordic Swan Ecolabel. The building is heated by district heating. Its energy class is A, and its E-value (75 kWhE/m2/year) is 17% better than the level required by the building permit (90).
TA-Yhtymä Oy Apartment building, As.oy. Espoon Luoteisrinne 1.1a Buildings A concrete apartment building. Part of Finnoo’s regional development project, which aims to act as a role model for combating climate change. The zoning goal is a carbon-neutral area where energy consumption is minimised and covered by low-emission sources. The building’s energy class is A, and its E-value (75 kWhE/m2/year) is 17% better than the level required by the building permit (90).
Avain Vuokra10 Oy Apartment building, Alhotie 19
Three separate 5–6-storey apartment buildings with geothermal heating. The energy class of these buildings is A, and their E-values (74–75 kWhE/m2/year) are 17–18% better than the level required by the building permit (90). Avain Asumisoikeus Oy
building, As.oy. Opistokuja 5
Asuntosäätiön Asumisoikeus Oy Apartment building, Klaavuntie 13
A three-storey apartment building with district heating. The energy class of the building is A, and its E-value (74 kWhE/m2/year) is 18% better than the level required by the building permit (90).
Buildings A block of right-of-occupancy apartments built over a demolished shopping centre. The demolition of the shopping centre is carried out sustainably in accordance with the European Green Deal policies, and the aim is to recycle at least 70% of all non-hazardous waste material. The new building has district heating. Its energy class is A, and its E-value (75 kWhE/m2/year) is 17% better than the level required by the building permit (90).
Asuntosäätiön Asumisoikeus Oy Apartment building, Kuormakatu 6 1.1a Buildings A Housing Reform Helsinki 2020 competition entry. Two six-storey wooden apartment buildings in energy class A. Their E-value (75 kWhE/m2/year) is 17% better than the level required by the building permit (90). The roofs have solar panels, and the yard has been designed with the green factor method, which promotes climate change adaptation and mitigation as well as the diversity of urban nature. The project also includes a carbon footprint assessment.
Asuntosäätiön Vuokra-asunnot Oy Apartment building, Hannuksenkuja 17 1.1a Buildings A 13-storey apartment building in the immediate vicinity of a metro station. The apartment building’s energy class is A, and its E-value (71 kWhE/m2/year) is 21% better than the level required by the building permit (90). The building uses district heating and produces 4,123 kWh of its own solar energy (1 kWh/m2/year).
Projects approved in 2022
Buildings Number approved: 45 Share of all projects approved in 2022 82% Customer Project Sub-category Description City of Akaa Comprehensive school of Viiala with Nordic ecolabel 1.1a Buildings A new comprehensive school for 750 pupils. Adheres to
criteria of the Nordic Swan Ecolabel, Kuivaketju10 and purity class P1.
building’s energy class
kWhE/m2/year)
better
level required
building permit
building
solar panels.
Apartment
1.1a Buildings
the
The
is A, and its E-value (87
is 13%
than the
by the
(100). The
utilises geothermal energy and has the technical capability for
A-Kruunu
building.
1.1a
1.1a
Apartment
1.1a
Buildings
Buildings
1.1a
Green Impact Report 2022 Municipality Finance Plc • Green Impact Report 2022 39/64
Avain Asumisoikeus Oy
Avain Asumisoikeus Oy
Toivo Group Oyj/ Elämäni Kodit 40 Oy
Helsingin Asumisoikeus Oy
building, As.oy. Tuusulan Freesia
As.oy .Tuusulan Pioni
building, As.oy. Vantaan Nahkuri
Gunillanpuisto
The
is 20% better than the level required by the building permit.
Helsingin kaupungin asunnot Oy Apartment building, Gunillantie 3 1.1a Buildings Three concrete apartment buildings with nearly 30% better energy efficiency than required by the building permit. The buildings are equipped with geothermal heating as well as a mechanical intake and exhaust ventilation system with heat recovery.
Helsingin kaupungin asunnot Oy Apartment building, Jakomäentie 10 1.2 Renovations The renovation of three separate apartment buildings, which improves their energy efficiency by an average of 38%.
Ingå Municipality Kyrkfjärdens School of Ingå 1.1a Buildings
A new school for 180–200 pupils. The project aims for a building that is energy-efficient, healthy, safe, functional and of high quality, adapting to changes during its lifecycle and serving the needs of its users as efficiently as possible. The building is equipped with a hybrid solution of geothermal and district heating and also has a solar power system. The building’s energy class is A, and its E-value (70 kWhE/m2/year) is 30% better than the level required by the building permit (100).
Jyväskylän Vuokra-asunnot Oy Apartment building, Kiljaderinkatu 8 1.2 Renovations An extensive renovation project of all apartments that also improves energy efficiency. Renovations include the replacement of water and sewer pipes, the installation of exhaust air heat recovery system and heat pumps, the installation of apartment-specific water meters, and the improvement of roof insulation. All renovations combined, the building’s energy efficiency will improve by an estimated 40%.
City of Kaarina School of Hoviranta 1.1a Buildings A new school for approximately 270 pupils. The building was designed to be compact and flexible to use. The building’s energy class is A, and its E-value (86 kWhE/m2/year) is 14% better than the level required by the building permit (100).
City of Kangasala Comprehensive school of Lamminrahka 1.1a Buildings A new school building. The structures, building components and technical systems were selected to ensure low energy consumption and operating costs and high adaptability and flexibility throughout the entire lifecycle of the building. The building has district heating. Its energy class is A, and its E-value (67 kWhE/m2/year) is 33% better than the level required by the building permit (100).
City of Kauhava Education centre of Kortesjärvi 1.1a Buildings A new school centre for 200 pupils. The building has district heating. Its energy class is A, and its E-value (83 kWhE/m2/year) is 17% better than the level required by the building permit.
Y-Säätiö/Kiinteistö Oy M2-Kodit Apartment building, Nihtisillankuja 2 H ja I 1.1a Buildings A large apartment building with geothermal heating. Its energy class is A, and its E-value (74 kWhE/m2/year) is 18% better than the level required by the building permit (90).
Y-Säätiö/Kiinteistö Oy M2-Kodit Apartment building, Lyyranpyrstö 2 1.1a Buildings The carbon footprint of this building was reduced by choosing hollow core slabs instead of solid slabs in the frame. The building is connected to the district heating network, and the plans include a capability for roof solar panels. Its energy class is A, and its E-value (74 kWhE/m2/year) is 18% better than the level required by the building permit.
Y-Säätiö/Kiinteistö Oy M2-Kodit Apartment building, Rullakkokuja 14
Kirkkonummi Municipality School centre of Gesterby (The Building Information Foundation (RTS) certfication)
1.1a Buildings Two apartment buildings with district heating. Their E-value (75 kWhE/m2/year) is 17% better than the level required (90) by the building permit. The buildings have green roofs and solar panels generating approximately 6,000 kWh per year (3 kWh/m2/year). The yards have been designed with the green factor method, which promotes climate change adaptation and mitigation as well as the diversity of urban nature.
1.1a Buildings A new school centre to replace a demolished one. The E-value (63 kWhE/m2/year) is 37% better than the level required by the building permit (100). According to the project’s carbon footprint assessment, the building saves 20% of carbon emissions compared to the reference project. The design and implementation phases both utilised the RTS Environmental Classification Tool by the Building Information Group.
Buildings Number approved: 45 Share of all projects approved in 2022 82% Customer Project Sub-category Description
Apartment
1.1a Buildings A construction project in energy class A. Its E-value (74 kWhE/m2/year) is 18% better than the level required by the building permit
(90).
Apartment building,
1.1a Buildings A construction project in energy class A. Its E-value (74 kWhE/m2/year) is 18% better than the level required by the building permit (90).
Apartment
1.1a Buildings
project provides affordable, environmentally friendly housing that takes social aspects into consideration.
building has geothermal heating.
energy class is A, and its E-value (71 kWhE/m2/year) is 21% better than the level required by the building permit
The
The
Its
(90).
Apartment building,
1.1a Buildings
concrete apartment buildings equipped
heating
exhaust air heat recovery.
Two
with geothermal
and
energy efficiency of these buildings
Projects approved in 2022 Green Impact Report 2022 Municipality Finance Plc • Green Impact Report 2022 40/64
Kouvolan Asunnot Oy Apartmanet building, Viialankatu 5 1.2 Renovations The renovation of a building constructed in 1972. The E-value of the building was 162 kWhE/m2/year before the renovation and 95 kWhE/m2/year after, resulting in an improvement of 41%.
Y-Säätiö Apartment building, Myllytie 14 a 1.1a Buildings A six-storey concrete apartment building. Its energy class is A, and its E-value (68 kWhE/m2/year) is 24% better than the level required by the building permit (90). The building includes an electrically powered geothermal heat pump and solar panels that will produce approximately 32,000 kWh of energy per year.
Mikalo Oy Apartment building, Yrjönkatu 19, Mikkeli 1.2 Renovations A renovation project that substantially improves the building’s energy efficiency. Heating is converted from oil to district heating, the roof improved with additional insulation, and doors and windows are replaced. Mechanical exhaust ventilation is replaced with apartment-specific mechanical intake and exhaust ventilation. The E-value of the building will be halved from 316 kWhE/m2/year to 158 kWhE/m2/year.
City of Mikkeli Southern regional School of Mikkeli 1.1a Buildings A new regional school for the southern region of Mikkeli. The objective of the project is to build a healthy, modern learning environment that supports the goals of the new curriculum and the community spirit for all pupils of the area, as well as flexible spaces that can also be used for recreational activities. The building has district heating. Its E-value (77,5 kWhE/m2/year) is 23% better than the level required by the building permit (100).
Mäntsälä Municipality Daycare centre Amanda 1.1a Buildings A new day-care centre to replace a demolished one. In order to ensure energy efficiency, an E-value target is determined for the project in the turnkey contract competition phase. The building has geothermal heating, and its E-value (53 kWhE/m2/year) is 47% better than the level required by the building permit (100).
City of Nivala School of Junttila 1.1a Buildings A new school that replaces three demolished village school buildings. The new school is made for 120 pupils and a preschool group. The project aims to use wood as a building material as much as possible, and the design of the premises aims for a high degree of flexibility. The building has geothermal heating, and its E-value (87 kWhE/m2/year) is 13% better than the level required by the building permit (100).
City of Parainen Creativity and learning centre of Parainen [3] 1.1a Buildings, 1.2 Renovations The renovation and expansion of a school with 700 students. The project includes a lifetime carbon footprint assessment. The school uses district heating. The energy class of the building extension is A, and its E-value (82 kWhE/m2/year) is 18% better than the level required by the building permit (100). The renovation will also result in significantly improved energy efficiency of the existing building – 38% for heat energy and 51% for electricity. In addition to the renovations, a 107 kW solar panel system will be installed on the roof.
City of Pori Community centre of Northern Pori 1.1a Buildings A new school building to replace demolished schools. A demolition survey is made in accordance with the Ministry of the Environment’s guidelines. The construction company is involved in the EU Circwaste project and uses recycled products and materials. The building’s energy class is A, and its E-value (76 kWhE/m2/year) is 24% better than the level required by the building permit (100).
Savonlinnan Vuokratalot Oy Apartment building, Aholahdentie 113 ja Aholahdentie 115
Savonlinnan Vuokratalot Oy Apartment building, Hilkanhaka 6 ja 7
1.2 Renovations Conversion from oil to geothermal heating in connection with renovations. The project removes the need of fossil fuels in these buildings and improves energy efficiency significantly, by 45–46%.
Renovations Conversion from oil to geothermal heating in connection with renovations. The project removes the need of fossil fuels in these buildings and improves energy efficiency significantly, by 54–55%.
Savonlinnan Vuokratalot Oy Apartment building, Kirstintupa ja Marintupa 1.2 Renovations Conversion from oil to geothermal heating in connection with renovations. The project removes the need of fossil fuels in these buildings and improves energy efficiency significantly, by 57–58%.
TA- Asumisoikeus Oy Apartment building, Metsäläntie 10 1.1a Buildings The leasing of electric cars.
Tampereen Kotilinnasäätiö sr Apartment buildings, Uimalankatu 1 buildings 1b and 1c 1.1a Buildings Two apartment buildings with district heating. Their E-value (75 kWhE/m2/year) is 17% better than the level required by the building permit (90). The project uses the RTS Environmental Classification Tool by the Building Information Group to manage the project in an environmentally responsible manner. The buildings produce their own solar energy for an estimated 13,052 kWh per year.
Tampereen Vuokratalosäätiö sr Apartment building, Heittoniitynkuja 2 1.1a Buildings Two apartment buildings in energy class A. Their E-value (75 kWhE/m2/year) is 17% better than the level required by the building permit (90).
Buildings Number approved: 45 Share of all projects approved in 2022 82% Customer Project Sub-category Description
1.2
Green Impact Report 2022 Municipality Finance Plc • Green Impact Report 2022 41/64
Projects approved in 2022
Yrjö ja Hanna Kiinteistöt Oy Apartment buildings, Kuokkalan Kalon buildings 2, 3 and 4
The winning entry to the Housing Reform 2018 competition. It aims to be a model for eco-friendliness and communality. The project promotes lifecycle thinking and circular economy and reduces the carbon footprint of construction by using solid wood. The buildings have geothermal heating, and their E-values (69–71) are on average 22% better than the level required by the building permit (100).
Buildings Number approved: 45 Share of all projects approved in 2022 82% Customer Project Sub-category Description
School
1.1a Buildings A new school centre replacing three old school buildings.
new buildings
district heating,
their E-value (66 kWhE/m2/year) is 34% better than the level required by the building permit
City
Temporary/movable school facilities for school
1.1a Buildings Movable temporary premises in energy class A
kWhE/m2/year), which
rare classification
premises are connected
district heating network
city
Turku. VAV
Apartment
9 1.1a Buildings
new apartment building
criteria
building has district heating,
its E-value (75 kWh/m2/year) is 17% better than
level required
building
The building produces its own solar energy for approximately 14,440 kWh per year (2 kWh/m2). City
Comprehensive school
1.1a Buildings
new comprehensive
sports
kWh/m2/year)
25%
Tohmajärvi Municipality
centre of Tohmajävi
The
have
and
(100).
of Turku
of Mikael
(75
is a relatively
for this type of construction. The
to the
of the
of
Asunnot Oy
building, Perintötie
A
that fulfils the
of the Nordic Swan Ecolabel. The
and
the
by the
permit (90).
of Ylöjärvi
Siltatie
A
school and
hall. The building is made of concrete and designed to be as adaptable and flexible as possible by optimising the number and location of load-bearing and stiffening structures. The building has district heating, and its E-value (75
is
better than the level required by the building permit (100).
1.1a Buildings
Projects approved in 2022 Green Impact Report 2022 Municipality Finance Plc • Green Impact Report 2022 42/64
The wooden apartment building quarter in Kuokkala sparks spontaneous meetings
The Yrjö and Hanna Foundation is developing a quarter with five wooden apartment buildings in the Kuokkala district in Jyväskylä. Its design emphasises environmental consciousness and communality, and its construction commenced in autumn 2022. Four of the five buildings have been financed with MuniFin’s green finance.
The quarter is entitled Kalon, and it won the Asuntoreformi architecture competition in 2018. The Kalon buildings are constructed from prefabricated wooden elements, meaning that 70–80% of the buildings are made at the factory before they are transported to the building site. The architecture and materials of the buildings tie them seamlessly to the surrounding buildings, the Kuokkala wooden church and the pioneering Puukuokka wooden apartment buildings. The buildings will have geothermal heating as well as solar panels on the roof to generate some of their electricity. The residents will be able to monitor their energy consumption in real time.
The Yrjö and Hanna Foundation works hard to improve housing. The Kalon apartments are designed to be flexible, and the quarter has extensive common facilities. The common facilities and letter boxes of all five buildings are in one building. This central spot is intended to spark spontaneous meetings.
 Photo: Collaboratorio Oy
CASE : The Kalon quarter in Kuokkala
Case
Photo: Collaboratorio Oy
CASE : The Kalon quarter in Kuokkala
Case
Green Impact Report 2022 Municipality Finance Plc • Green Impact Report 2022 43/64
City of Helsinki
Crown Bridges Light Rail (CEEQUAL sustainability assesment)
Kymsote-Kiinteistöt Oy (social and healthcare services)
City of Orivesi
Seinäjoki Joint Municipal Authority for Education
Tampereen Infra Oy
Tampereen Raitiotie Oy
City of Turku
City of Turku, Turku Vocational Institute
City of Turku, Procurement Services of the City of Turku
City of Turku, Procurement Services of the City of Turku (Social and healthcare services)
Fully electric cars, VW e-up (22 vehicles)
Fully electric car, Citroen e-Berlingo
Fully electric car, Skoda Enyaq
Fully electric cars, Kia s-Soul (2 vehicles)
City of Tampere tramway, 2nd phase
Fully electric car, Mercedes-Benz EGC
Fully electric cars, VW e-up (3 vehicles)
Fully electric cars, Citroen e-Berlingo ( 2 vehicles)
Fully electric cars, VW e-up (23 vehicles)
2.2 Supporting infrastructure for public transportation
2.3 Passenger cars and light commercial vehicles
2.3 Passenger cars and light commercial vehicles
2.3 Passenger cars and light commercial vehicles
2.3 Passenger cars and light commercial vehicles
An important new connection that improves the public transport system of the Capital Region. The bridges significantly shorten travel time, turning Kruunuvuorenranta from a suburb into a part of the inner city. In addition to the light rail, the bridges include pedestrian and bicycle lanes. The light rail connection is estimated to serve around 23,000 passengers every day after the Kruunuvuorenranta and Kalasatama districts are completed. The international CEEQUAL assessment method was used in project planning.
The leasing of electric cars.
The leasing of electric cars, replacing transport equipment that generates tailpipe emissions.
The leasing of electric cars.
The leasing of electric cars.
2.1 Public transportation The Tampere light rail will reduce greenhouse gas emissions by approximately 14,000 and 35,000 CO2e tons per year. zThe annual emissions are 1.4% lower compared to an electric bus solution. Achieving the level of service as 25 trams would require 225 buses.
2.3 Passenger cars and light commercial vehicles
2.3 Passenger cars and light commercial vehicles
2.3 Passenger cars and light commercial vehicles
2.3 Passenger cars and light commercial vehicles
The leasing of electric cars.
The leasing of electric cars.
The leasing of electric cars.
The leasing of electric cars.
Transportation Number approved: 10 Share of all projects approved in 2022 18% Customer Project Sub-category Description
Projects approved in 2022 Green Impact Report 2022 Municipality Finance Plc • Green Impact Report 2022 44/64
In Turku, traffic is becoming electric faster than expected
In recent years, street and road traffic has been the single largest source of emissions in the City of Turku in addition to the use and production of energy. Turku aims to halve its traffic emissions from the 2015 level by 2029.
In 2016, Turku electrified an entire public transport line as the first city in Finland. The project received MuniFin’s green finance, which the Turku region public transport company used to acquire electric buses. In recent years, the City of Turku has given preference to electric vehicles when inviting tenders for its public transport fleet acquisitions. The supply of electric buses has increased quickly, and their price has decreased so much that electric buses now outdo diesel vehicles in not just emissions but also in cost. In 2022, Turku had 70 electric buses.
Consumer preferences and tightening environmental regulation are turning traffic electric faster than expected. An EU directive has required municipalities and cities to increase the share of electric vehicles in their vehicle purchases since 2021. In Turku, this requirement has posed no problems. Recently the city acquired 29 electric vehicles using MuniFin's gren finance. Importers have been able to supply electric vehicles faster and at a lower price than expected.
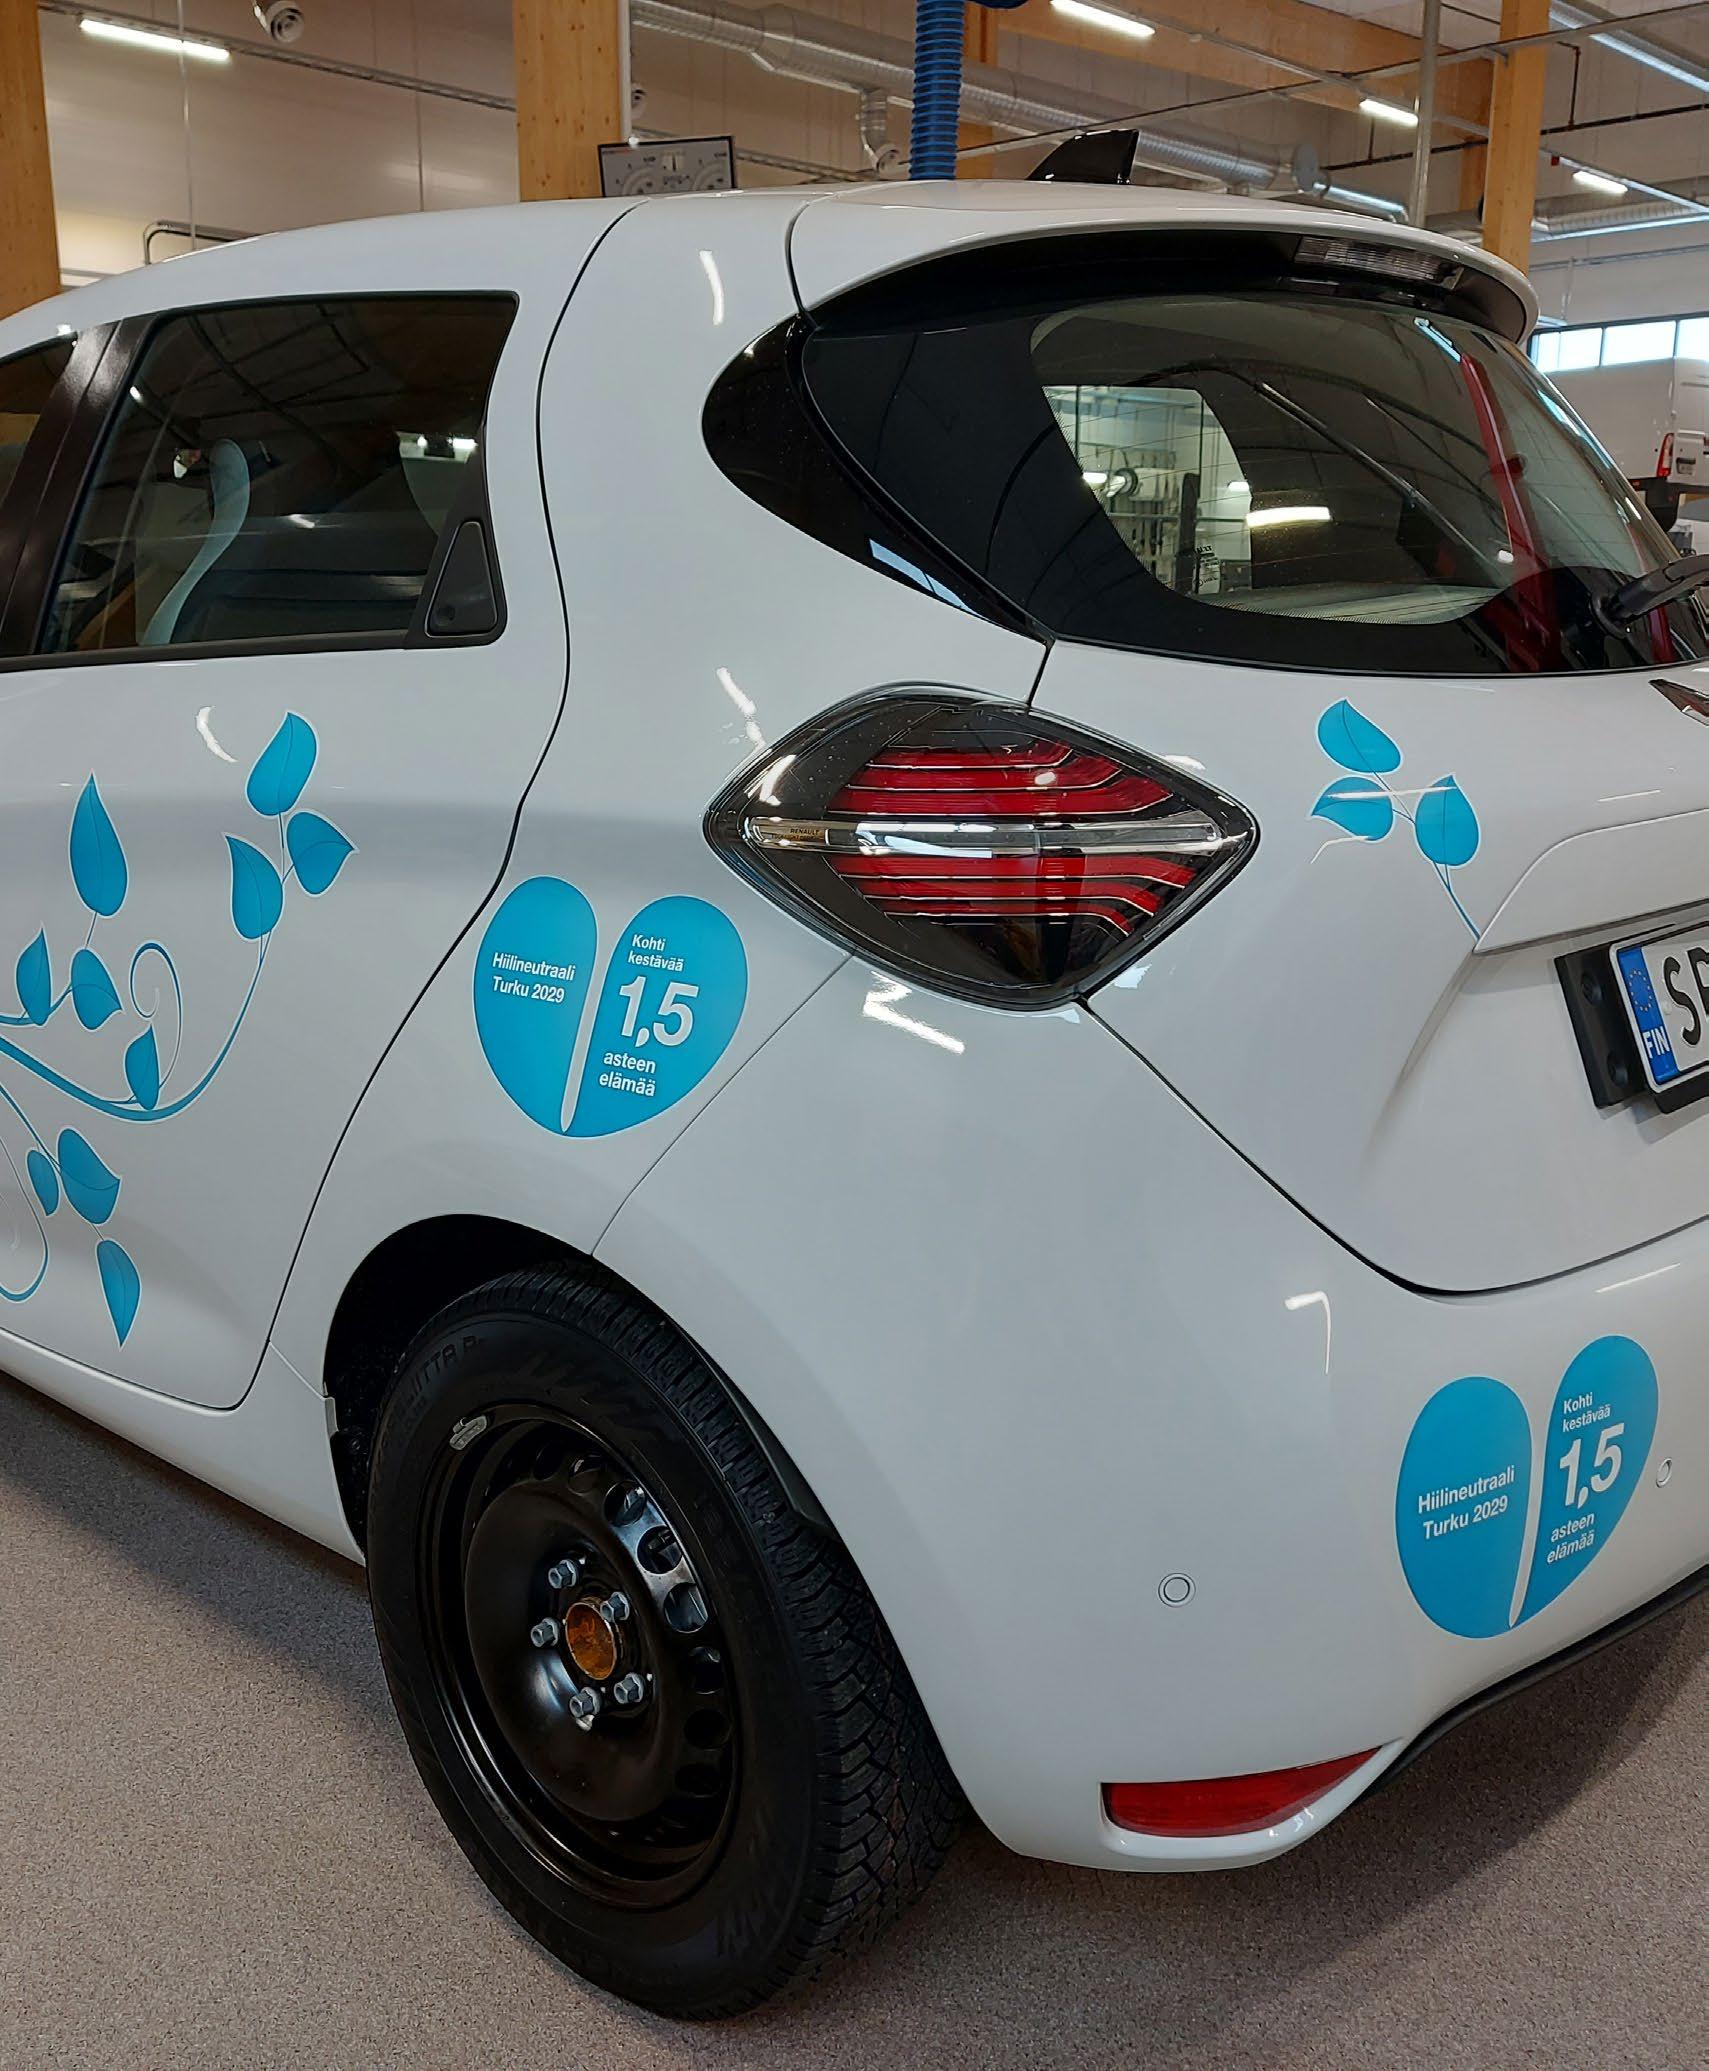 CASE : Turku’s climate work and the electrification of traffic
Photo: City of Turku
CASE : Turku’s climate work and the electrification of traffic
Photo: City of Turku
Case
Green Impact Report 2022 Municipality Finance Plc • Green Impact Report 2022 45/64
Green finance projects and impacts
Green finance projects and impacts
Buildings: New buildings Customer Project Sub-category Year of approval Energy Performance Certificate class EPC year1 E-value2 (kWh/ m2/year) Outstanding amount 31 Dec 2022 (€) Unwithdrawn credit commitment 31 Dec 2022 (€) Total committed finance 31 Dec 2022 (€) MuniFin’s estimated share of finance 31 Dec 2022 Annual energy savings (avoided / reduced MWh) Annual CO₂ emissions (avoided / reduced tCO₂) City of Akaa Comprehensive school of Viiala with Nordic ecolabel 1.1a Buildings 2022 A 2018 87 17,000,000 - 17,000,000 100% 112 7 A-Kruunu Oy Apartment building, Syvänsalmenkatu 5 b 1.1a Buildings 2020 A 2018 71 7,100,000 1,750,697 8,850,697 80% 50 5 A-Kruunu Oy Apartment building, Lavakatu 9b, Helsinki 1.1a Buildings 2022 A 2018 75 - 20,673,617 20,673,617 0% 0 0 Asuntosäätiön Asumisoikeus Oy Apartment building, Klaavuntie 13 1.1a Buildings 2022 A 2018 75 4,200,000 3,493,132 7,693,132 55% 60 8 Asuntosäätiön Asumisoikeus Oy Apartment building, Kuormakatu 6 1.1a Buildings 2022 A 2018 75 - 19,834,756 19,834,756 0% 0 0 Asuntosäätiön Asumisoikeus Oy Apartment building with Nordic Ecolabel, Karakalliontie 1 1.1a Buildings 2020 A 2018 75 7,332,950 - 7,332,950 100% 46 3 Asuntosäätiön Vuokra-asunnot Oy Apartment building, Hannuksenkuja 17 1.1a Buildings 2022 A 2018 71 - 19,721,944 19,721,944 0% 0 0 Avain Asumisoikeus Oy Apartment building, As.oy. Vantaan Ajoportti 1.1a Buildings 2021 A 2018 73 20,265,699 2,004,301 22,270,000 91% 144 9 Avain Asumisoikeus Oy Apartment building, As.oy. Opistokuja 5 1.1a Buildings 2022 A 2018 74 5,202,289 5,414,627 10,616,916 49% 38 3 Avain Asumisoikeus Oy Apartment building, As.oy. Keravan Niittäjänkatu 2 ja 4 1.1a Buildings 2021 A 2018 78-79 4,930,045 314,682 5,244,727 94% 40 2 Avain Asumisoikeus Oy Apartment building, As.oy. Järvenpään Kultapiisku 1.1a Buildings 2021 A 2018 75 12,708,636 349,781 13,058,417 97% 24 1 Avain Asumisoikeus Oy Apartment building, As.oy. Hyvinkään Yli-Jurvankatu 5 1.1a Buildings 2021 A 2018 75 7,270,692 719,083 7,989,775 91% 43 3 Avain Asumisoikeus Oy Apartment building, As.oy .Tuusulan Pioni 1.1a Buildings 2022 A 2018 74 - 5,369,267 5,369,267 0% 0 0 The new law of 2018 concerning energy performance certificates reduced the coefficients of certain energy types used in the calculation of E-values and made the legal threshold of energy efficiency for new buildings stricter. Using new coefficients, the E-values of the buildings built under the old law of 2013 would decrease, which could enhance their EPC classes
per
net area
based on the usage default values
of the building’s
use category
weighted
source coefficients.
2 The E-value represents a building’s calculated annual consumption of purchased energy
the heated
(kWhE/m2/year)
and
intended
and
by energy
only
new construction part
the project.
Experimental project, please see additional information on p. 19. Green Impact Report 2022 Municipality Finance Plc • Green Impact Report 2022 46/64
3 Impacts calculated
for the
of
4
Buildings: New buildings
concerning
certificates
Using
2 The E-value represents a building’s calculated annual consumption of purchased energy per the heated net area (kWhE/m2/year) based on the usage default values and of the building’s intended use category and weighted by energy source coefficients.
3 Impacts calculated only for the new construction part of the project.
4 Experimental project, please see additional information on p. 19.
Green finance projects and impacts
Customer Project Sub-category Year of approval Energy Performance Certificate class EPC year1 E-value2 (kWh/ m2/year) Outstanding amount 31 Dec 2022 (€) Unwithdrawn credit commitment 31 Dec 2022 (€) Total committed finance 31 Dec 2022 (€) MuniFin’s estimated share of finance 31 Dec 2022 Annual energy savings (avoided / reduced MWh) Annual CO₂ emissions (avoided / reduced tCO₂) Avain Asumisoikeus Oy Apartment building, As.oy. Tuusulan Freesia 1.1a Buildings 2022 A 2018 74 - 7,560,882 7,560,882 0% 0 0 Espoon Asunnot Oy Apartment building, Syvänsalmenkatu 1 1.1a Buildings 2021 A 2018 72 11,684,250 2,771,550 14,455,800 81% 88 8 City of Forssa Community centre Akvarelli 1.1a Buildings 2019 A 2018 73 21,809,460 - 21,809,460 95% 118 6 City of Haapavesi Secondary school and high school of Haapavesi 1.1a Buildings 2020 A 2018 89 14,992,000 - 14,992,000 97% 75 6 Heinävesi Municipality Middle school of Heinävesi 1.1a Buildings 2020 A 2018 72 8,293,039 - 8,293,039 92% 81 7 Helsingin Asumisoikeus Oy Apartment building, Kettutie 10 1.1a Buildings 2021 A 2018 73 8,620,000 2,221,977 10,841,977 80% 57 7 Helsingin Asumisoikeus Oy Apartment building, Koskelantie 66b 1.1a Buildings 2020 B 2018 77–79 21,077,875 9,033,375 30,111,250 70% 100 13 Helsingin Asumisoikeus Oy Apartment building, Yläkiventie 11 1.1a Buildings 2021 A 2018 75 6,119,786 - 6,119,786 100% 39 5 Helsingin Asumisoikeus Oy Apartment building, Smoltinkuja 3 1.1a Buildings 2021 A 2018 67 5,600,000 10,663,866 16,263,866 34% 36 2 Helsingin Asumisoikeus Oy Apartment building, Yläkivenrinne 2 1.1a Buildings 2021 A 2018 74 4,520,000 3,058,631 7,578,631 60% 30 4 Helsingin Asumisoikeus Oy Apartment buildings, Fannynkallio and Kuninkaankierto 4 1.1a Buildings 2017 B 2013 98–108 16,000,169 - 16,000,169 97% 253 33 Helsingin Asumisoikeus Oy Apartment buildings Atlantinkaari and Länsisatamankatu 37 1.1a Buildings 2020 A 2018 74 28,500,000 13,864,850 42,364,850 67% 161 20 Helsingin Asumisoikeus Oy Apartment building Lavakatu 12/Veturitie 58 1.1a Buildings 2020 A 2018 72 13,849,000 4,698,000 18,547,000 75% 113 13 Helsingin Asumisoikeus Oy Apartment buildings Jamaika Haitinkuja 3, Jamaikankatu 1 and Kanariankatu 7 1.1a Buildings 2019 B 2018 79 15,204,970 - 15,204,970 100% 31 4 Helsingin Asumisoikeus Oy Apartment building, Postiljooni Lavakatu 3 1.1a Buildings 2019 A 2018 75 20,781,650 - 20,781,650 100% 127 15 Helsingin Asumisoikeus Oy Apartment building, Postimies Lavakatu 3 1.1a Buildings 2019 A 2018 75 17,187,391 - 17,187,391 99% 102 12 Helsingin Asumisoikeus Oy Apartment building, Asetelmanpolku 3 1.1a Buildings 2021 A 2018 72 - 10,412,500 10,412,500 0% 0 0
The new law of 2018
energy performance
reduced the coefficients of certain energy types used in the calculation of E-values and made the legal threshold of energy efficiency for new buildings stricter.
new coefficients, the E-values of the buildings built under the old law of 2013 would decrease, which could enhance their EPC classes
Green Impact Report 2022 Municipality Finance Plc • Green Impact Report 2022 47/64
Buildings: New buildings
of
concerning
certificates
Using new coefficients, the E-values of the buildings built under the old law of 2013 would decrease, which could enhance their EPC classes
2 The E-value represents a building’s calculated annual consumption of purchased energy per the heated net area (kWhE/m2/year) based on the usage default values and of the building’s intended use category and weighted by energy source coefficients.
3 Impacts calculated only for the new construction part of the project.
4 Experimental project, please see
and impacts
Green finance projects
Customer Project Sub-category Year of approval Energy Performance Certificate class EPC year1 E-value2 (kWh/ m2/year) Outstanding amount 31 Dec 2022 (€) Unwithdrawn credit commitment 31 Dec 2022 (€) Total committed finance 31 Dec 2022 (€) MuniFin’s estimated share of finance 31 Dec 2022 Annual energy savings (avoided / reduced MWh) Annual CO₂ emissions (avoided / reduced tCO₂) Helsingin Asumisoikeus Oy Apartment building, Gunillanpuisto 1.1a Buildings 2022 A 2018 70–71 - 17,812,031 17,812,031 0% 0 0 Helsingin kaupungin asunnot Oy Apartment building, Haakoninlahdenkatu 5–7 1.1a Buildings 2019 B 2018 80 25,075,294 - 25,075,294 99% 96 12 Helsingin kaupungin asunnot Oy Apartment building, Kalasatama Kaljaasi, Fortunankatu 6 1.1a Buildings 2021 A 2018 67 8,889,542 8,950,000 17,839,542 50% 894 7 Helsingin kaupungin asunnot Oy Apartment building, Kanariankatu 3 1.1a Buildings 2019 B 2018 79 16,204,653 - 16,204,653 99% 58 8 Helsingin kaupungin asunnot Oy Apartment building, Koskelantie 66 1.1a Buildings 2020 B 2018 76–78 17,658,576 11,772,383 29,430,959 60% 82 10 Helsingin kaupungin asunnot Oy Apartment building, Kyösti Kallion tie 1a 1.1a Buildings 2019 A 2018 75–77 9,048,546 - 9,048,546 98% 46 6 Helsingin kaupungin asunnot Oy Apartment building, Lavakatu 10 1.1a Buildings 2020 A 2018 72–75 23,952,290 2,661,365 26,613,655 90% 155 18 Helsingin kaupungin asunnot Oy Apartment building, Pyhätunturintie 2 1.1a Buildings 2019 B 2018 77–88 22,455,194 - 22,455,194 99% 91 12 Helsingin kaupungin asunnot Oy Apartment building, Sienakuja 4 1.1a Buildings 2017 B 2013 95–103 9,423,665 - 9,423,665 98% 142 18 Helsingin kaupungin asunnot Oy Apartment building, Taidemaalarinkatu 2 1.1a Buildings 2017 B 2013 71–105 13,938,419 - 13,938,419 98% 218 29 Helsingin kaupungin asunnot Oy Apartment building, Tullivuorentie 22 1.1a Buildings 2019 B 2018 78–82 12,606,526 - 12,606,526 98% 74 9 Helsingin kaupungin asunnot Oy Apartment building, Isonnevankuja 1 1.1a Buildings 2019 B 2018 85 7,998,761 - 7,998,761 98% 15 2 Helsingin kaupungin asunnot Oy Apartment building, Kaupinmäenpolku 15 1.1a Buildings 2019 B 2018 80 5,942,722 - 5,942,722 98% 23 3 Helsingin kaupungin asunnot Oy Apartment building, Maununnevantie 3 1.1a Buildings 2021 A 2018 70–74 14,366,000 14,400,000 28,766,000 50% 91 5 Helsingin kaupungin asunnot Oy Apartment buildings, Kettutie 8 a-c 1.1a Buildings 2021 A 2018 73–75 12,045,000 5,161,957 17,206,957 70% 70 9 Helsingin kaupungin asunnot Oy Apartment building, Asetelmankatu 1 1.1a Buildings 2021 A 2018 73–75 2,456,000 9,824,000 12,280,000 20% 15 2 Helsingin kaupungin asunnot Oy Apartment building, Salavakuja 2 1.1a Buildings 2021 A 2018 69–70 5,086,138 11,867,656 16,953,794 30% 25 1 Helsingin kaupungin asunnot Oy Apartment building, Yläkiventie 14 1.1a Buildings 2021 A 2018 75 5,450,200 1,362,550 6,812,750 80% 31 4 Helsingin kaupungin asunnot Oy Apartment building, Postiljooninkatu 2 1.1a Buildings 2021 A 2018 73 23,576,714 15,717,812 39,294,526 60% 141 16
threshold
efficiency for new
stricter.
The new law
2018
energy performance
reduced the coefficients of certain energy types used in the calculation of E-values and made the legal
of energy
buildings
additional
Green Impact Report 2022 Municipality Finance Plc • Green Impact Report 2022 48/64
information on p. 19.
Buildings: New buildings
The new law of 2018 concerning energy performance certificates reduced the coefficients of certain energy types used in the calculation of E-values and made
Using new coefficients, the E-values of the buildings built under the old law of 2013 would decrease, which could enhance their EPC classes
2 The E-value represents a building’s calculated annual consumption of purchased energy per the heated net area (kWhE/m2/year) based on the usage default values and of the building’s intended use category and weighted by energy source coefficients.
3 Impacts calculated only for the new construction part of the project.
4 Experimental project, please see additional information on p. 19.
and impacts
Green finance projects
Customer Project Sub-category Year of approval Energy Performance Certificate class EPC year1 E-value2 (kWh/ m2/year) Outstanding amount 31 Dec 2022 (€) Unwithdrawn credit commitment 31 Dec 2022 (€) Total committed finance 31 Dec 2022 (€) MuniFin’s estimated share of finance 31 Dec 2022 Annual energy savings (avoided / reduced MWh) Annual CO₂ emissions (avoided / reduced tCO₂) Helsingin kaupungin asunnot Oy Apartment building, Kustinpolku 7 1.1a Buildings 2019 A 2018 75 23,470,700 - 23,470,700 100% 1,795 15 Helsingin kaupungin asunnot Oy Apartment building, Smoltinkaari 6 1.1a Buildings 2021 A 2018 67 9,084,613 3,930,000 13,014,613 70% 67 4 Helsingin kaupungin asunnot Oy Apartment building, Gunillantie 3 1.1a Buildings 2022 A 2018 65–66 2,094,886 18,927,000 21,021,886 10% 16 1 Hollola Municipality School of Heinsuo 1.1a Buildings 2016 B 2013 109 14,873,716 - 14,873,716 87% 439 25 Hollola Municipality School of Kalliola 1.1a Buildings 2016 B 2013 116 14,072,817 - 14,072,817 87% 306 18 City of Hyvinkää Community centre Hangonsiltatalo 1.1a Buildings 2019 B 2018 93 22,500,000 - 22,500,000 90% 68 10 Hämeenkyrö Municipality Environmental school of Mahnala 1.1a Buildings 2017 B 2013 95 4,433,337 - 4,433,337 63% 154 9 City of Hämeenlinna Service centre of Nummi 1.1a Buildings 2016 A 2013 88 21,980,420 - 21,980,420 88% 719 28 Ii Municipality Daycare centre of Hamina 1.1a Buildings 2021 A 2018 86 3,800,000 - 3,800,000 95% 18 2 City of Imatra School campus of Mansikkala (LEED certification) 1.1a Buildings 2018 B 2013 102 41,142,858 - 41,142,858 91% 969 36 Inari Municipality Ivalo education centre (The Building Information Foundation (RTS) certfication) 1.1a Buildings 2020 A 2018 73 25,001,410 1,998,590 27,000,000 93% 215 19 Ingå Municipality Kyrkfjärdens School of Ingå 1.1a Buildings 2022 A 2018 70 10,000,000 - 10,000,000 100% 86 5 Janakkala Municipality Janakkala fire department 1.1a Buildings 2016 B 2013 103–109 5,665,092 - 5,665,092 87% 124 7 Janakkala Municipality Tervakoski sports hall 1.1a Buildings 2019 A 2018 73 4,012,500 - 4,012,500 75% 55 3 Janakkala Municipality School and community centre of Turenki, 1st phase 1.1a Buildings 2021 A 2018 68 15,778,522 6,421,478 22,200,000 71% 169 9 City of Joensuu Daycare centre of Hukanhauta 1.1a Buildings 2018 A 2013 90 3,562,612 - 3,562,612 86% 125 2 City of Joensuu Mehtimäki sportshall and school of Karsikko 1.1a Buildings 2020 A 2018 80–87 9,400,000 - 9,400,000 100% 228 7 City of Joensuu Daycare centre of Hammaslahti 1.1a Buildings 2018 A 2013 80 2,572,502 - 2,572,502 81% 89 1 City of Joensuu Middle school og Heinävaara, modular unit 1.1a Buildings 2018 B 2013 107 3,475,965 - 3,475,965 81% 95 6 City of Joensuu School of Karhumäki 1.1a Buildings 2016 A 2013 89 7,805,815 - 7,805,815 83% 312 7
the legal threshold of energy efficiency for new buildings stricter.
Green Impact Report 2022 Municipality Finance Plc • Green Impact Report 2022 49/64
Buildings: New buildings
Keski-Suomen opiskelijaasuntosäätiö sr
Kankaan Ilona, Ailakinkatu
Using new coefficients, the E-values of the buildings built under the old law of 2013 would decrease, which could enhance their EPC classes
2 The E-value represents a building’s calculated annual consumption of purchased energy per the heated net area (kWhE/m2/year) based on the usage default values and of the building’s intended use category and weighted by energy source coefficients.
3 Impacts calculated only for the new construction part of the project.
4 Experimental project, please see additional information on p. 19.
Green finance projects and impacts
Customer Project Sub-category Year of approval Energy Performance Certificate class EPC year1 E-value2 (kWh/ m2/year) Outstanding amount 31 Dec 2022 (€) Unwithdrawn credit commitment 31 Dec 2022 (€) Total committed finance 31 Dec 2022 (€) MuniFin’s estimated share of finance 31 Dec 2022 Annual energy savings (avoided / reduced MWh) Annual CO₂ emissions (avoided / reduced tCO₂) City of Joensuu School of Nepenmäki 1.1a Buildings 2016 B 2013 96 18,075,211 - 18,075,211 89% 711 22 City of Joensuu School of Rantakylä 1.1a Buildings 2018 A 2013 88 12,081,290 - 12,081,290 87% 481 12 City of Jämsä Comprehensive school of Jämsänkoski 1.1a Buildings 2017 B 2013 111 8,784,942 - 8,784,942 89% 231 8 City of Kaarina The main library, Kaarinatalo 1.1a Buildings 2017 A 2013 90 6,375,000 - 6,375,000 71% 116 7 City of Kaarina School of Hoviranta 1.1a Buildings 2022 A 2018 86 15,000,000 - 15,000,000 100% 90 5 City of Kalajoki Fire station of Kalajoki 1.1a Buildings 2017 B 2013 111 1,500,000 - 1,500,000 50% 28 1 City of Kalajoki School of Merenoja 1.1a Buildings 2019 A 2018 81 22,616,073 - 22,616,073 90% 175 8 City of Kangasala Comprehensive school of Lamminrahka 1.1a Buildings 2022 A 2018 67 19,000,000 - 19,000,000 95% 326 21 City of Kauhava Education centre of Kortesjärvi 1.1a Buildings 2022 A 2018 83 6,000,000 - 6,000,000 100% 58 2
Multi-generation block,
10 1.1a Buildings 2019 B 2018 76 8,579,296 - 8,579,296 98% 134 12 Kiinteistö Oy Kuopion Koulutilat School of Karttula 1.1a Buildings 2016 B 2013 97 10,244,800 - 10,244,800 84% 302 20 Kiinteistö Oy Kuopion Koulutilat School of Jynkkä 1.1a Buildings 2016 B 2013 101 10,862,667 - 10,862,667 75% 312 21 Kiinteistö
Turun Syvälahden koulu School of Syvälahti 1.1a Buildings 2017 B 2013 99–204 20,000,000 - 20,000,000 100% 743 45 Kirkkonummi Municipality School centre of Gesterby (The Building Information Foundation (RTS) certfication) 1.1a Buildings 2022 A 2018 63 3,162,745 61,837,255 65,000,000 5% 23 2 Kirkkonummen
Oy Apartment building, Masalan tinapuisto 1.1a Buildings 2020 A 2018 75 14,206,955 - 14,206,955 100% 83 5 City of Kokkola School of Chydenius (Leed certification) 1.1a Buildings 2018 B 2013 127 10,661,696 - 10,661,696 92% 216 15
School campus Vipusenkatu 1.1a Buildings 2016 A 2013 88 2,104,480 - 2,104,480 26% 160 9 City of Kouvola Valkeala community centre 1.1a Buildings 2021 A 2018 69 19,149,496 11,850,504 31,000,000 62% 143 24
calculation of E-values
the legal threshold of energy efficiency for new buildings stricter.
Oy
Vuokra-asunnot
Koulutuskeskus Salpaus -kuntayhtymä
The new law of 2018 concerning energy performance certificates reduced the coefficients of certain energy types used in the
and made
Green Impact Report 2022 Municipality Finance Plc • Green Impact Report 2022 50/64
Buildings: New buildings
The new law of 2018 concerning energy performance certificates reduced the coefficients of certain energy types used in the calculation of E-values and made the legal threshold of energy
for new buildings stricter. Using new coefficients, the E-values of the buildings built under the old law of 2013 would decrease, which could enhance their EPC classes
2 The E-value represents a building’s calculated annual consumption of purchased energy per the heated net area (kWhE/m2/year) based on the usage default values and of the building’s intended use category and weighted by energy source coefficients.
3 Impacts calculated only for the new construction part of the project.
4 Experimental project, please see additional information on p. 19.
Green finance projects and impacts
Customer Project Sub-category Year of approval Energy Performance Certificate class EPC year1 E-value2 (kWh/ m2/year) Outstanding amount 31 Dec 2022 (€) Unwithdrawn credit commitment 31 Dec 2022 (€) Total committed finance 31 Dec 2022 (€) MuniFin’s estimated share of finance 31 Dec 2022 Annual energy savings (avoided / reduced MWh) Annual CO₂ emissions (avoided / reduced tCO₂) City of Kouvola Daycare centre of Lehtomäki 1.1a Buildings 2018 B 2018 68 350,000 - 350,000 10% 12 1 City of Kouvola Daycare centre of Naukio 1.1a Buildings 2021 A 2018 90 2,198,074 1,301,926 3,500,000 63% 8 1 City of Kuhmo Wooden comprehensive school of Tuupala 1.1a Buildings 2016 B 2013 120 8,400,000 - 8,400,000 70% 194 16 Kuopion Opiskelija-asunnot Oy Construction of apartment building for students, Ahkio 1.1a Buildings 2019 A 2018 75 5,444,208 - 5,444,208 98% 40 3 Kuopion Opiskelija-asunnot Oy Apartment building, Minari 1.1a Buildings 2019 A 2018 73 3,944,000 - 3,944,000 100% 35 3 Kuopion Opiskelija-asunnot Oy Construction of apartment building for students, Taivaanpankko 1.1a Buildings 2019 A 2018 63 7,026,210 - 7,026,210 98% 96 8 Lahden vanhusten asuntosäätiö Senior home, Saimaankatu 29 1.1a Buildings 2019 A 2018 75 7,413,125 - 7,413,125 97% 51 3 Lapinlahti Municipality Matti and Liisa's school in Lapinlahti 1.1a Buildings 2020 A 2018 87 3,500,000 - 3,500,000 88% 46 3 Lappeenrannan Asuntopalvelu Oy Apartment building, Kiviharjunkatu 2 1.1a Buildings 2020 A 2018 74 4,488,333 - 4,488,333 98% 31 2 Laukaa Municipality School of Lievestuore 1.1a Buildings 2017 B 2013 124 11,121,123 - 11,121,123 88% 278 11 Leppävirta Municipality New primary school of Leppävirta 1.1a Buildings 2017 B 2013 127 7,701,728 - 7,701,728 90% 153 17 Liminka Municipality School of Linnukka 1.1a Buildings 2017 B 2013 123 2,500,000 - 2,500,000 50% 140 20 Liperi Municipality School of Ylämylly 1.1a Buildings 2021 A 2018 90 5,950,000 - 5,950,000 85% 68 2 Liperi Municipality School of Kirkonkylä 3 1.1a Buildings 1.2 Renovations 2021 A 2018 99 2,700,000 - 2,700,000 90% 2 0 Luksia, Länsi-Uudenmaan koulutuskuntayhtymä Construction and renovation of Toivonkatu campus 1.1a Buildings 2020 B 2018 95 11,489,362 - 11,489,362 96% 36 2 City of Tampere Apartment building, Asumisoikeus Oy Tampereen Ilokkaanrinne 5–6 1.1a Buildings 2021 A 2018 28 9,084,225 - 9,084,225 100% 223 13 Mangrove Asumisoikeus Oy Apartment building, Kuurankatu 2 ja 4 1.1a Buildings 2022 A 2018 74 3,444,000 6,729,729 10,173,729 34% 27 2 City of Mikkeli Southern regional School of Mikkeli 1.1a Buildings 2022 A 2018 77,5 29,000,000 - 29,000,000 100% 254 17 City of Mikkeli Daycare centre of Kalevankangas 1.1a Buildings 2019 A 2018 88 4,200,000 - 4,200,000 100% 20 1
efficiency
Green Impact Report 2022 Municipality Finance Plc • Green Impact Report 2022 51/64
Buildings: New buildings
Using new coefficients, the E-values of the buildings built under the old law of 2013 would decrease, which could enhance their EPC classes
2 The E-value represents a building’s calculated annual consumption of purchased energy per the heated net area (kWhE/m2/year) based on the usage default values and of the building’s intended use category and weighted by energy source coefficients.
3 Impacts calculated only for the new construction part of the project.
4 Experimental project, please see
on p. 19.
Customer Project Sub-category Year of approval Energy Performance Certificate class EPC year1 E-value2 (kWh/ m2/year) Outstanding amount 31 Dec 2022 (€) Unwithdrawn credit commitment 31 Dec 2022 (€) Total committed finance 31 Dec 2022 (€) MuniFin’s estimated share of finance 31 Dec 2022 Annual energy savings (avoided / reduced MWh) Annual CO₂ emissions (avoided / reduced tCO₂) Mäntsälä Municipality Daycare centre Amanda 1.1a Buildings 2022 A 2018 53 6,900,000 - 6,900,000 100% 87 5 Mäntsälä Municipality School of Ehnroos 1.1a Buildings 2019 A 2018 87 16,788,349 4,211,651 21,000,000 80% 75 5 NAL Asunnot Oy Apartment building, Gibraltarinaukio 4 1.1a Buildings 2021 A 2018 74 8,756,985 1,308,515 10,065,500 87% 71 9 Niiralan Kulma Oy Apartment building, Hatsalankatu 37 1.1a Buildings 2020 A 2018 75 6, 990,500 - 6,990,500 98% 46 3 Niiralan Kulma Oy Apartment building, Keskikaari 48 1.1a Buildings 2020 A 2018 71 4,647,845 - 4,647,845 99% 42 3 Niiralan Kulma Oy Apartment building, Raviradantie 8 1.1a Buildings 2020 A 2018 70 6,231,093 - 6,231,093 98% 61 5 Kiinteistö-KYS Oy Apartment building Kuopio Puijonlaakso 1.1a Buildings 2017 C 2013 107 9,531,657 - 9,531,657 98% 109 9 City of Nivala School of Junttila 1.1a Buildings 2022 A 2018 87 4,868,421 - 4,868,421 97% 28 2 City of Nokia Welfare centre of Nokia 1.1a Buildings 2021 A 2018 78 22,700,000 - 22,700,000 95% 222 16 Oulun Sivakka Oy Apartment building, Hiirihaukantie 12 a 1.1a Buildings 2020 A 2018 60 6,668,685 - 6,668,685 99% 107 7 Oulun Sivakka Oy Apartment building, Jalohaukantie 5 1.1a Buildings 2020 A 2018 59 5,723,107 - 5,723,107 97% 87 6 Oulun Sivakka Oy Apartment building, Kiilankatu 5 1.1a Buildings 2020 A 2018 66–74 8,097,080 - 8,097,080 98% 88 6 Oulun Sivakka Oy Apartment building, Menninkäisentie 3a 1.1a Buildings 2021 A 2018 68 3,947,632 - 3,947,632 100% 42 3 Oulun Sivakka Oy Apartment building, Myllytullinkatu 5 1.1a Buildings 2021 A 2018 62 4,403,250 2,935,500 7,338,750 60% 58 4 Oulun Sivakka Oy Apartment building, Valmutie 3 1.1a Buildings 2021 A 2018 79–80 3,511,023 - 3,511,023 100% 33 2 City of Parainen Creativity and learning centre of Parainen 3 1.1a Buildings 1.2 Renovations 2022 A 2018 82 9,750,000 - 9,750,000 98% 66 14 Parikkala Municipality Kirjola school, 1st phase 1.1a Buildings 2021 A 2018 83 10,150,000 - 10,150,000 85% 67 4 City of Parkano School campus of Parkano 1.1a Buildings 2017 B 2013 102 13,621,235 - 13,621,235 88% 446 78 Perho Municipality Day-care centre Perhonkoti 1.1a Buildings 2020 A 2018 89 2,823,530 - 2,823,530 88% 14 1 Green finance projects and impacts
certain energy types used in
calculation of E-values
the legal threshold of energy efficiency for new buildings stricter.
The new law of 2018 concerning energy performance certificates reduced the coefficients of
the
and made
additional
Green Impact Report 2022 Municipality Finance Plc • Green Impact Report 2022 52/64
information
Buildings: New buildings
The new law of 2018 concerning energy performance certificates reduced the
Using new coefficients, the E-values of the buildings built under the old law of 2013 would decrease, which could enhance their EPC classes
2 The E-value represents a building’s calculated annual consumption of purchased energy per the heated net area (kWhE/m2/year) based on the usage default values and of the building’s intended use category and weighted by energy source coefficients.
3 Impacts calculated only for the new construction part of the project.
4
Customer Project Sub-category Year of approval Energy Performance Certificate class EPC year1 E-value2 (kWh/ m2/year) Outstanding amount 31 Dec 2022 (€) Unwithdrawn credit commitment 31 Dec 2022 (€) Total committed finance 31 Dec 2022 (€) MuniFin’s estimated share of finance 31 Dec 2022 Annual energy savings (avoided / reduced MWh) Annual CO₂ emissions (avoided / reduced tCO₂) Pielavesi Municipality Pielakoti (building for elderly and renovation of the central commercial kitchen)3 1.1a Buildings 1.2 Renovations 2017 B 2013 138 4,962,140 - 4,962,140 98% 315 20 Pirkan Opiskelija-asunnot Oy Apartment building, Vaahterakuja 3 1.1a Buildings 2019 A 2018 72 6,228,076 - 6,228,076 98% 45 3 Pirkkala Municipality Pirkkala campus 1.1a Buildings 2021 A 2018 48 31,290,437 18,709,563 50,000,000 63% 616 47 City of Pori Community centre of Northern Pori 1.1a Buildings 2022 A 2018 76 23,750,000 - 23,750,000 95% 178 9 City of Porvoo Jokilaakso school, Porvoo 1.1a Buildings 2021 A 2018 86 2,910,860 - 2,910,860 88% 16 1 City of Saarijärvi School and culture centre of Saarijärvi, 1st phase 1.1a Buildings 2019 A 2018 78 26,606,968 - 26,606,968 98% 264 43 Savuskoski Municipality School of Savukoski 1.1a Buildings 2019 A 2018 83 3,756,800 - 3,756,800 94% 24 1 Sodankylä Municipality Community centre of Sodankylä 1.1a Buildings 2021 A 2018 72 22,240,301 2,759,699 25,000,000 89% 202 18 Sotkamo Municipality Vuokatti-arena, ice hockey arena 1.1b Other buildings 2021 N/A N/A N/A 7,562,442 - 7,562,442 94% 487 57 TA- Asumisoikeus Oy Apartment building, Metsäläntie 10 1.1a Buildings 2022 A 2018 75 2,000,000 17,049,580 19,049,580 10% 6 1 TA-Asumisoikeus Oy Apartment building Nordic Ecolabel, Rapukuja 2 1.1a Buildings 2022 A 2018 75 2,050,000 4,054,836 6,104,836 34% 13 1 TA-Asumisoikeus Oy Apartment building, Tuulensuunkatu 27 1.1a Buildings 2021 A 2018 75 4,250,000 - 4,250,000 100% 38 2 TA- Asumisoikeus Oy Apartment buildings, Espoon Peijinkatu 1b-1c buildings A2 and B2 1.1a Buildings 2021 A 2018 70–72 6,655,545 9,577,494 16,233,039 41% 54 3 TA- Asumisoikeus Oy Apartment building, Koy Heikinketo/Kanslerintie 17 1.1a Buildings 2020 A 2018 72 4,567,050 - 4,567,050 100% 44 3 TA-Asumisoikeus Oy Apartment building, Metsäläntie 6 b in Pasilan Porttipuisto 1.1a Buildings 2019 A 2018 71–75 14,695,956 - 14,695,956 99% 98 6 TA-Asumisoikeus Oy Apartment building, Pellonreuna 7 1.1a Buildings 2019 B 2018 84 8,133,560 - 8,133,560 98% 12 1 TA-Asumisoikeus Oy Apartment building,
6 1.1a Buildings 2020 A 2018 73 6,313,690 - 6,313,690 99% 47 3 Green finance projects and impacts
coefficients of certain energy types used
calculation of E-values
legal threshold of energy efficiency for new buildings stricter.
Lohjan Sahapiha/Sahapiha
in the
and made the
see additional information on
Green Impact Report 2022 Municipality Finance Plc • Green Impact Report 2022 53/64
Experimental project, please
p. 19.
Buildings: New buildings
of Turku School of Pääskyvuori and Sirkkala, community centre of Runosmäki, school and daycare centre of Suikkila
The new law of 2018 concerning energy performance certificates reduced the coefficients of certain energy types used in the calculation of E-values and made the legal threshold of energy efficiency for new buildings stricter. Using new coefficients, the E-values of the buildings built under the old law of 2013 would decrease, which could enhance their EPC classes
2 The E-value represents a building’s calculated annual consumption of purchased energy per the heated net area (kWhE/m2/year) based on the usage default values and of the building’s intended use category and weighted by energy source coefficients.
3 Impacts calculated only for the new construction part of the project.
4 Experimental project, please see additional information on p. 19.
Project Sub-category Year of approval Energy Performance Certificate class EPC year1 E-value2 (kWh/ m2/year) Outstanding amount 31 Dec 2022 (€) Unwithdrawn credit commitment 31 Dec 2022 (€) Total committed finance 31 Dec 2022 (€) MuniFin’s estimated share of finance 31 Dec 2022 Annual energy savings (avoided / reduced MWh) Annual CO₂ emissions (avoided / reduced tCO₂) Tampereen Kotilinnasäätiö sr Apartment building, Kourutaltankatu 8 1.1a Buildings 2020 A 2018 75 8,404,106 - 8,404,106 98% 65 4 Tampereen
Apartment buildings,
buildings
and
1.1a Buildings 2022 A 2018 75 2,400,000 15,386,000 17,786,000 13% 13 1
sr Apartment building, Heittoniitynkuja 2 1.1a Buildings 2022 A 2018 75 - 12,129,000 12,129,000 0% 0 0 Tohmajärvi Municipality School centre of Tohmajävi 1.1a Buildings 2022 A 2018 66 12,393,835 - 12,393,835 98% 177 46 Tohmajärvi Municipality Daycare centre of Tikkala, Tohmajärvi 1.1a Buildings 2018 A 2018 84 1,550,000 - 1,550,000 78% 7 0 City of Turku Temporary/movable school facilities for school of Mikael 1.1a Buildings 2022 A 2018 87 2,475,084 149,453 2,624,537 94% 12 1 City
ja
daycare
Tommilankatu 3 1.1a Buildings 1.2 Renovations 2016 A 2018 75–90 40,000,000 - 40,000,000 100% 293 18 Tuusula Municipality Martta Wendelin daycare centre and Kirkonkylä school with Nordic Ecolabel 1.1a Buildings 2020 B 2018 88–94 25,000,000 - 25,000,000 100% 97 7 Tyrnävä Municipality School of Rantarousti 1.1a Buildings 2016 B 2013 101 9,902,444 - 9,902,444 71% 302 31 Varttuneiden asumisoikeusyhdistys Jaso Multi-generation block, Kankaan Ilona, Ailakinkatu 10 1.1a Buildings 2019 B 2018 76 9,895,355 - 9,895,355 98% 134 12 VAV Asunnot Oy Apartment building, Perintötie 9 1.1a Buildings 2022 A 2018 75 22,578,480 - 22,578,480 100% 147 16 VAV Asunnot Oy Apartment building with Nordic Ecolabel, Kaskelantie 1 1.1a Buildings 2018 B 2018 77 18,266,782 - 18,266,782 95% 405 44 VAV Yhtymä Oy Apartment building with Nordic Ecolabel, Veturikuja 8 1.1a Buildings 2019 A 2018 74–75 18,696,142 - 18,696,142 96% 114 12 Vesanto Municipality School campus of Vesanto 1.1a Buildings 2019 A 2018 85 5,830,174 - 5,830,174 95% 31 3 Green finance projects and impacts
Customer
Kotilinnasäätiö sr
Uimalankatu 1
1b
1c
Tampereen Vuokratalosäätiö
and
centre
Green Impact Report 2022 Municipality Finance Plc • Green Impact Report 2022 54/64
Buildings: New buildings
2 The E-value represents a building’s calculated annual consumption of purchased energy per the heated net area (kWhE/m2/year) based on the usage default values and of the building’s intended use category and weighted by energy source coefficients.
3 Impacts calculated only for the new construction part of the project.
4 Experimental project, please see additional information on p. 19.
Customer Project Sub-category Year of approval Energy Performance Certificate class EPC year1 E-value2 (kWh/ m2/year) Outstanding amount 31 Dec 2022 (€) Unwithdrawn credit commitment 31 Dec 2022 (€) Total committed finance 31 Dec 2022 (€) MuniFin’s estimated share of finance 31 Dec 2022 Annual energy savings (avoided / reduced MWh) Annual CO₂ emissions (avoided / reduced tCO₂)
of
1.1a Buildings 2021 A 2018 66 30,000,000 - 30,000,000 100% 280 17 City of Virrat Comperehensive school of Virrat 1.1a Buildings 2019 A 2018 73 9,372,471 - 9,372,471 78% 146 7 City of Ylöjärvi Comprehensive school Siltatie 1.1a Buildings 2022 A 2018 75 10,000,000 - 10,000,000 100% 181 14 Yrjö ja Hanna Kiinteistöt Oy Apartment buildings, Kuokkalan Kalon buildings 2, 3 and 4 1.1a Buildings 2022 A 2018 70–71 1,500,000 14,443,874 15 943 874 9% 13 1 Sipoo Municipality Fire station of Sipoo (office building) 1.1a Buildings 2021 A 2018 80 4,761,702 5,038,298 9,800,000 49% 12 1 City of Äänekoski Äänekoski Ice hockey arena 1.1b Other buildings 2018 N/A N/A N/A 3,974,031 - 3,974,031 88% 1,585 420 Lahden Asunnot Oy Apartment building, As.oy lahden iisakki 1.1a Buildings 2017 B 2013 99 3,440,176 - 3,440,176 98% 52 3 Lahden Asunnot Oy Apartment building, As.oy lahden valtteri 1.1a Buildings 2017 B 2013 100 5,542,544 - 5,542,544 98% 83 4 Lahden Asunnot Oy Apartment building, Kivakatu 2 1.1a Buildings 2020 A 2018 73 8,880,439 - 8,880,439 98% 67 4 Lahden Asunnot Oy Building for elderly, Uudenpellonkatu 1 1.1a Buildings 2017 B 2013 98 8,178,042 - 8,178,042 98% 97 5 Lahden Asunnot Oy Construction of apartment building Vanhatie 53 1.1a Buildings 2017 B 2013 100 3,394,764 - 3,394,764 98% 61 3 Lahden Asunnot Oy Construction of apartment building, Vasarantie 2 ja 4 1.1a Buildings 2019 A 2018 68 11,838,095 - 11,838,095 97% 125 7 Lahden Asunnot Oy Apartment building, Laatikkotehtaankatu 5 b and c 1.1a Buildings 2019 A 2018 71 11,380,504 - 11,380,504 97% 102 6 Kiinteistö Oy M2-Kodit Construction of apartment building KOY Tampereen Jallukka 1.1a Buildings 2020 A 2018 75 6,079,712 - 6,079,712 98% 40 4 TA-Yhtymä Oy Apartment building, KOY Oulun Tarve, Paraatikatu 10 1.1a Buildings 2017 B 2013 100 5,784,376 - 5,784,376 98% 91 7 Green
used
calculation
E-values
the legal threshold of energy efficiency for new buildings stricter.
Vihti Municipality School and daycare centre
Etelä-Nummela (The Building Information Foundation (RTS) certfication)
finance projects and impacts The new law of 2018 concerning energy performance certificates reduced the coefficients of certain energy types
in the
of
and made
Using new coefficients, the E-values of the buildings built under the old law of 2013 would decrease, which could enhance their EPC classes
Green Impact Report 2022 Municipality Finance Plc • Green Impact Report 2022 55/64
Buildings: New buildings
Oy M2-Kodit
Oy M2-Kodit
Toivo Group Oyj/ Elämäni Kodit 40 Oy
As.
ja Hanna-säätiö/ Asoasunnot Uusimaa
and impacts The new law of 2018 concerning energy performance certificates reduced the coefficients of certain energy types used in the calculation of E-values and made the legal threshold of energy efficiency for new buildings stricter. Using new coefficients, the E-values of the buildings built under the old law of 2013 would decrease, which could enhance their EPC classes
2 The E-value represents a building’s calculated annual consumption of purchased energy per the heated net area (kWhE/m2/year) based on the usage default values and of the building’s intended use category and weighted by energy source coefficients.
3 Impacts calculated only for the new construction part of the project.
4 Experimental project, please see additional information on p. 19.
Customer Project Sub-category Year of approval Energy Performance Certificate class EPC year1 E-value2 (kWh/ m2/year) Outstanding amount 31 Dec 2022 (€) Unwithdrawn credit commitment 31 Dec 2022 (€) Total committed finance 31 Dec 2022 (€) MuniFin’s estimated share of finance 31 Dec 2022 Annual energy savings (avoided / reduced MWh) Annual CO₂ emissions (avoided / reduced tCO₂) TA-Yhtymä Oy Apartment building, As.oy. Espoon Luoteisrinne 1.1a Buildings 2022 A 2018 75 5,600,000 23,749,036 29,349,036 19% 22 2 TA-Yhtymä Oy Apartment building, KOY Oulun
44 1.1a Buildings 2019 C 2018 N/A 7,220,264 - 7,220,264 97% 0 0 Y-Säätiö/Kiinteistö Oy M2-Kodit Apartment building, Lyyranpyrstö 2 1.1a Buildings 2022 A 2018 74 10,060,472 3,782,298 13,842,770 73% 76 8 Y-Säätiö/Kiinteistö Oy M2-Kodit Apartment building, Postiljooninkatu 1 1.1a Buildings 2020 A 2018 75 10,778,826 - 10,778,826 98% 57 7
Apartment building, Rullakkokuja 14 1.1a Buildings 2022 A 2018 75 2,217,054 16,901,320 19,118,374 12% 12 2
Apartment building, Nihtisillankuja 2 H ja 1.1a Buildings 2022 A 2018 74 - 17,229,766 17,229,766 0% 0 0
Tarve, Pohjantikankuja
Y-Säätiö/Kiinteistö
Y-Säätiö/Kiinteistö
Apartment building,
oy kirkkonummen atlas 1.1a Buildings 2021 A 2018 72 5,277,789 - 5,277,789 100% 31 2 Toivo Group Oyj/ Elämäni Kodit 40 Oy Apartment building, As.oy. Vantaan Nahkuri 1.1a Buildings 2022 A 2018 71 4,463,114 12,606,064 17,069,178 26% 25 1 Premico Vuokra-asunnot ll Oy Apartment building, As. oy. Vantaan Metsäkissa 2 1.1a Buildings 2020 B 2018 86 13,271,367 - 13,271,367 98% 20 2 Nemoy Rakennuttaja Oy Apartment building, As.oy. Tuusulan Oiva 1.1a Buildings 2020 A 2018 75–80 6,410,167 - 6,410,167 98% 54 3 Taaleri Vuokrakoti ARA lll Oy Apartment building, As. oy. Tampereen Hervantajärven Hilpi 1.1a Buildings 2021 A 2018 74 6,427,200 - 6,427,200 100% 44 3 Oulun Moniasunnot Oy Apartment building, Siirtolantie 6 1.1a Buildings 2021 A 2018 74 7,300,800 - 7,300,800 100% 45 3 Avain Vuokra10 Oy Apartment building, Alhotie 19 1.1a Buildings 2022 A 2018 74–75 7,219,121 12,292,017 19,511,138 37% 45 3 Avain Vuokra10 Oy Apartment building, As.oy. Kuopion Kuikkalampi 1.1a Buildings 2021 A 2018 75 5,206,000 - 5,206,000 100% 39 2 EAI Vuokra-asunnot Oy Apartment building, As.oy. Helsingin Vetonaula 1.1a Buildings 2020 A 2018 68–75 6,902,778 - 6,902,778 99% 67 4
Apartment building, Kuokkalan kalon, building 1 1.1a Buildings 2022 A 2018 69 2,071,342 1,115,338 3,186,680 65% 17 1 Green
Yrjö
Oy
finance projects
Green Impact Report 2022 Municipality Finance Plc • Green Impact Report 2022 56/64
Vilusen Rinne Vuokra-asunnot Oy, Tampere
Buildings: Renovation projects
Hikivuorenkatu 20 a
The new law of 2018 concerning energy performance certificates reduced the coefficients of certain energy types used in the calculation of E-values and made the legal threshold of energy efficiency for new buildings stricter. Using new coefficients, the E-values of the buildings built under the old law of 2013 would decrease, which could enhance their EPC classes
2 The E-value represents a building’s calculated annual consumption of purchased energy per the heated net area (kWhE/m2/year) based on the usage default values and of the building’s intended use category and weighted by energy source coefficients.
3 Impacts calculated only for the new construction part of the project.
4 Experimental project, please see additional information on p. 19.
5 Project has a fossile fuel element, please see additional detail on p. 19.
6 Avoided emissions (CO₂) reported as zero. The project saves net energy, but due to the recent strong decarbonization of district heating in the region, the increase in
would cause an increase in the calculated emissions.
and the
Customer Project Sub-category Year of approval Outstanding amount 31 Dec 2022 (€) Unwithdrawn credit commitment 31 Dec 2022 (€) Total committed finance 31 Dec 2022 (€) MuniFin’s estimated share of finance 31 Dec 2022 Annual energy savings (avoided / reduced MWh) Annual CO₂ emissions (avoided / reduced tCO₂) Helsingin kaupungin asunnot Oy Apartment building, Jakomäentie 10 1.2 Renovations 2022 - 23,955,760 23,955,760 0% -Helsingin kaupungin asunnot Oy Apartment building, Jollaksentie 87 1.2 Renovations 2020 7,120,077 - 7,120,077 99% 699 135 Helsingin kaupungin asunnot Oy Apartment building, Koivikkotie 5 1.2 Renovations 2021 10,233,199 2,558,300 12,791,499 80% 347 21 Helsingin kaupungin asunnot Oy Apartment building, Rusthollarintie 10 1.2 Renovations 2020 17,411,099 1,948,640 19,359,739 89% 499 69 Helsingin kaupungin asunnot Oy Apartment building, Perhekunnantie 10 1.2 Renovations 2021 - 16,297,237 16,297,237 0% -Hyvinkään Vuokra-asunnot Oy Apartment building, Jussilankatu 2 1.2 Renovations 2021 5,674,510 2,382,440 8,056,950 70% 812 119 Hyvinkään Vuokra-asunnot Oy Apartment building, Jussilankatu 4 1.2 Renovations 2021 495,000 7,561,950 8,056,950 6% 72 11 Buildings: New buildings Customer Project Sub-category Year of approval Energy Performance Certificate class EPC year1 E-value2 (kWh/ m2/year) Outstanding amount 31 Dec 2022 (€) Unwithdrawn credit commitment 31 Dec 2022 (€) Total committed finance 31 Dec 2022 (€) MuniFin’s estimated share of finance 31 Dec 2022 Annual energy savings (avoided / reduced MWh) Annual CO₂ emissions (avoided / reduced tCO₂) Etelä-Suomen Kodit Oy Apartment building, As.oy. Turun Viridi 1.1a Buildings 2020 A 2018 73 5,217,018 - 5,217,018 99% 42 2 Etelä-Suomen Kodit Oy Apartment building, As.oy. Turun Löytöretkeilijä 1.1a Buildings 2019 A 2018 74 5,395,211 - 5,395,211 98% 40 2 Suomen Kaupunkikodit ARA Oy Apartment building, Hakatie 1 1.1a Buildings 2021 A 2018 76–77 11,454,116 468,384 11,922,500 96% 126 8 Toivo
Kodit
Oy Apartment building, As.oy. Nokian Fabriikki 1.1a Buildings 2020 A 2018 75 5,961,340 - 5,961,340 98% 37 2
Apartment building, As.oy. Helsingin Blackstone 1.1a Buildings 2021 A 2018 66–78 11,428,032 - 11,428,032 99% 107 6
Group Oyj/ Elämäni
10
Toivo Group Oyj/ Elämäni Kodit 10 Oy
ja b 1.1a Buildings 2021 A 2018 72 - 11,165,000 11,165,000 0% 0 0 Y-Säätiö Apartment building, Myllytie 14 a 1.1a Buildings 2022 A 2018 68 - 9,347,100 9,347,100 0% 0 0 Green finance projects and impacts
Apartment buildings,
electricity consumption
emission
Green Impact Report 2022 Municipality Finance Plc • Green Impact Report 2022 57/64
coefficients used
Buildings: Renovation projects
Customer
opiskelija-asuntosäätiö sr
5 Project has a fossile fuel element, please see additional detail on p. 19.
6 Avoided emissions (CO₂) reported as zero. The project saves net energy, but due to the recent strong decarbonization of district heating in the region, the increase in electricity consumption and the emission coefficients used would cause an increase in the calculated emissions.
Green finance projects and impacts
Project Sub-category Year of approval Outstanding amount 31 Dec 2022 (€) Unwithdrawn credit commitment 31 Dec 2022 (€) Total committed finance 31 Dec 2022 (€) MuniFin’s estimated share of finance 31 Dec 2022 Annual energy savings (avoided / reduced MWh) Annual CO₂ emissions (avoided / reduced tCO₂) Joensuun Kodit Oy Apartment building, Noljakankaari 10 1.2 Renovations 2021 2,998,768 - 2,998,768 100% 290 5
Kodit Oy Apartment building, Äkkiväärä 10 6 1.2 Renovations 2020 2,737,938 - 2,737,938 99% 285Joensuun Kodit Oy Apartment building, Huvimäentie 16 5 1.2 Renovations 2021 2,401,218 - 2,401,218 99% 254 76 Joensuun Kodit Oy Apartment building, Latolankatu 23, 2nd phase 6 2021 5,388,635 - 5,388,635 99% 540Joensuun Kodit Oy Apartment building, Latolankatu 3 6 1.2 Renovations 2020 2,557,614 - 2,557,614 98% 320Jyväskylän Vuokra-asunnot Oy Apartment building, Kiljaderinkatu 8 1.2 Renovations 2022 4,861,112 - 4,861,112 97% 169 17 Jyväskylän Yliopiston Ylioppilaskunta Apartment building, Taitoniekantie 9 b 1.2 Renovations 2018 7,609,004 - 7,609,004 97% 233 17 Jyväskylän Yliopiston Ylioppilaskunta Apartment building, Taitoniekantie 9 c 1.2 Renovations 2019 7,589,730 - 7,589,730 98% 438 45 Jyväskylän Yliopiston Ylioppilaskunta Apartment building, Taitoniekantie 9 d 1.2 Renovations 2020 8,567,466 - 8,567,466 100% 458 47 Jyväskylän Yliopiston Ylioppilaskunta Apartment building Taitoniekantie 9 e 1.2 Renovations 2021 7,252,098 - 7,252,098 99% 426 43 Keski-Suomen
Apartment building, Kopparintie 1 1.2 Renovations 2021 3,563,878 - 3,563,878 99% 475 51 Kouvolan Asunnot Oy Apartmanet building, Viialankatu 5 1.2 Renovations 2022 6,500,000 - 6,500,000 100% 713 158 Mikalo Oy Apartment building, Yrjönkatu 19, Mikkeli 1.2 Renovations 2022 - 1,995,000 1,995,000 0% -Oulun Sivakka Oy Apartment building, Makasiininkatu 6 1.2 Renovations 2020 1,738,800 - 1,738,800 92% 308 28 Savonlinnan Vuokratalot Oy Apartment building, Aholahdentie 113 ja Aholahdentie 115 1.2 Renovations 2022 - 175,585 175,585 0% -Savonlinnan Vuokratalot Oy Apartment building, Hilkanhaka 6 ja 7 1.2 Renovations 2022 - 276,684 276,684 0% -Savonlinnan Vuokratalot Oy Apartment building, Kirstintupa ja Marintupa 1.2 Renovations 2022 - 230,959 230,959 0% - -
Oy Apartment building, Lönnrotinkatu 1 1.2 Renovations 2019 5,345,615 - 5,345,615 96% 260 158 Green Impact Report 2022 Municipality Finance Plc • Green Impact Report 2022 58/64
Joensuun
Ääneseudun Asunnot
Green finance projects and impacts
Renewable energy in buildings Customer Project Sub-category Year of approval Outstanding amount 31 Dec 2022 (€) Unwithdrawn credit commitment 31 Dec 2022 (€) Total committed finance 31 Dec 2022 (€) MuniFin's estimated share of finance 31 Dec 2022 Annual production of renewable energy (MWh) Renewable energy production capacity (MW) Annual CO₂ emissions avoided / reduced (tCO₂) Vihti Municipality Solar panels in Vihti 1.4 Renewable energy in buildings 2020 135,732 - 135,732 81% 170 0,2Buildings: Individual energy efficiency measures Customer Project Sub-category Year of approval Outstanding amount 31 Dec 2022 (€) Unwithdrawn credit commitment 31 Dec 2022 (€) Total committed finance 31 Dec 2022 (€) MuniFin's estimated share of finance 31 Dec 2022 Annual energy savings (avoided / reduced MWh) Annual CO₂ emissions avoided / reduced (tCO₂) Jyväskylän Tilapalvelu (facility services) Jyväskylä Esco projects 7 1.5 Energy saving project (ESCO) 2018 1,011,341 - 1,011,341 92% 3,294 306 City of Kotka Renewal of street lightning in the area of Otsola 1.5 Energy saving project (ESCO) 2017 148,556 - 148,556 53% 135 8 City of Kotka Renewal of street lightning in the area of Rauhala 1.5 Energy saving project (ESCO) 2018 320,806 - 320,806 63% 182 11 City of Kotka Renewal of street lightning in the area of Ristikallio 1.5 Energy saving project (ESCO) 2016 144,888 - 144,888 44% 98 6 Koulutuskeskus Salpaus -kuntayhtymä Education centre, Ståhlberginkatu 8-10 1.3 Individual energy efficiency measures 2018 1,263,159 - 1,263,159 63% 513 27 Liperi Municipality Renewal of street lightning in the area of Ruuska 1.5 Energy saving project (ESCO) 2021 99,152 - 99,152 87% 15 1 Mäntyharju Municipality Renewal of street lighting in Mäntyharju 1.5 Energy saving project (ESCO) 2019 330,000 - 330,000 100% 185 11 City of Pieksämäki Renewal of lighting along Uhomäki fitness track 1.5 Energy saving project (ESCO) 2019 116,245 - 116,245 64% 32 2 Pielavesi Municipality Renewal of street lightning in Pielavesi 1.5 Energy saving project (ESCO) 2018 238,653 761,347 1,000,000 24% 22 1 City of Tampere Tampere Esco-projects 7 1.5 Energy saving project (ESCO) 2017 581,040 1,418,960 2,000,000 29% 956 112 7 An energy saving project (ESCO) concerning several buildings. An ESCO (Energy Service Company) is a procedurein which an ESCO assumes operational responsibility for an investment to be made to an end customer so that the investment can be financed in whole or in part by the savings it generates. Transportation Customer Project Sub-category Year of approval Outstanding amount 31 Dec 2022 (€) Unwithdrawn credit commitment 31 Dec 2022 (€) Total committed finance 31 Dec 2022 (€) MuniFin's estimated share of finance 31 Dec 2022 Annual CO₂ emissions avoided / reduced (tCO₂) City of Helsinki Crown Bridges Light Rail (CEEQUAL sustainability assesment) 2.2 Supporting infrastructure for public transportation 2022 115,000,000 - 115,000,000 35% 1,446 Kymsote-Kiinteistöt Oy (social and healthcare services) Fully electric cars, VW e-up (22 vehicles) 2.3 Passenger cars and light commercial vehicles 2022 422,151 - 422,151 90% 15 Länsimetro Oy Western Metro extension, 1st phase Ruoholahti-Matinkylä 2.1 Public transportation 2017 403,633,602 - 403,633,602 34% 2,315 Green Impact Report 2022 Municipality Finance Plc • Green Impact Report 2022 59/64
Buildings:
Green finance projects and impacts 8 Project has a fossile fuel element, please see additional detail on p. 19. Transportation Customer Project Sub-category Year of approval Outstanding amount 31 Dec 2022 (€) Unwithdrawn credit commitment 31 Dec 2022 (€) Total committed finance 31 Dec 2022 (€) MuniFin's estimated share of finance 31 Dec 2022 Annual CO₂ emissions avoided / reduced (tCO₂) Länsimetro Oy Western Metro extension, 2nd phase Matinkylä-Kivenlahti 2.1 Public transportation 2018 160,000,000 - 160,000,000 14% 207 City of Nurmes Fully electric van, Nissan e-nv200 2.3 Passenger cars and light commercial vehicles 2017 4,905 - 4,905 18% 0 City of Orivesi Fully electric car, Citroen e-Berlingo 2.3 Passenger cars and light commercial vehicles 2022 25,372 - 25,372 82% 1 Seinäjoki Joint Municipal Authority for Education Fully electric car, Skoda Enyaq 2.3 Passenger cars and light commercial vehicles 2022 27,915 - 27,915 80% 1 Tampereen Infra Oy Fully electric cars, Kia s-Soul (2 vehicles) 2.3 Passenger cars and light commercial vehicles 2022 46,013 - 46,013 80% 1 Tampereen Raitiotie Oy City of Tampere tramway 2.1 Public transportation 2017 146,057,696 - 146,057,696 47% 2,128 Tampereen Raitiotie Oy City of Tampere tramway, 2nd phase 2.1 Public transportation 2022 50,000,000 - 50,000,000 16% 729 City of Turku Fully electric car, Mercedes-Benz EGC 2.3 Passenger cars and light commercial vehicles 2022 30,725 - 30,725 64% 1 City of Turku, Turku Vocational Institute Fully electric cars, VW e-up (3 vehicles) 2.3 Passenger cars and light commercial vehicles 2022 49,477 - 49,477 83% 2 City of Turku, Procurement Services of the City of Turku Fully electric cars, Citroen e-Berlingo ( 2 vehicles) 2.3 Passenger cars and light commercial vehicles 2022 50,945 - 50,945 87% 1 City of Turku, Procurement Services of the City of Turku (Social and healthcare services) Fully electric cars, VW e-up (23 vehicles) 2.3 Passenger cars and light commercial vehicles 2022 388,695 - 388,695 91% 16 City of Vaasa Kvarken Archipelago car and passenger ferry, M/S Aurora Botnia 8 2.1 Public transportation 2020 25,000,000 - 25,000,000 21% 1,950 Renewable energy Customer Project Sub-category Year of approval Outstanding amount 31 Dec 2022 (€) Unwithdrawn credit commitment 31 Dec 2022 (€) Total committed finance 31 Dec 2022 (€) MuniFin's estimated share of finance 31 Dec 2022 Annual production of renewable energy (MWh) Renewable energy production capacity (MW) Annual CO₂ emissions avoided / reduced (tCO₂) Kangasalan Lämpö Oy Bioenergy heating plant 3.3 Bioenergia 2018 8,275,865 - 8,275,865 83% - 10 9,931 Kemin Energia ja Vesi Oy Cental bioheating plant 3.3 Bioenergia 2019 8,280,000 - 8,280,000 92% - 17 22,393 Lempäälän Energia Oy Viialantie heating plant, fuel storing and unloading concept 3.3 Bioenergia 2017 3,714,288 - 3,714,288 71% - - 5,873 Lempäälän Energia Oy Energy self-sufficiency project of Lempäälä 8 2017 8,083,336 - 8,083,336 83% 15,053 7 3,760 Green Impact Report 2022 Municipality Finance Plc • Green Impact Report 2022 60/64
Water and waste water management Customer Project Sub-category Year of approval Outstanding amount 31 Dec 2022 (€) Unwithdrawn credit commitment 31 Dec 2022 (€) Total committed finance 31 Dec 2022 (€) MuniFin's estimated share of finance 31 Dec 2022 Annual amount of treated waste water in existing plants immediately after project completion (m3) Annual amount of treated waste water with increased capacity in the future (m3) Annual production of renewable energy (MWh) City of Heinola Plant of Sahaniemis Sahanniemen 1 Heinola 2 4.2 Existing waste water facilities 2018 4,800,000 - 4,800,000 60% 1,390,650 -Helsinki Region Environmental Services HSY Waste water treatment plant of Blominmäki 4.1 New waste water facilities 2020 187,750,000 - 187,750,000 48% - 26,357,212Hämeenlinnan Seudun Vesi Oy Waste water treatment plant of Paroinen 4.2 Existing waste water facilities 2021 13,100,000 - 13,100,000 68% 5,464,571 -City of Imatra Waste water treatment plant of Meltola 4.2 Existing waste water facilities 2020 16,000,000 - 16,000,000 76% 3,869,519 -Jyväskylän Seudun Puhdistamo Oy Purification plant centre of Jyväskylä region 4.2 Existing waste water facilities 2016 8,636,368 - 8,636,368 86% 11,734,341 2,263,963City of Jämsä Central purification plant of Jämsä 4.2 Existing waste water facilities 2020 3,000,000 - 3,000,000 75% 1,410,086 -City of Mikkeli Water and waste water treatment plant of Metsä-sairila 4.1 New waste water facilities 2016 18,333,340 - 18,333,340 32% - 1,785,983Savukoski Municipality Waste water treatment plant of Mukkavaara 4.1 New waste water facilities 2020 1,176,696 - 1,176,696 87% 31,496 -Tunturi-Lapin Vesi Oy Central purification plant of Ylläs 4.1 New waste water facilities 2018 4,911,115 - 4,911,115 94% 344,722 -Turun Seudun Puhdistamo Oy Waste water purification plant of Kakolanmäki 4.2 Existing waste water facilities 2018 23,400,000 - 23,400,000 78% - -City of Uusikaupunki Waste water purification plant of Häpönniemi 4.2 Existing waste water facilities 2018 1,348,280 - 1,348,280 79% 2,226,129 -Vesikolmio Oy Central purification plant of Kalajokilaakso 4.1 New waste water facilities 2016 7,125,000 - 7,125,000 48% 1,425,000 - 428 Renewable energy Customer Project Sub-category Year of approval Outstanding amount 31 Dec 2022 (€) Unwithdrawn credit commitment 31 Dec 2022 (€) Total committed finance 31 Dec 2022 (€) MuniFin's estimated share of finance 31 Dec 2022 Annual production of renewable energy (MWh) Renewable energy production capacity (MW) Annual CO₂ emissions avoided / reduced (tCO₂) Seinäjoen Energia Oy Kapernaum 50 mw bioenergy heating plant 3.3 Bioenergia 2021 22,885,715 - 22,885,715 88% 176,044 44 50,173 Taipalsaaren Lämpö Oy Kuivaketvele bioenergy heating plant 3.3 Bioenergia 2021 70,000 - 70,000 70% - 0 200 Green Impact Report 2022 Municipality Finance Plc • Green Impact Report 2022 61/64
Green finance projects and impacts
Independent practitioner’s limited assurance report
To the Management of Municipality Finance Plc
We have been engaged by the Management of Municipality Finance Plc (hereinafter also the “Company”) to perform a limited assurance engagement on selected information for the reporting period ended 31 December 2022, disclosed in Municipality Finance Plc Green Impact report 2022 (hereinafter the Selected information).
Selected information
The Selected information within the scope of assurance covers:
• The disclosures of the allocation of the Green Bond proceeds for the reporting period ended 31 December 2022 as disclosed in the Municipality Finance Plc Green Impact Report 2022 on page 18 in table under section “Project compatibility under the updated Green Bond Framework”.
Management’s responsibility
The Management of the Company is responsible for preparing the Selected information in accordance with the reporting criteria as set out in the Company’s reporting instructions (described in Company’s Green Impact Report 2022), Eligibility Criteria set out in the Municipality Finance Plc Green Bond Framework (August 2022). The Management of the Company is also responsible for such internal control as the management determines is necessary to enable the preparation of the Selected information that is free from material misstatement, whether due to fraud or error.
Practitioner’s independence, other ethical requirements and quality controly
We have complied with the independence and other ethical requirements of the International Code of Ethics for Professional Accountants (including International Independence Standards) issued by the International Ethics Standards Board for Accountants (IESBA code), which is founded on
fundamental principles of integrity, objectivity, professional competence and due care, confidentiality and professional behavior.
PricewaterhouseCoopers Oy applies International Standard on Quality Management (ISQM) 1, which requires the firm to design, implement and operate a system of quality management including policies or procedures regarding compliance with ethical requirements, professional standards and applicable legal and regulatory requirements.
Practitioner’s responsibility
Our responsibility is to express a limited assurance conclusion on the Selected information based on the procedures we have performed and the evidence we have obtained. We conducted our limited assurance engagement in accordance with the International Standard on Assurance Engagements (ISAE) 3000 (revised) “Assurance Engagements Other than Audits or Reviews of Historical Financial Information”. This
External verification
Green Impact Report 2022 Municipality Finance Plc • Green Impact Report 2022 62/64
standard requires that we plan and perform the engagement to obtain limited assurance about whether the Selected information is free from material misstatement.
In a limited assurance engagement, the evidence-gathering procedures are more limited than for a reasonable assurance engagement, and therefore less assurance is obtained than in a reasonable assurance engagement. An assurance engagement involves performing procedures to obtain evidence about the amounts and other information in the Selected information. The procedures selected depend on the practitioner’s judgment, including an assessment of the risks of material misstatement of the Selected information.
Our work consisted of, amongst others, the following procedures:
• Interviewing employees responsible for collecting and reporting the Selected information.
• Assessing how employees apply the reporting instructions and procedures of the Company with regards to whether the disclosures have been prepared in accordance with the Municipality Finance Plc Green Bond Framework (August 2022).
• Inspecting the documentation of the Green Finance Team to confirm that the allocation of Green Bond proceeds to eligible green projects had been considered and approved according to the process described in the Municipality Finance Plc Green Bond Framework (August 2022).
• Performing substantive testing to verify the existence of eligible green projects and accurate allocation of green bond proceeds per eligible green projects in accordance with the Municipality Finance Plc Green Bond Framework (August 2022).
• Testing the consolidation of information and performing recalculations on a sample basis.
• Considering the disclosure and presentation of the Selected information.
Limited assurance conclusion
Based on the procedures we have performed and the evidence we have obtained, nothing has come to our attention that causes us to believe that Municipality Finance Plc’s Selected information for the reporting period ended 31 January 2022 is not properly prepared, in all material respects, in accordance with the Reporting criteria.
When reading our limited assurance report, the inherent limitations to the accuracy and completeness of the Selected information should be taken into consideration.
Our assurance report has been prepared in accordance with the terms of our engagement. We do not accept, or assume responsibility to anyone else, except to Municipality Finance Plc.
Helsinki 6th March 2023
PricewaterhouseCoopers Oy
Tiina Puukkoniemi
Partner, Authorised Public Accountant (KHT) ESG Reporting &
Assurance
Green Impact Report 2022 Municipality Finance Plc • Green Impact Report 2022 63/64
All information expressed in this document reflects the situation at the time of writing and may change without notice. MuniFin holds no obligation to update, modify or amend this publication. To the extent the material herein pertains to parties other than MuniFin, such information is based on material made available to MuniFin by third parties, and MuniFin does not make any representations or warranties as to the accuracy or completeness of such information. The material is informative in nature, and should not be interpreted as a recommendation to take, or not to take, any particular investment action. The material is intended for private use and may not be copied, in part or in whole, without written permission from MuniFin. This document or copies of it must not be distributed in the United States or to recipients who are citizens of the United States against restrictions stated in the United States legislation. Laws and regulations of other jurisdictions may also restrict the distribution of this document.
Municipality Finance plc
Jaakonkatu 3 A, P.O. Box 744
00101 Helsinki, Finland
Tel. +358 9 6803 5666
www.munifin.fi
info@munifin.fi
Disclaimer
Green Impact Report 2022 Municipality Finance Plc • Green Impact Report 2022 64/64
