
Research Article
Clinics of Oncology
ISSN: 2640-1037 Volume 6
The Prognostic Model of Differentiation-Related Lncrna Based on Bioinformatics Analysis
Can Better Predict the Survival of Patients with Gliomas
Chen D1, Wang F2, Gu S3, Yu S4, Hao Z5, Hu B1, Kuang L1, Zhao Y1, Ma X1, Yang Q1, He K1, Li Y1, Li J6, Wang G1* and Guo M1*
1Department of Neurosurgery, The Second Affiliated Hospital of Harbin Medical University, China
2China Pharmaceutical Enterprises Association, China
3Department of Neurosurgery, The First Hospital of Qiqihar, China
4Department of Pathology, The Second Affiliated Hospital of Harbin Medical University, China
5Department of Neurosurgery, The First Hospital of Suihua, China
6Department of Geriatrics, Harbin 242 Hospital, China
*Corresponding author:
Mian Guo and Guangzhi Wang, Department of Neurosurgery, The Second Affiliated Hospital of Harbin Medical University, 246 Xuefu Road, Nangang, Harbin 150086, Heilongjiang Province, China, Tel: 86-0451-86605608/ 86-0451-86297142; E-mail: guomian@hrbmu.edu.cn/ h04863@hrbmu.edu.cn
Keywords:
Glioma; Immune; TEM; Single-cell; DRlncRNA
Abbreviation:
Received: 20 Nov 2022
Accepted: 01 Dec 2022
Published: 10 Dec 2022
J Short Name: COO
Copyright:
©2022 Guo M, Wang G, This is an open access article distributed under the terms of the Creative Commons Attribution License, which permits unrestricted use, distribution, and build upon your work non-commercially.
Citation:
Guo M, Wang G. The Prognostic Model of Differentiation-Related Lncrna Based on Bioinformatics Analysis Can Better Predict the Survival of Patients with Gliomas. Clin Onco. 2022; 6(16): 1-14
TIME: tumor-immune microenvironment; DRlncRNAs: differentiation-related long non-coding RNAs; DRGs: Differentiation related genes; OS: overall survival; GBM: glioblastoma; LGG: low-grade Glioma; GSCs: glioma stem cells; lncRNAs: long non-coding RNAs; scRNA-seq: single-cell RNA sequencing; TCGA: the cancer genome atlas; CGGA:Chinese glioma genome atlas; tSNE: t-distributed stochastic neighbor embedding algorithm; PCs: principal components; TPM: the transcripts per million; RS: Risk score; PFS: progression-free survival; DCA: decision curve analysis; TME: Tumor Microenvironment; PCA: principal component analysis
1. Abstract
Differentiation status of glioma cells correlated with prognosis and Tumor-Immune Microenvironment (TIME) in patients with gliomas. This study aimed to identify differentiation-related long non-coding RNAs (DRlncRNAs) that can be used to predict the outcome and the response to immunotherapy in patients with gliomas. The single-cell transcriptomics analysis identified five differentiation states and their associated Differentiation Related Genes (DRGs) in glioma cells. Weighted correlation network analysis and univariate cox regression analysis were involved in obtaining the prognostic DRGs. Using co-expression analysis, we extract differentiation-related lncRNAs. We constructed the prognostic model based on DRlncRNAs by using univariate Cox regression analysis, least absolute shrinkage analysis, and selection operator analysis. A DRlncRNA signature composing of 13 genes was identified for predicting the survival of glioma patients, and a nomo-
gram model integrating the risk score and multi- clinicopathological factors was constructed. High-risk patients had shorter overall survivals and better responses to immune checkpoint blockages. We identified six candidate drugs by analyzing the differentially expressed genes in the low-risk and high-risk groups. In glioma patients, the risk score may not only help determine prognosis but may also assist in predicting immunotherapy response. By combining bulk RNA-seq data with DRlncRNA, we separated glioma patients into three clusters with distinct clinicopathological features. Three clusters identified distinct clinicopathological characteristics, TIME, immunogenomic patterns, and immunotherapy responses.
2. Introduction
Glioma is the most malignant brain tumor in the central nervous system. According to the World Health Organization (WHO), they are classified into four grades (I to IV) based on their pathological
clinicsofoncology.com 1
characteristics [1, 2]. Despite comprehensive treatments, including surgery and chemoradiotherapy, recurrences are high [3]. Glioma’s overall survival (OS) has not improved, and a 5‐year OS overall survival rate is less than 35%. Although numerous gene signatures have served as prognostic models, the accuracy and clinical application of these models remain to be improved [4-8].
Furthermore, the prognosis for patients with gliomas after surgical resection can be dismal when combined with radiotherapy and chemotherapy [9]. As a novel therapeutic strategy, More and more cancers are being treated with immunotherapy [10]. Clinical trials with gliomas, however, showed only a tiny number of productive immune responses due to a lack of precise selection of biomarkers [11]. Biological predictors are urgently needed to discriminate prognoses and immune responses among patients with gliomas. By determining Differentiation related genes (DRGs) involved in GSCs compared to astrocytes, new biomarkers and treatments for Glioma could be identified.
At the same time, long non-coding RNAs (lncRNAs) are transcripts with more than 200 nucleotides that do not code for proteins [12]. Up to 80% of the human transcriptome is composed of long non-coding RNAs [13]. Since lncRNAs regulate a wide range of processes, they are involved in the process of Tumorigenesis in a wide variety of diseases. It has also been reported that dysregulation of long non-coding RNAs contributes to glioma pathogenicity. Furthermore, lncRNA signatures have been reported to predict the survival of glioma patients [14]. It has been shown in Glioma that ferroptosis-related lncRNA signatures are associated with prognosis, tumor microenvironment, and response to radiotherapy [15]. The above studies have proved that lncRNAs are of great significance in differentiating tumors, occurrence, and development. Therefore, we hypothesized that differentiation-related lncRNAs (DRlncRNAs) have more important clinical significance. Currently, occasional papers have been published focusing on gene signatures for predicting prognosis and immunotherapy responses based on DRlncRNAs. It is possible to predict new drug candidates by comprehensively analyzing DRlncRNAs. In this study, we attended to explore the multiple differentiation states of glioma cells through analysis of single-cell RNA sequencing (scRNA-seq) of gliomas to obtain DRGs. Then, Differentiation related lncRNAs were obtained by co-expression analysis which can predict prognosis, immunotherapy response, and candidate targeted drugs combined with bulk RNA-seq data.
3. Methods
3.1. Acquisition of scRNA-seq Data and Bulk RNA-seq Data
The TCGA (https://portal.gdc.cancer.gov/), GEO (https://www. ncbi.nlm.nih. gov/geo/), and CGGA (Chinese Glioma Genome Atlas, http://cgga.org. cn/index.JSP) databases contain all the data supporting the findings of this study. SCRNA-seq data were obtained from the GSE103224 dataset in the GEO database, which
contained 23,793 glioma cells from eight patients [16]. First, we corrected the sample data with the” limma” package and extracted the intersection genes of the eight samples [17]. R software (version 4.1.3) was used to preprocess scRNA-seq data using the Seurat and Monocle packages [18]. PercentageFeatureSet was used to calculate mitochondrial gene content. Genes detected in < 3 cells were excluded and several genes< 50 and ≥ 5% mitochondrial expressed genes were excluded, after which 1394 cells were selected for further analysis. The top 1500 highly variable genes were found using the ‘vst’ selection method after the ScRNA-seq data were normalized using the ‘LogNormalize’ method. Bulk RNA-seq data of patients with GBM and Low-Grade Glioma (LGG) were acquired from TCGA (http://cancergenome.nih.gov/) database. GSE43378 data sets were obtained from the GEO database. CGGA325 and CGGA693 data sets were obtained from the CGGA database (http://cgga.org. cn/index.JSP).
3.2. Data Processing for scRNA-seq
First, the dimension of the glioma cells was reduced using PCA. We used the t-distributed stochastic neighbor embedding (tSNE) algorithm to cluster the top 15 principal components (PCs) with significant values [20]. In each cluster, gene markers with a log2 FC > 1 and p values adjusted to 0.05 were identified using the limma package. As part of this study, the ‘SingleR’ package was used to automatically annotate scRNA-seq data [21]. As a reference, the human primary cell atlas data included in ‘celldex’ were used [22]. Pseudotime and trajectory analysis. The ‘Monocle’ package was used to analyze pseudotime and trajectory data for astrocytes and tissue stem cells. Differentiation states of cells distributed in the same branch were considered the same. We defined DRGs as DEGs in cells with distinct differentiation states with |log2 (FC)| greater than 1 and p values adjusted by 0.05.
Extraction of differentiation genes. For normalization, the transcripts per million (TPM) values of glioma samples were transformed to log2-scale values and combined with transcriptional data from GSE43378 and CGGA325. After merging the data, the batch effects were corrected using R’s spa package. DRG expression patterns were extracted for analysis. First, WGCNA was used to identify the key module correlated with Differentiation. Subsequently, we performed differential expression analysis of the extracted key genes. Univariate cox regression analysis was carried out to screen out the genes involved in the key module with prognostic values using the ‘survival’ package, in which p<0.001 was considered statistically significant.
Co-expression analysis to extract differentiation-related lncRNAs. Firstly, the transcriptome data of the two (TCGA, CGGA693) were intersected to extract the expression levels of intersected genes. LncRNA was extracted using Perl language. Then, to get differentiation-related lncRNAs (DRlncRNAs), we performed a co-expression network, and it was visualized by (“graph”) packag-
clinicsofoncology.com 2 Volume 6 Issue 16 -2022 Research Article
es with corFilter=0.6 and pvalueFilter=0.001. Differential expression analysis was performed between tumor and normal samples and visualized by (“heatmap”) packages with logFCfilter=1 and fdrFilter=0.05.
Construction and validation of DRlncRNAs based prognostic model. To evaluate the prognostic value of the DRLncRNAs, Cox regression was used. The hazard ratio (HR), 95% confidence interval (CI), and P values of each variable are displayed on the forest map. Based on HR, we determined protective DRlncRNAs (HR < 1) and risk DRGlncRNAs (HR > 1). A Lasso regression model was constructed with the “glmnet” R package to screen optimal DRlncRNAs for prognosis. The optimal value of the penalty parameter (λ) was determined based on the results of 1000 cross-validation runs. The weighted regression coefficients and expression levels of prognostic DRlncRNAs were derived, and the following formula was used to calculate each patient’s risk score of survival: Risk score (RS) = ∑Ni−1Expi ∗ Coie . Patients with Glioma in the TCGA were divided into low- and high-risk groups based on their median risk score. Kaplan-Meier analysis was used to compare the survival times of the two groups. For comparing gene and risk score prediction accuracy, ROC analyses were performed using the “survival,” “survminer,” and “timeROC” packages. Statistical analysis of progression-free survival (PFS) was performed on the two groups to determine whether risk scores were related to PFS. By quantifying the net benefits along with the increase in threshold probabilities, a decision curve analysis (DCA) was carried out using the (“ggDCA”) package to determine the clinical benefit. With the “timeROC” package, we drew ROC curves separately for each dataset and compared them to the survival-related lncRNAs’ performance.
Validation of the Risk Score Model. The samples were randomly divided into the Train group and Test group at a ratio of 1:1 using the “caret” R package. They then used the Train group to construct a prognostic model and the Test group to perform internal Validation.
Univariate Cox and Multivariate Cox Regression Analysis. To assess whether risk score can be regarded as an independent predictor of overall survival of glioma patients, univariate Cox and multivariate Cox regression analyses were performed with a risk score, gender, age, and grade as variables using the R“survival” package.
Construction of nomogram. The nomogram was developed using the R packages rms and replot to combine risk score and clinicopathological factors. Predictions for survival at the time of 1-, 2and 3- years were accomplished. The nomogram’s accuracy was examined through calibration curves.
Principal Components Analysis. PCA was carried out with “R” to obtain the expression patterns of optimal immune-related lncRNAs in low-risk and high-risk groups.
Functional Annotation of DRGlncRNAs. GO biological processes and KEGG pathways with P < 0.05 were considered significantly enriched. The KEGG and ontology gene sets (c5.go.bp.v7.4.symbols.GMT, c2.cp.kegg.v7.4.symbols.GMT) used for GSVA were downloaded from GSEA database (https://www.gsea-msigdb.org/ gsea/index.jsp).
Immune correlation analysis between two groups. First, using the CIBERSORT algorithm, we predicted the relationship between risk scores and immune cells. Several packages such as “Limma,” “survival,” and “survminer” were used to determine the survival differences between high- and low-score patients with each type of immune cell. Then we used the “GSVA” R package for GSVA enrichment analysis to analyze the biological processes associated with immune cells or immune-related functional pathways. Infiltration scores of immune cells were calculated using single-sample GSEA (ssGSEA) of the “GSVA” R package using ssGSEA. Normalizing the ssGSEA score to a uniform distribution, the ssGSEA score is distributed between 0 and 1. In addition, the “limma” package in R was used to display differences in pathway activation between low-risk and high-risk groups.
Analysis of Differences in Tumor Microenvironment (TME) and Immune Checkpoint. ESTIMATE was designed to count scores for reflecting the infiltration levels of immune cells and stromal cells within the tumor microenvironment based on the specific genes’ expression level of immune and stromal cells using the R package “ESTIMATE”23. We used the ESTIMATE algorithm based on the expression level of each sample to count the immune score (positively reflecting the abundance of immune cells), stromal score (positively reflecting the abundance of stromal cells), and ESTIMATE score (positively reflecting nontumor composites). Then, we compared the differences in scores between the high and lowrisk groups and visualized them using the R package “ggpubr.” Immune checkpoints were identified as differentially expressed in high- and low-risk groups. We investigated the variations in expression between high-risk and low-risk groups and the disparities in survival between high-risk and low-risk groups having distinct immune pathways.
Prediction of candidate targeted drugs. This study aims to predict chemical compounds that could be used to treat patients who are in a high-risk group and a low-risk group. Based on the GDSC website, we calculated the IC50 values for the compounds (Dasatinib, Bexarotene, Cisplatin, Cytarabine, Sorafenib, and Pazopanib). Compounds that might be used as glioma therapy have been predicted using the “limma,” “pRRophetic,” “ggpub,” and “ggplot2” packages.
Classification for glioma patients based on risk DRlncRNAS. We used the DRGlncRNAs gene set described above for subtype glioma patients. Consistency analysis by using the ConsensusClusterPlus R package (v1.54.0),50 iterations with maxK = 9 were utilized for stable classification, and 80% of the total sample is
clinicsofoncology.com 3 Volume 6 Issue 16 -2022 Research Article
drawn 100 times, clusterAlg = “hc”, innerLinkage=’ward. D2’. Kaplan-Meier survival analysis of the different groups of samples from the TCGA dataset, comparison among different groups was made by log-rank test. HR (95%Cl), the median survival time (LT50) for different groups.
Meanwhile, the association between tumor subtypes and high-risk groups was also validated. The “Rtsne” and “ggplot2” packages were used to visualize data using principal component analysis (PCA) and stochastic neighbor embedding (t-SNE). PCA and t-SNE were conducted to evaluate the results of clustering. Cluster immune correlation analysis and prediction of candidate targeted drugs. We performed micro environment analysis, immune correlation analysis, immune checkpoint identification, and potential drug prediction for tumor subtypes based on the same method. The goal was to assess the predominance of tumor subtypes.
Statistical Analysis. R software (version 4.1.3) was used for statistical analysis and outcome display. For comparison between the two groups, we used the student’s t-test. Chi-square tests were used to contrast the classification variables in the training and testing tests. Using the Pearson correlation test, we evaluated the relationship between subtypes, clinicopathological factors, risk scores, immune check inhibitors, and levels of immune infiltration. Survival analysis was performed using the Kaplan–Meier method with a two-sided log-rank test. All p < 0.05 was considered to indicate significant, and * if p < 0.05, ** if p < 0.01, and *** if p < 0.001.
4. Results
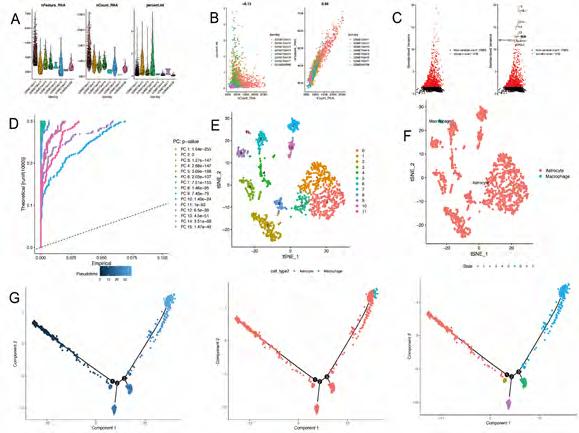
Quality control and filtration of scRNA-seq data. After quality control, filtration, and batch effect correction of the scRNA-seq data, a total of 1394 cells were obtained from the GSE103224 dataset (Figure 1A). The number of genes detected correlated significantly with sequencing depth (R = 0.94, Figure 1B). As shown in Figure 1C, 20480 genes were detected, and 1500 genes with high variability were identified.
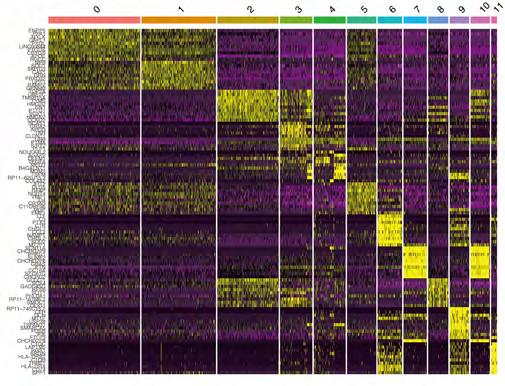
Clustering and differentiation trajectory analysis for glioma cells. We identified 15 PCs (principal components) that showed statistical significance for clustering analysis (Figure 1D). Using tSNE algorithm, 1394 cells were divided into 12 clusters, and the heatmap displays expression patterns of the top 10 differentially expressed marker genes in each cluster (Figure S1). According to marker genes, 12 clusters of cells were annotated with cell types (Figure 1E, F), in which cluster 11 was macrophages; the remaining clusters tended to be close to astrocytes. Pseudo-time and differentiation trajectory analyses were performed on 1375 astrocytes and stem cells, and five branches of differentiation patterns were identified. Figure 1G shows how cells in state 1 differentiated into other states after they were initially distributed in that state (Table 1).
To obtain differential genes associated with prognosis. A total of
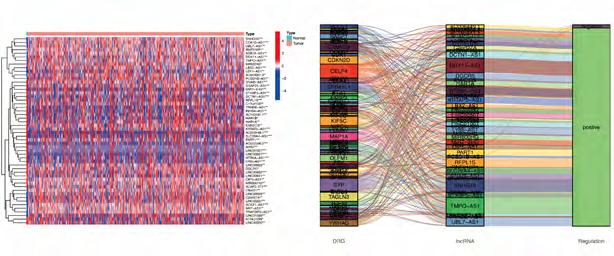
852 marker genes for five cell differentiation states were extracted from scRNA-seq database. Subsequently, we extracted the expression levels of 637 common marker genes from the three databases (TCGA, GEO, CGGA325). Through WGCNA (weighted correlation network analysis) integrating clinicopathological data and the expression profiles of common genes in the merged data, five modules were screened out with the optimal soft threshold=5 (Figure 2A-C), in which the MEbrown, MEgreen, MEblue, and MEyellow significantly correlated with the grade of tumors (Figure 2D). A total of 574 differentiation-related genes (DRGs) were selected to be enrolled in the differential expression analysis. Through differential expression analysis, we screened 105 differentially expressed DRGs (Figure 2E, F). 105 DRGs were enrolled in the univariate cox analysis. Afterward, 93 DRGs with prognostic values were identified. Subsequently, we extracted the expression levels of 92 DRGs from TCGA and CGGA693 intersection files (symbol. txt). Through co-expression analysis, we obtained 122 differentiation-related lncRNAs screened out (Figure 2G). Finally, through differential expression analysis, we obtained 69 differentiation-related lncRNAs (DRLncRNAs) (Figure 2H, I) (Figure S2).
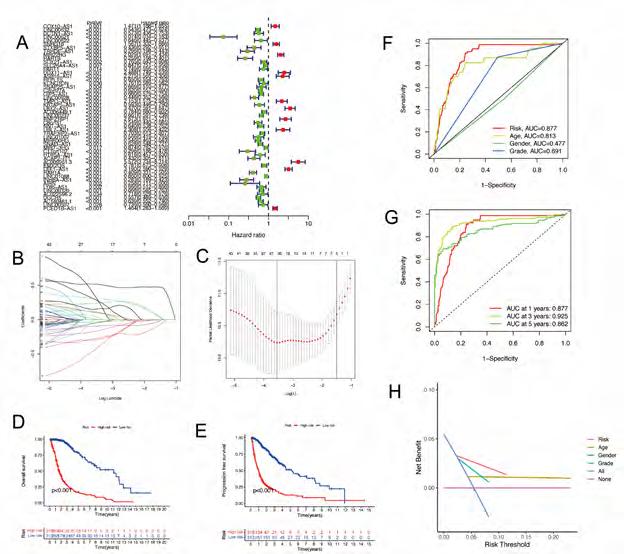
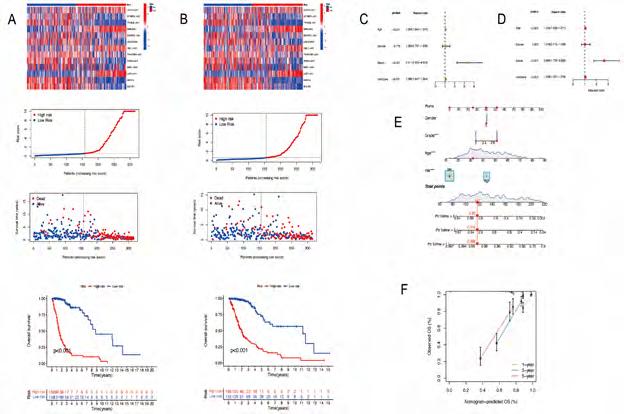
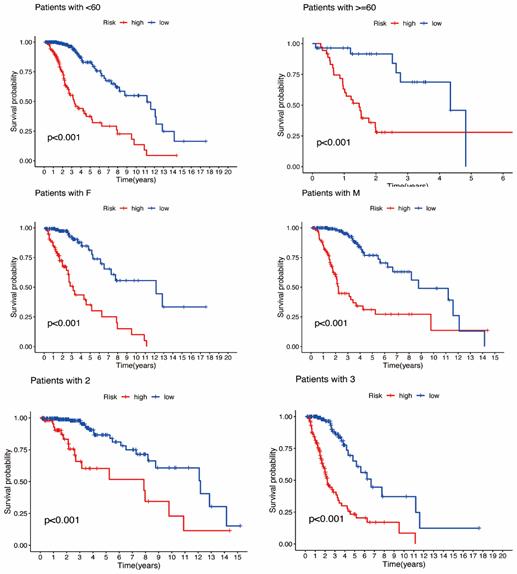
Construction and validation of prognostic model based on DRLncRNAs. Sixty-nine DRLncRNAs were included in the model construction. Based on univariate Cox regression analysis, 52 differentially expressed DRlncRNAs were related to increased risk; the result is shown in Figure 3A. Subsequently, differential DRlncRNAs heat maps and Sankey maps were constructed to observe DRlncRNAs expression differences and the regulatory relationship between differential DRlncRNAs and genes, as is shown in supplementary picture 2. Finally, a prognostic model consisting of 13 genes was constructed through the least absolute shrinkage and selection operator (LASSO) regression algorithm (Figure 3B, C). The 13 genes involved in the prognostic model with corresponding coefficients are listed in Table 2. Patients were divided into high-risk and low-risk groups with the median risk score cut-off. As shown in Figure 3D, the overall survival for patients in the low-risk group was significantly higher than those in the high-risk group either in the training or validation cohort (p < 0.001). In the same way, PFS also showed a better prognosis for the low-risk group than for the high-risk group (Figure 3E, p<0.001). To determine how the prognostic model performed in different subgroups with different clinicopathological features, patients were divided into a different age, grade, and gender subgroups. A similar result was obtained: patients in the low-risk group tended to survive longer than those in the high-risk group (Figure S3). The promising predictive value for the glioma special model in the whole set was demonstrated by ROC curve analysis (1-year AUC = 0.877, 2-year AUC = 0.925, 3-year AUC = 0.862) (Figure 3F, G). Finally, the DCA curve we constructed showed that the risk model had a good clinical performance (Figure 3H). As demonstrated in Figure 4A and B, the expression levels of COX10-AS1, STXBP5-AS1, MIR22HG, SNAP25-AS1, UBL7-AS1, MIR7-3HG, and LEF1-
clinicsofoncology.com 4 Volume 6 Issue 16 -2022 Research Article
AS1, increased with the increasing of the risk scores, indicating these genes acted as risk genes. TRHDE-AS1, LINC00928, TRAF3IP2-AS1, SNAI3-AS1, HAR1A, and DGCR5 as protective genes. Survival time and survival rate decreased as risk scores increased. Further examination was performed using univariate COX analysis (Figure 4C) and multivariate COX analysis (Figure 4D) to evaluate the accuracy of the independent prognostic signature. Both groups yielded similar results, suggesting that the prognostic signature was effective. For glioma patients at 1, 3, and 5 years, a nomogram incorporating age, gender, grade, and risk group was constructed (Figure 4E). A calibration curve for predicting overall survival at 1-year, 3-year, and 5-year intervals was close to the actual observed values (Figure 4F).
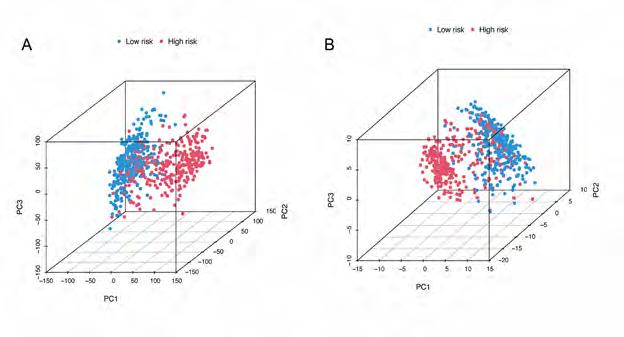
PCA Analysis. A total of 706 TCGA patients were included in PCA. Figure 5A shows the PCA results of all 17872 genes, and Figure 5A shows the PCA results of 13 DRlncRNAs. The high-risk and low-risk groups are represented by red and blue dots, respectively. TCGA dataset PCA analysis shows a significant difference between pre-corrected and post-corrected samples after RS clustering.
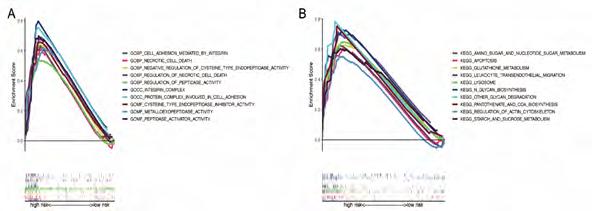
Functional annotation for thirteen risk genes. A GO enrichment analysis revealed that DRlncRNAs annotations are categorized into three parts: biological processes (BPs), cell compositions (CCs), and molecular functions (MFs). After screening, it was found that (P<0.001) and the DRlncRNAs were enriched in biological processes, such as cysteine type endopeptidase inhibitor activity, regulation of necrotic cell death, integrin-mediated regulation of cell adhesion, peptidase-related regulation, a protein complex involved in cell adhesion (Figure S4A). The KEGG analysis showed that the DRlncRNAs were mainly concentrated in the lysosome, metabolism of various sugars, regulation of actin cytoskeletons, and other signaling pathways (Figure S4B, P<0.001).
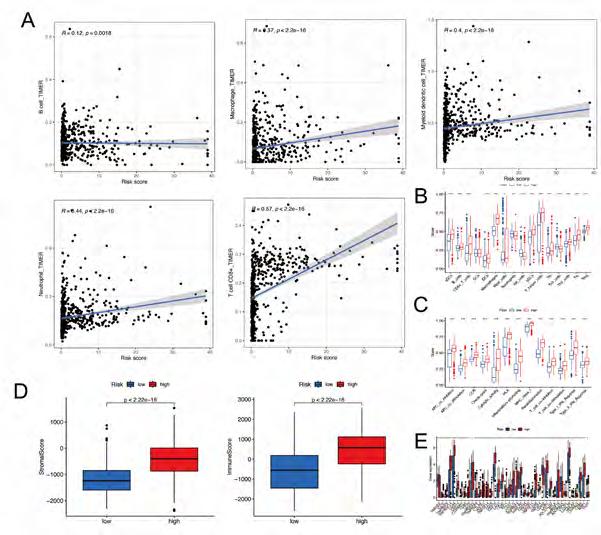
Assessment of immunotherapy response in high-risk and low-risk patients. To explore the immune correlates of risk scores, we explored and validated them by using TIMER. The results showed that a variety of immune cells were positively associated with a patient’s risk score,including B cell (R = 0.12, p = 0.0018), Macrophage (R = 0.37, p < 2.2e-16), Myeloid dendritic cell (R = 0.4, p < 2.2e-16), Neutrophil (R = 0.44, p < 2.2e-16), and T cell CD8+ (R = 0.57, p < 2.2e-16) (Figure 6A). A GSVA was conducted on a patient with glioma to investigate immune pathways and underlying mechanisms. It was found that 16 differentially enriched immune cells, including one immune cell, were unrelated to patient risk scores. In the low-risk group, three immune cells showed a higher degree of infiltration. In the high-risk group, 12 immune cells showed a higher degree of infiltration (Figure 6B). In addi-
tion, 13 immune functions were identified, including APC co-inhibition, APC co-stimulation, CCR, Checkpoint, Cytolytic activity, HLA, Inflammation promoting, MHC class I, Parainflammation, T cell co−inhibition, T cell co−stimulation, TypeI-IFN response, TypeII-IFN repose (Figure 6C). At the same time, based on the ESTIMATE algorithm, we calculated the score of TME 706 clinical samples. Then, we compared the differences in the score of TME between the high-risk score group and the low-risk score group. It was found that stromal cells and immune cells had a higher degree of infiltration in the high-risk group (Figure 6D). The differential analysis of immune gene checkpoints was performed using R software. A boxplot was created to visualize gene expression levels (Figure 6E).
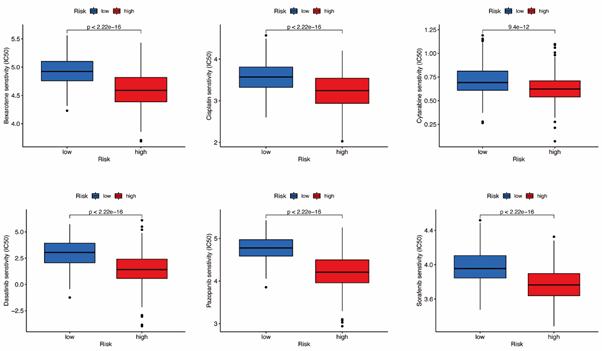
Prediction of Potential Chemical Drugs between two groups. According to the “prophetic” algorithm, we predicted the IC50 of 6 common chemotherapeutic agents (Dasatinib, Bexarotene, Cisplatin, Cytarabine, Sorafenib, and Pazopanib) in high- and low-risk patients. We found that these drugs all had higher IC50 in low-risk patients (Figure S5).
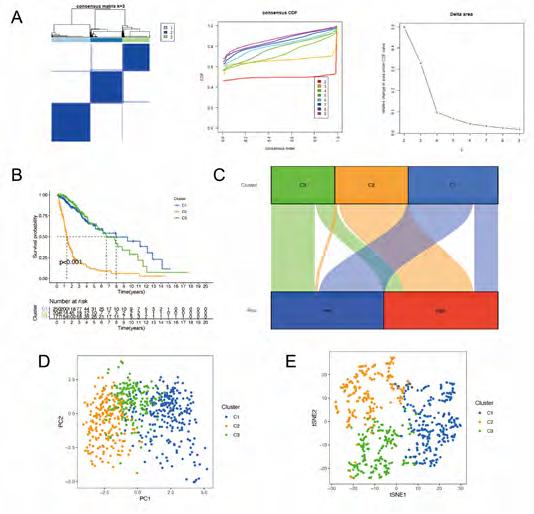
Classification for glioma patients based on DRGlncRNAs. Using 13 prognostic DRGlncRNAs as a marker, we examined the expression levels of each gene in the glioma subtype. All 706 samples in the TCGA cohort were subjected to a consensus clustering analysis. The tumor samples were divided into clusters via the “ConsensusClusterPlus” package. From 2 to 6, we increased the clustering variable (k). We found that k = 3 had the highest intragroup correlations and the lowest intergroup correlations (Figure 7A). The survival analysis revealed remarkable differences between the three subgroups, with Cluster 3 having a worse survival rate than Cluster 1 and 2 (Figure 7B). At the same time, we built a Sankey diagram for typing to check the corresponding relationship between typing and risk groups. The results are shown in Figure 7C. Principal component analysis (PCA) and stochastic neighbor embedding (t-SNE) revealed there were distinct features between the three clusters in each TCGA (Figure 7D, E) dataset.
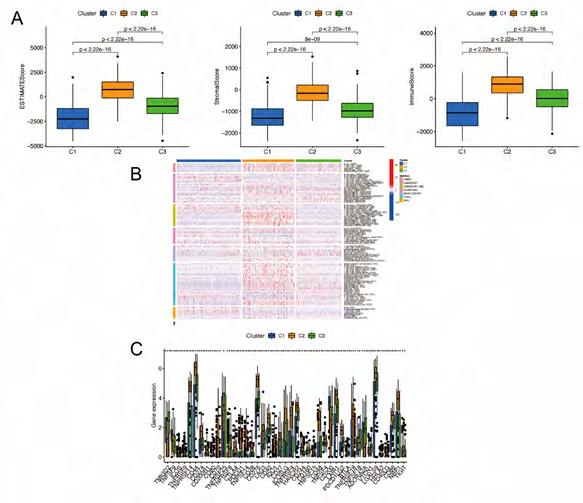
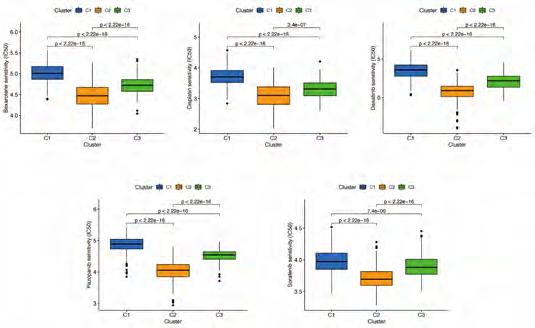
Cluster Immune Correlation Analysis and Drug Prediction. We used the same method to perform micro environment analysis, immune correlation analysis, immune checkpoint identification, and potential drug prediction for tumor subtypes. The results showed that stromal cells and immune cells had higher infiltration in Cluster3 (Figure 8A). We constructed an immune-related heat map showing more infiltration of immune cells at Cluster3 (Figure 8B). The result of Immune Gene Checkpoints is shown in (Figure 8C). Drug prediction showed that these drugs (Dasatinib, Bexarotene, Cisplatin, Sorafenib, and Pazopanib) all had lower IC50 in Cluster2; there was one fewer drug compared to the risk group (Figure S6).
clinicsofoncology.com 5 Volume 6 Issue 16 -2022 Research Article
Figure 1A-G: Analysis of single-cell RNA-seq data for clustering and differentiation trajectory analysis. (A) Result of quality control and fitration for the given scRNA-seq. (B) Sequencing depth and number of genes detected are correlated in this scatter plot. (C) Annotated scatter plot showing 1500 highly variable genes across all samples. (D) Fifteen PCs with significant differences were identified. (E) A scatter plot showing twelve clusters of cells processed by 15 PCs using the tSNE algorithm. (F) Annotated scatter plot showing the types of cells. (G) Identifying 5 distinct differentiation states and pseudotimes in astrocytes and tissue stem cells.
Table 1: Clinicopathological features of patients in GSE103224
clinicsofoncology.com 6 Volume 6 Issue 16 -2022 Research Article
scRNA-seq sample Age Gender Location Diagnosis IDH1 status GSM2758471 49 F Right frontal Grade IV mutant type GSM2758472 62 M Left temporal Grade IV Wild type GSM2758473 65 M Left temporal Grade IV Wild type GSM2758474 74 M Right frontal Grade IV Wild type GSM2758475 56 F Left temporal Grade III Wild type GSM2758476 63 F Left temporal Grade IV Wild type GSM2758477 50 M Left temporal Grade IV Wild type GSM2940098 59 M Right parietal Grade IV Wild type
id coef HR pvalue COX10-AS1 0.533651768 1.47061978 0.001131885 STXBP5-AS1 0.964861978 0.43569265 4.93E-05 TRHDE-AS1 -0.803268611 0.29635496 2.79E-09 MIR22HG 0.283548262 2.02868441 2.71E-14 SNAP25-AS1 0.294725436 0.6687852 0.003586426 LINC00928 -0.491126776 0.44593442 2.76E-11 UBL7-AS1 0.523850845 2.30760028 3.20E-05 TRAF3IP2-AS1 -0.157405032 0.70331726 5.61E-07 SNAI3-AS1 -0.261828936 0.62839269 3.80E-11 MIR7-3HG 0.198604498 0.87362279 0.016674466 LEF1-AS1 0.582578436 3.18981205 1.01E-27 HAR1A -0.459518509 0.40879419 1.42E-16 DGCR5 -0.144695864 0.55733476 2.95E-18
Table 2: Prognostic DRlncRNAs involved in our model.
Figure 2A-I: Differentiation related lncRNAs was extracted. (A-C) The optimal soft threshold = 5 was identified for five modules based on WGCNA. (D) Clinicopathological features correlated with modules. (E-F) Differentially expressed differentiation- related genes. (G) LncRNAs co-expressed with differentiated genes. (H-I) Differentially expressed differentiation- related lncRNAs.
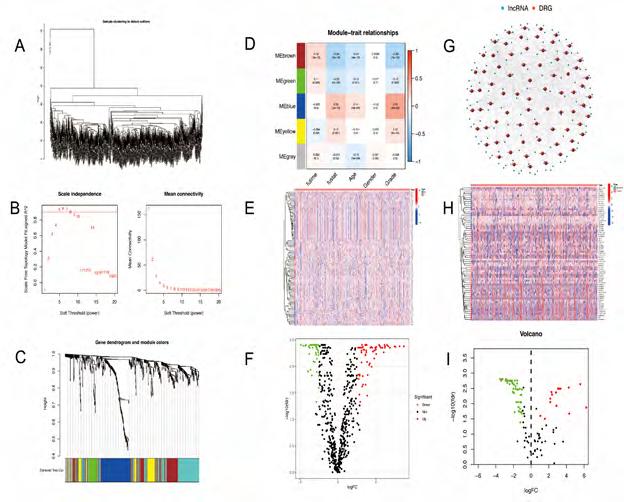
Figure 3A-H: The construction of a prognostic model based on DRlncRNAs. (A) DRlncRNA forest plot displaying the results of univariate Cox analyses. (B) LASSO coefficient profiles plotted against log(lambda) sequences. (C) Optimal parameter (lambda) selection in the LASSO model. (D) The Kaplan-Meier analysis of low-risk vs. high-risk groups. (E) PFS curves for glioma patients in the high−/low‐risk group. (F) DCA curves for glioma patients based on clinical information.
clinicsofoncology.com 7 Volume 6 Issue 16 -2022 Research Article
Figure 4A-F: Validation of differentiation-related lncRNAs prognosis signature. (A) The risk score and patients are distributed based on the risk score and the Kaplan-Meier analysis of low-risk vs. high-risk groups in the training group. (B) The risk score and patients are distributed based on the risk score and the Kaplan-Meier analysis of low-risk vs. high-risk groups in the text group. (C) univariate COX analysis. (D) multivariate COX analysis. (E)Nomograph plot of predicted 1-,3-and 5-year overall survival probability based on prognosis signature. (F) Calibration plots of the nomogram for predicting the probability of OS at 1, 3, and 5 years.
clinicsofoncology.com 8 Volume 6 Issue 16 -2022 Research Article
Figure 5A-B: PCA analysis of the samples in glioma dataset. The high-risk and low-risk groups are represented by red and blue dots, respectively. (A) PCA plot based on all genes of samples. (B) PCA plot based on 13 DRlncRNAs.
Figure 6A-E: Immune Correlation Analysis based on DRlncRNAs. (A) Various immune cells are involved in DRlncRNAs expression. (B-C) Immune-related cells and functions based on risk score. (D) stromal cells and immune cells had a higher degree of infiltration in the high-risk group. (E) Associated immune gene checkpoints.
Figure 7A-E: Classification for glioma patients based on DRlncRNAs. (A) The results of consensus clustering analysis for glioma patients based on DRlncRNAs. (B) Overall survival analysis between patients in the three clusters. (C) a Sankey diagram for typing to check the corresponding relationship between typing and risk groups. (D) PCA indicated that three subclasses were obtained in TCGA. (E) tSNE indicated that three subclasses were obtained in TCGA.
clinicsofoncology.com 9 Volume 6 Issue 16 -2022 Research Article
clinicsofoncology.com 10 Volume 6 Issue 16 -2022 Research Article
Figure 8A-C: Cluster Immune Correlation Analysis. (A) Stromal cells and immune cells had a higher degree of infiltration in Cluster3. (B) an immunerelated heat map shows more infiltration of immune cells at Cluster3. (C)The result of Immune Gene Checkpoints.
Figure S1: Heatmap showing the expression patterns of top 10 differentially expressed marker genes for each cluster.
clinicsofoncology.com 11 Volume 6 Issue 16 -2022 Research Article
Figure S2: Heat map and Sankey map of differentially expressed DRlncRNA.
Figure S3: Kaplan-Meier analysis between the low-risk and high-risk groups with different clinicopathological features.
Figure S4: Functional and enrichment pathways analysis.
We observed five distinct differentiation states in glioma tissues through RNA-seq analysis of single-cell RNA in GEO data. WGCNA was used to identify the key module correlated with survival and Differentiation. Univariate cox regression analysis was carried out to screen out the genes involved in the key module with prognostic values. Finally, DRlncRNAs were obtained by co-expression analysis. A prognostic model was developed to predict the prognosis of glioma patients using 13 DRlncRNAs. To facilitate clinical practice, we constructed a nomogram model integrating the risk group and the multi-clinicopathological factors. We identified six candidate targeted drugs through a comprehensive analysis of the DRlncRNAs between the low and high-risk groups. We divided glioma patients into three clusters with distinct clinicopathological characteristics using bulk RNA-seq data from the TCGA and CGGA databases.
With single-cell RNA-sequencing, the transcriptional characteristics of individual cells could be analyzed to study intratumoral heterogeneity [24]. This study used single-cell RNA-seq data representing high-grade gliomas (HGG). As previously reported, transformed cells in HGG resemble glia [25]. A rare subpopulation of GSCs was identified, allowing us to explore gliomas’ multiple differentiation states. Historically, gliomas have been considered a group of heterogeneous tumors originating from astrocytes and oligodendrocytes; based on the annotations of all the cells occurring in glioma tissues, we selected astrocytes and tissue stem cells for the differentiation trajectory analysis. We identified three clusters based on the expression patterns of DRlncRNAs in glioma patients. Cluster prognosis and immunotherapy response results indicate that subgroup classification based on differentiation-related lncRNAs can more accurately predict the prognosis of patients. An example would be the gliomas of patients in C2, which had
clinicsofoncology.com 12 Volume 6 Issue 16 -2022 Research Article
Figure S5: These drugs all had higher IC50 in low-risk patients.
Figure S6: Prediction of Potential Chemical Drugs. These drugs all had lower IC50 in Cluster2. 5. Discussion
a worse overall survival rate and a higher risk score. There has been evidence linking differentiation-related signaling pathways and transcriptional cascades to oncogenesis and progression of malignant tumors in previous studies. A differentiation therapy involves causing cancer cells to differentiate and become less malignant through transformative signaling events and identifying the treatment options for malignant brain and central nervous system tumors [31]. Significant [26] progress has been made in the field of differentiation therapy in gliomas. However, there is still a lack of understanding regarding the specific mechanisms and therapeutic targets involved in this disease [27, 28]. The purpose of this study was to identify DRlncRNAs with prognostic values and transcription factors that are associated with them so that we could identify promising candidates for differentiation therapy in the future. This study screened DRlncRNAs with prognostic values and the corresponding transcriptional factors to provide promising candidate targets for prospective differentiation therapy. GO enrichment analysis shows that the DRlncRNAs were enriched in biological processes, such as cysteine-type endopeptidase inhibitor activity, regulation of necrotic cell death, integrin-mediated regulation of cell adhesion, peptidase-related regulation, a protein complex involved in cell adhesion. These functions are essential in the development of tumor [29-31]. The KEGG analysis showed that the DRlncRNAs were mainly concentrated in the lysosome, metabolism of various sugars, regulation of actin cytoskeletons, and other signaling pathways. These pathways also play essential roles in the occurrence and development of glioma [32-34].
Nowadays, LncRNAs are gaining more attention from researchers. Multiple signaling and control functions have been proven to exist in LncRNAs, which may affect multiple aspects of tumor development. The upregulation of various lncRNAs by gliomas has been confirmed, and these lncRNAs contribute to the proliferation and invasion of glioma cells, such as CRNDE and H1935. Furthermore, some lncRNAs are downregulated in Glioma, which may possess similar properties to tumor suppressor genes and inhibit tumor cell proliferation, promoting apoptosis, such as WDR11 and MEG336,37.
In our study, our prognostic model also performed well in lowgrade gliomas, where we extended our research. Researchers found that patients with higher risk scores responded better to immune checkpoint blockade therapy than patients with lower risk scores based on an unsupervised subclass mapping analysis, implying that the risk score can also serve as an indicator of the response to immunotherapy. On the other hand, based on the DRlncRNAs, bioinformatics analysis revealed six candidate drugs with potential therapeutic efficacy for low and high-risk groups. With further subtype analysis, the number of drugs available is reduced by one. This indicates that the subtype classification based on differentiation-related lncRNAs is more accurate in clinical application.
The current study had some drawbacks. Firstly, single-cell RNAseq data for LGG patients are unavailable in the GEO database, so DRlncRNAs mainly originate from HGG scRNA-seq data. It remained unclear what mechanism DRlncRNAs play in gliomas. Lastly, further validation of our findings required molecular and cellular biological experiments.
6. Conclusion
In conclusion, we verified that DRlncRNAs play a significant role in the occurrence and development of Glioma. The results of these studies added some valuable guidance to understanding glioma pathogenesis and treatment, and these DRlncRNAs may be used as biomarkers and therapeutic targets for glioma prevention.
7. Funding
This study was supported by the National Natural Science Foundation of China (No. 82173384 and 81773161).
References
1. Jackson CM, Choi J, Lim M. Mechanisms of immunotherapy resistance: lessons from glioblastoma. Nat Immunol. 2019; 20: 1100-9.
2. Urso K, Fernández A, Velasco P, Cotrina J, de Andrés B, Sánchez-Gómez P, et al. NFATc3 controls tumour growth by regulating proliferation and migration of human astroglioma cells. Sci Rep-uk. 2019; 9: 9361.
3. Lim M, Xia Y, Bettegowda C, Weller M. Current state of immunotherapy for glioblastoma. Nat Rev Clin Oncol. 2018; 15: 422-42.
4. Wang Z, Guo X, Gao L, Wang Y, Ma W, Xing B, et al. Glioblastoma cell differentiation trajectory predicts the immunotherapy response and overall survival of patients. Aging Albany Ny. 2020; 12: 18297321.
5. Zheng J, Wang X, Qiu Y, Wang M, Yu H, Zhou Z, et al. Identification of Critical m6A RNA Methylation Regulators with Prognostic Value in Lower-Grade Glioma. Biomed Res Int. 2021; 2021: 9959212.
6. Bingxiang X, Panxing W, Lu F, Xiuyou Y, Chao D. A Prognostic Model for Brain Glioma Patients Based on 9 Signature Glycolytic Genes. Biomed Res Int. 2021; 2021: 6680066.
7. Maimaiti A, Wang X, Pei Y, Nuermaimaiti N, Tuersunniyazi A, Abula Y, et al. Identification and validation of a novel eight mutant-derived long non-coding RNAs signature as a prognostic biomarker for genome instability in low-grade glioma. Aging Albany Ny. 2021; 13: 15164-92.
8. Wang X, Peng W, Li C, Qin R, Zhong Z, Sun C. Identification of an immune-related signature indicating the dedifferentiation of thyroid cells. Cancer Cell Int. 2021; 21: 231.
9. Lang F, Liu Y, Chou FJ, Yang C. Genotoxic therapy and resistance mechanism in gliomas. Pharmacol Therapeut. 2021; 228: 107922.
10. McGranahan T, Therkelsen KE, Ahmad S, Nagpal S. Current State of Immunotherapy for Treatment of Glioblastoma. Curr Treat Option On. 2019; 20: 24.
clinicsofoncology.com 13 Volume 6 Issue 16 -2022 Research Article
11. Chiocca EA, Nassiri F, Wang J, Peruzzi P, Zadeh G. Viral and other therapies for recurrent glioblastoma: is a 24-month durable response unusual? Neuro-oncology. 2019; 21: 14-25.
12. Clark MB, Johnston RL, Inostroza-Ponta M, Fox AH, Fortini E, Moscato P, et al. Genome-wide analysis of long noncoding RNA stability. Genome Res. 2012; 22: 885-98.
13. Hong W, Liang L, Gu Y, Qi Z, Qiu H, Yang X, et al. Immune-Related lncRNA to Construct Novel Signature and Predict the Immune Landscape of Human Hepatocellular Carcinoma. Mol Ther - Nucleic Acids. 2020; 22: 937-47.
14. Luan F, Chen W, Chen M, Yan J, Chen H, Yu H, et al. An autophagy‐related long non‐coding RNA signature for glioma. Febs Open Bio. 2019; 9: 653–667.
15. Zheng J, Zhou Z, Qiu Y, Wang M, Yu H, Wu Z, et al. A Prognostic Ferroptosis-Related lncRNAs Signature Associated With Immune Landscape and Radiotherapy Response in Glioma. Frontiers Cell Dev Biology. 2021; 9: 675555.
16. Yuan J, et al. Single-cell transcriptome analysis of lineage diversity in high-grade glioma. Genome Med. 2018; 10: 57.
17. Ritchie ME, Levitin HM, Frattini V, Bush EC, Boyett DM, Samanamud J, et al. limma powers differential expression analyses for RNA-sequencing and microarray studies. Nucleic Acids Res 43, e47–e47 (2015).
18. Qiu X, Mao Q, Tang Y, Wang L, Chawla R, Pliner HA, et al. Reversed graph embedding resolves complex single-cell trajectories. Nat Methods. 2017; 14: 979-82.
19. Lall S, Sinha D, Bandyopadhyay S, Sengupta D. Structure-Aware Principal Component Analysis for Single-Cell RNA-seq Data. J Comput Biol. 2018; 25: 1365-73.
20. Satija R, Farrell JA, Gennert D, Schier AF, Regev A. Spatial reconstruction of single-cell gene expression data. Nat Biotechnol. 2015; 33: 495-502.
21. Aran D, Looney AP, Liu L, Wu E, Fong V, Hsu A, et al. Reference-based analysis of lung single-cell sequencing reveals a transitional profibrotic macrophage. Nat Immunol. 2019; 20: 163-72.
22. Baillie JK, H. An expression atlas of human primary cells: inference of gene function from coexpression networks. Genomics. 2013.
23. Yoshihara K, Shahmoradgoli M, Martínez E, Vegesna R, Kim H, Torres-Garcia W, et al. Inferring tumour purity and stromal and immune cell admixture from expression data. Nat Commun. 2013; 4: 2612.
24. Dagogo-Jack I, Shaw AT. Tumour heterogeneity and resistance to cancer therapies. Nat Rev Clin Oncol. 2018; 15: 81-94.
25. Verhaak RGW, Hoadley KA, Purdom E, Wang V, Qi Y, Wilkerson MD, et al. Integrated Genomic Analysis Identifies Clinically Relevant Subtypes of Glioblastoma Characterized by Abnormalities in PDGFRA, IDH1, EGFR, and NF1. Cancer Cell. 2010; 17: 98-110.
26. Zong H, Parada LF, Baker SJ. Cell of Origin for Malignant Gliomas and Its Implication in Therapeutic Development. Csh Perspect Biol. 2015; 7: a020610.
27. Zuccarini M, Giuliani P, Ziberi S, Carluccio M, Iorio PD, Caciagli F, et al. The Role of Wnt Signal in Glioblastoma Development and Progression: A Possible New Pharmacological Target for the Therapy of This Tumor. Genes-basel. 2018; 9: 105.
28. Zhu X, Zuo H, Maher BJ, Serwanski DR, LoTurco JJ, Lu QR, et al. Olig2-dependent developmental fate switch of NG2 cells. Development. 2012; 139: 2299–2307.
29. Xiao Y, Ma W, Hu W, Di Q, Zhao X, Ma X, et al. Ubiquitin‐specific peptidase 39 promotes human glioma cells migration and invasion by facilitating ADAM9 mRNA maturation. Mol Oncol. 2022; 16: 388-404.
30. Tian YH, Jia LW, Liu ZF, Chen YH. LINC01087 inhibits glioma cell proliferation and migration, and increases cell apoptosis via miR384/Bcl-2 axis. Aging Albany Ny. 2021; 13: 20808-19.
31. Chu YH, Liao WC, Ho YJ, Huang CH, Tseng TJ, Liu CH. Targeting Chondroitin Sulfate Reduces Invasiveness of Glioma Cells by Suppressing CD44 and Integrin β1 Expression. Cells. 2021; 10: 3594.
32. Lee S, Kang H, Shin E, Jeon J, Youn HS, Youn BH. BEX1 and BEX4 Induce GBM Progression through Regulation of Actin Polymerization and Activation of YAP/TAZ Signaling. Int J Mol Sci. 2021; 22: 9845.
33. Zhang Z, Li X, Yang F, Chen C, Liu P, Ren Y, et al. DHHC9-mediated GLUT1 S-palmitoylation promotes glioblastoma glycolysis and tumorigenesis. Nat Commun. 2021; 12: 5872.
34. Su W, Liao M, Tan H, Chen Y, Zhao R, Jin W, et al. Identification of autophagic target RAB13 with small‐molecule inhibitor in low‐grade glioma via integrated multi‐omics approaches coupled with virtual screening of traditional Chinese medicine databases. Cell Proliferat. 2021; 54: e13135.
35. Barsyte-Lovejoy D, Lau SK, Boutros PC, Khosravi F, Jurisica I, Andrulis IL, et al. The c-Myc Oncogene Directly Induces the H19 Noncoding RNA by Allele-Specific Binding to Potentiate Tumorigenesis. Cancer Res. 2006; 66: 5330-7.
36. Gong X, Huang M. Long non-coding RNA MEG3 promotes the proliferation of glioma cells through targeting Wnt/β-catenin signal pathway. Cancer Gene Ther. 2017; 24: 381-5.
37. Chernova OB, Hunyadi A, Malaj E, Pan H, Crooks C, Roe B, Cowell JK. A novel member of the WD-repeat gene family, WDR11, maps to the 10q26 region and is disrupted by a chromosome translocation in human glioblastoma cells. Oncogene. 2001; 20: 5378-92.
clinicsofoncology.com 14 Volume 6 Issue 16 -2022 Research Article