©IDOSR PUBLICATIONS
International Digital Organization for Scientific Research
ISSN: 2550-7931 IDOSR JOURNAL OF APPLIED SCIENCES 7(1) 29-40, 2022. Review of the Implications of Uploading Unverified Dataset in A Data Banking Site (Case Study of Kaggle)
Val Hyginus U. Eze1,2,Martin C. Eze1 , Chibuzo C. Ogbonna1 , Valentine S. Enyi1,SamuelA.Ugwu1,ChidinmaE.Eze3
1DepartmentofElectronicEngineering,UniversityofNigeria,Nsukka.
2DepartmentofComputerScience,FacultyofScience,UniversityofYaoundé1, Cameroon.
3DepartmentofEducationalFoundationandPlanning,UniversityofCalabar,Calabar, Nigeria.
ABSTRACT
This review paper comprehensively detailed the methodologies involved in data analysis and theevaluation steps. It showed that steps and phases are the two main methodological parameters to be considered during data assessment for data of high qualitiestobeobtainedItisreviewedfromthisresearchthatpoordataqualityisalways causedbyincompleteness,inconsistency,integrityandtime-relateddimensionsandthe four major factors that causes error in a dataset are duplication, commutative entries, incorrect values and black entries which always leads to catastrophe. This paper also reviewed the types of datasets, adopted techniques to ensure good data quality, types of data measurement and its classifications.Furthermore, the Kaggle site was used as a case study to show the trend of data growth and its consequences to the world and the data bankers. It is then deduced that low data quality which is caused as a result of errorsduringprimarydatamining andentries leadsto wrongresults whichbringabout the wrong conclusions. It was advised that critical data quality measures should be adopted by the data bankers such as Kaggle before uploading the data into their site to avoid catastrophe and harm to humansFinally, the outlined solutions as reviewed in this paper will serve as a guide to data bankers and miners to obtain data of high quality,fitforuseanddevoidofadefect.
Keywords:Accuracy,DataBank,DataQuality,Dataset,Defect,fitforuse,Kaggle
INTRODUCTION
The rapid growth of big data attracted the attention of world researchers towards accessing the quality of the data to be used by an organisation inorder to make it fit for a particular purpose[1]. However, with the upswing of technologies such as cloud computing, the internetand social media, the amount of generated data is increasing exponentially[2]. The enormous amount of data available in many forms and types forces organizations to come up with innovative ideas to fine-tune data inorder to maintain quality[3]. From research, it was found out that data are classified based on their structures. Data with less quality are mainly obtained in Unstructured data from multiple sources which makes data quality management complex. Some causes of poor data qualityarecarelessness in data entry, unverified external web data sources,
system errors and poor data migration processes. The increase in the amount of data being used by organizations, stored in data banks and mined for competitiveuseoverthelastdecadesled to a research shift from data mining to data quality maintenance and integrity in order to make it fit for use [4][5]. The challenge forquality and quantityis increasing daily as researchers are always in need of it for a betteroutput. High-quality data is a prerequisite for worldwide research harmonization, global spend analysis and integrated service management in compliance with regulatory and legal requirements [6][7]. The level of poor-quality data being uploaded in some data mining sites has awakened the spirit of researchersin refiningthequalityofthedataforbetter results However,theuseofpoor-quality dataisso catastropheand leads to inaccurate results, inefficiency, risk
www.idosr.org
mitigation and wrong decisions making[8].
Data Quality
Dataset involves the collection of related data items that may be accessed individually or in combination or managed as a whole entity. A databasecan be structured to contain various information about a particular category of relevant to the data researcher. A database can also be considered asa datasetas some entities within it are related to a particular type of information[9][10][11][12]. Data quality is the high-quality information
Ezeetal
thatis fitforuse. They aresaidto be fit for use when they are free of defects and possess the features needed to guide the user in making the right decision.It can also be expressed as the discrepancy between the way data were viewed when presented as a piece of information in a system and itsappearance in real-life scenarios.Hence, data quality can be generally expressed as the set of data that is fit for use and free from defects.For data to be certified fit for use and free from defectsit must be characterized and examined under the dataqualitydimension.
Factors that Determinesthe Data Quality
The key major factors of data quality dimensionsthatdeterminethefitnessof data to be used are; data accuracy, data
completeness, data consistency and time-relateddimensions[13].
Data Accuracy
Accuracy is one of the data quality dimensionsthat is widely used to ascertain the fitness of data for use. Accuracyistheclosenessofadatavalue and its real-lifevalue (real-world object)which the data aims to represent.Data accuracy can be classifiedas eithersyntacticaccuracyor semanticaccuracy.
Syntactic accuracy is the closeness of a data value to the elements of the corresponding definition domain. In syntactic accuracy, a data value is not compared to the real-world
object that it aims to represent rather it focuses on checking the correspondence of a data value with respect to any value in the domain that defines the data value
Semantic accuracy is the closeness of a data value and the real-worldobjectwhichitaimsto represent. In order to be able to measure semantic accuracy, the true value of the real-world object must be known for comparison[14].
Data Completeness
Completeness is the extent to which dataareofsufficientbreadth,depthand scopeforthetaskthatismeanttosolve. It isclassified into schema completeness, population completeness andcolumncompleteness[15].
Schema completeness is the degree to which concepts and their properties are not missing fromadataschema.
Population completeness evaluates missing values withrespect to a reference population.
Column completeness is defined as a measure of the missing values for a specific property or columninadataset.
When it is important to know why a value is missing and also to know when a value is represented with NAN or NA In measuring the completeness of a table, it is important to note the difference between null values and incompleteness,NANandNA.
A value is said to null value when it possesseseitherofthesecharacteristics:
The value is not existing (does not contribute to incompleteness)
The value is existing but not known (contributes to incompleteness)
Itisnotknown whetherthevalue exists(mayormaynotcontribute tocompleteness)
www.idosr.org
From this, it can be concluded that incompleteness (missing value) can be detected but incompleteness cannot be certainly solved accurately unless the
Ezeetal
data miner is present to ascertain which type of error existed in that dataset or theoriginaldatasheetisavailable.
Data Consistency
Data consistency involves semantic rule violation which is expressed as the integrityconstraints of dataset properties that must be satisfied for effective performance.There are two fundamental categories of integrity constraints known as intra and interrelationconstraints.
Intra-relationconstraintsdefinea range of admissible values for an
attribute where such contrary values do not exist in that contest. For example, a negative age in a database represents a person.
Inter-relation constraints involve attributes from other relational databases.For example,an individual of different ages is identifiedintwodatabases.
Time-Related Dimensions of Data
Data qualitycan be characterized by the ability of the dataset to maintain its quality after some years of metamorphosis and also how current it is up to date. Most research recognizes three closely related time dimensions such as currency, volatility and timeliness. The three time-related dimensions and their relationship based
on their characteristics are expressed as tohow often the database was updated or the time between receiving a data unit and the delivery of the data unit to acustomer.
Therelationshipbetweenthethreetimerelated dimensions is mathematically expressedasinequation(1).
Timeless=max (1)
Data Dimension Measurements
Data Dimension Measurement (DDM) is one of the important criteria to be considered in validating the quality of data. To design the right metrics to be adopted in measuring data quality is one of the most challenging tasks of data quality assessment as it shouldidentify all errorswithout
reflecting or repeating the same errors multiple times [16]. The simplest metrics used in obtaining the value of objective measures which is expressed as the ratio of the error line to the total lines of the dataset as shown in equation(2).
Ratio= (2)
However, the calculation of such ratios is only possible when there are clear rules on when an outcome is desirable or undesirable which forms the basic foundation for a good outcome[15]It is imperative to note that most methods provide only objective measures for assessing data quality dimensions
without recognizing the importance of the distinction between subjective and objective measures and the comparison between themwhich forms the basic input for the identification of data quality problems. Table 1 showed the differences between objective and subjectivemeasures
Types of Datasets
The supreme objective of any Data Quality analyst is to analyse and evaluate the quality of data in useaccurately, to ensure that it is fit for use and devoid of a defect. The concept of data itself involves a digital representation of real-world objects that can be later processed and manipulated by software procedures through a network. Data analysis is the process of combining extracted information and data mining techniques to achieve higher quality. Information extraction is a process of populating a database fromunstructured or loosely structured text. Data mining techniques are being applied to discover patterns that can be laterassessedforbetterresults. Inthefieldofinformationsystems,data arebeinggroupedasfollow: Structured Unstructured Semi-structured. In the field of statistics, data are alsobeinggroupedas: Categorical Numerical Ordinal.
Categorical or Structured Data
This is also called structured data in information science which is expressed asa group of item(s)with its simple attributes defined within a domain. A Domain is the type of value that can be assignedto an attribute. Structured data is categorically referred to as corresponding programming language data types such as Integer (whole numbers), Boolean (true/false), String (sequence of characters). Moreover, in statistics it is called Categorical datawhich represents some data characteristics such as a person‟s sex, marital status, age etc. Categorical data can also use numerical values to represent strings such as 1to represent true and 0 to represent false.The assigned values have no analytical values as they cannot be added or subtractedtogether[17][18].
Numerical or Unstructured data
Unstructured data are ungrouped and non-tabulated sets of data presented in a well acceptable language such as news articles, web pages, blogs, e-mails, etc. Unstructureddatacouldnotonlybetext
but also images, audio and video clips. A huge amount of unstructured data is easilyobtainedandalsoavailable onthe internet nowadays in which there is a need to analyse and process such data for future use. The accuracy of structured data is dependent on the final user as the accuracy of structured data will be higher when a final consumer is a machine than when it is human. Information extraction consists of five substantialsub-tasks as segmentation, classification, association, normalization, and reduplication and in statistics,this is calledNumerical data. These data have the meaning as a measurement such as height, weight, IQ, blood pressure. Statisticians also call numerical data quantitative data and it is also divided into discrete and continuousnumericaldata
a. Discrete data represent items that can be counted and also take a possible value that can be listed out. The list of possiblevaluesmaybefixed(finite) b. Continuous data represent measurements whose possible values cannot be counted and can only be described using intervals on the real number line.For example, the exact amount of gas purchased at the pump for cars with 10 litres tanks would be continuousdatafrom0litresto10litres whichcanberepresentedbytheinterval [0,20][19]
Ordinal or Semi-Structured data
This is called semi-structured data in information science and it is expressed as flexiblystructured data with a semisimilar characteristic in comparison with traditional structured data It is expressed to be flexible due to its inabilitytoadopttheformalstructureof data models associated with relational databases or data tables. Ordinaldata statistically mixes both numerical and categorical data together. The data fall into categories, but the numbers placed on the categories have meaning. For example, grading students in an exam onascalefromlowest(0)tohighest(70) scores gives ordinal data. Ordinal data are often treated as categorical, where thegroupsareorderedwhengraphsand charts are made. For example, if you
www.idosr.org
survey 100 people and ask them to rate anexamonascalefrom0-70,takingthe average of the 100 responses will have meaningbutvaries with categorical data[18]
Types of Data Measurement Scale
There are two major data measurement scales used in measuring the accuracy of calibrated data measuring instruments. The two most popular data measurement scales are ratio and intervalscales.
Interval scales are numerical scale that is used to indicate the space or difference between two variables/values. It is so important as the realm of statistical analysis on the datasets are open for measurement and analysis.Forexample,a central tendency can be used to measure mode, mean, median and standard deviation. The drawbackof this is that itdoes not have atruezero.
Ratio scale is an ultimate nirvana when it comes to data measurement scales because it gives detailed information about the order and exact unit values and also has absolute zero which gives it an edge for measuring a very wide range of values of descriptive and inferentialstatistics[20]
Classification of Data
Data classification involves the methods and patterns at which data were collected and organized for use. Data can be broadly classified based on where and how they are gotten(sourced) which are; primary and secondary data sources.
1.Primary Data:A directly sourced data that has not been altered, refined or published isknown as primary data.Primary data could be sourced from experiments, one on one interviews, questionnaires etc An example of such isdata obtained from renewable energy research on the effect of dust in the solar photovoltaic panel that was performed practically and data collectedbytheresearcher
2. Secondary data:Secondhand information or refined or altered data collected and recorded for future use is known as secondarydata It can also be a piece of firsthand information that was recorded by the researcher for future use by other researchers. These
Ezeetalsecondary data sources are found in some software applications/sites such as Jamia, Alibaba, jigjig andKaggle. The ownerofsuchdatamighthaverefinedit to suit his purpose and finally lunch it for researchersto consult for information with respect to their researcharea.
The problem of secondary data which is refiningandfineturningofdatasets has caused more harm than good in the research field. The refined data causes problems as the refiner will not categoricallystatewhathasbeenrefined so that the user will be aware that some of the inbuilt microns of that datahave been altered. This data might be used for research purposes even without rugged analysis since the secondary userlacks the knowledge ofwherethese data was sourced from and the authenticity of it but relies on the description of the publisher. In some cases, some values/data uploaded can be autogenerated and were prone to errors and manipulations.This has made secondary data highly unreliable yet doesn‟t discredit the use of secondary data as it has merits of easier access, aids in making research faster and it is generally cheaper thana primary source ofdata.
Data Quality Assessment Configurations
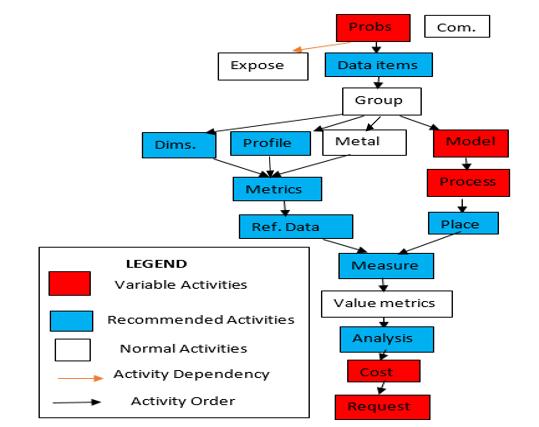
There have been difficulties in ascertaining the best data quality configurations to be adopted during the data processing.Some researchers proposed a dynamic configurational data quality assessment type whose input configuration is generic data containingcriticalactivities Thisgeneric assessment technique was formulated by harnessing and grouping activities from selected data quality assessment methodologies.The order and dependencies between activities were defined based on the input and the output of the specific activities.Generic data quality process and configuration methods were defined to have the followingcharacteristics:
1 Determining the aim of the assessment and requirements related to the data quality assessment. The assessment status of the accessed processes is so important to be stated
www.idosr.org
by the data quality assessors to guide users on how, when and where a particular method should be usedfor fitness.
2.Select the activities from the generic process model that contribute to the assessmentaimandrequirements
Ezeetal
3.Configure and arrange activities in a sensible order and include activity dependencies. Figure 1showedthegenericdataquality assessment processes adopted by different data quality assessors to ensure that the data in use is fit for the purpose.
Comparative Analysis of Data Quality Assessment Methodologies
Figure 1: A generic data quality assessment process
This section of the research paper reviewed a comparative analysis of data quality assessmenttechniquesthat existed as of the time of this compilation with the aim of identifying critical activities in dataquality.The thirteen existingdataquality assessment and improvement methods based on steps, strategies, techniques, dimensionsandtypesofinformationare asshownbelow:
The methodological phases and steps
Thestrategiesandtechniques
The data quality dimensions and metrics
Thetypesofdatainuse
Thetypesofinformationsystems inuse[21].
The methodology comparison measured on phases and steps is of utmost interestinacomprehensivereviewofthe existing methods as phases and stepswere so important in ascertaining data quality.Table 2 showed the most effective and organised steps recognized in data quality assessment processes. The table further analysed data based on sources and related problems associated with each method used indata sourcing. There are set up rules used by schemas to examine and interview clients in order to improve performance and achieve a complete understanding of data and its related architectural management. The following steps are incorporated in order to obtain effective and reliable data. Important steps to be adopted for
www.idosr.org Ezeetal
better quality data output to be achievedareasoutlinedbelow:
1. Data quality requirement analysis:This is a technique where the opinion of data users and administrators are surveyed and sampled to identify data quality issues andsetnewqualitytargets.
2. Identification of critical areas:This involves the identifications of the relevant areas and the sequence of data
Table
flow in a database for easy location and access.
3.Process modelling:This is the process of validating and updating produced dataforfitness
4. Measurement of quality:This involvestheuseofdifferentdataquality dimensions, the problems associated with each dimension quality and the definitionofthedimensional metricsto be used.
2 Comparison of Methodologies and their Assessment steps
Step/meth acronym Data analysis DQ requirement analysis
Identification of critical areas
Process modelling Measurement ofquality Extensible to other dimensionsand matrices
TDQM + + + + Fixed DWQ + + + + Open TIQM + + + + + Fixed AIMQ + + + Fixed CIHI + + Fixed DQA + + + Open IQM + + Open ISTAT + + Fixed AMEQ + + + + Open COLDQ + + + + + Fixed DaQuinCIS + + + + Open QAFD + + + + Fixed CDQ + + + + + Open
From this comprehensive review of methodologies, it was observed that no method is the best or superior to others for data quality assessment but there are steps and phases to combine or followtoobtainaveryhighoutput.
Causes
of Error in Dataset
The causes of error in a dataset that always leads to low data quality are as detailedbelow:
Commutative entries: Thisisacommon issue where values are wrongly placed inanattributethatwasnotmeantforit.
It is a fake entry that might be as a resultofomissionorsourcingdatafrom a means that are not fit for its purpose and to detect such error is very difficult especiallyincumbersomedata.
Incorrect values: This involves entering values either out of range or incorrectly whichcan cause grave errors in calculation. For instance, using numeric values for numeric attributes,
„O‟ instead of 0 in digits [22] with the humaneye,itwillbedifficulttodetect. Blank entries: This is mostly found in structured CSV/excel and Relational databases For example, age in some cases, can‟t be a primary key, and as such blank space can be permitted. This is not appropriate especially when the researcher or user needs accurate age for research work. Every missing or blank space in a dataset is necessary to be filled with a value that will not change/negate the quality and characteristicsofthatdataset.
Duplication: This can be seen in some data entries where a row or column entry was duplicated once or more. It mainly occurs where data are automatically generated and leads to falseoutcomes.
Causes of Low Data Quality
Inconsistency:This involves semantic rule violation which is expressed as the
www.idosr.org
integrity constraints of a dataset property that must be satisfied for effectiveperformance.
Incompleteness:This is the extent to which data are insufficient in breadth, depth and scope for the task that is meanttosolve.
Inaccuracy:The rate of variance of the closenessofadatavalueanditsreal-life value (real-world object) which the data aimstorepresent.
Duplication: This occurs when thesame data with the same characteristics are being enteredonce or more in a row or column.
Blank Entries: This is a process where a column or row is total empty where thereisacertaintyofhavingavalue.
Incorrect values: This involves using a wrongsymbolthatresemblesinplaceof anothercorrectone.
Commutative Entries: Thisisacommon issue where values are wrongly placed inanattributethatwasnotmeantforit Furthermore, many data bankers like Kaggle, Jumia, Konga etc should be cognizant of these aforementioned causes and characteristics of poor data qualityandensurethatdatauploadedin their sites should be devoid of such casualty.
Kaggle Data Site
Kaggle is an online data science community where passionate data science researcherslearn and exchange ideas [23]. Kaggle webpage can be accessed via https://www.kaggle.com/ Most researchers more especially data scientistsfindtheKagglesiteveryuseful for data sourcing even though it has it's own proneandcons[24][25].Sinceitisa community, it encourages sharing datasets publicly among users. Datasets can also be private which enables the user to use them privately. It can be shared personallywith another user alongside its security key. There are stipulated guidelines on how to create datasets, rate datasets, ask for collaboration and in general how to use these datasets [26]. Datasets in Kaggle appears on different data formats, depending on which format the users deem fit to use. These formats range from CSV, JSON, xlsx, Archives to BigQuery,withCSVasthemostavailable andused format.The challenge of being
Ezeetal
unabletocheckandascertainthedegree of the data correctness, completeness, integrity and accuracy together with the quality of data to be uploaded in the Kagglesiteeven though the data owners have a descriptive space where to write a brief detail of the uploaded data has caused the major concern. This is so because many of the data uploaded in the site were refined and altered by the data miner without stating exactly what was altered and why it was refined in thedescriptionspace
Kaggle Data Qualities
Kaggle is a worldwide site where huge and bulk data were obtained for scientific and machine learningresearch purposes. For this site to attract more customersandresearcherstobevisiting and always confide on the uploaded datainthesitecertainqualityassurance will be needed by the site users such as the quality of data to be uploaded and the sources of the data. However, because of the popularity of the Kaggle site, several data are being uploaded without proper debugging and cleaning which degrades the quality of data on the site. This aforementioned drawback led to ongoing data quality research on Kaggle and other data banking sites
Data quality can generally be expressed as a data‟s fitness for use and also its abilitytomeetupthepurposesetbythe data user. This definition simply showedthatthe qualityofdatais highly dependent on the context of the data userinsynergywiththecustomerneeds, ability to use and ability to access data at the right time and at the right location However,the data quality assessment and improvement processare not limited to the primary data miners only but also to the data users and other data stakeholders that are involved during data entry, data processinganddataanalysis[27].Unlike the conventional method of data division and analysis where synergies and coherency among the data managers were not inculcated and the bridge between them seriously affects the quality of uploaded data. In Kaggle data quality is divided into four subgroups known as data quality for a website, data quality for decision support, data quality assessment and
www.idosr.org
other data quality applications such as medical data quality and software developmentprocessesforengineers. Furthermore, the study has proofed that data quality assurance is the major problem ofthe Kaggle site. Many researchers have studied the data‟s in Kaggleanddiscovered thatatfirst when data were not as huge as in Tera Bytes the challenges was limited to completeness and accuracy.However, as data began to grow in size and quantity the research and challenges which is peculiar to the field of study and researcharea shiftedfromtwo tofive in the field of data management and otherswhichare completeness, correctness, consistency, plausibility, and currency. Therefore, accuracy, completeness and consistency mostly affect the capacity of data to support researchconclusionsandtherefore form the most important area of research in thedataminingsector[28]
Trends and Importance of Data Quality Assurance in Kaggle
There have been numerous attempts to summarize the research on data quality trends in Kagglebased on the best methodology to adopt in examining the quality of data but all to no avail Then, after the industrial revolution, the amount of information dominated by characters doubled every ten years. After 1970, the amount of information doubled every three years. Today, the global amount of information can be doubled every two years. In 2011, the amount of global data created and copied reached 1.8 ZB. It is difficult to collect, clean, integrate, and finally obtain the necessary high-quality data within a reasonable time frame because of the proportion of the high unstructureddata in abig dataset which takesalotoftimetobetransformedinto a structured type of dataset and further processed This is a great challenge to the existing techniques of data quality processingandmanagement[29]
The first seminar data quality research topic was introduced by [30]in the year 1995. Sincethen, comprehensive research was going on to summarize, classify, and develop frameworks for Data Quality research[31][32][33] In [30] a framework of data quality from a
Ezeetal
comprehensive analysis of publications from 1994-1995 was proposed. The authors compared data and data quality to be a manufactured physical product and its quality and relates it to managing data quality from established concepts to managing the quality of physical products. Moreover, research was still ongoing as the quantity of data in Kaggle kept on growing every minute of the day which lead to a summary of data quality research using articles published between 1995 and 2005[31].
However,fromreviewedKaggledataand others, relationships werederived based on the judgment and intuition of the researchers‟ present conceptual assessment of data quality and its management forexcellent results. According to[34], data quality research can be classified categorically based on assessment, management, and contextual aspects of data quality. Data quality as a novel framework that combined the factors of fitness for useas defined in [35] and with the incorporation of management elements as defined in[30] is comprehensively reviewed in [32] Furthermore, many topics on methods to categorize data quality research and to develop a framework that allows researchers to characterize their research was also reviewed on[33]and it showed different taxonomy and methods at which data can be examined for quality assurance In summary, as stated earlier, the data quality research in Kaggle has grown to a critical juncture that has attracted the interest of researchers and the world at large From 1907 to 2010, data quality wasconsideredsomewhatanecdotaland esoteric. But as of 2021, it is considered valuable and relevant because of the importance of datato researchers, data scientists and the world at large. Due to the tremendous upload of data and bigdata in Kaggle, the research area has witnessed extraordinary growth in thelast five years and as a result of that Kaggle site serves as one of the best data banks for researchers.Many data bankerslikeKaggle,Jumia,jigjigetcwill benefit so much from this review paper as it will help them in configuring data tobeuploadedtotheirsitebasedonthe
www.idosr.org
reviewed methodologies for high output tobeachieved.
CONCLUSION
This review showed the different methods and techniques that can be adopted by researchers to ensure that data of high quality is obtained. It also detailed the types of data, data quality assurance, causes of poor data quality and the consequences. It showed the different domains at which data exists and also extensively detailed the types and classes of datasets that exist and their importance to data users. Kaggle data site was used as a case study in
this review paper and it detailly reviewedthe different errors encountered by Kaggle and highlighted thecauses ofit. This reviewwillserve as a guide to data scientists, primary data miners and data bankers on the best ways to handle their data to be devoid of defect, error and also to make it fit for use at all times. Finally, this paper will assist data bankers in checking for quality of data, data quality assurance and the authenticity of the data from the primary miners before uploading it into their sites to avoid misleading researchers or data users.
REFERENCES
[1] “Abbasi, A., Sarker, S., & Chiang, R. H. L. (2016). Big Data Research in Information Systems: Toward an Inclusive Research Agenda. Journal of the Association for InformationSystems,17(2),1-33.
[2] “Cai, L., & Zhu, Y. (2015). The Challenges of Data Quality and Data Quality Assessment in the BigDataEra.DataScienceJournal, 14(0),2.
[3] “Albala, M. (2011). Making Sense of Big Data in the Petabyte Age. Cognizant 20-20 Insights Executive Summary,” p. 2011, 2011.
[4] “Cappiello, C., Francalanci, C., & Pernici, B. (2004). Data quality assessment from the user‟s perspective. Proceedings of the 2004 International Workshop on Information Quality in InformationSystems,68–73.
[5] “Hevner, A. R., & Chatterjee, S. (2010). Introduction to Design Science Research. In Design research in information systems: Theory and practice (Vol. 28, pp. 1–8).
[6] “Kagermann, H., Österle, H., & Jordan, J. M. (2011). IT-Driven Business Models: Global Case Studies in Tranformations. John Wiley&Sons.”
[7] “Shankaranarayan, G., Ziad, M., & Wang, R. Y. (2003). Managing Data Quality in Dynamic Decision Environments: An information product approach. Journal of Database Management, 14(4), 14–
32.
[8] “Friedman, T., & Smith, M. (2011). Measuring the Business Value of Data Quality. Gartner, (G00218962).”
[9] TechTarget, “data set,” www.whatis.com, https://whatis.techtarget.com/def inition/data-set2020 [10]
https://blog.ldodds.com/2013/0 2/09/what-is-a-dataset/Ldodds, “Definitions of Dataset6,” www.blog.ldodds.com,2013 [11] byjus.com,” 2019. https://byjus.com/maths/datasets/.
[12] “J Uran, J. M., & Godfrey, A. B. (1998). Juran‟s Quality Handbook. McGraw-Hill.McGrawHill.
[13] “Scannapieco, M., & Catarci, T. (2002). Data Quality under the Computer Science perspective. Computer Engineering, 2(2), 1–12,”vol.2,p.2002,2002.
[14] “Batini, C., & Scannapieco, M. (2006). Data Quality Concepts, MethodologiesandTechniques.”
[15] “Pipino, L. L., Lee, Y. W., & Wang, R. Y. (2002). Data quality assessment. Communications of the ACM, 45(4),vol. 45, p. 506010, 2002.
[16] “del Pilar Angeles, M., & GarcíaUgalde,F.J.(2009).ADataQuality Practical Approach. International Journal on Advances in Software, 2(3).,”vol.2,p.2009,2009.
[17] T. Kupta, “Types of Data Sets in Data Science, Data Mining &
www.idosr.org
Machine Learning,” www. @ towardsdatascience.com, 2019. https://towardsdatascience.com/t ypes-of-data-sets-in-data-sciencedata-mining-machine-learningeb47c80af7a.
[18] K. Nandi, “Explore Your Data: Cases, Variables, Types of Variables,” www.web@ makemeanalyst.com, 2018. http://makemeanalyst.com/basicstatistics-explore-your-data-casesvariables-types-of-variables/.
[19] N. Donges, “Data Types in Statistics,” www.towardsdatascience.com, 2018. https://towardsdatascience.com/ data-types-in-statistics347e152e8bee.
[20] L. L, “Types of Data & Measurement Scales: Nominal, Ordinal, Interval and Ratio,” www.mymarketresearchmethods.c om,2020.
[21] “Batini, C., Cappiello, C., Francalanci, C., & Maurino, A. (2009). Methodologies for data quality assessment and improvement. ACM Computing Surveys, 41(3), 1–52. vol. 41, p. 1541883,2009.
[22] “P. Bhandari, „Scribbr-What is a ratio scale of measurement,‟ Scribbr [Online]. Available: https://www.scribbr.com/statistic s/ratio-data/. [Accessed 28 October2020].”
[23] “Wikipedia, „Kaggle,‟ Wikipedia, [Online]. Available: https://en.wikipedia.org/wiki/Kag gle. [Accessed 9 October 2020].,” no.October2020.
[24] “„Quora - How appropriate it is to publish research-based on Kaggle competitions data on ArXiv,‟ Quora, 25 January 2016. [Online]. Available: https://qr.ae/pNkBBI. [Accessed30October2020].”
[25] “V.Nikulin,„AnOntheMethodfor Data Streams Aggregation to Predict Shoppers Loyalty,‟ IJCNN, pp.1454-1461,12July2015.,”no. July,p.2015,2015.
[26] “Kaggle,„KaggleDatasets,‟Kaggle, [Online]. Available: https://www.kaggle.com/docs/da
tasets. [Accessed 2 November2020].”
[27] “A Review of Data Quality Research in Achieving,” Journalof Theoretical and Applied Information Technology, vol. 95, no.12,pp.1–12,2017.
[28] N.Z.Meredith,W.E.Hammond,B. G. Beverly, and M. G. Kahn, “Assessing Data Quality for Healthcare Systems Data Used in Clinical Research,” Health Care System Research Collaboratory, vol.1,pp.1–26,2014.
[29] L.CaiandY.Zhu,“TheChallenges of Data Quality and Data Quality Assessment in the Big Data Era,” DataScienceJournal, vol. 12, no. 2,pp.1–10,2020.
[30] “Wang, R. Y., Storey, V. C., and Firth, P. 1995. „A Framework for Analysis of Data Quality Research,‟ IEEE Transactions on Knowledge and Data Engineering (7), pp. 623-640.,” no. 7, p. 1995, 1995.
[31] “Lima, L., Maçada, G., and Vargas, L.M. 2006. „Research into information quality: A study of the state-of-the-art in IQ and its consolidation,‟ in Proceedings of the International Conference on Information Quality, Cambridge, MA.,”p.2006,2006.
[32] “Neely,M.P.andCook,J.2008.„A Framework for Classification of the Data and Information Quality Literature and Preliminary Results (1996-2007),‟ in Americas Conference on Information Systems (AMCIS), Toronto, CA,” 2008.
[33] “Madnick,S.,Wang,R.Y.,andLee, Y. W. 2009. „Overview and Framework for Data and Information Quality Research,‟ ACM Journal of Information and DataQuality,(1),pp.1-22.,”no.1, 2009.
[34] “Ge, M. and Helfert, M. 2007. „A Review of Information Quality Research,‟ in Proceedings of the International Conference on Information Quality, Cambridge, MA.,”p.2007,2007.
[35] “Juran, J. M. and Godfrey, A. B. 2000. Juran‟s Quality Handbook,
www.idosr.org
McGraw Hill International Editions: Industrial Engineering Series,5thEdition,2000.