www.idosr.org
©IDOSR Publication
International Digital Organization for Scientific Research
IDOSR JOURNAL OF SCIENCE AND TECHNOLOGY 8(1):89 -100, 2022.
Odoch et al
ISSN: 2579-079X
Proportion of Overweight and Obese Adolescents with Hyperglycemia in Selected Secondary Schools in Bushenyi-Ishaka Municipality, Western Uganda
Simon Odoch, Martin Nduwimana and Prof Grace NdeeziPediatrics andChildHealth of Kampala International University,Uganda.
ABSTRACT
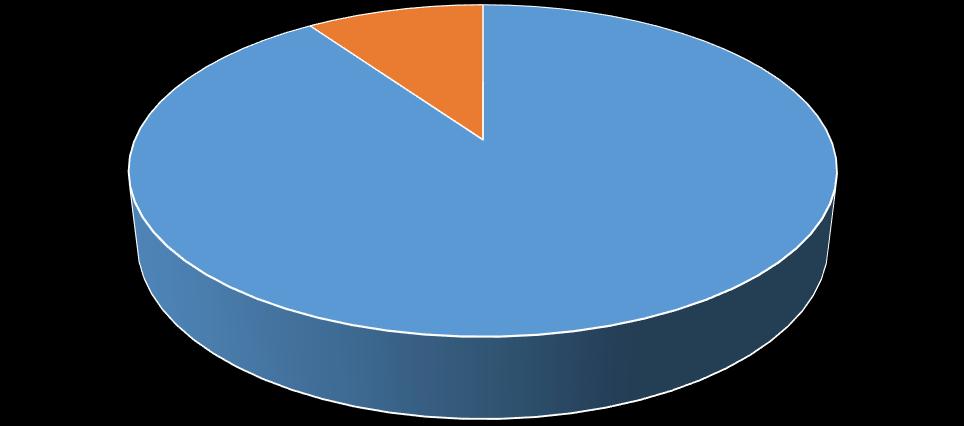
Childhood obesity has become a worldwide epidemic. Several non-communicable diseases are now being found among overweight and obese adolescents. There is lack of data on the burdenofoverweightandobesity,associatedcomorbiditiesinBushenyi-Ishakamunicipality. This study aims to investigate prevalence; factors associated with overweight and obesity among adolescents in selected secondary schools in Bushenyi-Ishaka municipality and determined the proportion of overweight and obese adolescents with hyperglycemia. A school-based cross-sectional study was conducted. Multistage sampling technique used to randomly recruit 752 study participants aged 12 to 18 years with the use of interviewer administered structured questionnaires. Food Frequency Questionnaire, International PhysicalActivityQuestionnaireandHEADSSassessmenttoolwereadaptedtoassessdietary, physical activity and sedentary lifestyle, and psychosocial factors, respectively. Weightand height was measured twice and average calculated provided the difference between the two measurements does not vary by more than 0.5kg for weight or 0.5cm for height. Body Mass Index(BMI) wascalculatedby dividing weightbyheightinsquared meterandinterpretedas normal, overweight or obese using International Obesity Task Force BMI cut-off references for a given age and gender. A glucometer was used to measure fasting blood glucose; ≥ 5.6 mmol/L was considered hyperglycemia. Data analyzed using SPSS version 27.0. The prevalence of overweight and obesity were determined as a proportion. Binary logistic regression wasusedtodeterminefactorsassociatedwithoverweightandobesitytakinga pvalue < 0.05 at 95% confidence interval to be statistically significant. Hyperglycemia among overweight and obese adolescents was determined as a proportion. Out of 113 overweight and obese adolescents, 11 (9.7%) had hyperglycemia. One in 10 overweight and obese adolescents had hyperglycemia.
Keywords: prevalence, overweight,obesity, hyperglycemia, adolescents.
INTRODUCTION
The origins of obesity can be traced back to our prehistoric ancestors 30,000 years. Survivalofthefittestdemandedthatthose who conserved energy most efficiently would survive the inevitable fast and famine that would follow periods of abundance. Naturalselection, on theother hand, has turned against humanity. Life currently favors inefficient phenotypes thatdo notstoreenergy inadipose depots overthosethatdo[1].Thescarcityoffood ledtotheperceptionthatbeingoverweight wasa good thingand desirable, and it was alsoprizedasanindicationofgoodhealth, wealth and prosperity [2]. The ancient Greeks first reported the risks of obesity
and its link to diseases. Hippocrates recognized that obesity resulted in infertility and premature death [1]. It was during the latter half of the nineteenth century that overweight/obesity began to be stigmatised for aesthetic reasons [2]. The burden of obesity is rising in all regionsoftheworld,includingthepoorest of low and middle income countries (LMICs), and the food environment has beenaprimarydriveroftheriseinobesity worldwide over the past 50 years [3]. In many countries, there has been a striking increase in the rate of overweight and obesity in children duringthe pastseveral
decades[4],andsince1975,thisburdenof obesity hasalmosttripled.
General objective
Todeterminetheproportionofoverweight andobeseadolescentswithhyperglycemia
Study design
inBushenyi-Ishakamunicipalitysecondary schools.
METHODOLOGY
This was a school-based cross-sectional, descriptive and analytical study to determine the prevalence and factors associated with overweight and obesity among adolescents in selected secondary schools in Bushenyi-Ishaka municipality, western Uganda. The study also aimed to determine the proportion of overweight andobeseadolescentswithhyperglycemia inBushenyi-Ishakamunicipalitysecondary schools.
Study site
The study was conducted in selected secondary schools in Bushenyi-Ishaka municipalityin Bushenyidistrict
Target population
The study targeted adolescents (aged 1218years)attendingsecondaryeducationin selected secondary schools in BushenyiIshaka municipality.
Sample size determination
As the burden of overweight and obesity among adolescents in Uganda including Bushenyi-Ishaka municipality is unknown, 50% prevalence of overweight and obesity was assumed to calculate sample size for objective one usingthe [5]. �� = ��2��(1 ��) ��2
Where:
N: Desiredsample size.
Z:Standarddeviation at desired degree of accuracy, which is 1.96 at95% degreeof accuracy.
p: Prevalence ofoverweight andobese adolescents. p =0.5 (assuming unknown prevalence ofoverweight andobesity amongadolescents in Bushenyi)
d: degreeof errorto be accepted which is 5%.
�� = (196)2 ×05×(1 05) (005)2 =384
N =384 adolescents.
Considering 10%non-respondentrate:
��′= �� 1 ��
Where;
N': desired sample size for 10% nonrespondentrate N:sample size calculated r: 10%non-respondentrate
��′ = 384 1 0.1 =426
Therefore, 426 adolescents were required asper objectiveone. The sample size for the second objective was calculated using the [6], based on a study among adolescents in secondary schools in Babati, Tanzania by [7]. In this study, 13.8% of adolescents who consumed unhealthy diet were obese/overweight compared to 7.5% amongthosewhoconsumedahealthydiet.
Considering diet as a factor, the proportion of overweight and obesity among those who consumed healthy and unhealthy diet,at apower of 80%.
�� = (��1 +��2)22��(1 ��) (��2 ��1)2
Z1: Z-value at 95% level of significance (1.96)
Z2:Z-valueat 80% power(0.84)
P1: Is the proportion of overweight and obese adolescents who consumed a healthy diet7.5% (0.075)
P2: Is proportion of overweight and obese adolescents whoconsumed unhealthydiet 13.8%(0.138)
�� = (��1 +��2) 2 = 0075+0138 2 =0107
�� = (196+084)2 ×2×0107(1 0107) (0138 0075)2 �� =376
Therefore, doubling 376 to cater for the two proportions, 752 adolescents were required for the second objective. Sample size for objective two was used in this
study as it gave a bigger sample size catering forthe associatedfactors.
Inclusion criteria
Adolescents (aged 12-18 years) from the selected public and private secondary schools in Bushenyi-Ishaka municipality whose parents or guardians had given informed consent and had assented were enrolled to participatein thisstudy.
Exclusion criteria
1. Those with physical deformities that made taking anthropometric measurements difficult.
2. Adolescents with already known type 1 diabetes, as they were most likely tobe havinghyperglycemia.
3. Those on current steroid medication, as this might independently cause dysglycemia.
Sampling procedure
Bushenyi-Ishaka Municipality had a total number of 16 secondary schools of which 4 were public and 12 were private. According to the records (February 28 2020) of the Bushenyi-Ishaka Municipality Education Officer, the total number of adolescents enrolled in these secondary schools were 5,652.
Multi-stage cluster sampling was used to select the secondary schools, and study participants. The schools were stratified intoprivateorpublicschoolsandsampled separately. Probability proportion-to-size was used to select the secondary schools and number of students to be recruited from each school. Using OpenEpi random number sequence one public and three private schools were selected (www.openepi.com:accessedonMarch30, 2020). With an overall sample size of 752 adolescents, 189 (25%) adolescents were sampled from public secondary schools and 563 (75%) adolescents were sampled from private secondary schools. Probability proportion to size sampling was used to determine how many participantsweretobesampledfromeach school in accordance with school’s total population of adolescents aged 12 to 18 years (Appendix V). After determining the proportion of adolescents to study from each school, simple random sampling was used with the aid of class lists, taking a proportionate number of adolescents in
eachclass(Senior1tosenior6)depending on theclass size.
Selection of schools and study participants
Consideringproportion tosize,onepublic and three private secondary schools were selected. The investigator had access to the school registers through the office of the head teachers. These school registers were used to randomly select study participants from senior one to senior six dependingontheclasssize.Headteachers contacted all the randomly sampled adolescent’s parents/guardians to report to school for a meeting about the study and those whose parents/guardians did not turn up were replaced on a later date to achieve the required sample size. Parents/guardians who travelled to the school had their transport reimbursement and refreshments provided. Basing on the fact that the study was conducted during the coronavirus disease (COVID-19) pandemic, the investigator health educated both adolescents and the parents/guardians about COVID-19 pandemic. And in order to avoid the risk ofinfectingeachother with COVID-19, the investigator, research assistant, parents/guardians and their adolescents ensured adherence to the Ministry of Health (MoH) COVID-19 prevention guidelines [8]. A social distance of at least two meters between individuals was mandatory, except during anthropometric evaluation and fasting blood glucose measurement on the study participants whowerefoundtobeoverweightorobese. In addition, the principal investigator, research assistants and study participants appropriately and consistently used facemasks, and sanitized their hands before and after the interview. All equipment was disinfected before and afteruse.
Data collection instruments
The principal investigator together with the research assistants administered a structured questionnaire to the sampled adolescentsandtheirparents/guardiansin both English and whenever necessary in Runyankole version. The data collection toolwastranslatedintothelocallanguage.
The questionnaire was composed of seven sections, whichincluded;
Section A (socio-demographic and socioeconomic information), Section B (Psychosocialinformation),SectionC(drug and substance abuse information),Section D(physicalactivityandsedentarylifestyle information) Section E (medical and dietary information), Section F (Anthropometry) and Section G (measurement of fasting blood glucose of overweight andobese adolescents).
Body weight was measured using a digital weighing scale (Seca 869, GMBH & Co, designed in Germany and made in China, model 874 1021658, maximum capacity 150kg d = 0.1kg) and a stadiometer designed by UNICEF was used for measuring height. The extended International Obesity Task Force (IOTF) BMIreferencechartsprovidedinAppendix VIwereusedtodetermineiftheadolescent was normal weight, overweight, or obese. Inordertodetermineifhyperglycemiawas present among overweight and obese adolescents, appointment was made to take capillary fasting blood glucose the next morning using a glucometer On-Call Plus® (Acon Laboratories, San Diego, CA, USA) with appropriateglucose strips.
Data collection
Parents or guardians of the study participants were asked to give written informed consent, to answer an investigator administered questionnaire about some socio-demographic and socioeconomic factors for adolescent overweight and obesity. A unique study number was assigned to each participant to avoid duplication. Appointment was made to have fasting blood glucose measurement on adolescents who were found to be overweight or obese. The followinginformation werecollected.
Body mass index
From the average heights and weights obtained, the Body Mass Index (BMI) was calculated as weight in kilograms divided by the square of height in meters [BMI = weight(kg)/(height(m)) 2 [9]].Basedon the IOTF age and gender-specific BMI cutoff reference values, adolescents were classifiedasnormalweight,overweight,or obese [10]. The International Obesity Task
Force classification of overweight and obesity was chosen due to its high specificity and low sensitivity in predicting overweight and obesity among adolescents hence, its more accurate and minimizes the likelihood of false positive [11; 12].
Fasting blood glucose measurement Capillary fasting blood glucose measurement was taken from a finger prick, placed on a test strip, and analyzed using a recently calibrated glucometer of the brand On-Call Plus® (Acon Laboratories, San Diego, CA, USA).
Adolescentswhowereoverweightorobese fasted overnight, from 11pm to 7am. A fasting blood glucose level was measured prior to taking their breakfast, overweight and obese day scholars were asked not to takebreakfastfromhomebeforetheirFBG measured, they were advised to pack their breakfast and take it after FBG measurement.Afastingbloodglucose<5.6 mmol/L (<100 mg/dL) was considered normal, while impaired fasting blood glucose was diagnosed when FBG was between100–125mg/dL(5.6–6.9mmol/L).
Diabetes if FBG ≥7.0mmol/L (≥126 mg/dL) [13; 14], and hyperglycemia if FBG was within impaired fasting blood glucose and diabetic range (≥ 5.6 mmol/L) [13; 14]
Data management
After data collection, the questionnaires werecheckedforcompletenessandstored safely in lockable shelves. No additional information was added to the questionnaires after data collection. After data analysis,theinformation waskepton password-protectedfilestoavoidretrieval bynon-authorizedindividuals.
Data from pre-coded and completed questionnaires was entered using statistical computer package software Microsoft excel 2019. Data was cleaned by running frequencies to explore the variables one by one. Data anomalies, typos and other errors were corrected by crosschecking against the originally filled hardcopyof the questionnaire.
Data analysis
DataanalysiswasdoneusingSPSS(version 27.0)statistical software.
For the first objective, the prevalence of overweight, obesity, and overweight and
obesity combined was computed as a percentage of all overweight, obese, and overweight and obese combined, expressed as percentages over the total number of adolescents enrolled in the study. Pie chart was used to present these findings.
For the second objective, binary logistic regression analysis (bivariable and multivariable) was performed to assess factors independently associated with overweight and obesity in selected secondary schools in Bushenyi-Ishaka municipality. Variables with p-value < 0.2 at80%confidenceintervalandbiologically plausible demographic factors such as sex andageonbivariableanalysiswerechosen for multivariable logistic regression to allow a large number of variables to be considered at multivariable analysis level. Atmultivariableanalysis,oddsratioswere computed for factors associated with overweight and obesity at 95% confidence interval, taking p < 0.05 as statistically significant. The results were presented using tables.
For the third objective, the proportion of adolescents with hyperglycemia among the overweight and obese category was calculated using descriptive statistics, expressed as a percentage over the total number of adolescents with overweight and obesity, and presented using a pie chart.
Ethical considerations
Institutional consent
The study was conducted in line with the national guidelines for research involving human participants [15]. Ethical clearance was obtained from the Research and Ethical committee of Kampala International University-Western Campus (Nr.UG-REC-023/202030). Permission was
Socio-demographic characteristics
sought from the Municipal Education Officer and Municipal Health Officer of Bushenyi-Ishakamunicipalityandfromthe Head Teachers of the selected secondary schools. With the help of the head teachers, parents or guardians in each school were invited to have their sampled adolescents participate in thestudy.
Informed consent and assent
Parentsorguardianswhoacceptedtohave their adolescents participate in the study were registered and signed or applied a thumb prints on a written informed consent document. In accordance with Uganda National Council for Science and Technology guidelines [15], assent was also concurrently obtained from the adolescents after clearly explaining the purpose of the study. With regard to consent and assent, the technical terms in the study were written in a layman’s language so that the adolescents and their parents or guardians were able to understand the procedures to be undertaken.
Privacy and confidentiality
Questionnaires did not have a provision for participant’s names, and study participants were interviewed and examined in a free classroom within the school where anthropometry and fasting bloodglucose weredonetoavoidabreach of privacy and confidentiality. After each field visit, completed questionnaires were lockedinacabinetthatwasonlyaccessible to the principal investigator. In addition, the electronic database was passwordprotected and only accessible by the principal investigator. Published materials will not contain any identifiers that can directlylinkthedatatoindividualsortheir families.
RESULTS
Study participants were aged 13 to 18 yearsandnonewas12yearsold.Meanage was16.47±1.34years.Therewereslightly more female participants 395 (52.5%) with ratio of male to female of 1 to 1.12 in secondary schools. Almost two-thirds (74.9%)wereattendedprivateschoolswith
ratio of public to private schools of 1:3. Over half 394 (52.4%) were late adolescents. Most of the adolescents 639 (85.0 %) had a normal BMI. Other sociodemographic characteristics of study participants and their parents/guardians aredetailed in Table 1 below.
Table: Sociodemographic characteristics of study participants
Variable Frequency (n) Percentage (%)
Adolescents’ age category
Early (13-14years) 67 8.9 Middle (15-16years) 291 38.7 Late(17-18years) 394 52.4
Sex
Male 357 47.5 Female 395 52.5
Place of residence
Urban 303 40.3 Rural 449 59.7
Religion
Muslim 223 29.6 Christian 512 68.1 Others 17 2.3 School type Public 189 25.1 Private 563 74.9 Day or boarder Day 37 4.9 Boarding 715 95.1 Household size ≤ 5 174 23.1 >5 578 76.9
Siblings
≤ 5 519 69.0 >5 233 31.0
Mostparental/guardianslevelofeducation was of secondary, with father; 333 (44%) andmother;337(44.8%)respectively.Most parents/guardians were of business occupation,father257(34.2%)and mother
301 (40.0%) respectively, with average monthly family income of 100,000/= to < 500,000/= 284 (37.8%). Table 2 shows the socioeconomic characteristicsin detail.
Table 1: Participants' socioeconomic characteristics in the study
Variable Frequency (n) Percentage (%)
Education level of the father/guardian
Atmostprimary 279 37.0 Secondary 333 44.0 Tertiary 146 19.0
Education level of the mother/guardian
Atmostprimary 324 43.1 Secondary 337 44.8 Tertiary 91 12.1
Occupation of the father/guardian
Civilservant 108 14.4 Privatesector 108 14.4 Peasantfarmer 244 32.4 Business 257 34.2 Others 35 4.7
Occupation of the mother/guardian
Civilservant 58 7.7 Privatesector 93 12.4 Peasantfarmer 300 39.9 Business 301 40.0
Average monthly family income (Uganda shillings)
<100,000/= 58 7.7 100,000to <500,000/= 284 37.8 500,000/= to <1,000,000/= 201 26.7 ≥1,000,000/= 209 27.8
Pocket money for the adolescent
Yes 545 72.5 No 207 27.5
Average pocket money ≤ 50,000/= 669 89.0 >50,000/= 83 11.0
Family car ownership
Yes 209 27.8 No 543 72.2
Of the 752 adolescents, 691 (91.9%) had close friends, 121 (16.1%) reported being bullied in the past 30 days, 270 (35.9%) reported felling lonely in the past 12
months, 65(8.6%)hadsuicidalthoughtsin the past 12 months. The details are in Table 3below.
Table 2:
Psychosocial, drug and substance abuse characteristics of study participants
Variable Frequency (n) Percentage (%)
Close friends
Yes 691 91.9 No 61 8.1
History of bullying in past 30 days
Yes 121 16.1 No 631 83.9
Feeling lonely in past 12 months Yes 270 35.9 No 482 64.1
Suicidal thoughts in the past 12 months
Yes 65 8.6 No 687 91.4
Smoking
Yes 2 0.3 No 750 99.7
Alcohol consumption Yes 5 0.7 No 747 99.3
Use of other drugs Yes 1 0.1 No 751 99.9
All participating adolescents 752 (100%) reported that they have sport activities at their school, 464 (61.7%) were actively participating in sports, among which 460 (61.2%) met the moderate to vigorous
physical activity criteria, 553 (73.5%) had access to television. Other details of physical activity and sedentary characteristicsofstudyparticipantsareas illustrated on Table 4below.