www.idosr.org
©IDOSR Publication
International Digital Organization for Scientific Research
IDOSR JOURNAL OF SCIENCE AND TECHNOLOGY 8(1):68 -81, 2022.
Odoch et al
ISSN: 2579-079X
Prevalence of Overweight and Obesity among Adolescents in Selected Secondary Schools in Bushenyi-Ishaka Municipality, Western Uganda
Simon Odoch, Martin Nduwimana and Prof Grace NdeeziPediatrics andChildHealth of Kampala InternationalUniversity, Uganda.
ABSTRACT
Childhood obesity has become a worldwide epidemic. Several non-communicable diseases are now being found among overweight and obese adolescents. There is lack of data on the burdenofoverweightandobesity,associatedcomorbiditiesinBushenyi-Ishakamunicipality. This study aims to investigate prevalence; factors associated with overweight and obesity among adolescents in selected secondary schools in Bushenyi-Ishaka municipality and determined the proportion of overweight and obese adolescents with hyperglycemia. A school-based cross-sectional study was conducted. Multistage sampling technique used to randomly recruit 752 study participants aged 12 to 18 years with the use of interviewer administered structured questionnaires. Food Frequency Questionnaire, International PhysicalActivityQuestionnaireandHEADSSassessmenttoolwereadaptedtoassessdietary, physical activity and sedentary lifestyle, and psychosocial factors, respectively. Weight and height was measured twice and average calculated provided the difference between the two measurements does not vary by more than 0.5kg for weight or 0.5cm for height. Body Mass Index(BMI) wascalculatedby dividing weight byheightinsquared meterandinterpretedas normal, overweight or obese using International Obesity Task Force BMI cut-off references for a given age and gender. A glucometer was used to measure fasting blood glucose; ≥ 5.6 mmol/L was considered hyperglycemia. Data analyzed using SPSS version 27.0. The prevalence of overweight and obesity were determined as a proportion. Binary logistic regression wasusedtodeterminefactorsassociatedwithoverweightandobesitytakinga pvalue < 0.05 at 95% confidence interval to be statistically significant. Hyperglycemia among overweightandobeseadolescentswasdeterminedasaproportion.Prevalenceofoverweight and obesity was 15% with overweight and obesity only being 14.1% and 0.9%, respectively. Thisstudyfoundhighprevalenceofoverweightandobesitywithoneinsixadolescentsbeing affected.
Keywords: prevalence, overweight,obesity, hyperglycemia, adolescents
INTRODUCTION
The origins of obesity can be traced back to our prehistoric ancestors 30,000 years. Survivalofthefittestdemandedthatthose who conserved energy most efficiently would survive the inevitable fast and famine that would follow periods of abundance. Naturalselection, on theother hand, has turned against humanity. Life currently favors inefficient phenotypes thatdo notstoreenergy inadipose depots overthosethatdo[1].Thescarcityoffood ledtotheperceptionthatbeingoverweight wasa good thingand desirable, and it was alsoprizedasanindicationofgoodhealth, wealth and prosperity [2]. The ancient
Greeks first reported the risks of obesity and its link to diseases. Hippocrates recognized that obesity resulted in infertility and premature death [1]. It was during the latter half of the nineteenth century that overweight/obesity began to be stigmatised for aesthetic reasons [2]. The burden of obesity is rising in all regionsoftheworld,includingthepoorest of low and middle income countries (LMICs), and the food environment has beenaprimarydriveroftheriseinobesity worldwide over the past 50 years [3]. In many countries, there has been a striking increase in the rate of overweight and
obesity in children duringthe pastseveral decades[4],andsince1975,thisburdenof obesity hasalmost tripled.
Study design
General objective
Todeterminetheprevalenceofoverweight andobesityamongadolescentsinselected secondary schools in Bushenyi-Ishaka municipality.
METHODOLOGY
This was a school-based cross-sectional, descriptive and analytical study to determine the prevalence and factors associated with overweight and obesity among adolescents in selected secondary schools in Bushenyi-Ishaka municipality, western Uganda. The study also aimed to determine the proportion of overweight andobeseadolescentswithhyperglycemia inBushenyi-Ishakamunicipalitysecondary schools.
Study site
The study was conducted in selected secondary schools in Bushenyi-Ishaka municipalityin Bushenyidistrict
Target population
The study targeted adolescents (aged 1218years)attendingsecondaryeducationin selected secondary schools in BushenyiIshaka municipality.
Study duration
This study took a duration of three months, from March to May 2021. These periods were enough to attain the sample size required. About 15 participants were recruited on a daily basis, the secondary school had commenced in a phased manner, and students were attending classes.
Sample size determination
As the burden of overweight and obesity among adolescents in Uganda including Bushenyi-Ishaka municipality is unknown, 50% prevalence of overweight and obesity was assumed to calculate sample size for objective one usingthe [5].
�� = ��2��(1 ��) ��2
Where:
N: Desiredsample size.
Z: Standard deviation at desired degree of accuracy, which is 1.96 at 95% degree of accuracy.
p: Prevalence of overweight and obese adolescents. p = 0.5 (assuming unknown
prevalence of overweight and obesity amongadolescents in Bushenyi) d: degree of error to be accepted which is 5%.
�� = (1.96)2 ×0.5×(1 0.5) (005)2 =384 N = 384 adolescents. Considering 10%non-respondent rate: ��′= �� 1 ��
Where; N': desired sample size for 10% nonrespondent rate N:sample size calculated r: 10%non-respondent rate ��′ = 384 1 0.1 =426
Therefore, 426 adolescents were required asper objective one. The sample size for the second objective was calculated using the [6], based on a study among adolescents in secondary schools in Babati, Tanzania by [7]. In this study, 13.8% of adolescents who consumed unhealthy diet were obese/overweight compared to 7.5% amongthosewhoconsumedahealthydiet. Considering diet as a factor, the proportion of overweight and obesity among those who consumed healthy and unhealthy diet,at apower of 80%.
�� = (��1 +��2)22��(1 ��) (��2 ��1)2
Z1: Z-value at 95% level of significance (1.96)
Z2:Z-valueat 80% power(0.84)
P1: Is the proportion of overweight and obese adolescents who consumed a healthy diet 7.5% (0.075)
P2: Is proportion of overweight and obese adolescents whoconsumed unhealthydiet 13.8%(0.138)
�� = (��1 +��2) 2 = 0.075+0.138 2 =0.107
(196+084)2 ×2×0107(1 0107) (0138 0075)2 �� =376
Therefore, doubling 376 to cater for the two proportions, 752 adolescents were required for the second objective. Sample size for objective two was used in this study as it gave a bigger sample size catering forthe associatedfactors.
Inclusion criteria
Adolescents (aged 12-18 years) from the selected public and private secondary schools in Bushenyi-Ishaka municipality whose parents or guardians had given informed consent and had assented were enrolled to participatein thisstudy.
Exclusion criteria
1. Those with physical deformities that made taking anthropometric measurements difficult.
2. Adolescents with already known type 1 diabetes, as they were most likely tobe havinghyperglycemia.
3. Those on current steroid medication, as this might independently cause dysglycemia.
Sampling procedure
Bushenyi-Ishaka Municipality had a total number of 16 secondary schools of which 4 were public and 12 were private. According to the records (February 28 2020) of the Bushenyi-Ishaka Municipality Education Officer, the total number of adolescents enrolled in these secondary schools were 5,652. Multi-stage cluster sampling was used to select the secondary schools, and study participants. The schools were stratified intoprivateorpublicschoolsandsampled separately. Probability proportion-to-size was used to select the secondary schools and number of students to be recruited from each school. Using OpenEpi random number sequence one public and three private schools were selected (www.openepi.com:accessedonMarch30, 2020). With an overall sample size of 752 adolescents, 189 (25%) adolescents were sampled from public secondary schools and 563 (75%) adolescents were sampled from private secondary schools. Probability proportion to size sampling was used to determine how many
participantsweretobesampledfromeach school in accordance with school’s total population of adolescents aged 12 to 18 years (Appendix V). After determining the proportion of adolescents to study from each school, simple random sampling was used with the aid of class lists, taking a proportionate number of adolescents in eachclass(Senior1tosenior6)depending on theclass size.
Selection of schools and study participants
Consideringproportion tosize,onepublic and three private secondary schools were selected. The investigator had access to the school registers through the office of the head teachers. These school registers were used to randomly select study participants from senior one to senior six dependingontheclasssize.Headteachers contacted all the randomly sampled adolescent’s parents/guardians to report to school for a meeting about the study and those whose parents/guardians did not turn up were replaced on a later date to achieve the required sample size. Parents/guardians who travelled to the school had their transport reimbursement and refreshments provided. Basing on the fact that the study was conducted during the coronavirus disease (COVID-19) pandemic, the investigator health educated both adolescents and the parents/guardians about COVID-19 pandemic.
Data collection instruments
The principal investigator together with the research assistants administered a structured questionnaire to the sampled adolescentsandtheirparents/guardiansin both English and whenever necessary in Runyankole version. The data collection toolwastranslatedintothelocallanguage. The questionnaire was composed of seven sections, which included;
Section A (sociodemographic and socioeconomic information), Section B (Psychosocialinformation),SectionC(drug and substance abuse information), Section D(physicalactivityandsedentarylifestyle information) Section E (medical and dietary information), Section F (Anthropometry) and Section G (measurement of fasting blood glucose of overweight andobese adolescents).
Body weight was measured using a digital weighing scale (Seca 869, GMBH & Co, designed in Germany and made in China, model 874 1021658, maximum capacity 150kg d = 0.1kg) and a stadiometer designed by UNICEF was used for measuring height. The extended International Obesity Task Force (IOTF) BMIreferencechartsprovidedinAppendix VIwereusedtodetermineiftheadolescent was normal weight, overweight, or obese Inordertodetermineifhyperglycemiawas present among overweight and obese adolescents, appointment was made to take capillary fasting blood glucose the next morning using a glucometer On-Call Plus® (Acon Laboratories, San Diego, CA, USA) with appropriateglucose strips.
Data collection
Parents or guardians of the study participants were asked to give written informed consent, to answer an investigator administered questionnaire about some socio-demographic and socioeconomic factors for adolescent overweight and obesity. A unique study number was assigned to each participant to avoid duplication. Appointment was made to have fasting blood glucose measurement on adolescents who were found to be overweight or obese. The followinginformation werecollected.
Fasting blood glucose measurement
Capillary fasting blood glucose measurement was taken from a finger prick, placed on a test strip, and analyzed using a recently calibrated glucometer of the brand On-Call Plus® (Acon Laboratories, San Diego, CA, USA).
Adolescentswhowereoverweightorobese fasted overnight, from 11pm to 7am. A fasting blood glucose level was measured prior to taking their breakfast, overweight and obese day scholars were asked not to takebreakfastfromhomebeforetheirFBG measured, they were advised to pack their breakfast and take it after FBG measurement.Afastingbloodglucose<5.6 mmol/L (<100 mg/dL) was considered normal, while impaired fasting blood glucose was diagnosed when FBG was between100–125mg/dL(5.6–6.9mmol/L).
Diabetes if FBG ≥7.0mmol/L (≥126 mg/dL) (ADA, 2019; Mayer-Davis et al., 2018), and
hyperglycemia if FBG was within impaired fasting blood glucose and diabetic range (≥ 5.6 mmol/L) [4].
Data quality control
The questionnaire containing both open and close-ended questions was pre-tested in a similar population at Ishaka Vocational senior secondary school in Bushenyi-Ishaka municipality. This data was not included in the final data analysis and report. The pretesting was helpful in standardizing the questionnaire and clarifyingof anyinconsistencies. The ages of adolescents were calculated from the date of birth. National identification cards or birth certificates wereused to ascertain thecorrectdateofbirth.Weight wastaken to the nearest 0.1kg using a digital weighing scale, which was calibrated routinely with an object whose weight wasknown.Thestandardisedheightboard (stadiometer) was calibrated periodically using a fixed dry wood of a known height at room temperature and same time of the dayandheightmeasuredtothenearest0.1 cmandconverted to meters.
The principal investigator trained two research assistant, one male and one femaleontheprocedureofdatacollection. To avoid inter-observer variability, one research assistant took the measurements while the other did the recording. The principal investigator/research assistants measured the weight and height of study participants twice, and the average weight and height was obtained and used to calculate the BMI. Fasting blood glucose was tested using a routinely calibrated glucometer and glucose strips using control sample solution with known glucose range provided by the manufacturer of the glucometer. Each filled questionnaire was crosschecked for inconsistencies and incompleteness before the interview was terminated and clarifications was sought. Finally, data analysis was performed by the principal investigator in consultation with a biostatistician.
Data management
After data collection, the questionnaires werecheckedforcompletenessandstored safely in lockable shelves. No additional information was added to the
questionnaires after data collection. After data analysis,theinformation waskept on password-protectedfilestoavoidretrieval bynon-authorizedindividuals.
Data from pre-coded and completed questionnaires was entered using statistical computer package software Microsoft excel 2019. Data was cleaned by running frequencies to explore the variables one by one. Data anomalies, typos and other errors were corrected by crosschecking against the originally filled hardcopyof the questionnaire.
Data analysis
DataanalysiswasdoneusingSPSS(version 27.0)statistical software.
For the first objective, the prevalence of overweight, obesity, and overweight and obesity combined was computed as a percentage of all overweight, obese, and overweight and obese combined, expressed as percentages over the total number of adolescents enrolled in the study. Pie chart was used to present these findings.
For the second objective, binary logistic regression analysis (bivariable and multivariable) was performed to assess factors independently associated with overweight and obesity in selected secondary schools in Bushenyi-Ishaka municipality. Variables with p-value < 0.2 at80%confidenceintervalandbiologically plausible demographic factors such as sex andageonbivariableanalysiswerechosen for multivariable logistic regression to allow a large number of variables to be considered at multivariable analysis level. Atmultivariableanalysis,oddsratioswere computed for factors associated with overweight and obesity at 95% confidence interval, taking p < 0.05 as statistically significant. The results were presented using tables.
For the third objective, the proportion of adolescents with hyperglycemia among the overweight and obese category was calculated using descriptive statistics, expressed as a percentage over the total
number of adolescents with overweight and obesity, and presented using a pie chart.
Ethical considerations
Institutional consent
The study was conducted in line with the national guidelines for research involving human participants [8]. Ethical clearance was obtained from the Research and Ethical committee of Kampala International University-Western Campus (Nr.UG-REC-023/202030). Permission was sought from the Municipal Education Officer and Municipal Health Officer of Bushenyi-Ishakamunicipalityandfromthe Head Teachers of the selected secondary schools. With the help of the head teachers, parents or guardians in each school were invited to have their sampled adolescents participate in thestudy.
Informed consent and assent
Parentsorguardianswhoacceptedtohave their adolescents participate in the study were registered and signed or applied a thumb prints on a written informed consent document. With regard to consent and assent, the technical terms in the study were written in a layman’s language so that the adolescents and their parents or guardians were able to understand the procedures tobe undertaken.
Privacy and confidentiality
Questionnaires did not have a provision for participant’s names, and study participants were interviewed and examined in a free classroom within the school where anthropometry and fasting bloodglucose weredonetoavoidabreach of privacy and confidentiality. After each field visit, completed questionnaires were lockedinacabinetthatwasonlyaccessible to the principal investigator. In addition, the electronic database was passwordprotected and only accessible by the principal investigator. Published materials will not contain any identifiers that can directlylinkthedatatoindividualsortheir families.
RESULTS
Study participants were aged 13 to 18 yearsandnonewas12yearsold.Meanage was16.47±1.34years.Therewereslightly more female participants 395 (52.5%) with ratio of male to female of 1 to 1.12 in
secondary schools. Almost two-thirds (74.9%)wereattendedprivateschoolswith ratio of public to private schools of 1:3. Over half 394 (52.4%) were late adolescents. Most of the adolescents 639
(85.0 %) had a normal BMI. Other sociodemographic characteristics of study participants and their parents/guardians aredetailed in Table 1 below.
Table 1. Sociodemographic characteristics of study participants
Variable Frequency (n) Percentage (%)
Adolescents’ age category
Early (13-14 years) 67 8.9 Middle (15-16years) 291 38.7 Late(17-18 years) 394 52.4
Sex
Male 357 47.5 Female 395 52.5
Place of residence Urban 303 40.3 Rural 449 59.7
Religion Muslim 223 29.6 Christian 512 68.1 Others 17 2.3
School type
Public 189 25.1 Private 563 74.9
Day or boarder Day 37 4.9 Boarding 715 95.1 Household size ≤ 5 174 23.1 > 5 578 76.9 Siblings ≤ 5 519 69.0 > 5 233 31.0
Mostparental/guardianslevelofeducation was of secondary, with father; 333 (44%) andmother;337(44.8%)respectively.Most parents/guardians were of business occupation,father257(34.2%)and mother
301 (40.0%) respectively, with average monthly family income of 100,000/= to < 500,000/= 284 (37.8%). Table 2 shows the socioeconomic characteristicsin detail.
Table 2: Participants' socioeconomic characteristics in the study
Variable Frequency (n) Percentage (%)
Education level of the father/guardian
Atmost primary 279 37.0 Secondary 333 44.0 Tertiary 146 19.0
Education level of the mother/guardian
Atmost primary 324 43.1 Secondary 337 44.8 Tertiary 91 12.1
Occupation of the father/guardian
Civilservant 108 14.4 Privatesector 108 14.4 Peasantfarmer 244 32.4 Business 257 34.2 Others 35 4.7
Occupation of the mother/guardian
Civilservant 58 7.7 Privatesector 93 12.4 Peasantfarmer 300 39.9 Business 301 40.0
Average monthly family income (Uganda shillings)
< 100,000/= 58 7.7 100,000to <500,000/= 284 37.8 500,000/= to < 1,000,000/= 201 26.7 ≥1,000,000/= 209 27.8
Pocket money for the adolescent
Yes 545 72.5 No 207 27.5
Average pocket money ≤ 50,000/= 669 89.0 > 50,000/= 83 11.0
Family car ownership
Yes 209 27.8 No 543 72.2
Of the 752 adolescents, 691 (91.9%) had close friends, 121 (16.1%) reported being bullied in the past 30 days, 270 (35.9%) reported felling lonely in the past 12
months, 65(8.6%)hadsuicidalthoughtsin the past 12 months. The details are in Table 3below.
Table 3: Psychosocial, drug and substance abuse characteristics of study participants Variable Frequency (n) Percentage (%)
Close friends
Yes 691 91.9 No 61 8.1
History of bullying in past 30 days
Yes 121 16.1 No 631 83.9
Feeling lonely in past 12 months
Yes 270 35.9 No 482 64.1
Suicidal thoughts in the past 12 months
Yes 65 8.6 No 687 91.4
Smoking
Yes 2 0.3 No 750 99.7
Alcohol consumption Yes 5 0.7 No 747 99.3
Use of other drugs Yes 1 0.1 No 751 99.9
All participating adolescents 752 (100%) reported that they have sport activities at their school, 464 (61.7%) were actively participating in sports, among which 460 (61.2%) met the moderate to vigorous
physical activity criteria, 553 (73.5%) had access to television. Other details of physical activity and sedentary characteristicsofstudyparticipantsareas illustrated on Table 4 below.
Percentage
Table 4: Physical activity and sedentary characteristics of study participants Variable Frequency
Transport means
Walk 37 4.9 Cycle 03 0.4
Time spent to walk ≤10 minutes 09 1.2 >10minutes 28 3.7
Time spent to cycle ≤10 minutes 01 0.1 >10minutes 02 0.3
Sports activities in school
Yes 752 100 No 0.0 0.0
60 minutes of physical activity at least 3 days/week Yes 464 61.7 No 288 38.3
Moderate to Vigorous physical activities
Yes 460 61.2 No 292 38.8
Access to TV Yes 553 73.5 No 199 26.5
Time spent watching TV ≤2 hours 151 27.3 >2 hours 402 72.7
Access to video, computer games
Yes 396 52.7 No 356 47.3
Time spent playing video or computer games Oncea week 126 31.8 2-3 times a week 156 39.4 >3 times per week 114 28.8
Of the 752 adolescents, 191 (25.4%) had family history of overweight and obesity, 608(80.9%)weresleepinglessthan8hours at night, 184 (24.5%) reported skipping breakfast, most of the participants 751
(99.9) had their lunch at school and most of the participants 491 (65.3%) reported consuming unhealthy diet. The details of medical and dietary characteristics are in Table 5below.
Table 5: Medical and dietary characteristics of study participants
Variable Frequency (n) Percentage (%)

Family history of overweight and obesity
Yes 191 25.4 No 561 74.6
Hours spent sleeping ≤8 hours 608 80.9 >8hours 144 19.1
Skipping breakfast
Yes 184 24.5 No 568 75.5
Lunch at school
Yes 751 99.9 No 1 0.1
Unhealthy diet Yes 491 65.3 No 261 34.7
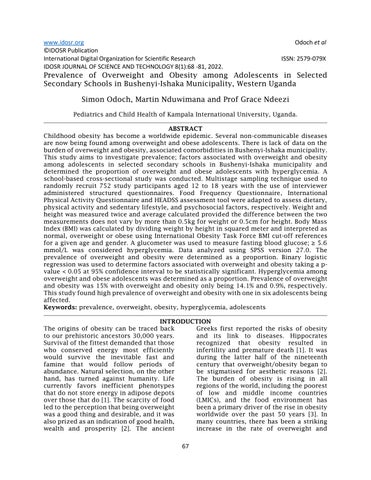
Out of 752 adolescents in selected secondary schools, 106 (14.1%) were overweight, 7 (0.9%) were obese and 113
(15%) adolescents were overweight and obese combined. These are illustrated in Figure 4 below.
Figure 1:Apiechartshowingprevalenceofoverweightandobesityamongadolescentsin selectedsecondaryschoolsinBushenyi-Ishakamunicipality
DISCUSSION
Overweightandobesityprevalencewas15 percentinthiscross-sectionalstudy,while overweight and obesity only were 14.1
percent and 0.9 percent respectively. Whereas this finding is consistent with some studies, it is much higherthan some
studies in the region. This finding is more consistent with studies that have been done in the urban compared to the rural setting [9; 10] Bushenyi-Ishaka municipality is predominantly urban and this study as well found that over half (52.2%) of overweight and obese adolescents are from the urban setting with high level of sedentary lifestyle. About 77.4% of overweight and obese adolescent watch TV for more than two hours. High socioeconomic status as most of the parents are business owners and 93.8%werereceivingpocketmoney,which can be used for buying unhealthy food of which, 65.3 were consuming unhealthy diet. The prevalence in this study was comparable to the one done in Bahir Dar city, Ethiopia involving 451 high school students where the prevalence of overweight and obesity was 12.3% and 4.4% respectively, overall prevalence of overweight and obesity of 16.7% [11,12,13,14]. It was also comparable to a studyby[12]whofound17.8%prevalence of overweight and obesity among adolescents in secondary schools in Langata, Nairobi the capital city of Kenya. The prevalence of overweight and obesity in this study was lower compared to a cross sectional study done in Dar es Salaam, Tanzania involving 582 adolescents in 5 randomly selected secondary schools which found a proportionofadolescentswithoverweight or obesity of 22.2% [13,16,17,18,19]. The variation in the prevalence of overweight might be due to variation in sociodemographic characteristics of study participants [20,21,22]. The variation in the prevalence could also be explained by the differences in dietary patterns. Whereas the diet in Bushenyi is predominantly composed of plantain (locally known as matooke), beans, finger millet, sweet potatoes, sorghum, cassava, Solanum potatoes, ground nuts, posho, soybeans, cabbages and other vegetables with milk as a major source of protein [14,23,24,25]. Most diets in East African cities comprised of refined carbohydrates and fried foods which are high in sugar andfat [15,26,27,28] The prevalence of overweight and obesity in this study was high compared to one
done by [7] in Tanzania where overweight and obesity was found to be 9.2% among adolescents in semi-rural area of Babati district [20,21,22,23]
In comparison to their male counterparts, female adolescents had a higher prevalence of overweight and obesity, according to this study. More female in this study were less physically active and were consuming unhealthy diet compared to their male counterparts. This finding was in agreement with many studies in developing countries where females are reported to be more overweight or obese when compared to their male counterparts. A study done in Ethiopia involving 451 high school students reported a prevalence of overweight and obesity of 19.7% and 12.4% among female and male, respectively. A study done in Uganda and Ghana by [16], found that a prevalence of overweight or obesity of 10.4% among girls and 3.2% among boys, and0.9%and0.5%obesityonlyamonggirls and boys, respectively [24,25,26,27]. Rapando etal [12] reported prevalence of overweight of 16.96% among males and 20.59% among females respectively. Because height is a denominator in calculating BMI, the fact that males are tallerthan femalescouldhave contributed to their low BMI. This study found that adolescent boys were taller than adolescent girls with maximum height in boys of 1.85 meters compared to maximumheightingirlsof1.77meters.In addition, decreased physical activity in females than in male adolescents may result in storing of calories, which contributes to their increased weight [17; 18; 19,28,29,30,31,32].
In this study, private schools contributed to 11% of overweight and obese adolescents whereas public school contributed to 4% respectively. Private schools are of higher socioeconomic status, offer better diet but lack space for recreation. This finding is consistent with several similar studies among adolescents indevelopingcountries.Adesina etal.,[20] and [12] reported high prevalence of overweight and obesity among adolescent inprivateschoolswhencomparedtothose in publicschools.
CONCLUSION
This study found high prevalence of overweight and obesity among secondary school adolescents in Bushenyi-Ishaka municipality.
REFERENCES
1. Haslam, D. (2007). Obesity: a medical history. Obesity Reviews, 8(Suppl 1), 31–36.
2. Eknoyan, G. (2006). A history of obesit , or how what was good became ugly and then bad. Advances in Chronic Kidney Disease, 13(4), 421–427. https://doi.org/10.1053/j.ackd.2006.0 7.002
3. Ford, N. D., Patel, S. A. and Narayan, K. M. V. (2017). Obesity in Low- and Middle-Income Countries: Burden, Drivers, and Emerging Challenges. Annual Review of Public Health, 38, 145–164. https://doi.org/10.1146/annurevpublhealth-031816-044604
4. Pulgaron, E. R. and Delamater, A. M. (2014). Obesity and type 2 diabetes in children: Epidemiology and treatment. Current Diabetes Reports, 14(8), 508–529.
5. Kish, Leslie (1965): Survey Sampling. New York: John Wiley and Sons, Inc. p. 78-94
6. Schlesselman,J.J.(1982).Case-Control Studies. New York: Oxford University Press.
7. Tluway,F.D.,Leyna,G.H.andMmbaga, E. J. (2018). Magnitude and factors associatedwithoverweightandobesity among adolescents in semi-rural area of Babati district, Tanzania. Tanzania JournalofHealthResearch, 20(2), 1–9. https://doi.org/10.4314/thrb.v20i2.2
8. Uganda National Council for Science and Technology. (2014). Research registration and clearance policy guidelines https://uncst.go.ug/
9. Adamo,K.B.,Sheel,A.W.,Onywera,V., Waudo, J., Boit, M. and Tremblay, M. S. (2011). Child obesity andfitness levels among Kenyan and Canadian children from urban and rural environments: A KIDS-CAN Research Alliance Study. International Journal of Pediatric Obesity, 6(2), 225–232.
https://doi.org/10.3109/17477166.20 10.543683
10.Reddy, S. P., Resnicow, K., James, S., Funani, I. N., Kambaran, N. S., Omardien, R. G. and Mbewu, A. (2012). Rapid increases in overweight and obesity among South African adolescents: Comparison of data from the South African national youth risk behaviour survey in 2002 and 2008. American Journal of Public Health, 102(2), 262–268.
11.Anteneh, Z. A., Gedefaw, M., Tekletsadek, K. N., Tsegaye, M. and Alemu, D. (2015). Risk Factors of Overweight and Obesity among High School Students in Bahir Dar City, North West Ethiopia: School Based Cross-Sectional Study. Advances in Preventive Medicine, 2015(December), 1–9.
https://doi.org/10.1155/2015/294902
12.Rapando, C., Nyagero, J. and Wakhu, F. (2017). Feeding habits associated with overweight and obesity amongst secondary school students in private and public schools in Langata Nairobi Kenya. International Journal of Scientific and Research Publications, 7(5), 498–505.
13.Mushengezi, B. and Chillo, P. (2014). Association between body fat composition and blood pressure level among secondary school adolescents inDaresSalaam,Tanzania. PanAfrican Medical Journal, 19, 1–12. https://doi.org/10.11604/pamj.2014. 19.327.5222
14.Kikafunda, J. and Agaba, E. (2014). Malnutrition amidst plenty: An assessment of factors responsible for persistent high levels of childhood stunting in food secure western Uganda. African Journal of Food, Agriculture, Nutrition and Development, 14(5), 2088–2113.
15.Lara,C.,Liesbeth,C.andJoachim,D.W.
(2017). From corn to popcorn? Urbanization andfood consumptionin sub-Sahara Africa: Evidence from rural-urbanmigrantsinTanzania (No. LICOS Discussion Paper, No. 390). Katholieke Universiteit Leuven, Belgium.
16.Pengpid, S. and Peltzer, K. (2016). Overweight, obesity and associated factorsamong13-15yearsoldstudents in the association of Southeast Asian Nations member countries, 2007-2014. Southeast Asian Journal of Tropical MedicineandPublicHealth, 47(2), 250–261.
17.Butt, J., Weinberg, R. S., Breckon, J. D. and Claytor, R. P. (2011). Adolescent physical activity participation and motivational determinants across gender, age, and race. Journal of Physical Activity and Health, 8(8), 1074–1083. https://doi.org/10.1123/jpah.8.8.107 4
18.Lenhart, C. M., Hanlon, A., Kang, Y., Daly, B. P., Brown, M. D. and Patterson, F. (2012). Gender Disparity in Structured Physical Activity and Overall Activity Level in Adolescence: Evaluation of Youth Risk Behavior Surveillance Data. ISRN Public Health, 2012, 1–8.
19.Sember, V., Jurak, G., Kovač, M., Đurić, S. and Starc, G. (2020). Decline of physical activity in early adolescence: A3-yearcohortstudy. PLoSONE, 15(3), 1–15.
20.Adesina,A.F.,Peterside,O.,Anochie,I. and Akani, N. A. (2012). Weight status of adolescents in secondary schools in port Harcourt using Body Mass Index (BMI). Italian Journal of Pediatrics, 38(1),1–8. https://doi.org/10.1186/1824-728838-31.
21.N Gloria, AO Yamile, E Agwu (2022) Prevalencepatternsofbacterialurinary tract infections among febrile children under-five years of age at Kampala International University Teaching Hospital. IDOSR Journal of Biology, ChemistryandPharmacy 7 (1), 41-55.
22.BPetrus,ENzabandora,EAgwu (2022). Evaluation of the bacterial agents
associated with PID among women of reproductive age at Kampala International University Teaching Hospital. IDOSR Journal of Biochemistry, Biotechnology and Allied Fields 7 (1), 64-74.
23.OA Hussein, M Joy, JN Musiime (2022).Evaluation of the factors associated with immediate adverse maternal outcomes among referred women in labor at Kampala International University Teaching Hospital. IAA Journal of Biological Sciences 8(1), 228-238.
24.OA Hussein, M Joy, JN Musiime (2022). Factors associated with Immediate Adverse Maternal Outcomes among Referred Women in Labor attending Kampala International University Teaching Hospital IAA Journal of AppliedSciences 8 (1), 117-125.
25.MWilberforce,OJohn,KClaude(2022). Evaluation of the Acute Toxicity and Hematological Effect of Aqueous Extract of Albizia chinensis (Osbeck) Merr Stem Bark in Streptozotocininduced Diabetic Wistar rats. IAA Journal of Biological Sciences 9 (1), 146-158.
26.TB Yves, OE Dafiewhare, LA Charles, E Sebatta (2022). Electrocardiographic PatternamongHeartFailurePatientsat Kampala International University TeachingHospital,Ishaka,Uganda.IAA Journal of Biological Sciences 9 (1), 159-165.
27.HusseinOsman Ahmed, JoyMuhumuza and MusiimeJamesNabaasa(2022). The compositeimmediateadversematernal outcomes among women in labor referred to Kampala International University Teaching Hospital IAA Journal of Scientific Research 8(1):149156.
28.Daniel Asiimwe, Herman Lule and Izimba Daniel (2022). Epidemiology of Assault Injuries among Trauma Patients Presenting at Kampala International University Teaching Hospital and Jinja Regional Referral Hospital. INOSR Applied Sciences 8(1):111-119.
29.E.O.Ikuomola,O.S Akinsonmisoye, R.O. Owolabi and M. B. Okon (2022). Assessment of Toxicity Potential of
SecnidazoleonReproductiveSystemof Male Wistar Rats. INOSR Applied Sciences 8(1):120-133.
30.Ugwu Okechukwu, P. C., Onwe, S. C. and Okon, M. B. (2022). The effect of Methanol Extract of Rauwolfia vomitoria on Lipid Profile of Chloroform intoxicated Wistar Albino Rats.IAAJournalofScientificResearch, 8(1), 73-82
31.E.O.Ikuomola,O.S.Akinsonmisoye, R.O. Owolabi and M. B. Okon (2022).Evaluation of the Effect of Secnidazole on Sperm Motility,
Morphology, Viability and Total Sperm Count of Wistar Rats. INOSR Experimental Sciences 8(1): 74-83, 2022.
32.E.O. Ikuomola , O.S Akinsonmisoye, R.O. Owolabi and M. B. Okon (2022).Evaluation of the effect of secnidazole on the histology of the testes and epididymis of male Wistar rats.INOSRExperimentalSciences8(1): 84-94, 2022.