International Journal of Advanced Research in Computer and Communication Engineering Vol. 10, Issue 8, August 2021 DOI 10.17148/IJARCCE.2021.10816

International Journal of Advanced Research in Computer and Communication Engineering Vol. 10, Issue 8, August 2021 DOI 10.17148/IJARCCE.2021.10816
Department of Electronic Engineering, University of Nigeria, Nsukka, Enugu State, Nigeria1, 2, 4
Department of Computer Science, Federal College of Education, Okene Kogi State, Nigeria3
Abstract: Different path loss models have been predicted for different locations. Nevertheless, none of these models can be regarded as a superior model, because environmental factors play a vital role in the path loss of every environment. In this paper, signal attenuation prediction models for Global System for Mobile Communication (GSM) networks in the University of Nigeria, Nsukka for four different networks namely Airtel, Globacom, Mobile Telecommunication Network (MTN), and 9mobile networks were proposed. Field measurements based on the signal strength and path loss of GSM operating at 1800MHz were carried out for the development of the proposed attenuation model, in the area for the four GSM networks. The measured data for signal strength and path loss were used to develop the models. To formulate the proposed attenuation models for the considered networks in the area, the data collected during field measurements were analyzed using linear regression analysis. The proposed models were compared with the measured and four popular standard attenuation models such as Hata, Cost 231-Hata, SUI, and ECC-33. The path loss for the standard empirical models was gotten from simulation using a standard MATLAB 2016b package The results showed that the proposed attenuation models performed better than all the considered models based on its least error value.
Keywords: GSM, path loss, attenuation models, linear regression, received signal strength
In wireless networks, the amount of signal being transmitted from the Base Transceiver Station (BTS) is not equal to the total signal received by the Mobile Station (MS). The disparity between the power from the source and the power received is termed path loss. There is usually an increase in path loss when the distance between the transmitter and the receiver increases. The increase in path loss and reduction in signal strength concerning distance is influenced by various factors namely, the elevation of the antenna, the operating frequency of the networks, the distance between the transmitting and the receiving antennas, and other physical environmental factors of the region such as rainfall, snow, reflection, scattering, etc. [1].
Models for signal attenuation are very useful in the development of an efficient network, but these models caused cochannel interference if it is deployed outside the location in which it was developed, despite its high accuracy [2]. Hence, propagation environments affect the accuracy of path loss values prediction of wireless signals [3]. In university settings that are characterized by tall trees, and other physical structures, signal attenuation models are very important to estimate path loss for different networks. These will help to build robust networks in the campus environment for good signal reception.
The received power level of a network in a particular location is influenced by the topology along the signal propagation paths [4]. To come up with a stable and robust path loss model suitable for a particular location, it is germane to collect and analyse the parametric data from such an area. These data include the received signal strength and path loss. When an electromagnetic wave is propagated through space, the signal interacts with different physical environments. This phenomenon reduces the power level of the propagated electromagnetic waves. As a result of this, attenuation models that predict different environments are indispensable in network design for optimum performance.
Empirical models are those models obtained from experimental observations [5] which include:
International Journal of Advanced Research in Computer and Communication Engineering Vol. 10, Issue 8, August 2021 DOI 10.17148/IJARCCE.2021.10816
A. Hata Model.
Hata model is one of the popular empirical signal attenuation models developed from Hata graphical signal attenuation data proposed by Okumura [6]. The Hata model is limited by its range of frequency of operation (150MHz to 1500MHz). Also, the model is mainly used in urban areas to determine signal estimations using evaluated data devoid of any logical illustration. This model is completely based on measured data which doesn't have any analytical explanation to back up the model. The average path loss for the urban (PlossUrban), suburban (PlossSub-Urban), and open country (PlossOpen-Country) for the model are given in Equations (1)-(4) [7].
PUrban=69.55+26.16log(f)-13.82log(h)-a(h)+ Lossm(44.9-6.55log(h))log(d) 10101010 bb (1) a(h)=(1.1log(f)-0.7)h-(1.56log(f)mm0.8) 1010 (2)
PSub-Urbanf2 =PUrban-2(log())LossLoss5.4 1028 (3)
POpen-Countryf2 = PUrban -4.78(log())-18.33log(f)LossLoss40.94 1010 28 (4)
Where; f denotes the frequency of operation, and d represents the distance in kilometer (km) between the transmitter and the receiver antennas.
B. Cost 231-Hata model. Cost 231-Hata model extended the Hata model for scientific frequencies of concern which ranges from 1500-2000 MHz [8]. The Cost 231-Hata model is used in predicting median signal attenuation loss and path loss estimations in mobile wireless communication systems [9]. For urban regions, the median path loss expression is given in equation (5) [10], [11], [12]
PLoss(dB) = 46.3+ 339log10(f) - 13.8(hb) - a(hr) + [44.9-655log10(hb)] log10 (d) +c (5)
Where; the frequency of operation is represented with f, the distance in kilometer from the transmitter to the receiver is given as d, the numerical value of c is equal to zero for suburban and rural environments, but 3 for an urban city. Also, hb and hr are the height for the source and the receiver respectively. The factor a(hr) for urban is given in Equation (6); a(h)2 = 3.2(log11.75(h))rr4.97 10 (6) While suburban is given in Equation (7); a(h)=1.1log(f)-0.75(h)-(1.58log(f)rr0.8) 1010 (7)
C. SUI model.
SUI which is an acronym for Stanford University Interim is a model built for three distinct macro-cellular surroundings for frequencies above 11800 MHz [10], [13]. Also, SUI model was developed for three different terrains namely A, B, and C. The terrain A, B, and C represent the densely populated region, suburban environment, and rural area, respectively. Terrain A has the maximum signal attenuation loss while B and C have moderate and least signal attenuation loss, respectively. For SUI model, the equations that illustrate the path loss are given in equations (8) - (13) [14], [15].
(9)
International Journal of Advanced Research in Computer and Communication Engineering Vol. 10, Issue 8, August 2021 DOI 10.17148/IJARCCE.2021.10816
hr
X =-20log;forterrainsC 10 h 2 (13)
where; the connection distance is represented with d, do is the starting distance, λ is the wavelength, the frequency of operation in MHz is given by f, ht and hr stand for the elevation of the source and the receiver respectively, the path loss exponent is denoted with γ, while the value of S ranges from 8.2 to 10.6 dB which is the log normally spread quantities for shadow loss caused by trees and other clutter on propagation path. For SUI model the parameters a, b, and c have invariable values which depend on the category of terrain as given in Table 1.
Table 1 SUI model standards for different terrain [16], [7]
Model Parameter Terrain A Terrain B Terrain C
A 4.6 4.0 3.6 bm 1 0.0075 0.0065 0.005 c(M) 12.6 17.1 20
D. ECC-33 model.
ECC-33 model was used to estimate signal attenuation for frequency above 3GHz [17]. The model is based on the analysis between the 3.4 and 3.8 GHz bands. The ECC-33 model determines path loss with the Equation given in (14) [16], [6].
PECC-33=A+A- G- G LossFree-SpacebmTxRx (14)
Where, AFree-Space, represents the free space reduction in signal (dB), Abm, is the fundamental signal attenuation loss (dB), GTx and GRx are the satellite transmitting and receiving antenna gains for the moderate metropolis, respectively. Where, 1010c A =92.4+20log(d)+20log(f) FreeSpace (15) A2 =20.41+9.83log(d)+7.894log(f)+9 c.56(log(fc))bm101010 (16) ( ) h 2 t GTx=log13.958+5.8log(hr)) 1010 200 (17) ( )( ) G=42.57+13.7log(f)log(h)Rxcr0.585 1010 (18)
The frequency in GHz is represented with fc, the link distance in kilometers is the d, ht in meters denotes the height of the transmitting antenna while the receiving antenna height from the ground in meters is represented with hr
The signal attenuation exponent model is the most straightforward approach for signal propagation estimation. To consider the effect of arbitrary shielding which occurs over numerous numbers of measurements, the Log-normal distribution is employed. There would have been generally conception that path loss is the same at all distances from the transmitter to the receiver if the signal attenuation model failed to consider shadowing effects [18]. The signal attenuation model for Log-normal shadowing is given in equation (19) [19], [20]. d P(d)i = P(d)+ LossLosso10nlog+X i δ do
(19)
Where represents the arbitrary shading impact and (δ) signifies standard deviation while n represents the signal attenuation exponent. Within any given macro cell the arbitrary shading impact varies randomly from one location to another [21]. While PLoss (di) is the signal attenuation gotten from field measurements and PLoss(do) is the reference
δX
International Journal of Advanced Research in Computer and Communication Engineering Vol. 10, Issue 8, August 2021 DOI 10.17148/IJARCCE.2021.10816
path loss at the closest distance do. The closest reference distance (do), the path loss exponent n, and the standard deviation (δ) are used to illustrate statistically the shadowing effect between the transmitter and the receiver.
To predict the model, data collected from field measurements at an interval of 100m from the base stations were analysed using linear regression. For all the received signal strength measured in the field, the corresponding measured and proposed path loss was gotten using the expression in equations (20) and (21) respectively [22], [23]. P P(d)T = Loss-Exact10logiPR
(20)
Where, the parameter, PLoss-Exact (di) represents the exact signal attenuation whereas, the PT and PR are the transmitting and the receiving power levels, respectively. d P(d)i =P(d)+ LossLosso10nlogido
(21)
Where, PLoss(di) and PLoss(do) are the predicted path loss, and the reference signal attenuation, respectively. The measurements were taken at a minimum distance of 100 m (i.e d0) from the base station to the maximum considered distance of 1000m. While n is the signal attenuation exponent calculated according to [24] as: N2 e(n)=P(d)-P(d)Loss-ExactiLossi i=1 (22) e(n)= 0 n
(23) 2 1 δ=P(d)-P(d)Loss-ExactiLossi N (24) 2 P(d)-P(d)MSELoss-ExactiLossi = N-1
(25)
Where, N donates the total measured distance in meters that was considered during measurements while MSE is the Mean Square Error. Analysis of the predicted and measured path loss for MTN using data obtained from field measurements is as follow: At distance d1 =100m, the Power received PR= 51dBm. Therefore, PR=10 51=794x 6dB. While power transmitted P�� is 20W, thus P�� =13.01dB. Hence the measured path loss value in dB becomes: ( ) P13.01 T P=10log=10log=62dB Loss-Exact d1-6 PR7.94x
The predicted path loss is given as: ( ) d100 i =+10nlog=62+10nlog=62+0=62dBPPd LossLoss0100 d0
Where ( ) d PLoss 0 is the path loss at a minimum distance (d0 ) which is 62dB while d0 is 100m
At distance, =200m, d2 Power received, =-55dBm PR hence, ==-5.5-6dBP103.16x R Therefore, the measured path loss is given as: ( ) 13.01 PT -Exact=10log=10log=66dB d PLoss 2 -6 PR 3.16x
The predicted path loss:
International Journal of Advanced Research in Computer and Communication Engineering
Vol. 10, Issue 8, August 2021 DOI 10.17148/IJARCCE.2021.10816
( ) ( ) d200 i =+10nlog=62+10nlog=62+3.01n dddBPPLossLoss20100 d0
Similar evaluations were carried out in determining the measured and predicted path losses for all the networks at various distances while equations (22), (23), and (24) were applied to determine the value of n and δ. Empirical models for all the networks were obtained by substituting the values of PLoss(do), n, and δ into equation (19). Hence the predicted signal attenuation models for the considered networks are presented in the equations (26), (27), (28) and, (29):
( ) Loss(MTN)10 P(d)=62+10*3.52logD +6.79dB (26)
( ) Loss(9mobile)10 P(d)=60+10*2.7logD +4.9dB (27)
( ) Loss(Globacom)10 P(d)=68+10*2.76logD +3.74dB (28)
( ) Loss(Airtel)10 P(d)=69+10*3.12logD +5.74dB (29) Where; D = di/d0
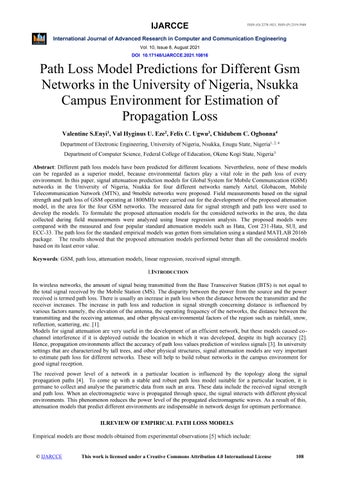
To come up with a better signal attenuation model for different GSM networks in the selected areas in the campus, field measurements were conducted in the area. The University is situated in Nsukka metropolitan with an approximate land size of 871.38 hectares [25]. The location can be characterized as a suburban region due to the presence of tall buildings, trees, a good number of human beings, and vehicles. The set of equipment used during the data collection exercise is Hp laptop for data logging, mobile phone, spectrum analyzer (SPECTRAN HF 6080 model), Global Positioning System (GPS), Google earth, uninterruptible power supply (UPS), and a car. The Hp laptop installed with network communication software (Aaronia) was used to monitor the signal strength of the networks when connected to a spectrum analyzer. A mobile phone installed with net monitor software was deployed for proper identification of the service provider that owns each network base station visited in the area. GPS was employed to capture the distance in meters (m) from the base station to the receiver from 100 m – 1000 m at the interval of 100 m. Google earth software was installed in the Hp laptop to capture the information about the terrain of the campus. UPS was used as an alternate source of power in case of any power failure while a car was used for mobility during the driving test.
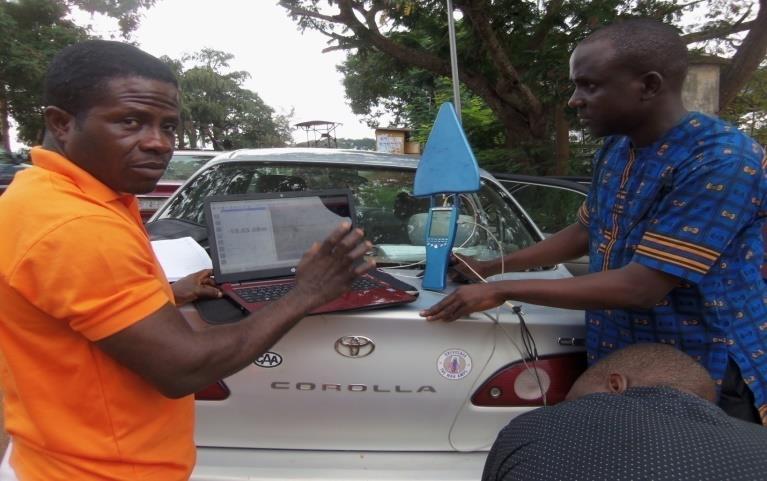
The received signal strength of the considered different GSM networks at 1800 MHz was measured while moving away from the base station. A total of 360 samples were collected from each network and the mean of the sample was used to analyzed and employed in signal attenuation prediction. Fig. 1 shows the experimental set up while Fig. 2 presents the sample of the collected network signal strength reading during the field measurement.
Fig. 1 Experimental set up
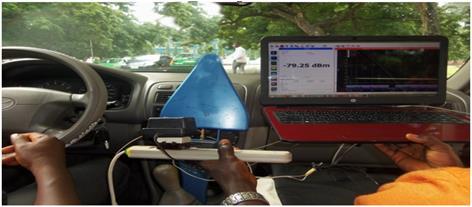
Fig. 2 Sample of data logging
This section presents the results and analysis of the graphs of the measured, predicted models for the different networks, and the simulated path loss for the considered standard empirical models The standard empirical signal
International Journal of Advanced Research in Computer and Communication Engineering Vol. 10, Issue 8, August 2021 DOI 10.17148/IJARCCE.2021.10816
attenuation models are Hata, Cost 231-Hata, SUI, and ECC-33 models. The relationship among the graphs was used to predict the best model for the University concerning the measured path loss.
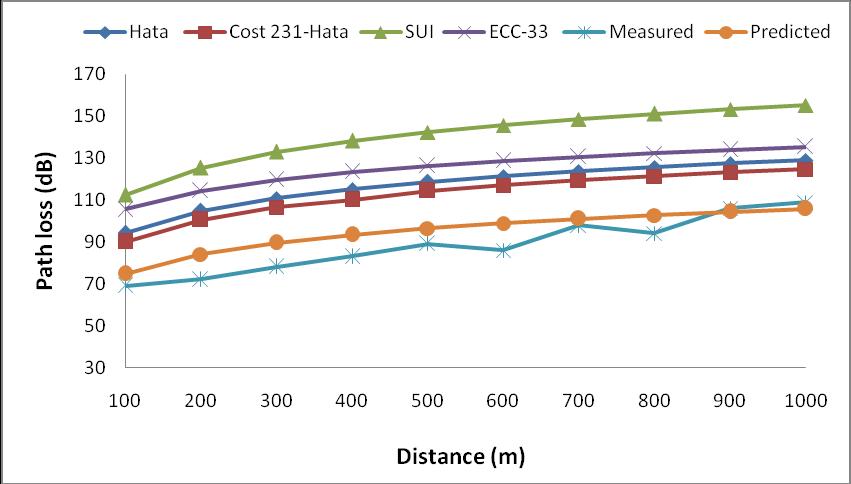
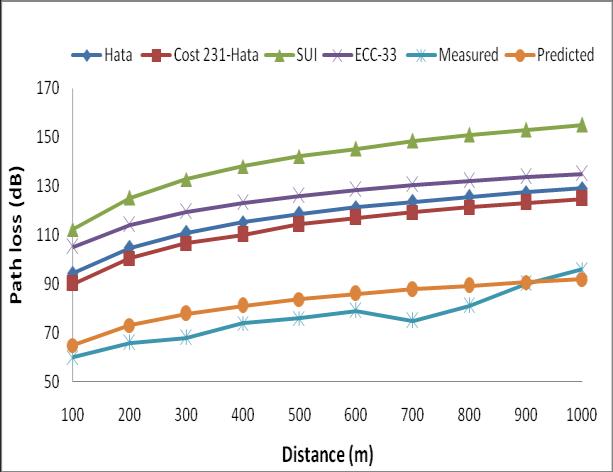
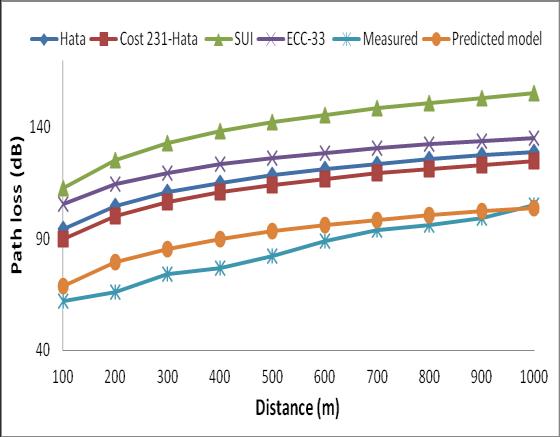
Fig. 3 Empirical path loss models, measured and Fig. 4 Empirical path loss models, measured predicted model for MTN network and predicted model for GLO network
Fig. 5 Empirical path loss models, measured and Fig. 6 Empirical path loss models, measured and predicted model for airtel network predicted model 9mobile network
Table 2 Statistical Representation for the Performance Parameters
SUI ECC-33 Predicted
MTN 32.90 34.68 28.60 30.15 56.13 59.00 40.88 43.09 12.21 12.87 Glo 29.01 30.58 24.66 26.00 52.13 54.95 36.84 38.84 5.69 6.00 Airtel 29.11 30.68 24.80 26.15 52.35 55.19 37.05 39.06 9.26 9.76 9mobile 28.93 30.50 24.59 25.92 52.12 54.94 36.77 38.76 8.28 8.72
Fig., (3), (4), (5), and (6) presented the graphical results from the proposed models (MTN, Glo, Airtel, and 9mobile) networks, the measured and empirical path loss models against distance. As can be seen from the proposed models, the Airtel network experienced the least signal loss of 60 dB at the reference distance while MTN, Glo, and 9mobile have
IJARCCE This work is licensed under a Creative Commons Attribution 4.0 International License 113
International Journal of Advanced Research in Computer and Communication Engineering Vol. 10, Issue 8, August 2021 DOI 10.17148/IJARCCE.2021.10816
62 dB, 68 dB, and 69 dB, respectively. When the distance increases the path loss rises with a quantity of35log10(D) for MTN network and 27log10(D), 31log10(D), and 28log10(D) for 9mobile, Airtel, and Glo networks, respectively. Also, there were fluctuations in the signal strength from the collected field data. This can be attributed to the effect of the physical environment on the campus on the propagated signals. Furthermore, it can be observed that the signal strengths from the four networks are inversely proportional to distance whereas, the path loss is directly proportional to distance.
To validate the proposed models, the predicted models (i.e, the proposed models) were compared with the measured path loss and the four popular signal attenuation models simulated in this work. As can be observed from the graphs, the predicted models gave better results with little variation from the measured path loss than the compared universal empirical models. Thus, no universal model can suit perfectly into a particular area better than a model developed specifically for that environment. Also, it can be observed from the plots that the SUI and ECC-33 models gave overestimated values to the measured path losses. The models that were predicted gave the closest values to the path loss that were measured, thus, the most appropriate model for the studied environment. From the result presented in table 2, the predicted models have least mean square error and standard deviation.
This work has proposed signal attenuation models for the four GSM networks operating at 1800MHz in the University of Nigeria, Nsukka campus. The networks are MTN, Glo, Airtel, and 9mobile. The proposed models were obtained by the application of the Log-normal shadowing model with the measured collected data from the locations under consideration. The proposed path loss models are given as; PL(Airtel)(d) = 74.74 + 31.2log10(D), PL(9 mobile)(d) = 64.9 + 27log10(D), PL(Globacom)(d) = 71.74 + 29log10(D), and PL(MTN)(d) = 68.78 + 35log10(D) for Airtel, 9mobile, Glo and MTN networks, respectively. The predicted models were found to be the most fitted among the other four popular standard empirical signal attenuation models for the considered locations. The result showed that the average predicted path loss for the MTN network was 91.74 dB whereas, that of Glo, Airtel, and 9mobile networks reordered 90.76 dB, 95.08dB, and 82.61dB, respectively. The predicted models have the least mean square error and standard deviation than any of the standard empirical path loss models appraised. These models when employed within the University environment can reduce the path loss thereby; address the regular network fluctuation experienced by the subscribers in the area.
Our thanks go to the Management of Centre for Basic Space Science (CBSS), University of Nigeria, Nsukka branch for providing us with their equipment used in carrying out field measurements for this work.
[1] T. K Sarkar et al, “A Survey of Various Propagation Models for Mobile Communication,” IEEE Antennas and Propagation Magazine, vol.45, pp. 51-82, 2003.
[2] Ogunjide et al, “Suitable Propagation Models for 2.4 GHz Wireless Networks: Case Study of Gidan Kwano Campus, FUT MINNA,” ABUAD Journal of Engineering Research and Development (AJERD), 3 (1), pp. 156–165,2020
[3] Z. K. Adeyemo et al., “Development of a Path-loss Prediction Model Using Adaptive Neuro-fuzzy Inference System,” Internaional journal of wireless and Microwave Technologies,vol. 6, pp.40-54, Nov 2019.
[4] E. Endurance and C. Igbonoba, “Investigated Performance of Okumura-Hata Model For Dvb-T2 Signal Propagation In Nigeria,” International Journal of Recent Engineering Science, 8 (2), pp. 10–15, 2021.
[5] M. U. Onuu and E. M. Usanga “Path Loss Prediction for Some GSM Networks for Akwa Ibom, State Nigeria,” Global Journal of Researches in Engineering (D), vol. 17, 2017.
[6] Enyi, et al. “Outdoor Environment Gsm Network Path loss Measurements and Forecasting at Nsukka Urban Using Regression Analysis Model.” International Journal of Engineering Science Invention (IJESI), Vol. 10(07), PP. 47-55, 2021.
[7] V. S. Enyi, M. A. Ahaneku, and U. N. Nwawelu. "Improved Log-Normal Shadowing Model for GSM Networks Pathloss Prediction at the University of Nigeria, Nsukka." International Conference on Engineering Adaptation and Policy Reforms, 1 (1), 2019, pp. 77-88.
[8] Y. Singh, "Comparison of Okumura, Hata, and COST-231 Models on the Basis of PathLoss and Signal Strength," International Journal of Computer Application, vol.59, pp. 37-41, 2012.
[9] S. Bolli, and M.Z.A Khan, “A Novel LMMSE Based Optimized Perez-Vega Zamanillo Propagation Pathloss Model in UHF/VHF Bands for India,” Progress in Electromagnetics Research B, vol. 63, pp. 17–33, 2015.
[10] N. Chowdhary et al, “Study and Comparison of Radio Wave Propagation Model for different Antenna,” International Journal of Engineering Trends and Technology, vol. 40, pp. 141–146, 2016.
[11] I. E. Linus, H.C. Madu, R. U. Onuoha, and G. Ogburie, “Optimization of Cost 231 HATA Model For Propagation Path Loss Measurements in Lagos,” International Journal of Engineering Science Invention (IJESI), vol. 10(3), pp. 14–23, 2021
[12] A. Zreikat, and M. Djordjevic,” Performance Analysis of Path loss Prediction Models in Wireless Mobile Networks in Different Propagation Environments,” Proceedings of the 3rd World Congress on Electrical Engineering and Computer Systems and Science (EECSS'17),June 2017.
[13] S.A. Mawjoud, “Path Loss Propagation Model Prediction for GSM Network Planning,” International Journal of Computer Applications, vol 84, pp. 30-33, 2013.
[14] C. Bruno, et al, “Comparison between known Propagation Models using Least Squares Tuning Algorithm on Comparison between known Propagation Models using Least Squares Tuning Algorithm on 5. 8 GHz in Amazon Region Cities,” Journal of Microwaves, Optoelectronics and Electromagnetic Applications, vol. 10, pp. 106–113, 2011.
International Journal of Advanced Research in Computer and Communication Engineering
Vol. 10, Issue 8, August 2021 DOI 10.17148/IJARCCE.2021.10816
[15] N.K. Prasad and S.P Priyanka,” Propagation Models for Next Generation Networks inNS-3: A Survey,” International Journal of Engineering Research and Development, vol. 10, pp.54-60, July, 2014.
[16] F. C. De Oliveira, and J. M. C. Brito, “A Comparative Study of Performance Analysis of Empirical Propagation Models for NBIoT Protocol in Suburban Scenarios,"The Twentieth International Conference on Networks, pp. 20–26, 2021.
[17] A. K Koduri, et al “Propagation Characteristics of a Mobile Radio Channel for Rural, Suburban and Urban,” PASJ International Journal of Electronics & Communication, vol. 2, pp. 30–42, 2014.
[18] E. Akujobi, et al, “Path Loss Characterization of 3G Wireless Signal for Urban and Suburban Environments in Port Harcourt City, Nigeria,” International Research Journal of Engineering and Technology, vol. 3, pp. 16-22, 2016.
[19] W. Manan, et al.,” Indoor To Indoor And Indoor To Outdoor Millimeter Wave Propagation Channel Simulations At 26 Ghz, 28 Ghz And 60 Ghz For 5G Mobile Networks,” The International Journal of Engineering and Science (IJES) ,vol 7, pp.8-18, 2018.
[20] V. Erceg, et al.,”An Empirically Based Path Loss Model for Wireless Channels in Suburban Environments,” IEEE Journal on Selected Areas in Communications, vol.17, pp. 1205-1211, July 1999.
[21] D. Agadi and T. S. Umar, “Path Loss Propagation Model Prediction for GSM Mobile Networks in Nigeria,” International Journal of Latest Engineering Science (IJLES), .2 (6), pp, 40–46, 2019
[22] D. A. Tonga, “Path Loss Propagation Model Prediction for GSM Mobile Networks in Nigeria,” First International Conference on Information Technology, Communications and Computing (ICITCC 2017), Dec 2017.
[23] C. Bhaskaraiah and G. Srinivasulu, “Pathloss Computation and Comparison using Empirical Outdoor Propagation Models to S.V. University Campus for Mobile Communication,” International Journal of Scientific Engineering and Technology Research, vol. 4, pp. 87398744, Oct 2015.
[24] N. David, “Campus Wide Network for University of Nigeria, Nsukka Campus,” Nigerian Journal of Technology, vol.29, pp. 52–60, 2010