www.iaajournals.org
Mujuni et al
IAAJournalofManagement10(1):16-44,2022. ISSN:2636-7300
©IAAJOURNALS
Ethical Leadership and Job Performance of Teachers in Secondary Schools in Kyabugimbi Sub-County, Bushenyi District, Uganda.
Benon, Tumwesigye Mujuni, Wilson Mugizi, Augustina Ogaga Dafiewhare
DepartmentofEducation,KampalaInternationalUniversity,Uganda
ABSTRACT
This study analysed the relationship between ethical leadership and job performance of teachers in secondary schools in Kyabugimbi Sub-County, Bushenyi District. The specific objectives of the studywere to examine the relationshipbetween ethical guidance andjob performance of teachers; to assess the relationship between power sharing and job performance of teachers; and to evaluate the relationship between the integrity of head teachers and job performance of teachers in Secondary schools in Bushenyi District. The study adopted a cross-sectional survey research design on a sample of 124 respondents. Data was collected using a questionnaire survey and an interview guide. Quantitative data were analysed using frequencies, percentages means, correlation and regression. Qualitative data were analysed using content analysis. The results revealed that performance of teachers, head teachers providing of ethical guidance, ensuring of power sharingandpersonalintegrityweregood.Inferentialresultsrevealedthatethicalguidance, powersharingandintegrityhadapositiveandsignificantinfluenceonjobperformanceof teachers.Itwasconcludedthatethicalguidancebyheadteachersis apre-requisiteforjob performance of teachers, power sharing in schools is imperative for job performance of teachers, and integrity of head teachers is paramount for job performance of teachers. It was thus recommended that head teachers in secondary schools should offer ethical guidanceinadministrationofschools,promotepowersharingandexhibitintegrityintheir administration.
Key words: Jobperformance,Bushenyidistrict,Ethicalguidance,Leadership
INTRODUCTION
Different stakeholders including parents, practitioners and policy makers concur that the key to improving public education is having highly skilled and effective teachers in all classrooms [1] This is because teachers have paramount roles to play in preparing young people not only to face the future with confidence but to build it with purpose and responsibility. Since its inception in the1940s,UNESCOhasmonitoredthejob performanceofteachers,assessingtrends and developments in education and educational policies affecting their performance[2].Nevertheless, [3]reveals that a trend of decline has been noted in the job performance of teachers in public schools in many countries, Europe, Asia andmostofsubSaharanAfrica. Decline in the job performance of teachers is a global phenomenon. In
western world where teachers traditionally enjoyed high status that motivated their commitment to performance, today there are also reports about decline in their performance [4] Since the early 2000s for example, the education policies of the United States of America have aimed at identifying and punishing individual teachers for students’ poor achievement, creating a culture that blames and shames teachers. However,someofthemostcrucialfactors that have been responsible for decline in the job performance of teachers include pay for teachers, their benefits and their working conditions [3]. According to [5], in many countries especially in the developing world of Africa, the challenge of decline in the job performance of teachers is higher. A case in point is of public schools in Nigeria where there is a
16
www.iaajournals.org
tendency for teachers devoting more of their energies to trade-union matters for better conditions of service rather than attendingtothepupils.
In Uganda, formal education started with the coming of missionaries from 1877. However, teaching was being carried out under trees. Later, missionaries established schools which necessitated the establishment of teacher training schools to train teachers who would become professionals and these were equipped with both content and pedagogical skills [6]. However, until 1962 when Uganda attained independence, education was modelled along the British system of education as Uganda was a British protectorate [7]. During the time, teachers were treated with very high regard and produced excellent performance. Teachers enjoyed good welfare that included housing, medical care, bread and tea during break time. In addition, the school environment was conducive for teachers, motivating them to perform their duties [8]. Nevertheless, [8] indicates that the years 1971-1979 marked the beginning of decline in the job performance of teachers because the period was characterised by the turbulence of the regime at the time, which affected all sectorsoflifeincludingteacher’swelfare. Sincethen,thewelfareoftheteachershas been at its lowest level affecting their performance characterised by poor time management, absenteeism, and inadequate lesson preparations and syllabus coverage, poor pupil discipline management and inadequate teaching methods.
Different scholars [9-13] have sought to establish factors that affect employee performance. Duze [9] investigated the leadership styles of principals and the effect on job performance of teachers in Delta State of Nigeria. The findings revealed that teachers’ job performance was highest under democratic and lowest underautocraticprincipals. Liu etal.[10] examined the relationships between ethical leadership, as perceived by subordinates and task performance in a Chinese manufacturing firm. The results
Mujuni et al
revealed that there was a positive significant relationship between ethical leadership as perceived by subordinates and task performance. Malik et al. [11] carried out a critical review on ethical leadership and performance of employees. The results revealed that a direct relationship between ethical leadershipandemployees’performance. Saani [12] investigated the influence of compensation and teacher supervision on teacher work performance with head teachers and teachers in private basic schools in the Ashaiman community of Tema, Ghana as units of analysis. Regression results indicated that compensation had a positive significant effect on work performance. Subroto [13] studied the influence of teacher's income on their performance in Surabaya City in Indonesia. The findings indicated that teachers’ salaries not only influenced their performance but also the quality of education. The studies above show that factors affecting employee performance include leadership styles, ethical leadership, and compensation / teachers income. However, whereas the factors namely leadership styles and compensation / teachers income were investigated in the context of schools, ethical leadership was not. This contextual gap attracted this study to be carried out in the context of schools in Uganda to establish how head teachers ethical leadership related to job performance of teachers in secondary schools.
This study was underpinned by the Leader–MemberExchange(LMX)Theoryby [14]. LMX suggests that approaching leadership as an exchange relationship which develops within the vertical dyad over time during role making activities leads to high exchange relationshipsIn the relationship, the degree of latitude a superior grants to a member to negotiate his/ her role is predictive of subsequent behaviour on the part of both superior and member [15]. LMX, high-exchange relationships characterise high-level of trust, liking, and respect (employeremployee relationships) and involve expectations of mutual exchange. The
17
www.iaajournals.org
leader provides outcomes desired by subordinates, such as interesting tasks, additional responsibilities, and larger rewards and the subordinates reciprocate with commitment to work and loyalty to the leader [16] Exchange relationships develop gradually over time and reinforced by the behaviour of the leader and the subordinates [17]. Consequently, employees may increase their work effort for the organisation, hence employee improved performance. LMX suggest that if a leader provides ethical leadership to employees, it may lead to improved performance. This theory was the basis for relating ethical leadership and job performanceofteachers.
Statement of the Problem
Effective job performance is important as far as learning of students is concerned. This because effectiveness of teachers attracts learning motivation, makes learningeasyandimprovesof behaviours oflearnersleadingtoacademicexcellence in schools [18]. Unfortunately, job performance of teachers in Kyabugimbiwas low as indicated by; absenteeism of teachers, teachers did not make schemes of work and lesson plans and hardly gave monthly tests and continuous assignments to students (Bushenyi District DEO’s report, 2016). With respect to ethical leadership of the headteachers,itwasalsoachallenge.For instance, there was lack of transparency in financial accountability and absenteeism (Bushenyi District DEO’s report, 2016). Studies [19 -22] have investigated the relationship between ethical leadership and performance of employees.
Khalid and Bano [19] studying the influence of ethical leadership practices on individual task initiative in Pakistan reported that faculty supervisors’ integrity had a strong influence on their individual task initiative. Saeed et al. [20] in a study using employees of different educational institutions in Pakistan revealed that ethical behaviours of leaders had a positive impact on employees’ performance. Sabir et al. [21] in a study in organisations in different cities of Pakistan found a positive
Mujuni et al
significant relationship between ethical values of leaders and employee performance. Sugianingrat and Yasa [22] using employees of non-starred hotels in Indonesiashowedethicalleadershiphada positive significant effect on employee performance. However, the context of the studies above was outside Uganda and none of the studies was specifically done in secondary schools. Therefore, these gaps made it necessary for this study in the context of Uganda to investigate the relationship between ethical leadership andjobperformanceofteachers.
Aim of the study
The aim of this study was to analyse the relationship between ethical leadership and job performance of teachers in secondary schools in Kyabugimbi SubCounty,BushenyiDistrict.
Specific Objectives
Specifically,thisstudysought;
i. To examine the relationship between ethical guidance and job performance of teachers in Secondary schools in Kyabugimbi Sub County, BushenyiDistrict.
ii. To assess the relationship between power sharing and job performance of teachers in Secondary schools in Bushenyi District.
iii. To evaluate the relationship between integrity of head teachersandjobperformanceof teachersinSecondaryschoolsin BushenyiDistrict.
Research Questions
i. What is the relationship between ethical guidance and job performance of teachers in secondary schools in Kyabugimbi SubCounty,BushenyiDistrict?
ii. What is the relationship between power sharing and job performance of teachers in secondary schools in Kyabugimbi SubCounty,BushenyiDistrict?
iii. What is relationship between integrityof head teachers and job performance of teachers in secondary schools in Kyabugimbi SubCountyBushenyiDistrict?
18
www.iaajournals.org
Hypotheses
Thefollowinghypothesesweretested.
i. Ethical guidance has a significant relationship with job performance ofteachers.
ii. Power sharing has a significant relationship with job performance ofteachers.
iii. Integrity of head teachers has a significant relationship with job performanceofteachers.
Significance of the Study
This study might be useful to various stakeholders such as policy makers, school governing bodies, head teachers, teachers and also contribute to the body of knowledge. To policy makers this study will identify different ethical leadership practices that can inform policy making necessary for promoting ethical in schools. To governing bodies such as Boards of Governors and Parents
Research Design
Mujuni et al
Teachers Associations this study will inform them about various ethical leadership practices that they can introduce in schools to enhance job performance of teachers. For the head teachers this study will provide information on appropriate ethical leadership practices which they can benchmark for implementation in their schools. To the teachers it will inform them of about the ethical leadership practices they should expect from head teachers and also study will inform them of the level of their job performance. Thismighthelpthemtoreflectonhowto respond to their head teachers and also improve their performance. To the body of knowledge, this proposed study will help by providing researchers and the academia interested in studying ethical leadership and performance of employees.
RESEARCH METHODOLOGY
The study adopted the cross-sectional research design. The cross-sectional design allowed collection of data using differentmodesofdatacollectionsuchas self-administered questionnaires and face-to-face interviews [23]. Still, the studybeingcross-sectional,datagathered represented what was going on at a particular point in time thus helping to obtain useful data in a relatively short period saving time and costs of data collection [24]. Therefore, the crosssectional design helped in establishing the level of performance of teachers at the particular time but also helped in collecting data quickly and cheaply. The study adopted both the quantitative and qualitative approaches. The quantitative approach helped in collecting statistical data necessary for drawing inferences by relating the independent and dependent variables. Qualitative data supplemented the quantitative data by providing detailed information in form of statements from interviews for in-depth analysis.
Study Population
The population of the study was 141 comprising 127 teachers, 8 deputy head teachers and 6 head teachers. The
distribution of the population of teachers was 19 Bushenyi High School, 15 Kajunju Blessed Secondary School, 16 Kajunju High School, 17 Kibona Vocational Secondary School, 32 Kyabugimbi Secondary School and 28 Nyakabanga SecondarySchool(BushenyiDistrictDEO’s report,2016).
Sample Size
The sample of the study were 141 respondents that included 127 teachers and eight deputy head teachers for the questionnaire survey determined using census sampling since the total population was small. The six respondents for interviews were head teachers. The sample for interviews was determinedusingpurposivesampling.
Sampling Methods
The sample was selected using two sampling methods, namely census samplingandpurposivesampling.Census sampling is a sampling method that is used when the whole population is to be studied. Census sampling was used to select teachers and deputy head teachers while head teachers were selected using purposivesampling.Censussamplingwas used because the number of respondents was small. With purposive sampling, this is used to select particular people to
19
www.iaajournals.org
provide in-depth views since the study wasbothquantitativeandqualitative.The method of purposive sampling used was intensity purposive sampling. Intensity samplingallows theresearchertoselecta small number of rich cases that provide in-depth information and knowledge of a phenomenonofinterest[25].Theselected sample thus provided data for quantitativeandqualitativeanalyses.
Data Collection Instruments
The study adopted two data collection instruments that were namely; selfadministered questionnaire (SAQ) and an interviewguide.
Questionnaire.
Theself-administeredquestionnaire(SAQ) had close-ended items based on the nominal scale with appropriate alternatives given for section A and ordinalscalequestionitemsforsectionsB and C based on the five-point Likert from a minimum of 1 through 5. Closed questions were selected because they enabled the researcher to cover the respondents quickly and at reasonable cost [26]. The SAQ comprised sections A on background characteristics, Section B thedependentvariableandsectionsCthe independent variables. Section B on job performance of teachers (DV) covered four aspects, namely classroom teaching, management, discipline and regularity and interpersonal relations (25 items = 7, 5 & 7 items respectively) from [27].Section C on ethical leadership covered three dimensions that wereethical guidance (6 items), power sharing (6 items) and integrity (4 items) from [28]. The questionnaire helped in collecting data for quantitative data analysis.
Interview Guide
Interviewing is a qualitative data collection method by which the researcher will collect details of the respondent’s answer on the items of the study variables. Interviewing provides indepth information pertaining to participants’ experiences and viewpoints of a particular topic. Qualitative analysis from interviews added to the interpretation of data collected using the survey. Interviewing helped in providing
Mujuni et al
complete responses since the respondents provided in depth information necessary for deep explorationandclarity[29].Theinterview guide was a semi-structured interview guide for face to face interview sessions Using an interview guide qualitative data werecollectedfromheadteachers.
Procedure of Data Collection
The researcher collected data after the proposal had been approved and a letter for collection of data provided by the Institutional Research Ethics Committee (IREC). The researcher presented the letter to the head teachers who introduced the researcher to the deputy head teachers and teachers. The researcher personally distributed the research questionnaires and conducted interviews. Each questionnaire was accompanied by a letter explaining the general purpose of the study. In conducting interviews, the researcher recorded the respondents after obtaining consentfromtherespondents.
Quality Control
Validity of the Instrument. The study ensured content validity of the instruments for both the self-administer questionnaire and interview guide. In particular, validity of the interview guide was established through seeking the opinion of the supervisors on the relevance, wording and clarity of the items. Thereafter, the researcher calculated content validity index (CVI) for the questionnaire. To obtain CVI, inter judge was used with the help of two research consultants. Each of the judges provided opinions on a two point rating scale of Relevant (R) and Irrelevant (IR) to calculate the average index (CVI). The items considered irrelevant were deleted and substituted with relevant ones. The formulausedtocalculateCVIwas; CVI=n/N
Where: n = number of items rated asrelevant.
N= Total number of items in the instrument.
The CVI for the questionnaire was attained at and above 0.70 which is the benchmark in a survey. CVI results were asinTable1
20
Mujuni et al
Table 1: Validity Indices
Items Content Validity Index
PerformanceofTeachers
0.80
EthicalGuidance 0.92
PowerSharing 0.83 Integrity 0.88
Reliability of the Instrument
To attain the reliability of the instrument, the researcher made consultations with the supervisor. During data collection the researcher avoided personal biases, ensured meticulous record keeping, demonstrated a clear decision trail and ensured transparency during data collection [31] The reliabilities of items in
the various constructs were tested using Cronbach Alpha (α) method provided by SPSS. Reliability for the items in the differentconstructswasattainedat α =0.70 andabovewhichisthesuggestedminimum level [31]. This enabled collection of reliable data. The results are presented in Table 2.
Table 2: Reliability Results
Items Cronbach alpha (α)
PerformanceofTeachers
0.836
EthicalGuidance 0.740 PowerSharing 0.719 Integrity 0.712
Data Analysis
Quantitative data were processed by coding, entering them into the computer. Thereafter, frequencies, percentages and means were calculated. Inferential statistics namely; correlation and regression were done to test the hypotheses.Thequalitativedatacollected was also coded and grouped according to thestudyobjectivesandemergingthemes through thematic methods and content analysis was carried out. Thematic analysis involved clustering of texts with similar meaning [32]. Content analysis helps to distil words into fewer content related categories. Qualitative data supplemented quantitative data and helpedinprovidingexplanations.
Ethical Considerations
The researcher throughout the study remained ethical by respecting the rights of others through obtaining informed consent, ensuring anonymity, confidentiality, and respect for privacy, autonomy, and honesty in the reporting of data. Informed consent involved ensuring that all the respondents
participated in the study knowingly, voluntarily and intelligently. Therefore, the researcher explained to the respondents the purpose of the study to make them chose to participate in it on their own by signing a consent form. Anonymity was maintained by protecting the identities of the respondents by not linkingtherespondents’identitiestotheir responses. The responses were reported inaggregateformusingsuchmeasuresas percentages, means, correlations and regression coefficients. Qualitative findings were not associated with the respondents not reveal them. Confidentiality was ensured through ensuring that the respondents were free togiveandwithholdasmuchinformation as they wished to the researcher. Autonomy of the respondents was ensured by informing the respondents of their freedom to fill in the questionnaires and answer or leave out any questions that they prefer not to reply. The researcher maintained honesty by ensuring that data presentation, analysis and interpretation were strictly based on
www.iaajournals.org
21
www.iaajournals.org
Mujuni et al
the data collected. All sources of information were acknowledged.
DATA PRESENTATION, ANALYSIS AND INTERPRETATION Response Rate
Initially,thisstudywasplannedtocollect data from 141 respondents that were 135 teachers for the questionnaire survey and 6 head teachers for interviews. However complete data for the questionnaire was
collected from 120 teachers and interviews from 4 head teachers. Hence finally data was collected from 124 respondents. The response rate was as presentedinTable3.
Response Rate for the Study Instruments Targeted Actual Response Rate
Table 3:
Interview 6 4 66.7% Questionnaires 135 120 88.9% Total 141 124 87.9%
The data in Table 3 shows that interview data were collected from 4(66.7%) of the selected respondents for interviews and 120(88.9%) respondents for the questionnaire survey The overall response rate for both interview and survey data respondents was 124(87.9%). This response rate was considered
satisfactory because [33] suggest that a response rate of 50% above should be consideredgoodinhumanitystudies.
Background Characteristics
The data on the background characteristics of respondents is given in Table4.
Table 4: Respondents’ Background Characteristics
Item Categories Frequency Percent
Gender Male 66 55.0 Female 54 45.0 Total 120 100.0 AgeGroups Upto29years 62 51.7 30-39years 33 27.5 30-39years 22 18.3 Total 120 100.0 Educationlevel Diploma 58 48.3 Bachelor’sdegree 51 42.5 Postgraduatediploma 11 9.2 Total 120 100.0 Experience Lessthan5years 75 62.5 5-10years 40 33.3 11yearsandabove 5 4.2 Total 120 100.0 Responsibility Subjectteacher 68 56.7 Classteacher 22 18.3 Headofdepartment 29 24.2 Senioradministrator 1 0.8 Total 120 100.0
The results on gender category showed that the larger percentage (55.0%) was of
males with females being 45.0%. This suggested that the higher percentage of
22
www.iaajournals.org
the respondents were males. However, views representative of both gender groups were collected because the populationoffemaleteacherswasequally highsincethedifferencebetweenthetwo gender groups was only 10.0%. With respect to age groups of the respondents in years, the results revealed that the larger percentage (51.7%) was of the respondentsofupto29yearsfollowedby 27.5%thatwereofyearsbetween30to39 years. The remaining 18.3% were between 40 and 49 years and 2.5% 50 years and above. These results show that teachers from different age groups participated in the study. Therefore, the views presented captured the perceptions of teachers of various age groups hence provided data that can be generalised. The data on education level showed that larger percentage (48.3) of the respondents had bachelor’sdegreefollowed42.5%whohad diplomas, 9.2% had postgraduate diplomas. These results suggest that the teachers had appropriate qualifications for teaching in secondary schools. This suggested that they were proficient in English which is the language that was used in this study. Therefore, the respondents gave correct responses as they could easily interpret the question items.
The data on experience of the respondents indicated that the majority percentage (62.5%) of the respondents had taught less than 5 years, 33.3% had taught for 5 to 10 years and 4.2% had taught for 11 years and above. With data
Mujuni et al
collected from the different age categories, this suggested that data were representative of views of teachers with different teaching experiences. The results on experience thus can be generalised on different teachers. With respect to responsibilities of the respondents, the larger percentage (56.7%) were subject teachers only, 24.2% were heads of departments, 18.3% were class teachers and 0.8% was a senior administrator. The data reveals that teachers with different responsibilities participated in the study. This helped to capture different perceptions of teachers about job performance according to responsibilities.
Descriptive Analysis of the Variables
Toestablishthelevelofethicalleadership and job performance of teachers in the schools, descriptive analysis was carried out.Theresultsfollowhereunder.
Results for Job Performance of Teachers
Inthisstudy,jobperformanceofteachers which is the dependent variable was conceptualised as comprising of the aspects that are namely classroom teaching, management of students, discipline and regularity and interpersonalrelations.Theresultsonthe same follow in the subsections here under.
Classroom Teaching
Classroomteaching the firstaspectofjob performance of teachers was studied using seven items. The results on the same were as presented in Table 5
23
5: Descriptive Statistics for Classroom Teaching Classroom Teaching F/% SD D U A SA Mean Iusedifferentmethodsofteaching F - 8
48
4.38 % -
I ensure that most of my students understandmylessons F - 4 3 57 56 4.38 % - 3.3 2.5
46.7 I teach every student according to hisabilities F 1 21 14 56 25 3.71 % 0.9
Icomewellpreparedforteachingin class F - 2 2 57 57 4.43 % -
I can also teach difficult lessons easily F 3 11 17
3.75 % 2.5
If any student asks a question I try F -
4 55 60 4.45
Table
1
63
6.7 0.8 40.0 52.5
47.5
17.9 12.0 47.9 21.4
1.7 1.7 48.3 48.3
68 19
9.3 14.4 57.6 16.1
1
Mujuni et al
% - 0.8 3.3 45.8 50.0
F - - 2 31 87 4.71 % - - 1.7 25.8 72.5
The results in Table 5 about teachers using different methods of teaching showed that cumulatively, the majority percentage(92.5%)oftheteachersagreed. Withthehighmean=4.38closetocode4 which on the scale used corresponded with agreed, the results suggested the teachers agreed that they used different methods of teaching. Also, with the majority percentage (94.2%) and the high mean=4.38,teacherssuggestedthatthey ensured that most of the students understood lessons. The teachers further indicated that they taught every student according to his abilities because the majority percentage (69.3%)agreed witha highmean=3.71.
Theteachersrevealedthatwenttoclasses well prepared. This was because the majority percentage (96.6%) of the
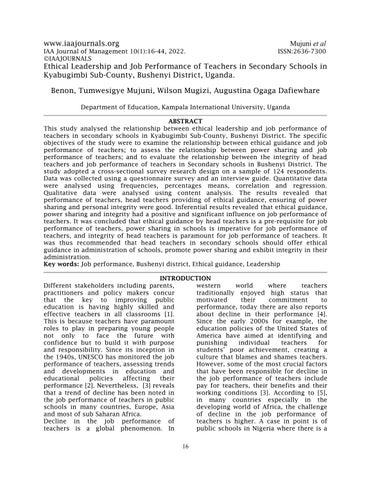
teachers agreed and the mean = 4.43 was high. With a high percentage (73.7%) of teachersagreeingandahighmean=3.75, the teachers also suggested that they taught difficult lessons easily. Further, teachers tried to satisfy students that asked questions at every level because majority percentage (73.7%) agreed and the mean = 4.45 was high. Finally, with the majority percentage (98.3) of the teachers agreeing and a high mean= 4.71, the teachers indicated that they ensured justiceinmarkingthepapers. Tofindout if results on classroom teaching were normally distributed, the researcher calculated an average index for the seven items measuring classroom teaching and drew a histogram from the same showing thenormalityoftheresultsasinFigure1.
Figure 1: Histogram for Classroom Teaching
www.iaajournals.org
24
tosatisfyhimateverylevel
I ensure justice in marking the papers
www.iaajournals.org
The results in Figure 1 show a high mean = 4.26 which indicates that the respondents agreed. With the low standard deviation (0.473) and the curve in the figure showing normality, it can be deduced the results on classroom teaching were normally distributed.Thus, the data on classroom teachers could be subjected to linear correlation and regressionandsuitableresultsobtained. Intheinterviews withheadteachers, they were asked to give their assessment of how the teachers carried out classroom teaching. Several related responses were given pointing to the effect that classroom teaching in the schools was good. One interviewee said; “As managementoftheschool,weensurethat teachers are always in class on time and attend to their lessons. Sometimes, we interface with the learners about their satisfaction with teaching carried out. Largely, the students report satisfaction with teaching save for a few teachers but whom we try to talk too to improve their teaching.” Another head teacher stated that; “Wehave made efforttoensurethat
Mujuni et al
teachers use schemes of work, lesson plans, visual aids and give group work to studentsexercisesadfeedbackinorderto enhance teaching. Myself I am satisfied with what my teachers are doing in this school.”
Consistent with the above, another head teacher remarked that; “The school has qualified teachers and we provide them with teaching facilities fairly well. The schooladministrationsupervisesteaching from time to time. Teaching has been good as reflected in the improvement in performance of students in Uganda Certificate of Education examination results.” The views from the head teachers show that they concurred with one another that classroom teaching in the schools was good. These views support the descriptive statistics results which showed that classroom teaching in theschoolswasatahighlevel.
Management of Students
Management of students the second aspectofjobperformanceofteacherswas using five items. The results on the same were as presented in Table 6.
Table 6: Descriptive Statistics for Management of Students
F 1 11 6 60 42 4.09 % 0.8 9.2 5.0 50.0 35.0
2 9 8 59 42 4.08
1.7 7.5 6.7 49.2 35.0
- 13 3 61 43 4.12
- 10.8 2.5 50.8 35.8
- - 1 44 75 4.61
- - 0.8 36.7 62.5
1 8 6 48 57 4.27
0.8 6.7 5.0 40.0 47.5
The results in Table 6 on teachers carrying out management responsibilities very nicely indicated that cumulatively, the majority percentage (85.0%) of them agreed. This was confirmed by the high mean =4.09close to code 4 whichon the scale used corresponded with agreed. Also,withthemajoritypercentage(84.2%) and the high mean = 4.08, teachers suggested that they involved students in co-curricular activities The teachers also
indicatedthattheyfulfilledtheirdutiesof directing students. This was because the majority percentage (86.6%)agreed witha high mean = 4.12. The teachers also revealed that easily accepted the responsibilities offered to them by their supervisors. This was because the majority percentage (99.2%) of the teachers agreed and the mean = 4.61 was high. With a high percentage (87.5%) of teachersagreeingandahighmean=3.27,
25
Management of Students
SD
Apartfromteaching,I carryout managementresponsibilitiesvery nicely
Iinvolvestudentsinco-curricular activities
Ifulfilmydutiesofdirectingstudents F
Ieasilyaccepttheresponsibilities offeredtomebymysupervisors
%
Itrytoimprovetheperformanceof students
F/%
D U A SA Mean
F
%
%
F
F
%
www.iaajournals.org
the teachers also suggested that they tried to improve the performance of students. To establish if results on management of students were normally distributed, the researcher calculated an
Mujuni et al
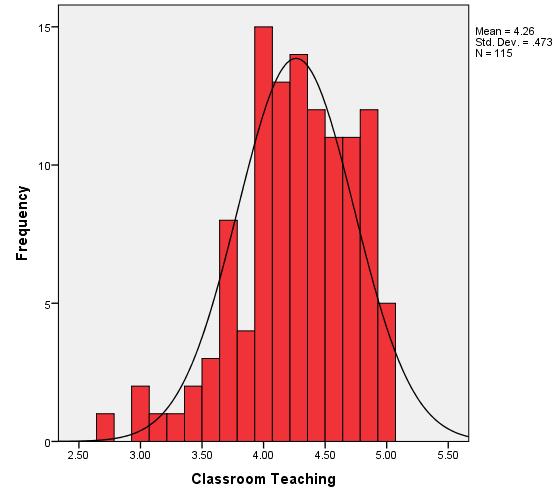
average index for the five items measuring management of students and drew a histogram from the same showing thenormalityoftheresultsasinFigure2.
Figure 2: Histogram for Management of Students
The results in Figure 2 indicate a high mean = 4.23 which suggest that the respondents agreed. With the low standard deviation (0.598) and the curve in the figure showing normality, it can be deduced the results on management of studentswerenormallydistributed.Thus, the data on management of students could be subjected to linear correlation and regression and suitable results obtained.
In the interviews with the head teachers they were asked to comment how teachers managed of students in the schools. In his response, one head teacher said; “Teachers participate in every activity that involve student managementofstudentseitherdirectlyor indirectly through committees on which they are represented by some of their colleagues.”Anotherheadteacherstated; Eachteachermustcarryoutweekly duty and ensure that students observe school rules and regulations. Teachers that fail to carry out these responsibilities effectively are reminded or
reprimanded. There are teachers I returned to the Ministry of Education for redeployment becauseoffailuretocarryouttheir duties. However, generally in this school teachers management of studentsisgood.
In agreement with the above, another headsaid;
Horizontally and vertically, teachers hold specific management roles that make them involved management of students. For instance, teachers are class teachers, clubs patrons, housemasters and mistresses, heads of departments, directors of studies, and senior men and senior women to mention but a few. In this school, most teachers have performed well in managing students.
The interview responses above suggest that head teachers indicated management of students by teachers was largely good. These responses confirm the descriptive statistics results on the same which
26
www.iaajournals.org
showed the management of students was good.
Mujuni et al
Discipline and Regularity Discipline and regularity is the third aspectofjobperformanceofteacherswas studied using six items. The results on the same were as presented in Table 7
Table 7: Descriptive Statistics for Discipline and Regularity
Discipline and Regularity
F/% SD D U A SA Mean
I ensure students come to school regularly F 2 9 12 70 26 3.92 % 1.7 7.6 10.1 58.8 21.8
Whenpresentatschool Iattendto my classontime F - - 1 36 82 4.68 % - - 0.8 30.3 68.9
I do relevant activities in my periods thatregulatestudents F - 2 4 64 50 41.7 4.35 % - 1.7 3.3 53.3
I fulfil my assigned activities that maintaindisciplineofstudents F - 2 2 61 55 4.41 % - 1.7 1.7 50.8 45.8
Iensurethestudentsfulfilcurriculum requirements F 1 3 7 69 40 4.20 % 0.8 2.5 5.8 57.5 33.3
I able to maintain discipline in my class F - - - 30 90 4.75 % - - - 25.0 75.0
The results in Table 7 on teachers ensuring that students came to school regularly showed that cumulatively, the majority percentage (80.6%) of them agreed. This was confirmed by the high mean =3.92close to code 4 whichon the scale used corresponded with agreed. Also,withthemajoritypercentage(99.2%) and the high mean = 4.68, when present at school the teachers attended to their classes on time The teachers also indicated that did relevant activities in theirperiodsthatregulatedstudents.This was because the majority percentage (95.0%) agreed with a high mean = 4.35. The teachers also revealed that they fulfilled their assigned activities that maintained discipline of students. This
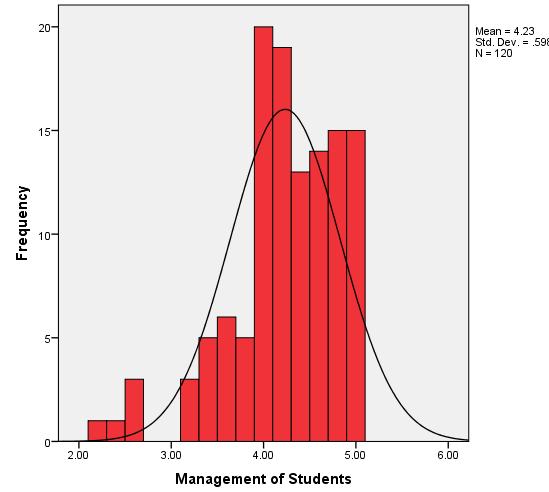
was because the majority percentage (96.6%) of the teachers agreed and the mean = 4.41 was high. With a high percentage (90.8%) of teachers agreeing and a high mean = 3.20, the teachers indicated that they ensured the students fulfilled curriculum requirements. Finally, teachers revealed that they were able to maintain discipline in their classes. This was because the all the respondents (100.0%) agreed with a high mean = 4.75. To have a clear picture of the distribution of the results discipline and regularity, an average index for the six items measuring discipline and regularity was done and a histogram drawn from showing the normality of the resultsasinFigure3.
27
Figure 3: Histogram for Discipline and Regularity
The results in Figure 3 show a high mean =4.38whichsuggestthattherespondents agreed. With the low standard deviation (0.428) and the curve in the figure showing normality, it can be concluded that the results on discipline and regularity were normally distributed. Thus, the data on discipline and regularity could be subjected to linear correlation and regression and suitable resultsobtained.
In the interviews with the head teachers, several related responses were given on teachers’ maintaineddiscipline.Onehead teacher stated, “Teachers warn, reprimand, guide, counsel students. For extreme cases which they cannot handle, forward them to administration for suspension and calling their parents.”
Another head teacher said that; “In this school, teachers ensure that students engage in school activities and follow the school routine programme. Teachers make roll calls, guide and counsel
students.” Another head teacher pointed out that; “Every teacher has the responsibility of maintaining discipline and regulating students. Teachers compose the disciplinary committees and are part of the parents’ teachers association and school board of governors’ disciplinary committees.” In relation with the above, another head teacher said; “teachers monitor students’ behaviour, counsel and punish. Majority oftheteachersinthisschoolshowzealin promoting discipline and regularity in this school.” The views presented above showed that teachers ensured discipline and regularity. This finding agrees with the descriptive statistics results which revealed that discipline and regularity of studentswasgood.
Interpersonal Relations
Interpersonalrelationsarethefourth aspectofjobperformanceofteacherswas studiedusingeightitems.Theresultson thesamewereaspresentedinTable8.
www.iaajournals.org
al 28
Mujuni et
Table 8: Descriptive Statistics for Interpersonal Relations
Interpersonal Relations
Itrytosolveanyproblemthatarisebetween meandcolleagues
Ienjoygoodrelationswithmycolleagues
Ico-operatewithmycolleaguesinanywork
I consult my colleagues in solving of my classproblems
Ikeepgoodrelationswithmystudents
For the betterment of my students I get in touchwithparentsofmystudents
I help the head in maintaining good relationsintheschool
The results in Table 8 about teachers trying to solve any problem that arose between them and colleagues, the majority percentage (92.5%) of the teachers agreed. With the high mean = 4.14 close to code 4 which on the scale used corresponded with agreed, the resultssuggestedtheteachersagreedthat theytriedtosolveanyproblemthatarose between them and colleagues. Also, with the majority percentage (92.5%) and the highmean=4.38,teacherssuggestedthat they enjoyed good relations with their colleagues.Theteachersfurtherindicated that they co-operated with their colleagues in any work because the majority percentage (94.2%)agreed witha highmean=4.47. The teachers revealedthattheyconsulted colleaguesinsolvingtheirclassproblems. This was because the majoritypercentage (96.6%) of the teachers agreed and the
F/% D U A SA Mean
F 3 6 77 34 4.18 % 2.5 5.0 64.2 28.3
F 3 6 77 34 4.38 % 2.5 5.0 64.2 28.3
F 1 6 59 54 4.47 % 0.8 5.0 49.2 45.0
F 1 3 54 60 4.43 % 0.8 2.5 45.8 50.8
F 3 1 57 59 4.40 % 2.5 0.8 47.5 49.2
F 2 1 64 53 4.20 % 1.7 0.8 53.3 44.2
F 5 9 62 43 4.26 % 4.2 7.6 52.1 36.1
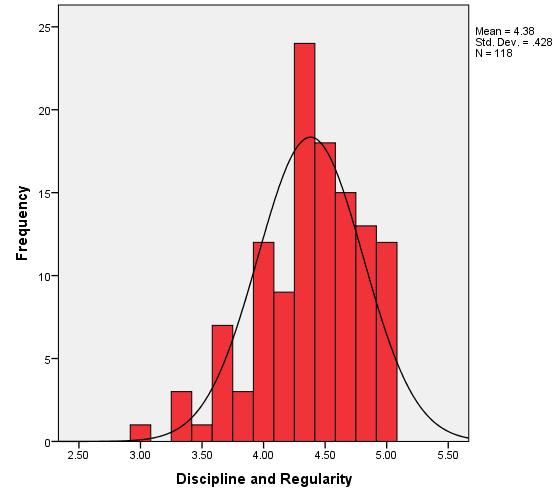
mean = 4.43 was high. With a high percentage (96.7%) of teachers agreeing anda highmean = 4.40,the teachers also suggested that they kept good relations with their students. Further, teachers indicated that for betterment of their students, they in touch with parents of their students because majority percentage(97.5%)agreedandthemean = 4.20 was high. Finally, with the majority percentage(88.2)ofthe teachersagreeing and a high mean= 4.26, the teachers indicated that helped the head in maintaining good relations in the school. To establish if results on interpersonal relations were normally distributed, the researchercalculatedanaverageindexfor the seven items measuring interpersonal relations and drew a histogram from the sameshowingthenormalityoftheresults asinFigure4.
www.iaajournals.org
29
Mujuni et al
Figure 4: Histogram for Interpersonal Relations
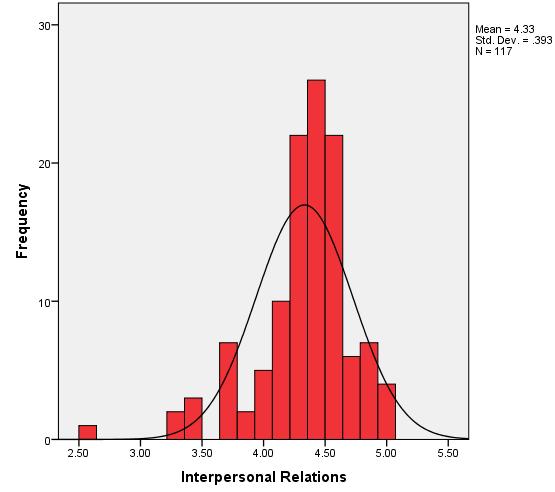
The results in Figure 4 indicate a high mean = 4.33 which suggests that the respondents agreed. With the low standard deviation (0.393) and the curve in the figure showing normality, it can be stated that the results on interpersonal relationswerenormallydistributed.Thus, the data on interpersonal relations could be subjected to linear correlation and regressionandsuitableresultsobtained. In the interviews on the question on interpersonal relations, one head teacher stated, “We are a family and we support one anotherin good andbadtimes. When there are celebrations we celebrate together and when there are miseries we console one another.” Another head teacherremarkedthat;“Relationsbetween teachers and students have been good in this school. We try to prevent unprofessional relations from cropping up because that would damage the reputation of the school and students.”
Also, another head stated, “There is high level collegiality in this school cemented by ensuring that we work as a team on
matters of the school and matters of every teacher that requires others to come such as when one has a wedding. The relations are good.” The views presented here indicated that interpersonal relations in the school were good.Theseviewssupportthedescriptive statistics results which revealed that interpersonal relations between the teachersweregood.
Job Performance of Teachers Index
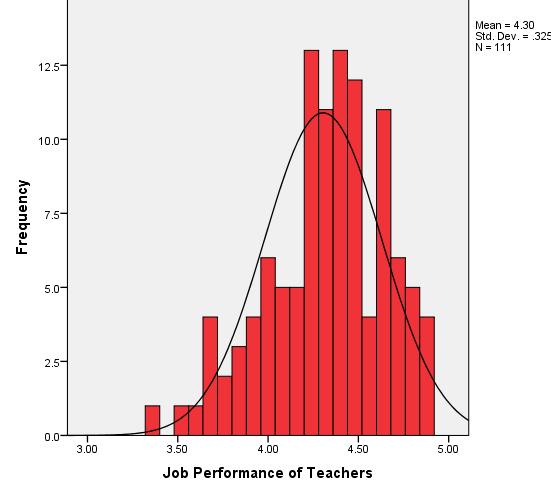
In the previous section, results were presented on the four aspects of job performance of teachers that classroom teaching, management of students, discipline and regularity and interpersonal relations. Nonetheless, for further analyses an average index for the measure of job performance of teachers was calculated from the items of the four aspects job performance of teachers. The histogram (Figure 5) shows that the overallmeanandstandarddeviationofall the times measuring the aspects of job performance off teachers.
www.iaajournals.org
al 30
Mujuni et
Figure 5: Histogram for Job Performance of Teachers
The curve in Figure 5 shows normal distribution of the responses on job performance of teachers. This suggests thatthedataobtainedonjobperformance of teachers could be subjected to linear correlation and regression and appropriate results obtained. Still, the figure shows that the teachers rated their job performance (Mean = 4.30) as being high. In the subsections that follow, job performance of teachers’ indiceswere analysed in a relationship with aspects of ethicalleadership(IV).
Results for Ethical Leadership and Job Performance of Teachers
Ethicalleadershipwasstudiedintermsof ethical guidance, power sharing and
integrity. The results on the same are presented basing on the order of the studyobjectives.Descriptivestatisticsare presented first and thereafter, multiple correlation and regression carried out between ethical leadership aspects and jobperformanceofteachers.
Ethical Guidance
Ethical guidance was conceived as the first component ethical leadership. The objective that was the focus of the study was to examine the relationship between ethical guidance and job performance of teachers in Secondary schools in Kyabugimbi Sub County, Bushenyi District. The descriptive results on the samewereaspresentedinTable9
www.iaajournals.org
al 31
Mujuni et
www.iaajournals.org
Ethical Guidance
Table 9: Descriptive Statistics for Ethical Guidance
My head teacher clarifies the likely consequences of possible unethical behaviour by colleagues and myself
My head teacher in this school stimulates the discussion of ethical issues among staff
My head teacher in this school ensures that I follow ethical codes
My head teacher in this school clearly explains ethical related codes of conduct
My head teacher in this school clarifies ethical guidelines
My head teacher in this school explains what is expected from staff in terms of behaving ethically
The results in Table 9 on whether head teachers clarified the likely consequences of possible unethical behaviour by teachers showed that cumulatively, the majority percentage (68.9%) of the teachers agreed. With the high mean = 3.73 close to code 4 which on the scale used corresponded with agreed, the results suggested head teachers clarified the likely consequences of possible unethical behaviour by teachers. Also, with the majority percentage (75.0%) and thehighmean=3.91,suggestedthathead teacher in the schools stimulated the discussion of ethical issues among staff. The teachers further indicated that head teachers in the schools ensured that teachers followed ethical codes because the majority percentage (80.0%) agreed withahighmean=3.99.
Mujuni et al
F/% SD D U A SA Mean
F 2 13 22 60 22 3.73 % 1.7 10.9 18.5 50.4 18.5
F 1 10 18 60 30 3.91 % 0.8 8.3 15.0 50.0 25.0
F 2 9 12 63 34 3.99 % 1.7 7.5 10.0 52.5 28.3
F 1 9 8 65 36 4.06 % 0.8 7.6 6.7 54.6 30.3
F 1 6 9 73 30 4.05 % 0.8 5.0 7.6 61.3 25.2
F - 7 7 58 47 4.22 % - 5.8 5.8 48.3 39.2
The teachers revealed that head teachers clearly explained ethical related codes of conduct. This was because the majority percentage (84.9%) of the teachers agreed and the mean = 4.06 was high. With a high percentage (86.5%) of teachers agreeing and a high mean = 4.05, the teachers also suggested that head teachers clarifies ethical guidelines. Lastly,withthemajoritypercentage(87.5) oftheteachersagreeingandahighmean= 4.22, the teachers indicated that head teachers explained what was expected from staff in terms of behaving ethically To ascertain whether the results on ethical guidance were normally distributed, an average index was calculated for the six items measuring ethical guidance and a histogram drawn from the same showing the normality of theresultsasinFigure6.
32
Figure 6: Histogram for Ethical Guidance
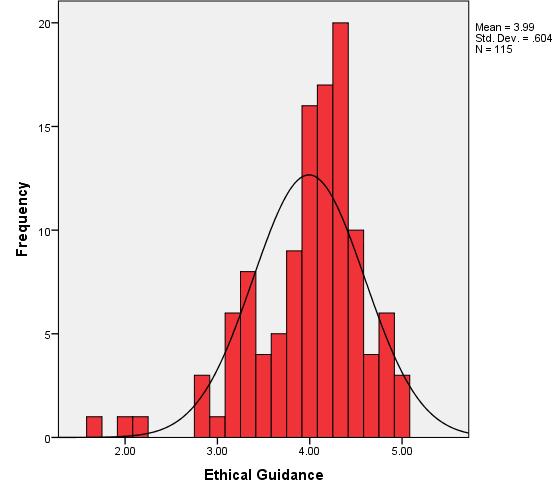
The results in Figure 6 indicate a high mean = 4.33 which suggests that the respondents agreed. With the low standard deviation (0.393) and the curve in the figure showing normality, it can be statedthattheresultsonethicalguidance were normally distributed. Thus, the data on ethical guidance couldbe subjected to linear correlation and regression and suitableresultsobtained.
In the interviews with the head teachers, they were asked to give their assessment of how they provided ethical guidance in theschools.Oneheadteachersstated; Providing ethical guidance to teachers is a must. Indeed, each teacher in my school has been availed with a copy of code of conductforteacherssuchthatthey keep abreast with the demands of their profession. Still, in meetings teachers every now and then teachers are reminded of their professionalethics.
Anotherheadteachersaid; From time to time in our staff meeting I remind the teachers of the teachers’ professional ethics and code of conduct. I regularly brief my on such matters as dress
code, attending to personal appearance by maintaining a neat andpleasantoutlookwhileonduty and in public places and being professional when dealing with studentsoftheoppositesex.
In relation with the above, another head teacher revealed, “Giving teachers ethical guidanceissomethingthatdoesnotstop. I always tell them to remain professional and leave things that might jeopardise their careers such as refraining from sexual relations with students, avoiding alcohol and being smart among others.”
The views above showed that head teachers were involved in giving ethical guidance to teachers. This finding concurs with the descriptive statistical results which indicated that the giving of ethicalguidancetoteacherswashigh.
Power Sharing
Power sharing was conceived as the secondcomponentethicalleadership.The objective that was the focus of the study sought to assess the relationshipbetween power sharing and job performance of teachersinSecondaryschoolsinBushenyi District. The descriptive results on the same were as presented in Table 10
www.iaajournals.org
33
Mujuni et al
Table 10: Descriptive Statistics for Power sharing
Power sharing
My head teacher in this school allows subordinates to influence critical decisions
My head teacher in this school allows otherstoparticipateindecisionmaking
My head teacher in this school seeks advice from subordinates concerning organizationalstrategy
My head teacher in this school reconsiders decisions on the basis of recommendations by those who report tothem
I am delegated challenging responsibilities in this school by my headteacher
In this school I am permitted to play a key role in setting my performance goals
The results in Table 10 on whether head teachers allowed subordinates to influence critical decisions showed that cumulatively, the majority percentage (64.4%) of the teachers agreed. With the high mean = 3.53 close to code 4 which on the scale used corresponded with agreed, the results suggested head teachers allowed subordinates to influencecritical decisions.Also,withthe majority percentage (70.8%) and the high mean = 3.99, suggested that head teachers allowed others to participate in decision making. The teachers further indicated that head teachers sought advice from subordinates concerning organisational strategy because the majority percentage (80.9%)agreed witha highmean=3.89.
The teachers revealed that head teacher reconsidered decisions on the basis of recommendations by those who reported
Mujuni et al
F/% SD D U A SA Mean
F 1 27 14 61 15 3.53 % 0.8 22.9 11.9 51.7 12.7
F - 8 27 43 42 3.99 % - 6.7 22.5 35.8 35.0
F - 10 13 77 20 3.89 % - 8.3 10.8 64.2 16.7
F 1 5 23 52 39 4.03 % 0.8 4.2 19.2 43.3 32.5
F 5 41 16 35 22 3.24 % 4.2 34.5 13.4 29.4 18.5
F 2 15 11 56 32 3.87 % 1.7 12.9 9.5 48.3 27.6
to them. This was because the majority percentage (75.8%) of the teachers agreed and the mean = 4.03was high. However, the average percentage (47.9%) and average mean = 3.24 suggested that delegating of challenging responsibilities by head teachers was moderate. This is because the mean was close to three which on the five point Likert Scale used impliedundecidedorfair.Lastly,withthe majority percentage (75.9%) of the teachers agreeing and a high mean= 3.87, the teachers indicated that head teachers permitted them to play a key role in setting their performance goals. To confirm whether the results on power sharing were normally distributed, an average index was calculated for the six items measuring power and a histogram drawn from the same showing the normality of the results as in Figure 7.
www.iaajournals.org
34
Figure 7: Histogram for Power Sharing
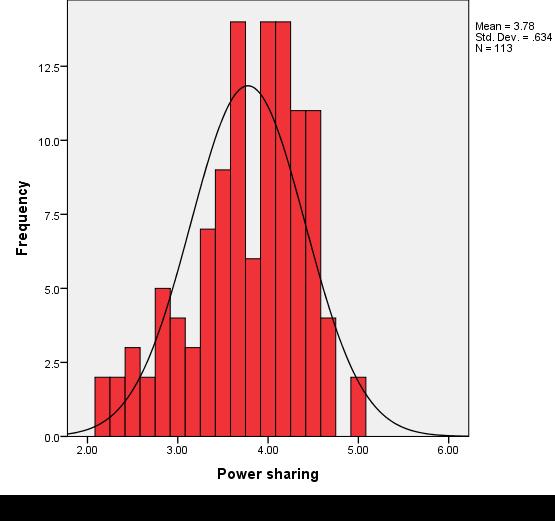
The results in Figure 7 indicate a high mean = 3.78 which suggests that the respondents agreed. With the low standard deviation (0.634) and the curve in the figure showing normality, it can be stated that the results on power sharing were normally distributed. Thus, the data on power sharing could be subjected to linear correlation and regression and suitableresultsobtained.
In the interviews, the head teachers were asked to tell how they ensured ensured powers sharing in the schools. Several related responses were given and these included the following. One head stated, “Teachers are delegated different responsibilities in the school because the head teacher and his deputies cannot be everywhere. This helps to make teachers feel that they are part and partial of the school.” Another head teacher revealed, “Alldecisionsintheschoolaretakenwith involvement of teachers as everything newto be introducedandimplementedis
discussed in ours staff meetings. Therefore, teachers influence the making of every decision in the school.” In agreement with the above, another head teacher remarked that, “Teachers participate in the making of every decision. They are also part of the school bodies such as PTA and Board of Governors. Therefore, they wield a lot of poor in the school.” The views above suggest that in the schools there was power sharing. This finding concurred with the descriptive statistics results which showed that power sharing in the schoolswasgood.
Integrity: Integrity was conceived as the third component ethical leadership. The objectivethatwasofinteresttothestudy sought to evaluate the relationship between integrity and job performance of teachersinSecondaryschoolsinBushenyi District. The descriptive results on the samewereaspresentedinTable11
www.iaajournals.org
et al 35
Mujuni
Integrity
I
Table 11: Descriptive Statistics for Integrity
My head teacher in this school always keepshiswords
My head teacher in this school keeps his/herpromises
My head teacher in this school can be reliedontohonourhiscommitments
The results in Table 11 on whether teacherstrustedtheirheadteachersinthe way they did of said things showed that cumulatively, the majority percentage (88.2%) of the teachers agreed. With the high mean = 4.20 close to code 4 which on the scale used corresponded with agreed, the results suggested teachers trusted their head teachers in the way they did of said things. Also, with the majority percentage (95.0%) and the high mean = 4.31 suggested that head teacher always kept their words. The teachers further indicated that head teachers kept
Mujuni et al
F/% SD D U A SA Mean
F 2 3 9 60 45 4.20 % 1.7 2.5 7.6 50.4 37.8
F 1 2 3 67 47 4.31 % 0.8 1.7 2.5 55.8 39.2
F - 5 4 60 51 4.31 % - 4.2 3.3 50.0 42.5
F 9 7 13 60 31 3.81 % 7.5 5.8 10.8 50.0 25.8
their promises because the majority percentage (92.5%) agreed with a high mean = 4.31. Lastly, with the majority percentage (75.8%) of the teachers agreeing and a high mean= 3.81, the teachers indicated that head teachers could be relied on to honour their commitments. To determine whether the results on integrity were normally distributed, an average index was calculated for the four items measuring integrity and a histogram drawn from the sameshowingthenormalityoftheresults asinFigure8.
www.iaajournals.org
36
trust that my head teacher in this schooltodothethingshe/shesays
Figure 8: Histogram for Integrity
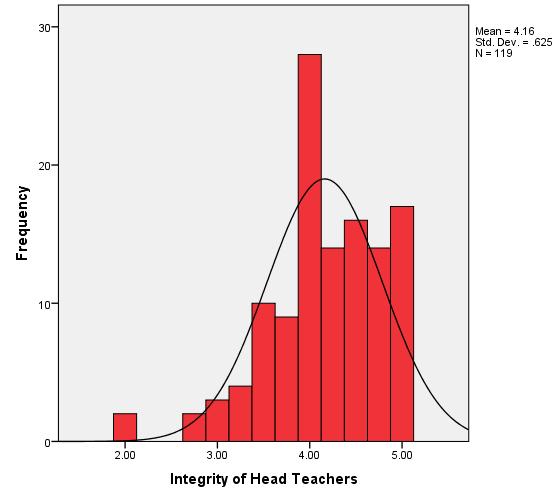
The results in Figure 8 indicate a high mean = 4.16 which suggests that the respondents agreed. With the low standard deviation (0.625) and the curve in the figure showing normality, it can be stated that the results on integrity were normally distributed. Thus, the data on integrity could be subjected to linear correlation and regression and suitable resultsobtained.
The interview guide question on integrity required the head teachers to tell how theypromotedintegrityin the schools.In their responses, they all suggested that theymadeefforttopromoteintegrity.For example,onheadteacherstated;
When I reached here as a head teachertherewasmistrustbetween the teachers and the head teacher because the previous head teacher had swindled school money failing to pay the teachers what was due to them. However, I reversed that
and I am on very good terms with myteachers.
Another head teacher stated, “I remain true to values expected of a head teacher tosetanexampletomyteachers.Idonot drink alcohol, go to church and does not involve myself in sexual relations with students and female teachers. This has helped me to set pace for my teachers.”
Finally, another head teacher revealed, “I promote professional ethics and in this, I try to portray myself as a remodel by ensuringthatmyintegrityisnottainted.”
The information above from the head teachers reveals that tried to promote integrity. This finding concurred with the descriptive statistic results which revealed that the integrity of head teacherswashigh.
Inferential Analyses
To establish whether there was a relationship between ethical leadership and job performance of teachers in secondary schools, inferential analyses
www.iaajournals.org
et al 37
Mujuni
www.iaajournals.org
namely; correlation and regression were carriedoutrespectivelyandresultsfollow hereunder.
Mujuni et al
Correlation of Ethical Leadership and Job Performance of Teachers in Secondary Schools.
To establish whether ethical leadership aspects namely; ethical guidance, power sharing and integrity related to job performance of teachers, the researcher carried out correlation analysis. The results were as given in Table 10.
Table 12: Correlation Matrix for Ethical Leadership and Job Performance of Teachers in Secondary Schools
Job Performance of Teachers
JobPerformanceof Teachers 1
Ethical guidance Power sharing Integrity of Head Teachers
Ethicalguidance 0.294** 1 0.002
Powersharing 0.701** 0.157 1 0.000 0.094 IntegrityofHead Teachers 0.294** 0.072 0.103 0.002 0.438 0.271 **.Correlationissignificantatthe0.05level(2-tailed).
The results in Table 12 suggest that all the components of ethical leadership namely; ethical guidance (r = 0.294, p = 0.002< 0.05); power sharing (r = 0.701, p =0.000< 0.05)andintegrity(r= 0.294,p = 0.002< 0.05) had a positive and significant relationship with job performance of teachers. This means that the hypotheses (H1-H3) were supported However, hypothesis Two (H2) was more significant.
Regression Model for Ethical Leadership and Job Performance of Teachers in Secondary Schools
At the confirmatory level, to establish whether ethical leadership components namely; ethical guidance, power sharing and integrity influenced job performance teachers, a regression analysis was carried out. The results were as in Table 13
Table 13:
Regression of Job Performance of Teachers and Ethical Leadership Ethical Leadership Standardised Coefficients Significance Beta(β) (p)
Ethicalguidance 0.174 0.008 Powersharing 0.653 0.000 IntegrityofHeadTeachers
AdjustedR2 =0.562 F =47.556,p=0.000
0.221 0.001 a. DependentVariable:JobPerformanceofTeachers
The results in Table 13 show that the components of ethical leadership namely; ethical guidance, power sharing and integrity explained 56.2% of the variation
in job performance of teachers (adjusted R2 = 0.562). This means that 43.8% of the variation was accounted for by other factors not considered under this model.
38
www.iaajournals.org
All the components of ethical leadership, namely; ethical guidance (β = 0.174, p = 0.008< 0.05), power sharing (β = 0.653, p = 0.000< 0.05) and integrity (β = 0.221, p = 0.001< 0.05) had a positive and significant influence on job performance of teachers. This means that all the
Mujuni et al
hypotheses (H1-H2) were supported. The magnitudes of the respective betas suggested that power sharing had the most significant influence on job performance of teachers followed integrity of head teachers and ethical guidancerespectively.
DISCUSSION
Research Hypothesis One: Ethical guidance has a significant relationship with job performance of teachers.
The findings revealed that the first hypothesis (H1) to the effect that ethical guidance has a significant relationship with job performance of teachers. This finding concurred with the findings of previous scholars. For example, [34] revealed that a significant relationship existed between ethical standards and organisationalproductivity.Similarly,[35] reported that leaders must create an ethically friendly work environment for all employees, communicate ethical issues, serve as role models and put mechanism in place for the development of responsible employees for better job performance. Relatedly, [19] found out that ethical guidance of leaders had a strong influence on individual task initiative.
Concurring with the above, [20] established that ethical guidance had positive impact on employees’ performance. In the same vein, [21] also revealed that there was a positive significant relationship between ethical values of leaders and employee performance. Similarly, [22] reported that allethicalleadershipconstructsincluding ethicalguidancehadapositivesignificant effect on employee performance. The discussion above showed that the finding of the study concurred with the findings of all previous scholars. Therefore, it can be deduced that ethical guidance has a significant relationship with job performanceofteachers.
Research Hypothesis One: Power Sharing has a significant relationship with job performance of teachers
The findings revealed that the first hypothesis (H2) to the effect that power sharinghasasignificantrelationshipwith job performance of teachers. This finding
isconsistentwiththefindingsofprevious scholars.Forinstance,[36]foundoutthat empowerment had a positive significant effect on job performance. Similarly, [37] revealed a positive significant relationship between delegation and employee task performance. Likewise, [39] reported that power sharing improved job performance. Also, [38] revealed that workers direct participation led to increases in labour productivity. In same vein, [40] also indicated that delegation of authority had a significant effectonemployeeeffectiveness.
Consistent with the above finding, [19] found out that power sharing had a positive and significant relationship with individual’staskinitiatives.Similarly, [41] revealed that participative leadership styles significantly affected teacher effectiveness. Likewise, [42] reported that participative leadership on their performance had a positive and significant impact on teachers’ performance. Also, [22] indicated that that power sharing had a positive significant effect on employee performance. The discussion above revealedthatthefindingofthestudywas consistent with the findings of all previous scholars. Therefore, it can be ascertained that power sharing has a significant relationship with job performanceofteachers.
Research Hypothesis One: Integrity of head teachers has a significant relationship with job performance of teachers. The findings revealed that the first hypothesis (H3) to the effect that Integrity of head teachers has a significant relationship with job performance of teachers. This finding agreed with the findings of previous scholars. For example, [43] revealed that when leaders emphasise integrity, they inspire favourable behaviours among
39
www.iaajournals.org
employees. Similarly, [44,45,46,48] reported that leadership integrity had a significant effect on the performance of employees. Also, [49,50,51,52] found out that leader behavioural integrity was related to follower work role performance. In the same vein, [53,54,55,56] established that faculty supervisor’s integrity had a strong influence on their individual task initiative. Likewise, [57,58,59,60] revealed that leaders’ integrity related to employees’ work role performance. Also, [46] found out that integrity was related to transformed performance ratings within a high performance team environment.
In agreement with the finding of the study, [47] revealed that integrity of the leader related to job performance.
Mujuni et al
Similarly, [61,62,63] reported that integrity of the leader affected work performance. Also, [64,65] found out that perceived leader integrity had an impact on activities of employees as employees who perceived their team leader to have high integrity were less likely to commit unethical acts that negatively impacted the team itself and the organisation. However, the finding disagreed with the finding by [50] who reported the leader behavioural integrity was not directly related to follower job performance. However, with the finding of the study agreeing with the findings of most scholars, it can be confirmed that integrity of head teachers has a significant relationship with job performanceofteachers.
CONCLUSION
The findings above led to the making of the following conclusions on ethical leadership and job performance of teachers;
1. Ethical guidance by head teachers is a pre-requisite for job performance of teachers in secondary schools. This so when the head teacher emphasises ethical behavior, promotes codes ofintegrityprovisionandprovides teachersintegrityguidelines.
2. Power sharing in schools is imperative for job performance of
teachers in secondary schools. This occurs when the head teachers promote participatory decision making, carried out delegating responsibilities and emphasises participation in goal setting.
3. Integrity of head teachers is paramount for job performance of teachers in secondary schools. This is especially so when head teachers are trustworthy, reliable and fulfil promises made to the teachers.
RECOMMENDATIONS
The conclusions above led to the suggesting of the following recommendations on ethical leadership andjobperformanceofteachers;
1. Head teachers in secondary schools should offer ethical guidance in administration of schools. This should involve head teachers emphasising ethical behaviour, promoting codes of integrity and providing teachers integrityguidelines.
2. Head teachers in secondary schools should promote power sharing in schools. This should include promoting participatory decision making, carrying out delegating responsibilities and
emphasising participation in goal setting.
3. Head teachers in secondary schools should exhibit integrity of in their administration. Therefore, secondary school head teachers should ensure that they are trustworthy, reliable and fulfil promisesmadetotheteachers.
Limitations and Suggestions for Further Research
Thisstudymakesimportantcontributions with respect to ethical leadership and job performance of teachers. Nevertheless, a number of limitations in the findings of the study emerged. For example, the study was carriedoutinonesubcountry; therefore,futureresearchersshouldcarry
40
www.iaajournals.org
thestudyinawiderscope.Still,thestudy covered only three aspects of ethical leadership that are namely ethical guidance, power sharing and integrity. Future researchers should also cover fairness, role clarification and people
Mujuni et al
oriented behaviour (Katuramu, 2016). Lastly the study was dominantly quantitative, limiting in-depth analysis. Therefore, should adopt the qualitative approach as the most dominant approach to enable in-depth analysis.
REFERENCES
1. Darling-Hammond, L. (2010). Evaluating Teacher Effectiveness: How Teacher Performance Assessments can Measure and Improve Teaching. Washington DC: Center for American Progress.
2. Van Nuland, S. and Khandelwal, P. (2006). Ethics in education: The role ofteachercodes.Paris:UNESCO.
3. Symeonidis, V. (2015). The status of teachersandtheteachingprofession:A study. Brussels, Belgium: Education InternationalResearchInstitute.
4. Shahsavari-Googhari, R. (2017). How do teachers challenge neoliberalism through critical pedagogy within and outside of the classroom? (Masters Dissertation, The University of WesternOntario,Ontario,Canada).
5. Ozoemena, P. O. (2013). Improved incentive system in teaching profession as strategy for quality delivery and enhanced productivity in contemporary Nigeria. International Journal of Education and Research, 1(7),1-12.
6. Nabukenya, M. (2010). Influence of teachers ‘professionalism on teacher (Masters dissertation, Makerere University,Kampala,Uganda).
7. Namulondo, T. (2008). The secret behind the figures: Evaluation of UPE program in Iganga District (Masters Dissertation, Institute of Social Studies,TheHague,TheNetherlands).
8. Mazaki, K. E. (2017). Staffwelfare and teachers’performance in public primary schools in Bugisu Sub-Region in Uganda (PhD proposal, Mbarara Universityof Science AndTechnology, MbararaUganda).
9. Duze, C. O. (2012). Leadership Styles of Principals and Job Performance of Staff in Secondary Schools in Delta State of Nigeria. An International Journal of Arts and Humanities, 1(2), 224-245
10.Liu, J., Kwan, H. K., Fu, P. P. and Mao, Y. (2013). Ethical leadership and job performance in China: The roles of workplace friendships and traditionality. Journal of occupational and organizational psychology, 86(4), 564-584.
11.Malik, M. S., Awais, M., Timsal, A. and Qureshi, U. H. (2016). Impact of ethical leadership on employees' performance: Moderating role of organisational values. International ReviewofManagementandMarketing, 6(3),590-595.
12.Saani, A. J. (2013). Influence of compensation and supervision on private basic school teachers work performance in Ashaiman Municipality. International Journal of Business and Social Science, 4(17), 6469.
13.Subroto, W. T. (2013). Income and Implications of Teacher Performance toImprovetheQualityofEducationin the Elementary School of Surabaya. International Journal of Business, Humanities and Technology, 3(2), 112121.
14.Dansereau, F., Graen, G. and Haga, W. J. (1975) A vertical dyad linkage approach to leadership within formal organisations: A longitudinal investigation of the role making process.
15.Chen, Y. F. and Tjosvold, D. (2006). Participative leadership by American and Chinese managers in China: The role of relationships. Journal of Management Studies, 43(8), 17271752.
16.Mugizi, W., Bakkabulindi, F. E. and Bisaso, R. (2015). Antecedents of commitment of academic staff in universities in Uganda: A conceptual paper.Nkumba Business Journal, 14, 218-241.
41
www.iaajournals.org
17.Yukl, G., O'Donnell, M. and Taber, T. (2009). Influence of leader behaviours on the leader-member exchange relationship. Journal of Managerial Psychology,24(4),289-299.
18.Block, E., Crochet, F., Jones, L. and Papa, T. (2012). The importance of teacher's effectiveness. Creative Education, 3(06),1164-1172.
19.Khalid, K. and Bano, M. S. (2015). Can ethical leadership enhance individual’staskinitiatives? Journalof BusinessLaw,3(1),62-84.
20.Saeed, R., Shakeel, M. and Lodhi, R. N. (2013).Ethical behaviour and employees’ job performance in education sector of Pakistan.MiddleEast Journal of Scientific Research 18(4),524-529.
21.Sabir, M. S., Iqbal, J.J., Rehman, K. U., Shah, K. A. and Yameen, M. (2012). Impact of corporate ethical values on ethical leadership and employee performance. International Journal of Business and Social Science, 3(2), 163171
22.Sugianingrat, P. W., Yasa, N. K., Sintaasih, D. K. and Subudi, M. (2021). The influence of ethical leadership on employee performance through employeeengagement.IOSR Journalof Humanities and Social Science (IOSRJHSS),22(12),04-11.
23.Lavrakas, P. J. (2008). Cross-sectional survey design. In Encyclopaedia of survey research Methods. Available at: doi: http://dx.doi.org/10.4135/978141296 3947.n120
24.Moule, P. and Goodman, M. (2009). Nursingresearch:Anintroduction.Los Angeles,USA:Sage.
25.Benoot C., Hannes, K. and Bilsen J. (2016). The use of purposeful sampling in a qualitative evidence synthesis: A worked example on sexual adjustment to a cancer trajectory. BMC Medical Research Methodology, 16(21),1-12.
26.Krosnick, J. A., Presser, S., Fealing, K. H.,Ruggles,S.andVannette,D.(2015). The future of survey research: challenges and opportunities. The National Science Foundation Advisory
Mujuni et al
Committee for the Social, Behavioral and Economic Sciences Subcommittee on Advancing SBE Survey Research. Available at: http://www. nsf. gov/sbe/AC Materials /TheFutureofSurveyResearch.pdf.
27.Amin, M., ullah Shah, R., Ayaz, M. and Atta, M. A. (2013). Teachers’job performance at secondary level in KhyberPakhyunkhwa,Pakistan. Gomal University Journal of Research, 29(2), 101-104.
28.Katuramu, A. O., Byarugaba, F. and Mugizi, W. (2016). Ethical leadership and academic staff retention in public universities in Uganda. American Journal of Educational Research and Reflection,1,A30-A42.
29.Harrell, M. C. and Bradley, M. A. (2009).DataCollectionMethods:SemiStructured Interview and Focus Groups. RAND National Defense ResearchInstitute,SantaMonica.
30.Noble, H. and Smith, J. (2015). Issues ofvalidityandreliabilityinqualitative research. Evidence-Based Nursing, 18(2),34-35.
31.Taber, K. S. (2017). The use of Cronbach’s Alpha when developing and reporting research instruments in science education. ResearchinScience Education,1-24.
32.Kim, S. and Wilbur, W. J. (2012). Thematic clustering of text documents using an EM-based approach. J. Biomed.Semant,3,S6.
33.Mellahi, K. and Harris, L. C. (2016). Response rates in business and management research: An overview of current practice and suggestions for future direction. British Journal of Management, 27(2),426-437.
34.Adeyeye, O. J., Adeniji, A. A., Osinbanjo, A. O. and Oludayo, O. O. (2015). Effects of workplace ethics on employees and organisational productivity in Nigeria. International Conference on African Development Issues (CU-ICADI) 2015: Social and Economic Models for Development Track.
35.Bello, S. M. (2012). Impact of ethical leadership in employee job performance. International Journal of
42
www.iaajournals.org
BusinessandSocialScience,3(11),228236.
36.Arslan,M.andZaman,R.(2014).Effect of empowerment on job performance: AstudyofsoftwaresectorofPakistan. Research on Humanities and Social Sciences,4(27),23-27.
37.Constantine Abenawe (2022). Evaluationoftherelationshipbetween socio-economic status and the quality of education in secondary schools in Ibanda District. IAA Journal Arts and Humanities9(1):83-94,2022.
38.Constantine Abenawe (2022).Social EconomicStatusinSelectedSecondary SchoolsinIbandaDistrictUganda.IAA JournalofEducation8(1):73-89.
39.Tom Mulegi (2022). Evaluation of the Skill Mix of Health Professionals in Government Regional Referral Hospitals in Uganda. IDOSR Journal of ArtsandManagement 7(1):43-68.
40.Mwesigye Elisado (2022). Management styles used in the selected secondary schools in Uganda. IAA Journal of Education 8(1):90-96.
41.John Birihanze (2022). Effects of Indiscipline on Academic Performance in Kabwohe-Itendero Town Council, Sheema District. IAA Journal of Education 8(1):97-106.
42.Constantine Abenawe (2022). Quality Education in Selected Secondary Schools in Ibanda DistrictUganda. IAA Journal of Social Sciences (IAA-JSS) 8(1):197-215.
43.Birihanze Augustine Bago (2022). Effect of Single Parenthood in Students’ Academic Performance; A Case of Selected Secondary Schools in Bitereko Sub County Mitooma District. IAA Journal of Social Sciences (IAA-JSS) 8(1):216-226.
44.Aruho Rukundo Sarah, Nuwatuhaire Benard, Manyange Micheal and Bateyo Asuman (2022). Sociodemographic Distribution of Persons with Small and Medium Enterprises in Uganda:A Case Study of Kabale Municipality South, Western Uganda. INOSRArtsandManagement 8(1):1-7.
45.Aruho Rukundo Sarah, Nuwatuhaire Benard, Manyange Micheal and Bateyo Asuman (2022). Evaluation of
Mujuni et al
Constraints of Small and Medium EnterprisesinUganda:ACaseStudyof Kabale Municipality South Western Uganda. INOSR Arts and Management 8(1):8-20.
46.Ugwu Jovita Nnenna (2022). Impact of Violence Movie on Human Behaviour. INOSR Arts and Management 8(1): 2126.
47.Aruho Rukundo Sarah, Nuwatuhaire Benard, Manyange Micheal and Bateyo Asuman (2022). Performance of Small and Medium Enterprises in Uganda: A Case Study of Kabale Municipality South Western Uganda. INOSR HumanitiesandSocialSciences 8(1): 110.
48.Thabugha Hannington, Bateyo Asuman, and Baineamasanyu Mary(2022). Loans and women involvement in business in Kasese District: A Case of Women Entrepreneurs in Hima Town Council. INOSR Humanities and Social Sciences 8(1):11-18.
49.Mukabaranga Chantal, Michael Manyange and Bateyo Asuman (2022). The Relationship between Extrinsic RewardsandEmployeePerformanceof Shyogwe Diocese. IDOSR Journal of Current Issues in Social Sciences 8(1):66-78.
50.David Ongabi Nyambane, Benedicto Onkoba Ongeri and Michael Nyasimi Manyange (2022). An Assessment of Collaborative Governance for Sustainable Development in Urban Planning in Kenya. IDOSR Journal Of Current Issues In Social Sciences 8(1): 1-18.
51.Thabugha Hannington, Bateyo Asuman, and Baineamasanyu Mary (2022). Savings and women involvement in business in Kasese District: A Case of Women EntrepreneursinHimaTownCouncil.
52.Chen, Z. X. and Aryee, S. (2007). Delegation and employee work outcomes: An examination of the cultural context of mediating processes in China. Academy of Management Journal, 50(1), 226-238. https://doi.org/10.5465/amj.2007.241 62389
43
www.iaajournals.org
53. Gonzalez,M.C.(2010).Workers’direct participation at the workplace and job qualityinEurope.JournalofEuropean Social Policy, 20(2), 160-168. https://doi.org/10.1177/0958 928709358792
54.Chen,C. C.,Zhang, A. Y. and Wang, H. (2014).Enhancingtheeffectsofpower sharing on psychological empowerment: The roles of management control and power distance orientation. Managementand Organization Review, 10(1), 135-156. doi:10.1111/more.12032
55.Idowu, O. O. and Olarewaju, A. A. (2017). Delegation of authority and employee performance: An empirical evidence from Ikeja Division in Lagos State.Journal of Entrepreneurship & Innovation, 9(9),103-110.
56.Sirisookslip, S., Ariratana, W. and Ngang, T. K. (2015). The impact of leadership styles of school administrators on affecting teacher effectiveness. Procedia-Social and BehavioralSciences,186,1031-1037.
57.Somech, A. and Wenderow, M. (2006). The impact of participative and directive leadership on teachers' performance: The intervening effects of job structuring, decision domain, and leader-member exchange. Educational Administration Quarterly, 42(5),746-772
58.Brown,M.E.and Treviño,L.K.(2006). Ethicalleadership:Areviewandfuture directions. The leadership quarterly, 17(6),595-616.
59. Djalil, M. A., Indriani, M. and Dariyansah,F.(2016).Theinfluenceof leadership style, integrity and organizational commitment on the
Mujuni et al
performance of State Development AuditAgency.
60.Leroy, H., Palanski, M. and Simons, T. (2012). Authentic leadership and behavioural integrity as drivers of follower commitment and performance. Journal of Business Ethics,107,255–264.
61.Luther,N.(2000).Integritytestingand job performance within high performance work teams: A short note. Journal of Business and Psychology,15(1),19-25.
62.Piccolo, R. F., Greenbaum, R., Hartog, D. N. D. and Folger, R. (2010). The relationship between ethical leadership and core job characteristics. Journal of Organizational Behaviour, 31(2‐3), 259-278.
63.Sani, M. K. J. A., Endin, M. Z., Masrek, M.N.,Sahid,N.Z.,JamiahBaba,J.and Kamis, Y. (2016). Integrity and job performance: The experiences of public library leaders. Journal of Southeast Asian Research. doi:10.5171/2016.452256
64.White, D. W. and Lean, E. (2008). The impact of perceived leader integrity on subordinates in a work team environment. Journal of Business Ethics, 81(4), 765-778. doi 10.1007/sl0551-007-9546-6
65.Palanski, M. E. and Yammarino, F. J. (2011). Impact of behavioral integrity on follower jperformance: A threestudy examination. The Leadership Quarterly, 22(4), 765-786. https://doi.org/10.1016/j.leaqua.2011 .05.014
44