METHODOLOGY
Study Design
A descriptive research design was used because it required gathering, analyzing and presenting collected data from a large number of respondents.
Study Area
This study was carried out in Kampala International University Western Campus Ishaka, where developments in the use of e-resource and ICTs has been a major concerned.
Target Population
The population consisted of all academic staff and all students of three faculties’ that is Faculty of Education, Faculty of Business and Management and Faculty of Biomedical Sciences and library administrators (library admins) of KIU western campus. A total number of 5223 academic staff, students and library admins was the population for the study. The number of Academic staff in the faculty of education is 66, total number of academic staff in the faculty of business andmanagementis47andtotalnumberof academic staff in faculty of biomedical is 93andtotalnumberoflibraryadminsis 5, making a total of 211 academic staff from the three faculties and library administrators. Total number of students in the faculty of education is 2260, total number of students in the faculty of business and management is 689 and total number of students in faculty of biomedical is 2063, making a total of 5012 studentsfromthethreefaculties.Seetable 3.1belowfordistributionofPopulationfor the study as at May 2018). KIU western campus had close to 8 faculties but due to limitedresources,theresearchercouldnot cover all the faculties and thus selected only three faculties for the study.
Sampling Method
Sample size was arrived at using a multistage sampling technique. Multi stage sampling technique entails the process of applying two or more sampling technique for the purpose of selecting an adequate representativesamplesize.Theresearcher for the purpose of this study applied the purposive, and probability sampling technique in selecting the sample for the study. Purposive sampling allows for a selection of sample from an entire population using pre-determined criteria
relevant or of interest to the study. Purposive sampling was used to select library administrators because they are directly involved with e-resource utilization. Faculty of biomedical sciences waspurposelyselectedbecausetheyareto some extent science oriented and most of their course units are taught using eresources. Again,faculties of business and management and education were purposely selected because they may to some extent have little knowledge abouteresource utilization and so the researcher was interested in finding out why. Probability sampling was also used and was based on the fact that every member of the population (staff and students) had a known and equal chance of being selected. This method of sampling gave the probability that our sample was representative of the population.
Sample Size and Sampling Technique
The total number of academic staff from the three faculties was 206 and that gave us a sample size of 136 for the study. The number of library administrators purposely selected was 5 and thus no sample size. The total number of students from the three faculties was 5012 and that gave sample size of 361 students from the faculties of Education, Business and management and Biomedical in KIU western campus making the total sample size of 502 respondent for the study. This was determined using the [4] sample size determination table that is attached as appendix C.
Data Collection Methods
For the purpose of this study, the researcher contacted sampled respondents for reliable information using observation/resource inspection checklist for academic staff, and a structured questionnaireforthestudentrespondents.
Observation/Resource Inspection Checklist
The researcher used the observation/resource inspection checklist for academic staff and library admins in ordertohaveanearoneononeinteraction with them, to record observations as in Yes/No options in order to establish observable items such as e-books, ejournals, online data bases, multimedia
www.idosr.org
73
Banyuy et al
www.idosr.org
resources, online public access catalogues (OPACS) and emails, if and when available.
Questionnaire
Questionnaires were administered on the student respondents. The questions were made up of close ended, which required respondents to give a yes or no answer, openended which were questions thathad unlimited responses. Respondents were to provideafree-formanswerwhichwerenot restricted to a word or two, and multiple choice questions, which respondents had several option from which to choose. Thesequestionnaireswereadministeredto the respondents in their various study rooms by the researcher. Similarly, the questionnaireallowedforindependencein responses from respondents even with the researcher’s presence.
Data Processing
Data collected from observation/resource inspection checklist were edited, categorized according to themes and then summarized into percentages in a computer spreadsheet. Data collected from the SAQS were also edited, categorized, coded and entered into the computer using the Statistical Package for SocialSciences(SPSS)togeneratesummary frequency tables, charts and graphics.
Data Analysis
Data were analyze according to each objective. Objective one and two were analyzed using the descriptive statistics,
Banyuy et al
where the mean and standard deviations were obtained. The researcher used descriptive statistics to generate data and findout the prevalence rate at which these e-resources were available for teaching and learning and whether or not staff and students are aware of them and possess the necessary skills to be able to access them. Objective three was also analyzed using descriptive statistics using a four linkart scale. Lastly, inferential statistics was done in order to correlate the DV (teaching and learning), and IV (eresources) and find out their significance.
Ethical Considerations
This research study was carried out subject to approval by the Research Ethics Committee of Kampala International University Western Campus, Uganda. Informed consent: The principle of informed consent involved the researcher providing sufficient information and assuring the participant about taking part in the research to allow participants to understand the implications of participating in the research and to reach a fully informed, considered and freely given decision about whether or not to do so, without the exercise of any pressure. Voluntary participation of respondents in the research is important. Moreover, participants had the right to withdraw from the study at any stage if they wish to do so.
RESULTS
Atotalof502questionswereadministered to the staff and student population from the three faculties Business and Management, Education and Biomedical science and library administrators of Kampala International University Western Campus, of which all the questionnaires were dully filled and returned, giving a response rate of 100%. 361 questionnaires were distributed to the students from the three faculties, faculty of business and management, faculty of education and
faculty of biomedical sciences which were filledand returnedgiving a 100% response rate while, a total of 141 questions were responded to by staff and library administrators by observing items such as e-books, e-journals, online databases, multimedia information resources OPACS, emails and e-music. A response rate of 100% was recorded on the staff population from the three faculties and library administrators. Table 1: Awareness of E-resources
Source: Field data, February, 2019
74
N=361 Yes 316 87.6 No 45 12.4 1.12 0.331
VARIABLE FREQUENCY PERCENTAGE (%) MEAN STD. DVTN
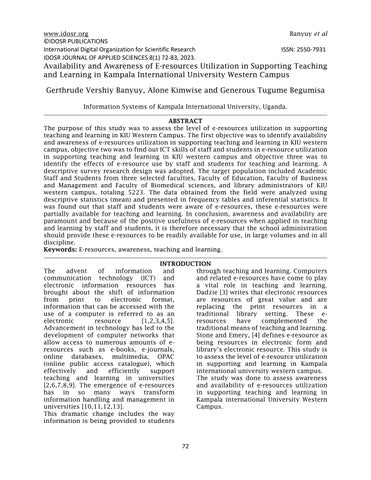
Figure 1: awareness of e-resources
Findings from this study showed that 316 (87.6%) students from the three faculties were aware of e-resources with a high response rate and 45 (12.4%) were not aware of e-resources with a low response rate.Fromtheabovefindingsitshows that
students know what e-resources are and their advantages. The mean response of 1.12 and standard deviation of 0.331 were obtained. This indicated that students were aware of e-resources.
www.idosr.org Banyuy et al 75
VARIABLE
(%)
N=361 Yes 263 73.0 No 49 13.5 No response 49 13.5
0 10 20 30 40 50 60 70 80 90
Series
Table 2: E-resource Availability
FREQUENCY PERCENTAGE
Mean STD. DEVTN
1.41 0.717 Source: Field data, February, 2019
Yes No
1 Series 1
0
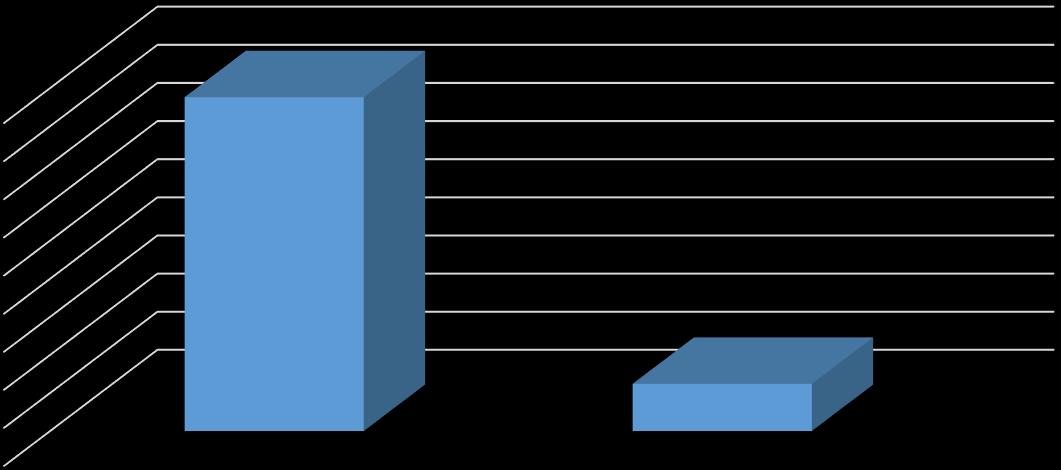
Figure 2: e-resource availability
Results showed that majority of the respondents 263 (73%) from the three faculties accepted that e-resources were available, 49 (13.5%) said e-resources were not available and 49 (13.5%) never responded weather e-resources were
available or not, giving us a high response rate on availability. The mean of 1.41 and standard deviation of 0.717 were obtained showing a positive response on availability.
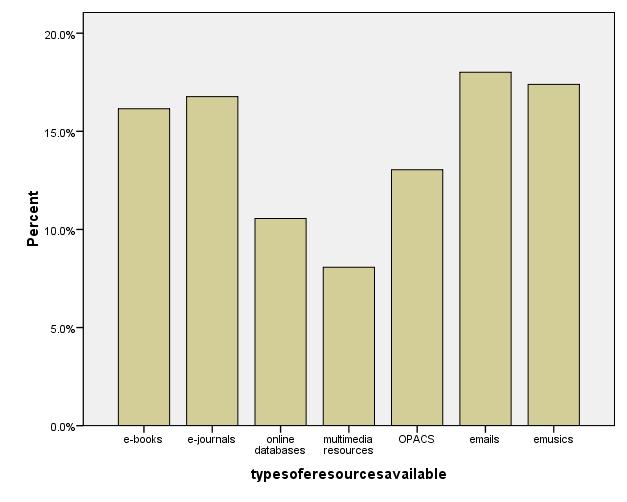
Types of E-resources Available
From the data generated, it was found out that majority of the respondents 170 (62.5%) from the three faculties said ebooks wereavailableand85(31.2%)saidebooks were not available with a mean of 1.33 and standard deviation of 0.472
showing a significant agreement on availability, 34 (12.8%) said e-journals while 80 (29.4%) said e-journals were not available witha meanof 1.70andstandard deviation of 0.460, 67 (24.6%) said online data bases were available while 66 (24.3%)
www.idosr.org Banyuy et al 76
Table 3:
VARIABLE Available Percentage (%) Not available Percentage (%) Frequency Mean Std. Dev. N=1081 E-books 170 62.5 85 31.2 255 1.33 0.472 E-journals 34 12.8 80 29.4 114 1.70 0.460 Online databases 67 24.6 66 24.3 133 1.50 0.502 Multimedia resources 100 36.8 26 9.6 126 1.21 0.406 OPAC 35 12.9 18 6.6 53 1.34 0.478 e-mails 272 100 0 0 272 1.00 0.000 e-Music 90 33.1 44 16.2 134 1.33 0.471 Source: Field data, February, 2018
50 100 150 200 250 300 yes no no response 263 49 49 Series 1 Series 1
www.idosr.org
said they were not available. the mean of 1.50 and standard deviation of 0.502 were obtained showing a disagreement. 100(36.8%), said multimedia information resources were available, while26 (9.6%) said multimedia information resources were not available with a significant mean of 1.21 and standard deviation of 0.406 showing multimedia resources are available. also 35 (12.9%) said OPACS were available while 18(6.6%) saidthey were not available witha meanof 1.34andstandard deviation of 0.478 showing a disagreement. 272(100%) said emails were available with mean of 1.00 showing positive significant on availability. And
Banyuy et al
lastly, 90(33.1%) said e-music were available while 44(16.2%) said they were not available with a mean of 1.33 and standard deviation of 0.471 showing and agreement on availability. From the above findings, a high response rate was generated from the fact that emails were more available because students use their emails on daily bases, andsecondlythatebooks were also available. This shows that e-books are “flexible”, e-books are cheap and increased comfort, makes referencing easier. E-books allows you to search for topics and key words inside or out on the web.
4: Use of E-Resources for Learning VARIABLE FREQUENCY PERCENTAGE (%)
Table
Source: Field data, February, 2019
From the above results, respondents were allowedtoselectmorethanonechoiceand so the frequency was more than 361. a high response rate 304 (84.2%) was generatedfromthefactthatstudentsfrom the three faculties use e-resource for class work purposes, 174 (48.2%) use eresources for research/project work, 256 (70.9%) respondents said they use eresourcesforassignments,122(33.8%)use e-resourcesformultimediainstructionand
learning, 144 (39.9%) said they use eresources for teaching, 264 (73.1%) responses came from the fact they use eresources for learning, 97 (26.8%) use eresources for seminar presentations... A high response rate was recorded from the use of e-resources for class work purposes because students need to do class work as part of learning activities and they need these e-resources to search for information.
77
Research/project
N=1361 Class work 304 84.2
work 174 48.2 Assignments 256 70.9 Multimedia Instruction and learning 122 33.8 Access learning materials 144 39.9 Reading in preparation for exams 264 73.1 Seminar presentation 97 26.8
www.idosr.org
Banyuy et al
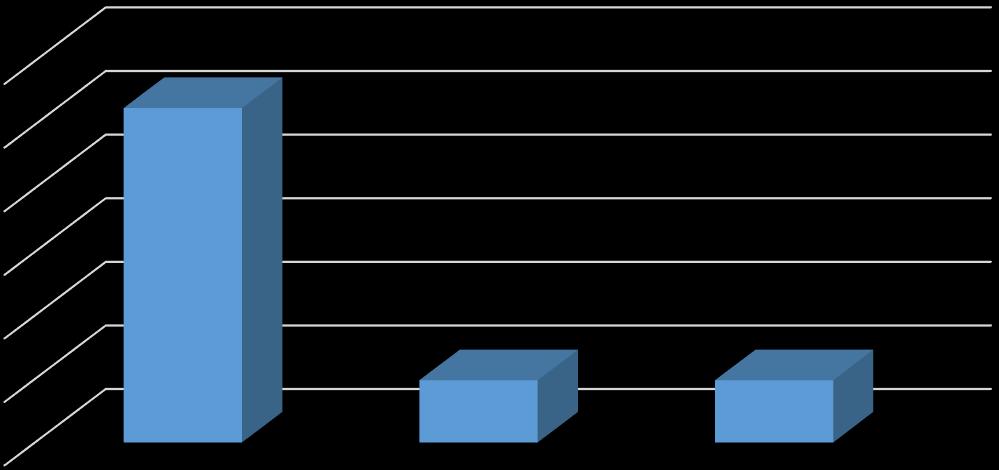
Table 5: Awareness of E-Resources VARIABLE FREQUENCY PERCENTAGE (%) MEAN DIFFERENCE STDN
N=141
Yes 133 94.3
No 8 5.7 1.06 0.232
Source: Field data, February, 2019
From the table above, a high response rate 133 (94.3%) was recorded from the staff population of the three faculties and library admins who said they were aware ofe-resources,whilealowresponserateof
8 (5.7%) said they were not aware of eresources. A mean of 1.06 and standard deviation of 0.232 were obtained. This therefore implies that a majority of the staffareawareofe-resourcesandthatthey have value in teaching.
Figure 3: awareness of e-resources
78
Table 6: E-resource Availability
Source: Field data, February, 2019
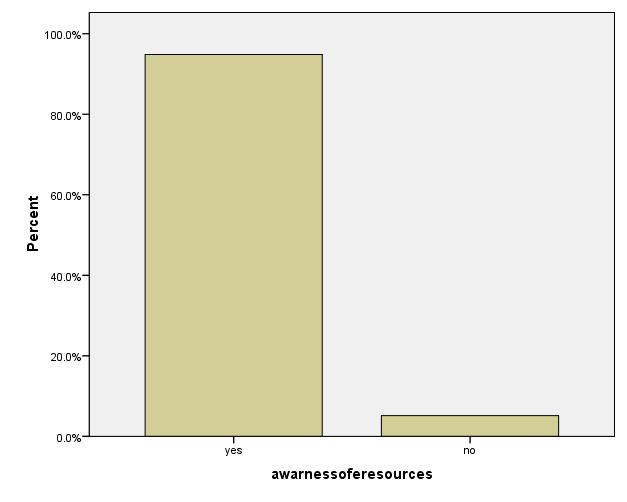
The results above shows that a majority of thestafffromthethreefacultiessaidthese e-resources were not available with a high response rate of 100 (70.9%) while a percentage of the staff including library admins said these e-resources were available, and 34 (24.1%), while 7 (5.0%) of the staff population never responded.
Fromtheaboveresults,ameanof1.82and standard deviation of 0.513 were obtained which was showing a negativity on availability of e-resources. These eresources have to be available for staff to use because it will give them access to a variety of information students need for learning and make teaching activities easier.
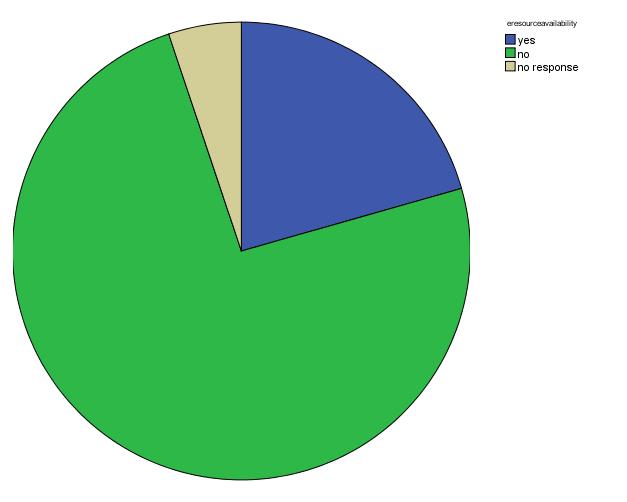
Figure 4: e-resources availability
www.idosr.org Banyuy et al 79
VARIABLE FREQUENCY PERCENTAGE (%) MEAN STD. DEVIATION N=141 Yes 34 24.1 NO 100 70.9 No response 7 5.0 1.80 0.497
Table 7: Types of E-Resources Available E-resources Available Not available Mean
N=29
Std. Dev.
e-books 26 (89.7) 3 (10.3) 1.10 0.31 e-journals 27 (93.1) 2 (6.9) 1.11 0.26 Online databases 17 (58.6) 12 (41.4) 1.41 0.50
Multimedia resources 13 (44.8) 16 (55.2) 1.55 0.506
OPACS 21 (72.4) 8 (27.6) 1.28 0.46 e-mails 29 (100) 0 (0.0) 1.00 0.00 e-Music 28 (96.6) 1 (4.4) 1.00 0.00
Source: Field data, February, 2019
From the above table, the data generated shows that 26 (89.7%) of the respondents from the three faculties said e-books were available and 3 (10.3%) said they were not available. the mean of 1.10 and standard deviation of 0.310 were obtained. secondly, 27 (93.1%) said e-journals were available while 2 (6.9%) said they were not available with mean and standard deviation of 1.107 and 0.262 were obtained, showing lack of availability. thirdly, 17 (58.6%) said online databases were available while 12 (41.4%) said they were notavailable with a mean of 1.41 and standard deviation of 0.501 were gotten. also, 13 (44.8%) said multimedia resources
were available while 16 (55.2%) said they were not available. the mean of 1.55 and standard deviation of 0.506 were obtained showing lack of availability. again, 21 (72.5%) respondents said OPACS were available while 8 (27.6) said they were not available with mean and standard deviation of 1.28 and 0.45. in addition, 29 (100%)oftherespondentssaidemailswere available while 0% said they were not availablewithameanof1.00andlastly,28 (96.6%) of the respondents said e-music was available while 1 (4,4%) said it was not available. a mean of 1.00 was obtained. From the above discussion, the means are all positive showing that only a few of the e-resources are not available.
www.idosr.org Banyuy et al 80
Figure 5: types of e-resources availability
Table 8: Use of E-Resources for Teaching VARIABLE FREQUENCY PERCENTAGES (%) N=320
Easy access to teaching Materials 100 31.2
Ease in the formulation of test/exams questions 90 28.1 Research purposes 80 25.0
Effective seminar presentations 50 15.6
Source: Field data, February, 2019
The table above allowed respondents to select more than one option that explains why the frequency was more than 141. It indicated the purpose of use of eresources for teaching. it shows that 100 staff use e-resources because it helps in easy access to teaching materials, with a percentage of 31.2%, 90 use e-resources
because it helps in the formulation of test and exams questions, with a percentage of 28.1%, 80 use e-resources for research purposes with a percentage of 25.0%, and lastly 50 use e-resources because it helps in effective seminar presentations with a percentage of 15.6%.. This therefore mean that e-resources are important sources of
www.idosr.org Banyuy et al 81
www.idosr.org
information and should be used in teaching and learning.
Table 9: Point of Access of E-Resources
VARIABLE FREQUENCY PERCENTAGE (%) MEAN STD. DEV. N=141
Office 54 38.3 Home 81 57.4 Library 2 1.4 Office & Library 1 0.7
All the above 3 2.1 1.69 0.679
Source: Field data, February, 2019
The results below indicates that 54 (38.3%) of the staff population from the three faculties including library admins access these e-resources from their offices, a majority of the staff with a response rate of 81 (57.4%) access these e-resources from home. 2(1.4%) staff from the three faculties access e-resources from the library and, 1 (0.7%) of the staff access these e-resources from office/library, and library and 3 (2.1%) access e-resources
Table 10: Means of Access of E-Resources
VARIABLE FREQUENCY PERCENTAGE (%) MEAN
Source: Field data, February, 2019
The table above shows that a majority of the staff from the three faculties including library admins access these e-resources personallywithahighresponserateof126 (89.4%), no staff access e-resources with help from librarians, a percentage of the
This objective was to identify availability andawarenessofe-resourcesutilizationin supporting teaching and learning in Kampala international University Western
from home, office, library, office/library. The mean obtain was 1.69 (negative) and a standarddeviationof0.679.Thistherefore implies that these e-resources are not available for staff as a high response rate is recorded that staff access e-resources from home and not from their offices as the case maybe. They need to have access to these e-resources in their offices to make teaching activities efficient and effective.
staff 8 (5.7%) access them with help from ICT staff, and a small percentage 7 (5.0%) of the staff never responded, with a mean of 1.24 implying staff do not need help in accessing e-resources. and standard deviation of 0.748.
DISCUSSION
Campus. Findings from the data collected revealed that students and staff were aware of e-resources. This is supported by the DOI theory of [5], staff and students
Banyuy et al 82
STD. DEV. N=141 Personally 126 89.4 With assistant from libs staff 0 0 ICT staff 8 5.7 No response 7 5.0 1.24 0.748
www.idosr.org
know the value of e-resources and so will adopt and use them. Awareness of electronic resources therefore means staff and students have knowledge of the availability of the resources, their services andtheextentofuse[6].Thestudentssaid e-resources were available. This in line with a study conducted by [7] who said eresources were available in the University
Banyuy et al
of Calabar in Nigeria, Inferential statistics showed a correlation between use of eresources for teaching and learning and eresource awareness, e-resource availability, use of e-resource and skills required to access e-resources. The analysis showed that there was a positive significant relationship with use of eresources for teaching and learning.
CONCLUSION
The educational sector since the commencement of the use of e-resource for teaching, has recorded great impacts. Theuseofe-resourcesmakesteachingand learningmoreeffectiveandefficientwhich means staff and students need to take advantage of it numerous benefits and opportunitiesitoffers. They wereawareof
these e-resources, had the necessary skills required to access them. From the above findings, we can conclude that students therefore need to be given special training on the skills needed to access e-resources to be used for their learning activities and these e-resources needs to be available in their large numbers and in all disciplines.
REFERENCES
1. Ani, O. E., Ngulube, P. and Onyancha, B. (2015a). Perceived effect of accessibility and utilization of electronic resources on productivity of academic staff in selected Nigerianuniversities. SAGEOpen, 5(4).
2. Massachusetts Institute of Technology Association of American Universities (2018). www.aau.edu. Retrieved 2018-0817.
3. Dadzie, P. S. (2005). Electronic resources: access and usage at Ashesi University College. Campus-WideInformationSystems, 22(5), 290–297. https://doi.org/10.1108/10650740510632 208
4. Krejcie, R. V. and Morgan, D. W. (1970). Determining Sample Size for Research Activities. Educational and Psychological Measurement, 30(3),607–610.
5. Sahin, I. and Rogers, F. (2006). Detailed Review of Rogers ’ Diffusion of Innovations Theory and Educational TechnologyRelated Studies Based on Rogers. The Turkish Online Journal of Educational Technology, 5(2),14–23.
6. Egberongbe, H. S. (2011). The Use and Impact of Electronic Resources at the University of Lagos. Library Philosophy & Practice, 147–155. Retrieved from http://search.ebscohost.com/login.aspx?di rect=true&db=lih&AN=77410567&site=eho st-live
7. Tette, E. M. A., Sifah, E. K., Nartey, E. T., Nuro-Ameyaw, P., Tete-Donkor, P. and Biritwum, R. B. (2016). Maternal profiles
and social determinants of malnutrition andtheMDGs: Whathavewelearnt?. BMC publichealth, 16,214.
8. WilliamMufanaMasisani,IbrahimAdabara (2022). Monitoring with Communication Technologies of the Smart Grid. IDOSR JournalofAppliedSciences, 7(1):102-112.
9. Rebecca Kisakye (2022). Simulation and Analysis of Dipole Transmitter Antenna (KIU Laboratory). IDOSR Journal of Computer and Applied Sciences 7(1): 119135.
10. Mukisa Sarah Namugenyi, Feiswal Abdalla (2022).AnAutomatedStudentRegistration System: A Case Study of Lugazi Primary School. INOSR Experimental Sciences, 10(1):25-41.
11. Anthony Nambale, Zainab Kalyankolo, Umar Kalyankolo (2022).Design and Implementation of an Intelligent Voice Controlled Wheel Chair. IDOSR Journal of ScienceandTechnology,7(1);67-76.
12. Elisado Mwesigye (2022).Management styles used in the selected secondary schools in Uganda. IAA Journal of Education, 8(1):90-96.
13. Sekiti Hamisi, Ibrahim Adabara (2022). Security Analysis for Virtual Private Network Based on Site to Site Circuit Switching (Vpns2scs) Case Study: Liquid Telecommunication Ggaba. IDOSR Journal of Computer and Applied Sciences,7(1):95108.
83