
SUBMERGING SOUNDSCAPES
A comparison of architecture’s sonic qualities under water versus above water.
Kiran Gosal
Technical Tutor: Donald Shillingburg
Tutors: Chee-Kit Lai and Doug John Miller Unit 9 at The Bartlett School of Architecture
CONTENTS
01 INTRODUCTION
1.international site context
2.local site context
3.site as a test bed
4.programme
5.concept
6.initial developement
02 UNDERSTANDING FREQUENCY
7.timelines
8.frequency tracking
9.how sound travels through water and spectrograms
03 TIDAL MOVEMENT [environmental focus]
10.understanding the tide
11.the tide on-site
12.environmental section [ventillation strategy]
13.acoustic section
14.material palette and carbon neutrality
04 CONTROLLING THE SONIC LANDSCAPE [technical focus]
15.frequency analysis
16.blender fluid simulations
17.blender sound simulations [sound bricks]
18.pachyderm sound simulations
19.comparing methods
20.pond design
05 USING FREQUENCY TO ENGINEER [structural focus]
16.densities
17.material resonant frequencies
18.material audio tests
19.wall gradient (ground boundary)
20.sonic roofing (ceiling boundary)
CONCLUSION
BIBLIOGRAPHY IMAGE SOURCES
ABSTRACT
SUBMERGING SOUNDSCAPES
The dissertation is an investigation into underwater acoustics, and how the sonic landscape is altered once submerged. Frequency is an integral part of the study, understanding how it can be manipulated, what it’s properties are and how it can ultimately be used to promote growth, create different levels of comfort and alter environments completely. Frequency will also be used as an engineering tool in the structural segment of the dissertation. The overarching aim is to understand how the sonic qualities of the proposal, a bioacoustics research centre, act underwater and above water. Finding a simulation that allows for accurate analysis of sound travelling through water is a critical approach taken in the dissertation. This is also later compared with physical tests using personal parameters, aiming to outline a strategy in which the building acts as an archive of frequencies which alter different user experiences in different ways.
RESEARCH QUESTIONS
How does the building’s sonic output change when submerged in the flood?
Which simulation/physical method allows for a clear understanding of sound’s propogation through water?
How is frequency used to promote biodiversity, health and alter environments?
KEY TERMS :
bioacoustics: bioacoustics is the cross-disciplinary science of biology and acoustics, looking into how animals interact through sound
soundscape: what the landscape sounds like, and how this changes.
acoustic gradient: when frequencies or decibel level increases or decreases on a gradient
On visiting Rotterdam, something that was evident was the significant amount of flood infrastructure. Due to Rotterdam being the world’s biggest port, I was particularly drawn to the aquatic environment and began investigating underwater noise pollution. Due to ship traffic, which was something that Rotterdam has been exposed to since before World War II, the underwater habitat is something that has suffered and been altered historically. Therefore, choosing a site which allowed for an investigation into mitigating sound pollution was essential to the research.

INTERNATIONAL SITE CONTEXT
Rotterdam is a city known for its flood infrastructure and shipbuilding regimes. However, this does not eradicate the fact that soon most of the area will be underwater, the cities major problems being coastal flooding, and noise pollution from port works. This also includes underwater noise pollution, which is generated due to the amount of ship traffic covering the coast. The 1:1250 map showcases the areas prone to flooding, as well as the concentration of noise polluted areas.


Stormpolder is an isolated island forty minutes from Rotterdam’s city centre, containing a working port which is based primarily around metal work and shipbuilding. The ‘flood forest’ lies on the left of the port, earning its name by hosting bidaily floods which affect the whole area of the forest. These floods can occur within the hour, so safety and tidal movement is something the building will have to consider. SITE AS A TESTBED


site sections showing the forests relationship to the water


The chosen programme is a bioacoustics research centre, designed to help foster biodiversity in the local area. Using frequencies on-site and generated frequencies to create a sonic landscape that changes with the different eras of the building.


OF THE BIOACOUSTIC RESEARCH CENTRE
When beginning my research surrounding the typology, I looked into sound installations that manifested this aesthetic and conceptual goal. As well as conventional research centres that interacted with the ground in a way that could be learnt from.


UNDERSTANDING SOUND the fundamentals of sound propogation and frequency

SOUND PROPOGATION : AIR/WATER
Sound travels through water four times faster than in air due to the particle arrangement.3 (F03) Sound is a longitudinal wave, which is a vibration that occurs in the same direction that the wave is propagating. The project touches on four types of waves: water waves, sound waves, radio waves and light waves, however the focus is on sound waves.4
Radio and light are on the electromagnetic spectrum (F04), this means they can travel through a vacuum, not needing any physical mass to propagate through, they are transverse waves. Underwater noise pollution is evident on the chosen site, due to ship traffic being prominent. This harms marine animals, as it prevents them from hearing natural ocean noises, and pushes them from their natural habitats - in extreme cases the pollution can even change their migration patterns.5

CONSTRUCTIVE AND DECONSTRUCTIVE INTERFERENCE
Deconstructive interference is when two waves travelling in the same direction meet and the waves cancel out, whereas constructive interference is when the waves amplify the sound (the sound is doubled).
OCEAN ACOUSTICS
Ocean acoustics is the study of sound underwater, specifically in the sea. When objects vibrate underwater, it creates sound-pressure waves which compress and decompress water molecules as the sound wave travels.6
Marine soundscapes are different to soundscapes above water, sound typically traves faster and with more clarity through water. The ocean’s frequencies are usually on average lower frequencies, around 30Hz, which can be harmful to some mammals, specific frequencies utilised in the dissertation and project will be illustrated in the next section.7
FACTORS
FREQUENCY VALUES

Fish hearing range is much lower than humans and land animals, this may be due to underwater frequencies being in the lower-range and is caused by their environment.
A specific range of frequencies absorbed by plants is not available through research, however the frequency 432Hz, is known to induce plant growth, but interestingly also is reported to ‘calm’ humans, and have positive effects on health.
ON-SITE FREQUENCIES


SPECTROGRAM
Understanding how to read a spectrogram is essential for the dissertation set-up. Using on-site recordings and an online spectrogram producer I will interpret the data for later usage.
Spectrograms are a graphical representation of sound, they include a gradient of colours which relate to Decibels (a logarithmic unit used to measure sound level).6

Understanding the 3 axes allows for an understanding of the whole graph. Overall, a spectrogram will show how much energy (PSD) there is at a particular frequency at a particular time.
Frequency - how many times per second the sound source vibrates. Every sound can be split up into frequencies, a pure frequency is a sine wave (image below).
Time - How long the sound persists
PSD - the colours in the spectrogram display the ‘loudness’ of a frequency at a given time. In the average spectrogram, colder colours represent the quieter sounds and warmer colours are louder.


pink and purple hazebackground noise.
PREDICTING ON-SITE FREQUENCIES
This chapter introduces the ideas of soundscapes and tidalscapes. Analysing the site context - how frequency moves around the site and the proposal, and how the tide has an effect on this.
The figure below displays the suggested frequencies that will be both produced by the building and the frequencies on-site that the building will interact with. This adjacency assumes the low-tide state, meaning only the parts close to the tide will be affected by underwater frequencies.
black space - time before the spectogram was activated.
yellow and orange lines - pronounced sound, for example human voice.
yellow and orange lines - increased gradient in pitch of the pronounced sound.
ON-SITE dB AND FREQUENCY DATA
To analyse on-site sound and frequencies, I used both an online decibel simulator and also my own on-site recordings to infer a base understanding of the existing sonic atmosphere of the site. The figure below displays the results of the on-site decibel mapper, using the gradient scale to infer the ‘loudness’ site in a low-tide state.
SOUND FROM THE PORT BARRIER [ON-SITE FENCING]
DECIBEL - A decibel is a logarithmic unit that is utilised to measure the level of sound [how loud or quiet something is]
CONSTRUCTIVE INTERFERENCE PATTERNS


LOW-TIDE [TIDE HEIGHT + 6.4M]
LOWEST LOW-TIDE [TIDE HEIGHT + 4M]


CONSTRUCTIVE INTERFERENCE
ONLY FOUR ROOF TYPES TO CHOOSE FROM
LOW-TIDE [TIDE HEIGHT + 6.4M]
LOWEST LOW-TIDE [TIDE HEIGHT + 4M]

SOUND FROM
CAN CHANGE SOUND LEVEL AND FREQUENCY
ACOUSTIC GRADIENTS
This simulation had a lot of limitations in the changeable sound variables, but mostly the modelling capabilities. It is useful when understanding a general sound map of the site, and introduces ideas of decibels and frequency.

CHAPTER 01
TIDAL MOVEMENT [ENVIRONMENTAL FOCUS]
TIDAL ANALYSIS WITH MOST RECENT ITERATION


The most important tidal values are the lowest-low tide [+4m] from the sea bed level shown in section, the low tide [+6.4m], the high-tide [+7.9m] and the highest-high tide [+9m]. These values are all averages. In 2050 the site is predicted to be fully submerged due to rising sea levels.
WORKING SECTION [ENVONMENTAL IMPLICATIONS]


WORKING SECTION [ACOUSTIC IMPLICATIONS]
Based off the simulations and material tests the dissertation demonstrates, an acoustic section has been iterated. The rationale behind the section below is shown through the next chapter, controlling the sonic landscape. It explains in detail how this section was formulated.


RELATIONSHIP 01 BETWEEN ACOUSTIC AND TIDAL ENVIRONMENT
The research ponds that are the subject of the technical investigation, will have two sonic environments - submerged and not submerged. The frequencies present therefore change when water is present. In the low-tide, the pond is empty and is subject to echoing, whilst the sonic landscape can be predicted to obtain frequencies from 100Hz-300 Hz. These include the human voice frequency, forest frequencies and bird song.


RELATIONSHIP 02 BETWEEN ACOUSTIC AND TIDAL ENVIRONMENT
The underwater sonic environment in the research pong will differ. Lower frequencies are present, such as 30Hz (ocean frequencies), these will overpower the high frequencies produced, which is partially the reason why our voices and other sounds sound muffled underwater
QUESTION 01 : How can we promote biodiversity using frequency manipulation?


In theory, the sound lenses can be tuned to reflect very specific frequencies. It is due to the refractive index of the lens, similar to a visible light lens. These lenses would be used in the proposed building to reflect frequencies [100Hz>] that attract fish and underwater animals, in turn creating a more biodiverse tidal region. It has proven difficult to test these lenses accurately without scientific equipment. However, the programme Pachyderm Acoustic allowed for a better understanding that specific sound waves are reflected whilst others are absorbed.

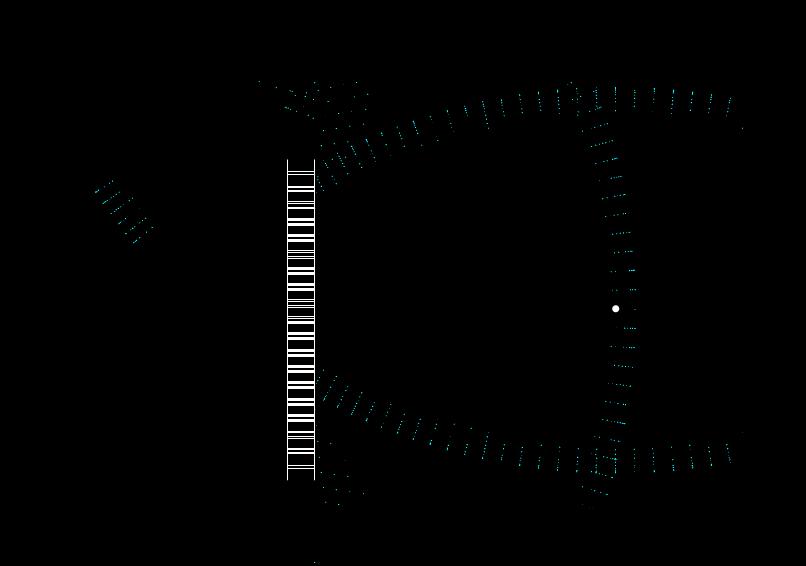
iterated the lens design based off research into Lunenburg Lenses and metamaterials. These metamaterials can reflect specific frequencies of sound into the environment, based of the refractive index of the pattern. Refractive index is how much something can refract a wave by.
CHAPTER 02
CONTROLLING THE SONIC LANDSCAPE [TECHNICAL INVESTIGATION]

The main technical investigation aims to find a digital simulation with which underwater sound can be measured and analysed accurately. The building itself aims to induce acoustic gradients throughout the building, therefore polar extremes must be identified [loud vs quiet/ low frequencies vs high frequencies]. These acoustic gradients affect both humans and underwater animals.
Understanding how sound moves through massing’s of the proposed building is essential
in finding the ‘quiet’ areas, which are then made even quieter by the designed sound absorption bricks, also designed through this chapter. The simulation tests are complimented with physical tests, which help verify any findings. The overall question of how the buildings soundscape behaves underwater in comparison to above water is attempted to be answered in this section.
INTRODUCTION
The part of the building explored through the main technical investigation is the research ponds. The outcome is to design two varying ponds which provide different acoustic environments to the humans researching inside the chambers. The exteriors affect the marine life, sound lenses and bricks are integrated into the facade, which promotes the healthy underwater environment desired. The material pallet of scrap metals and concrete for absorption qualities are also investigated.
RESEARCH QUESTIONS
THE LEVEL CHANGES AND ARRANGEMENT OF ROOMS IN THE RESEARCH SPACE WILL BE DECHIPHERED THROUGH THIS CHAPTER
THIS CURVED FORM IS FOUND THROUGH THIS CHAPTER
01 is Blender an effective programme when dealing with fluid simulations?
02 is Blender an effective programme when dealing with acoustic simulations?
03 is Pachyderm an effective programme when dealing with interior acoustic simulations?
04 can we measure underwater sound?
05 do physical experiments have a similar output to the simulations?
06 how can we use the research conducted to generate two differing aquacoustic environments in the form of research ponds?
07 how do we control the buildings acoustic gradient?
THE UNDERGROUND CONDITION WILL BE DISCOVERED THROUGH THIS CHAPTER
QUESTION 01 : is Blender an effective programme when dealing with fluid simulations?
BLENDER INTRODUCTION
Blender is an open-source 3D ‘creation suite’, supporting modelling, animation, rigging, simulation, and rendering.5 The project will be making use of the Physics simulations Blender is able to perform, it’s accuracy will be tested against another simulation later in the dissertation. Using the particle’s tab [F13] to set up both acoustic and fluid simulations, will provide an understanding of the effect of the tide on the site, as well as how different frequencies move throughout the site.
HYPOTHESIS
Blender is a known software when regarding visualisation and rendering, however the accuracy of Blender’s programmed Physics may not be the most accurate, as visualisation could have been prioritised over accuracy. Therefore, the hypothesis is that Blender will provide a below satisfactory simulation of the real life events of water movement and sound movement, but will provide some visually interesting representations of these phenomena.


CARVING THE LANDSCAPE
The first step in the building timeline (above) is creating a landscape in which densities of soils are displaced to create ‘peaks and troughs’, and earth mounds are created to produce an acoustic environment. The original landscape is carved to provide aesthetic and acoustic environments. This ‘designed’ landscape will be tested through a fluid simulation set up in Blender, which is intended to alter the landscape simulating erosion due to tidal movement. This will mean that the ‘fluid particles’ will have to be modified to have ‘digging’ properties that will affect the landscape.


5 https://www.blender.org/about/
QUESTION 01 : is Blender an effective programme when dealing with fluid simulations?
FLUID SIMULATIONS
Blender allows for different parameters to be tested and altered, including permeability, pressure, scale of particles and the velocity of particles. Creating a fluid simulation to first test the ‘partially submerged research pods, and using this framework to test other submerged parts of the building, has been simplified into three ‘aquacoustic’ environments.
- low-tide
- high tide - highest high tide (speculating 2050)

TESTING THE ‘CARVED’ LANDSCAPE
Utilising fluid simulations to understand how the tide will move on the ‘carved landscape’ allows the building design to become more strategic. The majority of water particles collect in the underground spaces, however there will be strcutrure within these. This structure will have to be as strong as possible to keep the high pressure water molecules from breaking through.


There are also a lot of molecules at the base of the hill, meaning the structures that will go there will too have to be sealed and strong. Making the simulation in Blender allows for the changing of variables within the simulation. I can change the displacement, velocity and friction of surfaces according to the site conditions and weather the tide is low or high.

QUESTION 01 : is Blender an effective programme when dealing with fluid simulations?
HELMHOLTZ RESONATORS
A Helmholtz resonator is a device consisting of a cavity (typically a hollow sphere or cylinder) with an opening (the neck), through which air can enter and exit. When sound waves travel through the opening, they cause vibrations within the cavity, resulting in resonance at a specific frequency determined by the size of the cavity and the length and diameter of the neck.
Helmholtz resonators are used in architectural acoustics to absorb frequencies especially lower frequencies. This could include ship traffic noise, which is of a low frequency.

Helmholtz resonators are used in architectural acoustics to absorb frequencies especially lower frequencies. This could include ship traffic noise, which is of a low frequency. They can be roughly ‘tuned’ to the problem frequency to help combat noise pollution.
An example of a Helmholtz resonator providing acoustic control is in the Elizabeth Line underground station. The station itself seems very quiet, and has good acoustic absorption qualities, this is mainly due to the Helmholtz cavities in the walls.

HOW SOUND PARTICLES GET ABSORBED
Sound gets absorbed by getting caught by the molecules in the medium it is travelling through. This is due to the kinetic energy of the particle being transferred into small amounts heat energy. Every material has different absorption qualities, usually measure via an absorption coefficient.


QUESTION 02 : is Blender an effective programme when dealing with acoustic simulations?
SOUND BRICK ITERATION I
Using the Helmholtz Resonator form to design ‘sound bricks’ which absorb frequencies will be essential in generating quiet spaces within the sonic landscape. Setting up a sound particle simulation in blender to test the form of the proposed sound brick allows for further understanding of how the particles move through the resonator and how they are ultimately absorbed.


The first trial simulates a terracotta material for the brick, in which you can see the particle movement on the exterior, however you can not see how the particles act on the inside of the brick. Therefore I utilised the material nodes to change the clay texture’s transparency, to allow for a more informative simulation model.

The simulation depicts sound particles entering the cavity,and colliding with the interior walls, therefore losing kinetic energy and being absorbed, this reduces the overall sound of the space, making the environment ‘quieter.’
The transparent simulation shows an abundance of particles getting ‘trapped’ in the corners the most. Colliding with inner cavity walls and losing Kinetic Energy before eventually being absorbed.

Stacking the bricks allows for a scaled up effect of absorption. In the next iteration, the shape of the brick needs to be considered more, as well as the size of the opening, as a middle point must be found. The opening needs to be big enough to let in the most particles it can, however needs to be small enough so they don’t bounce back out of the opening.


QUESTION 02 : is Blender an effective programme when dealing with acoustic simulations?
SOUND BRICK ITERATION II
The next iteration utilises a more irregular shape. This would in theory ‘trap’ more sound particles as there are more crevices for the collisions to take place. The design of the brick takes inspiration from the design language of the landscape carving, constructive interference patterns and the acoustic quality of absorbing the most sound particles.


Having a primary and secondary cavity allows for a system in which the sound particles have two chances to be absorbed. The secondary cavity absorbs the particles that didn’t get absorbed in the first cavity.
The particle simulation shows a higher volume of sound particles being trapped in the cavities on both sides, the thinner neck on the left hand side captures the most sound particles, as the thinner shape means they collide more in a shorter amount of time.

These bricks do not interlock seamlessly, another iteration would be valuable to help these bricks, allowing for a interlocking wall structure, however these bricks can be used in the ceilings of the office areas, to relieve noise from both underwater, and working discussions, this is shown in the render on the next page.


QUESTION 02 : is Blender an effective programme when dealing with acoustic simulations?
MULTI - USE
The sound bricks are also used in ceiling pieces throughout the building, propelled from the structural beams, in order to use the bricks internally, to relieve noise from the work spaces.

ITERATING FOR STRUCTURE
Iteration two of the sound bricks require editing when structure of the brick laying is taken into acount. Through iterative sketching realised that the back of the cavity needs to be much thicker, and this will have minimal acoustic affects too as it is the same form with the same cavities, as seen in the 1:1 detail.
BLENDER PARTICLE SIMULATION ANALYSIS
There are positives and negatives to Blender’s physics system - it claims to allow simulations which ‘mimic’ many physical phenomena, however the accuracy within these must be scrutinized. The primary purpose of Blender is for it to be used in computer graphics, therefore there are some shortcuts made in the physics due to the ability to decrease processing time for users.


Dampening allows you to make estimates on how much each material would dampen sound, however because there are no units, an accurate number cannot be supplied
The rigid body is the solid that is being tested for it’s absorbtion qualities, in these cases they were the sound bricks and the landscape for the fluid simulation.
However, Blender gives the opportunity to change a vast number of variables which allow the user to have almost full control over how a particle or particle system acts. Or this is what the interface seems like, however the ability to accurately change variables is limited.
QUESTION 03 : is Pachyderm an effective programme when dealing with interior acoustic simulations?
PACHYDERM ACOUSTIC INTRODUCTION
Pachyderm acoustic is a plugin for Grasshopper, which is popular amongst designers and scientists when simulating acoustics in buildings, rooms and on a larger scale. It is a collection of acoustics simulation algorithms that are used to predict how sound will travel through a space, whilst also providing a visual representation. Despite the popularity of the software, there are limited resources to understand how to use the software, so a trial and error approach is taken in the dissertation, to come to a conclusion about whether an accurate underwater sound simulation can be programmed.
HYPOTHESIS
Pachyderm acoustic will provide an accurate representation of sound travelling within interior spaces, however with my previous knowledge of Rhino and Grasshopper, I predict that simulating external sound will be harder to do accurately. This is due to the neccesity of running simulations within a closed polysurface (two or more surfaces joined at the edges), and modelling a large body of water as a closed polysurface is problematic due to a limit in the sizing, which is unrealistic.


Boundary representation - a method of represenation of a 3D shape in modelling softwares, done by defining the volume limits of the closed polysurface in this case.
SETTING UP THE SIMULATION FOR INTERIOR SPACES
In order to initially understand how the simulation works, testing interior spaces is easier to begin with. The inputs are the point source where the sound originates from, and the closed polysurface of the form being tested. (F0X)

Point In this script, the point represents the point source where the sound is generated. Geodesic Source - This tells the simulation that the sound source radially disperses in all directions, which is accurate to how soundwaves move from a point.


x https://www.grasshopper3d.com/group/pachyderm#:~:text=185%20members,%2C%20cities%2C%20and%20other%20settings.
TESTING THE SIMULATIOIN

After setting the simulation up, a base understanding of how the simulation works and the outputs it provides was essential to the work flow. I modelled an extrusion of the plan to set the test up, with a point source of sound coming from the room which is adjacent to the ponds that the chapter goes into more detail in later.

QUESTION 03 : is Pachyderm an effective programme when dealing with interior acoustic simulations?
PACHYDERM TO VISUALISE SOUND WAVES
The simulation output shows the particles changing colour as the energy is lost from them, which is accurate to real physics. The sound is mostly absorbed where there is a harsher more defined curve, which is something to explore further. You can use pachyderm in multiple views, which is useful to see the different ways in which sound travels.


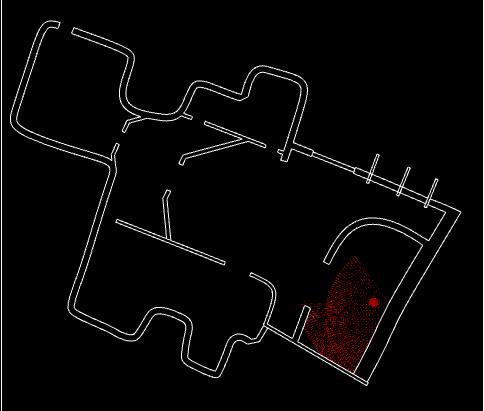


After gaining a basic understanding of how the simulation works, I was able to move onto using it in the massing forms of the research spaces, and develop forms which follow specific patterns [PTO].
IDENTIFYING PATTERNS IN THE SIMULATION


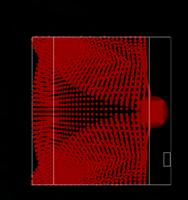


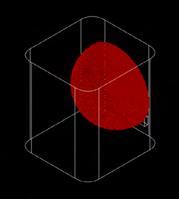

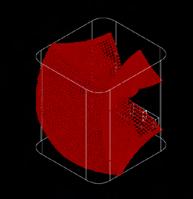


Noticing this pinched pattern in the acoustic simulation was essential in further developing the interior spaces within the building. Utilising previous research knowledge on constructive and deconstructive interference, I hypothesised that with this waveform being naturally formed, making the building a similar form could emulate deconstructive interference.


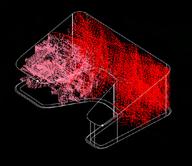


After experiments with pachyderm the form which provides some acoustic isolation, is the ‘pinched’ form on the left. This form is the starting point of the acoustic gradient affect desired throughout the building. It provides a space where sound is already limited, this could be due to the length it has to travel before entering the building, although this is just a speculation.
QUESTION 03 : is Pachyderm an effective programme when dealing with interior acoustic simulations?
APPLYING THE ‘PINCHED’ FORM
Most of the pinched forms will be by the water, enabling larger gradients to form within the building. Meaning the ‘loudest’ parts - the spaces affected by external low frequencies [underwater frequencies - 30Hz], will be adjacent to the quiet spaces which are affected by the pinched form of the building.

FURTHER DISTANCE TO TRAVEL FROM GIVEN POINT SOURCE
CORRIDOR
SIMULATION
From this simulation we can observe where the sound is more prevalant, therefore adding material/wall build up to these sections if the goal is to limit sound within these sections, creating an even more controlled acoustic environment.
The most important acoustic environment needed to be tested is the underwater pond which allows water to gather and changes the acoustic environment of the ‘corridor’, to test this affect accurately the simulation needs to be developed, due to both simulations at this stage not being able to accurately show how sound moves through water.


QUESTION 03 : is Pachyderm an effective programme when dealing with interior acoustic simulations?
INCREASING CEILING
The corridor decreases in width and in height as the user is travelling through, creating spaces of constructive and deconstructive interference (loud and quiet spaces). These will then be added upon by wall thicknesses and textures to increase the extremes of the acoustic gradient. DECONSTRUCTIVE

The simulation clearly shows characteristics of sound waves, revealing accuracy in the physics behind Pachyderm. One characteristic that I observed through a side view of the building model, is the formation of nodes and anti-nodes. NODES AND ANTINODES

Nodes and antinodes form when resonance occurs between two parallel surfaces when spacing is equal and there are an odd number of half wavelengths which is what is observed through the section. these conditions provide a pressure (antinode) at the surface with a varying number of nodes in between. The frequency can be calculated from these waves using the formula f=nc/2l f = frequency, n = number of nodes, c = velocity, l = length)1
1 https://www.sciencedirect.com/topics/engineering/antinode


QUESTION 04 : how can we simulate and measure UNDERWATER sound?
LEARNING FROM THE SIMULATION
Re-analysing the ‘pinched’ form on the exterior of the building allows for a base understanding of how sound moves through air on the outside of the building when the tide is low. However this does not show the comparison in how sound moves through water, only air. With the aim of comparing the two mediums accurately, pachyderm this far does not provide the variables needed to analyse underwater sound propagation and how it will affect the forms.

Adjusting the simulation to allow for a radial dispersion method allows the sound simulation to be more accurate, however in reality, there would be multiple point sources on the exterior of the building, not just two (the amount of points the processing power can handle).
Overall, when there is an irregular edge there are points in the sound simulation which show sound being absorbed at varying rates, however this kind of boundary verses a straight one allows for sound to be dispersed more affectively.


Hypothesis : Using Pachyderm’s variables, the simulation can be edited through the material tab to simulate a water density, therefore allowing the sound to travel through simulated water. If this is unsuccessful, physical tests may be conducted. Comparing water and air, sound will travel faster through air.
QUESTION 04 : how can we simulate and measure UNDERWATER sound?
Material properties on Pachyderm are critical to understand when aiming to simulate sound propogation through water. (Figure X) The material library in Pachyderm has set materials where you can choose from Plate glass, Plaster, Plywood, Diffuser’s and Unoccupied/Occupied. However to further build on this collection absorption coefficients can be used.
Absorption coefficients are measurements used to determine a materials ability to absorb sound waves.
These values vary depending on the material and frequency being absorbed, a table showcasing the values for water are shown on the left these are then inputted into the simulation. This changes the visual outputs, as shown in the figure below.

The old simulation where absorption coefficients were not inputted produced more linear scattering, which is inacurate to how sound waves propagate through water, whereas the newest simulation visualises wave forms and more random particle movement.

The first alteration to the script needs to be the point source; in this script, the source only emits ‘sound particles’ from one side. However, this is not accurate to the research done about how sound particles and emissions behave in the previous chapter ‘Understanding Frequency’. Adjusting the simulation node GeoSrc and Cull allows for the simulation to have radial distribution from the point source.


transmitter’
receiver’

In order to set up the simulation to provide outputs which inform the research question, how can we measure underwater sound? two points need to be set. The first point is a sound transmitter, or the point source, the second point receives the waves, after they have travelled through the mediums. This simulation is affective as we can both view visual patterns and interpret results, whilst also analysing numerical results, providing a quantitative and qualitative data set.
transmitter’
receiver’


The numerical data is formed from raytracing each particle in the simulation, traveling from the transmitter to the receiver. We can draw conclusions from this data such as the lowest frequencies are more clear travelling through water than through air, and the highest frequencies are much faster through water than through air.


03


CONCLUSION [1] : THE SONIC RESEARCH PONDS
The buildings over and submerged in the pond were decided due to the mapping of the constructive and deconstructive interference patterns from the simulation and drawings. The level changes and shapes enable the users to experience spaces of extremely quiet atmoshperes and extremely loud where constructive interference takes place.

CONCLUSION [2] PACHYDERM ANALYSIS
The ability for flexibility in the different views, allows for an analysis from all key angles. Being able to view from the left, allows for clear analysis of the nodes and antinodes in the simulation. This makes it easier when identifying the louder points and the quieter points, essential for finding the extremes in the acoustic gradient of the building.
Pachyderm allows for accurate analysis of sound movement through different mediums, including water, allowing for numerical results as the outcome, which is essential to the project.
The visual output is comprehensive and can easily be explained for the purpose of this dissertation.
Inaccuracy still remains in the parts where the colour gradient is added, as the gradient is changeable, it doesn’t accurately tell the user about the loss of energy in the particle.
CHAPTER 03
USING FREQUENCY TO ENGINEER [STRUCTURAL STRATEGY]

Frequency is a powerful when understanding the universe – ‘If you want to find the secrets of the universe, think in terms of energy, frequency and vibration’, the structural strategy of the research centre and archive utilises the background research on how frequency is absorbed and transmitted in the earlier chapter (Understanding sound), and applies it to the design development of the roof and the walls, with the aim of using structural strategies to create and induce an
acoustic gradient through the building. The strategy to do this is by identifying ‘extremes’, where the structure can be manipulated to provide an extremely quiet point to an extremely acoustically uncontrolled point, by changing forms and materials. The overall construction sequence is also outlined.
QUESTION 01 : how can wall build ups create a gradient of sonic atmospheres?
IDENTIFYING THE GRADIENT
To apply the structural strategy inducing an acoustic gradient, the varying desired acoustic qualities must be identified throughout the building. The most prominent and repeated acoustic gradient is as you enter the building. Using frequency to highlight the change in boundary as you enter the building can be achieved in various means, however tackling this through the walls in the entrance is the design direction chosen.


Acoustically uncontrolled spaces will physically invite the environment into the space, so in the building’s case, the tide will be welcomed into the walkway. This can be seen in Junya Ishigami’s one-kilometre-long museum, it features openings that let water flow over the museum’s floor.
QUESTION 01 : how can wall build ups create a gradient of sonic atmospheres?
ABSORPTION AND THICKNESS
began testing materials typically found on-site, and experimenting with compositions in which variables including roughness would be tested for their acoustic qualities. The investigations proved that rough concrete absorbed lower frequencies.
CASE STUDY STUDIO ANNE HOLTROP
These experiments prompted me to research Studio Anne Holltrop, and analyse the methods used for the walls in this building, as could draw similarities from the rough and irregular texture but put it to use acoustically. The panels shown in figure X, are sandcast concrete panels, which were casted on-stie. The project only uses three materials: concrete, sand, and aluminium (for detailing). The reasoning for these panels was aesthetic and to deliver a building that is site specific, literally – as the panels were casted on the sites landscape, capturing the topography and ground textures.


1:50 ENTRANCE DETAIL 1, 2 AND 3
ABSORBTION AND ROUGHNESS


The tests show that the rougher material absorbs the background noise, which is typically lower frequencies. These low frequencies are prominent on the site as the site submerges - water frequencies average at around 30Hz.


black space - frequencies are absent.
pink and purple hazebackground noise.
yellow and orange linespronounced sound, for example human voice.
yellow and orange linesincreased gradient in pitch of the pronounced sound.


CASE STUDY : OLYMPIC ARCHERY RANGE, ENRIC MIRALLES AND CARME PINOS
This classic piece of architecture is designed to ‘choreograph’ the lighting on-site. This will create varying lighting conditions inside. the concrete slabs are tiled and prefabricated, slotting together carefully to take the irregular shapes required for the archery range. A similar process will be carried out in the building proposal.


QUESTION 02 : can roofscapes further increase the acoustic gradient in the building?
HYPOTHESIS
Utilising the pinched roof that was in the lateral forms, with the aim to create an even stronger gradient. The form is slowly ‘flattened’ out, and the hypothesis based on the other simulations is that the deeper the roof, the quicker the internal sound will be absorbed because more frequent collisions will take place. However, in this simulation, the external soundscape will be tested, due to aiming to understand rain frequencies on the roofscape.


SIMULATING RAINFALL
Doing a physical test to begin the investigation allowed for a basic understanding of what the simulation results would be, even from hearing the sounds made from a shower source to the 3D printed roofing parts, I could speculate that the interior acoustic environment would be of a lower pitch when using the most indented roof.


RESULTS
Spectogram output


GRADIENT

GRADIENT
a mix of frequencies come through to internal spaces [more desireable for human comfort] high frequencies come through to the internal spaces [not desireable for human comfort]


SIMULATING RAIN FREQUENCIES THROUGH AIR

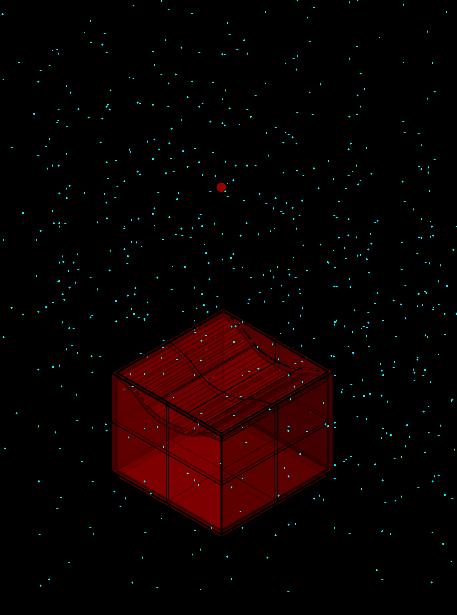
The simulation overall shows that sound is moving faster in water than it is through the air. The sound in this instance represents the rain, and simulates where rain would be falling onto the roof through air, or through water.


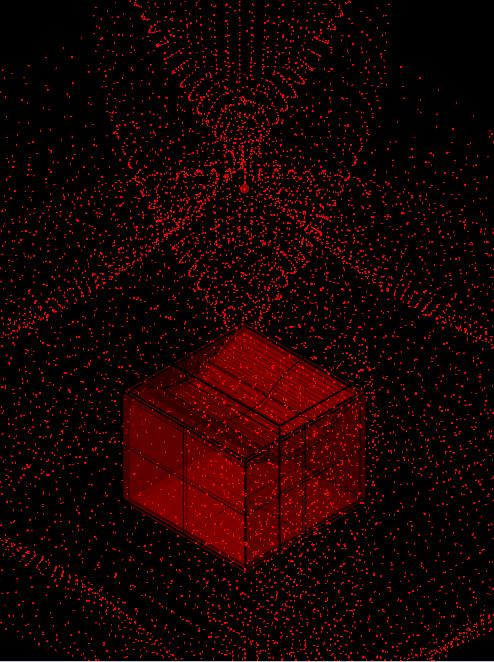


SIMULATING RAIN FREQUENCIES THROUGH SUBMERGED LANDSCAPE

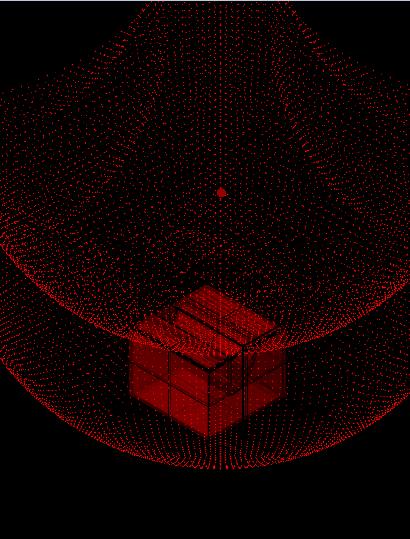
The pinched space shows the sound reflecting more clearly through water, which is more helpful in understanding why there is a ‘quiet’ strip where the pinched form is. Earlier in the report speculated that most of the waveforms had been absorbed, but actually a lot of them are reflected by the curved shape.




CONCLUSION
SUBMERGING SOUNDSCAPES
The dissertation sought to understand and alter the polluted soundscapes of the ports of Rotterdam, both underwater and above water, using the Stormpolder flood forest as a pioneering test-site for other ports to learn from. The research conducted concludes that the frequency 432Hz is the optimal frequency for underwater animals to live and breed in, generating healthy underwater atmoshpheres, and frequencies from 110Hz to 315Hz have healing properties in humans. These frequencies are both made through speakers, and through form and material manipulation in the project.
The simulation that provided the most accurate results for sound’s propogation through water was the Pachyderm-Acoustic plug-in for Rhino. Both numerically and visually, it matched previous research done on underwater acoustics, and therefore provided a platform to carry out site-specific tests in the dissertation.
As visualised through these simulations, once the building is fully submerged in 2050, the frequencies produced by the building will travel further as the visuals portrayed more places of interference and a longer propogation time per frame of the simulation and the numerical values which represented clarity of frequency allowed for an understanding that all frequencies travel through water more clearly than air.
This gives the impression to both the human and underwater mammal’s ear that the proposed building is ‘louder’ underwater. Meaning it’s healing and generative properties will be more affective underwater.
BIBLIOGRAPY
Fahy, F. and P. Gardonio (). Sound and Structural Vibration.
How Well Does Sound Travel Through Different Mediums? (n.d.). Available at: https://www. uspto.gov/kids/MiddleSchool-HowWellSoundTravels.pdf.
United Visual Artists. (n.d.). United Visual Artists. [online] Available at: https://www.uva.co.uk. www.youtube.com. (n.d.).
These Bricks Can Absorb Traffic Noise - Thesis Presentation on Helmholtz Resonators. [online] Available at: https://www.youtube.com/watch?v=y9-p4AkgVU8 [Accessed 8 Mar. 2024].
https://www.sheetpilinguk.com/wp-content/uploads/2018/11/3_Pilingwithvibration_EN.pdf
https://scholarsmine.mst.edu/cgi/viewcontent.cgi?article=2864&context=icrageesd
https://www.sciencedirect.com/science/article/pii/S0038080615001031
https://www.geoengineer.org/education/soil-mechanics/soil-as-a-three-phase-system
https://www.diva-portal.org/smash/get/diva2:610771/FULLTEXT02.pdf
https://fgg-web.fgg.uni-lj.si/~/pmoze/esdep/master/wg15a/l0600.htm
https://www.geodrillinginternational.com/piling/news/1361893/new-method-for-driving-pilesfree-of-ground-borne-vibrations
ArchDaily. “Wetland Research and Education Center / Atelier Z+,” December 16, 2021. https://www.archdaily.com/973638/wetland-research-and-education-center-atelier-z-plus. Blåsten, Emilia.
“Trans Voice Visualized: How to Read Spectrograms.” Scinguistics, December 4, 2020. https://cramdvoicelessons.blog/spectrograms/.Coan, Sharon.
How Sound Moves. Huntington Beach, Ca: Teacher Created Materials, 2015.convert.ingnow.com.
“Audio Spectrogram Creator - Make Your Own Spectrogram,” n.d. https://convert.ing-now. com/audio-spectrogram-creator/.Kerman, B.R. Natural Physical Sources of Underwater Sound. Springer Science & Business Media, 2012.NASA.
“The Electromagnetic Spectrum.” STScI. Q Starter Kit, 2019. https://hubblesite.org/contents/articles/the-electromagnetic-spectrum.Noaa.gov.
“Understanding Ocean Acoustics,” 2015. https://oceanexplorer.noaa.gov/explorations/ sound01/background/acoustics/acoustics.html.R-Packages.
“Conclusions.” Accessed April 29, 2024. https://cran.r-project.org/web/packages/PAMscapes/readme/README.html.United Visual Artists.
“Polyphony / United Visual Artists,” December 16, 2023. https://www.uva.co.uk/features/ polyphony.Urick, Robert J.
Principles of Underwater Sound for Engineers. McGraw-Hill Companies, 1967.———. Sound Propagation in the Sea, 1979.
IMAGE CITATIONS
F01 Wetland Research and Education Centre https://www.archdaily.com/973638/wetland-re search-and-education-center-atelier-z-plus
F02 Polyphony - UVA https://www.uva.co.uk/features/polyphony
F03 Sound propogation diagram https://pressbooks.pub/sound/chapter/how-soundmoves/
F04 Electromagnetic spectrum diagram https://hubblesite.org/contents/articles/the-electromag netic-spectrum
F05 Author’s own diagram
F06 Marine soundscape diagram re-drawn from R-Packages. “Conclusions.” Accessed April 29, 2024. https://cran.r-project.org/web/packages/PAM scapes/readme/README.html.
F07 Spectogram from AudioSpectogramCreator https://convert.ing-now.com/audio-spectro gram-creator/
F08 Spectogram for analysis https://cramdvoicelessons.blog/spectrograms/
F09 Online Decibel mapping software https://noisetools.net/dbmap/
F10 Diagram showing the moon and suns affect on the tide https://www.timeanddate.com/astronomy/ moon/tides.html
F11 Sun and moon paths on-site https://www.suncalc.org/#/51.9049,4.5831,17/2024.04 .29/22:00/1/3
F12 Soil composition diagram https://edepot.wur.nl/466708
F13 Soil composition diagram [02] https://edepot.wur.nl/466708
F14 Lunenburg Lens diagram https://www.nature.com/articles/s41598-018-34581-7
F15 Author’s Blender interface screenshot
F16 Author’s Blender interface screenshot
F17 Helmholtz Resonator example https://www.britannica.com/science/Helmholtz-res s%20an,the%20geometry%20of%20its%20opening.
F18 Helmholtz Resonator example https://www.britannica.com/science/Helmholtz-res s%20an,the%20geometry%20of%20its%20opening.
F19 Absorption Diagram
F20 Anne Holltrop “Wetland Research and Education Center / Atelier Z+,” December 16, 2021. https://www.archdaily com/973638/wetland-research-and-educa tion-center-atelier-z-plus.Blåsten, Emilia.
F21 Enric Moralles https://www.nature.com/articles/s41598-018-34581-7
