
The Truth
“Change your mind, change your money” - Coach Stormy Wellington. I pray the things that you learn from this Ebook will aid you in having financial freedom, time freedom, support your family and allow you to have a more abundant life. Now, “LET'S GET THIS MONEY!”. Acquiring wealth has traditionally been broken down into four categories which are stocks, real estate, business and commodities. In this Ebook I will address what is the foreign exchange market, how to open a trading account, forex indicators and The King James Strategy.
What is the Foreign Exchange Market?
The Foreign Exchange Market is the largest financial market in the world. It is also referred to as “Forex” which is a 6.3 trillion dollar industry that is open 24 hours a day, 5 days a week. The objective of a forex trader is simply to exchange one currency for another and profit from the difference, which is referred to as the exchange rate. Below are 3 examples to help increase your understanding.
Example 1
You have a red cup worth $5. I have a green cup worth $10. We exchange cups and you have made a $5 profit from the exchange.
Example 2
You have 5 U.S. dollars.
You go to Canada and exchange your 5 U.S. dollars into Canadian currency. While doing so, the U.S. currency is more valuable than the Canadian currency, so for every U.S. dollar you exchange it is equivalent to $2 in Canada. As a result, you get 10 Canadian dollars which has allowed you to have made a profit of 5 Canadian dollars.
Example 3
The U.S. Dollar is valued at $1.00 which is equivalent to $1.38 in Canada. You exchange your U.S. Dollar for a Canadian Dollar and you have made a profit of $0.38.
Got it? Perfect.
Hang in there, it gets better! The Foreign Exchange Market is known as an industry that allows you to multiply your money. Sounds good so far?! Forex trading has become so appealing because with internet access the exchange of
currencies can be done almost anywhere in the world from a cell phone, laptop or computer allowing all participants the opportunity to profit. More importantly, forex trading is a recession proof skill, so upon mastering the strategy shown within this Ebook you can feel confident knowing that you are now in control of your financial future. Now, let's get you started!
In order to get the most out of your forex trading experience it is vital that you learn the rules of the game! You would not be very good at basketball if you traveled on every possession. Also you would not be very good at football if you jumped offsides every down. Thus, here are two of the most helpful resources to gain an understanding of the rules of forex trading. Simply download the Forex Hero App also referred to as Forex Trading School & Game - Apps on Google Play or App Store and read THE CANDLESTICK TRADING BIBLE(1).pdf | DocDroid. After reading the items above you will now become more knowledgeable to effectively apply the steps below.
Learning Curve
“Just show me how to become a multi-millionaire already”. “ I get it”, but you must learn how to enter and exit a trade. As well as, how to cut your losses and money management before getting the mansion, Ferrari and butler. Losing a trade is inevitable, however with proper preparation you can control risk and maximize profits. Thus, I will explain ways to minimize losing money while gaining an understanding.
The goal is to start with a small amount of money, improve your skill level and allow your trading account to grow. Now regardless of a trader's skill level, all trades placed begin with a negative balance which is known as drawdown. “An extremely important cause of trades going into heavy drawdown immediately after being placed is due to entering at the wrong time” - Swaggy C. To that point, here are 13 more reasons beginner traders lose money from their trading accounts.
1. No Stop loss
2. Overleveraging Account
3. Greed
4. No Daily Profit Goal
5. No Strategy
6. Wrong Lot Size
7. Not Marking Up Their Chart
8. Not Taking Any Profit
9. Did Not Have 3 Confirmations
10.Distracted (at work, too sleepy, family and errands etc.)
11.Trading against the trend
12.Impatience (closing a trade prematurely)
13.Trading device not fully powered (Phone, laptop, computer or tablet powers off unexpectedly)
Open a Demo Account
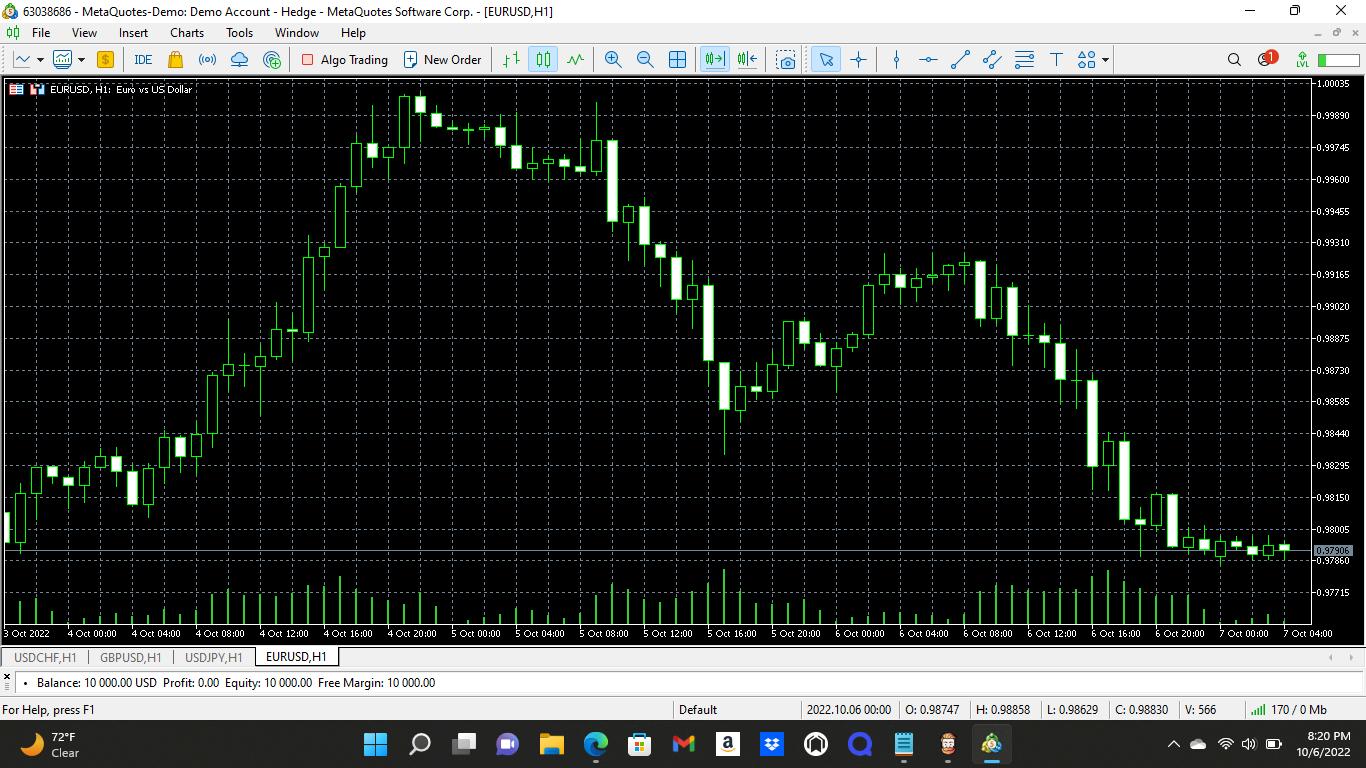
“Execute what you practiced” - Kobe Bryant. Thankfully, to help improve your forex trading skill level and shorten the learning curve, a demo account also known as a practice account is a great learning tool. A demo account is identical to a real account, but you do not trade with any real money. In fact, the demo account comes preloaded with a risk-free $100,000.
In turn, this will give you the time needed to build confidence and make any needed adjustments to improve your trading plan. Typically, 3-4 months is the ideal amount of time to practice before transitioning into a real account. However, no matter where you are in your trading process, practice The King James Strategy in your demo account for at least 30 days before using real money. With time, you will be able to successfully transition into opening a live trading account. Having said that, to open a demo account from your laptop or computer visit https://metatrader4.com. Select MT4 and then select “Download for free”.
Afterwards, a demo account will be downloaded onto a laptop or computer. For additional assistance visit (6) How do I setup MT4? (Forex) - YouTube.
Open a Live Trading Account
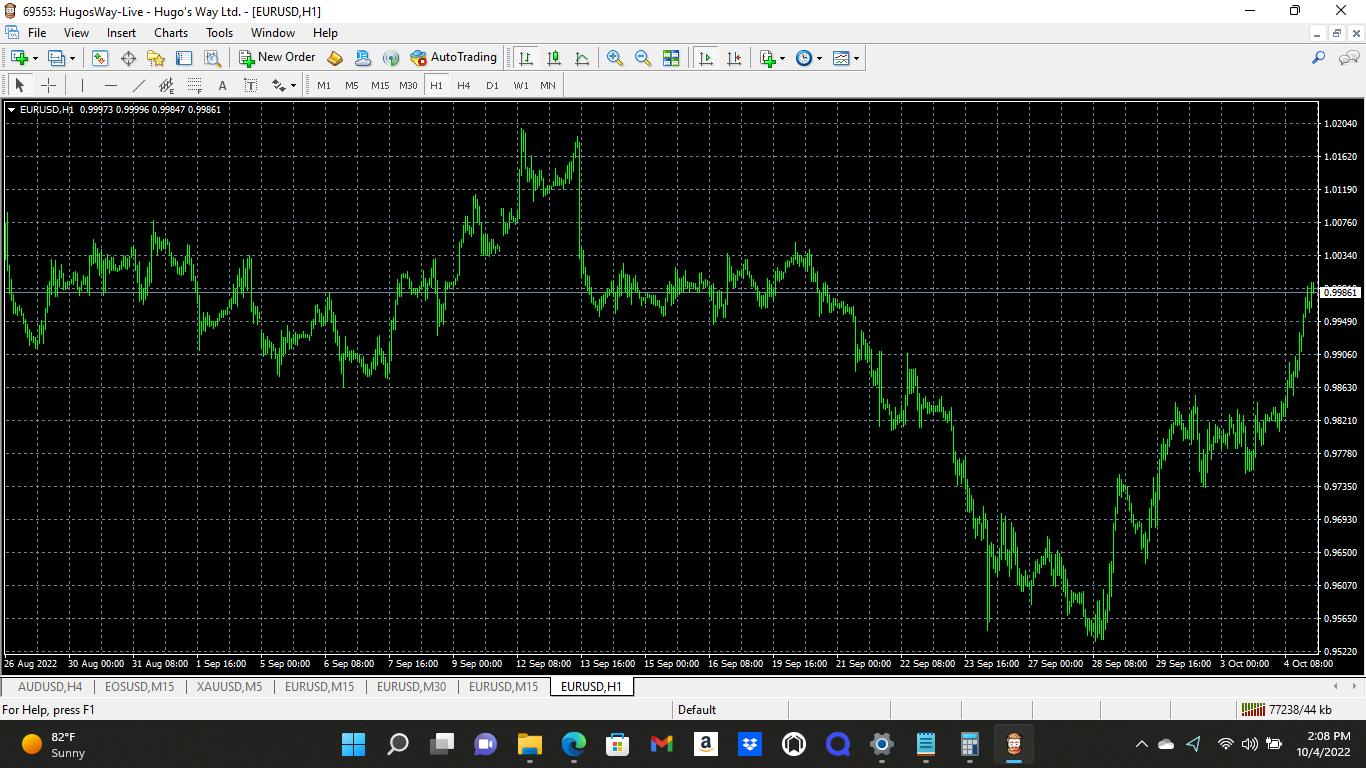
Before opening a live trading account you must choose a forex broker. Forex brokers require all traders to create an account to begin their trading process. Just as a bank holds your money for you to buy things, a forex broker is an entity that allows you to deposit money to fund your trading account. Now, some forex brokers offer more currency pairs than others. Even so, below are four common forex trading platforms with an example of the steps needed to successfully create a trading account.
Simply choose one of the four forex broker websites.
● Hugosway.com
● LQDFX.com
● Hankotrade.com
● Plexytrade.com
LQDFX STEPS
● Select (Individual)
● Enter Personal Information (Name, DOB etc.)
● Financial Information (Networth & Total Income))
● Employment Information (Employed or Self)
● Trading Experience (0 or more)
● Choose Currency Type (USD)
● Choose Trading Platform (MT4)
● Account Type (Micro)
● Check (I declare that I am over 18 (eighteen) years old to open this account)
● Complete
1. Log into your LQDFX Client Portal
2. Upload your documents
3. Fund your account
4. Start to trade!
Upon being approved, an internal transfer will be necessary. An internal transfer consists of transferring money from your trading account wallet to a live account. As soon as this is complete, you will be able to view the updated balance on your laptop, phone or computer. This step is mandatory for all traders. To ensure these steps are followed properly, forex brokers provide a Live Chat for questions and concerns.
Account Size
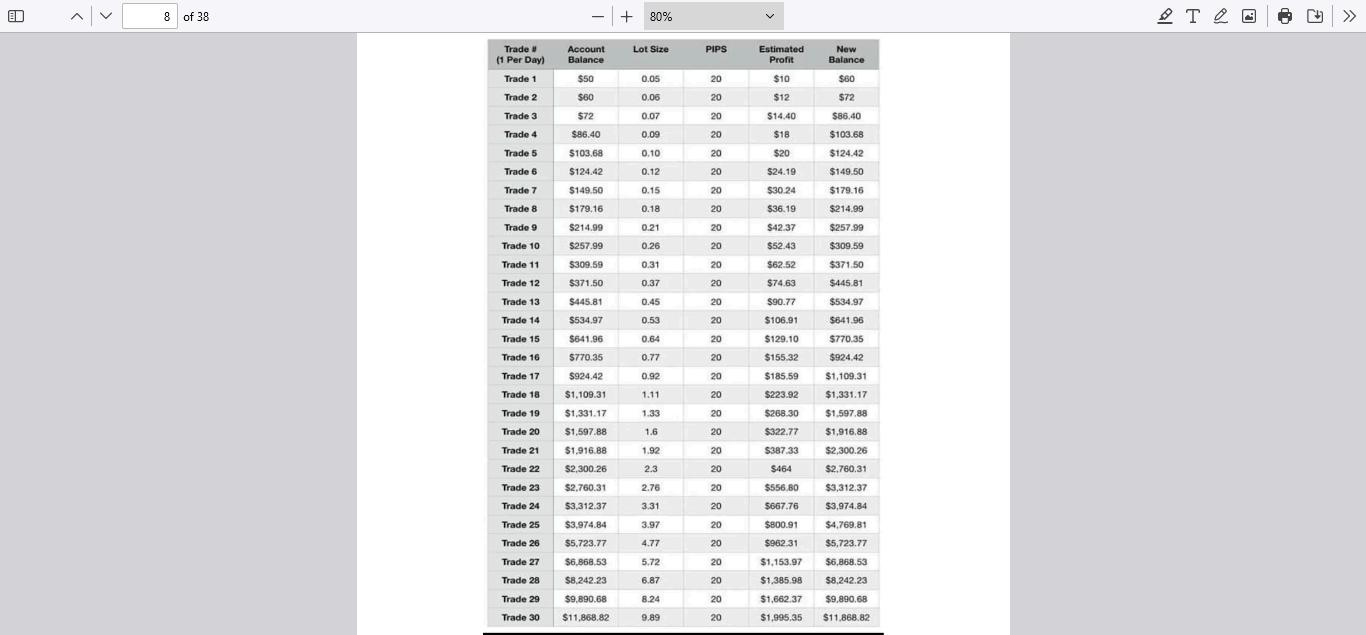
For the best results, be sure to fund your live trading account with $100-$300. Forex trading is about longevity. In order to have longevity in trading you must give your trades time to develop and protect your money. This is referred to as risk management which consists of knowing the correct lot size and risk for your trading account. Below is a formula of how to determine a lot size and trading account balance (See Figure 4). On top of that, visit PIP Calculator | FXTM (forextime.com) for additional assistance.
4

★ Formula Lot size x Pips Gained = Profit
Lot size x Stop Loss Pips= Total Loss Amount
"Compound interest will make you wealthy, the key is to start. Those who understand this, earn it! Those that don't, pay it" - Albert Einstein. When placing a trade you can use a standard, mini, micro or nano lot size. Based on the image above, a standard lot size of 0.1 is equivalent to $1 or 1 pip. By using a 0.1 lot size and gaining 100 pips you profit $100. Contrarily, a stop loss is a voluntary calculated risk set on a trade to help control the amount of money at risk. The point in percentage also known as a pip is a measure of movement in the exchange rate between two currencies. Just as you measure your height in inches and your weight in pounds, in forex risk and profit are measured by pips. That being so, Figure 5 below displays a profit-making gameplan which consists of securing only 20 pips per trade to compound a trading account.
Different Order Types For Traders
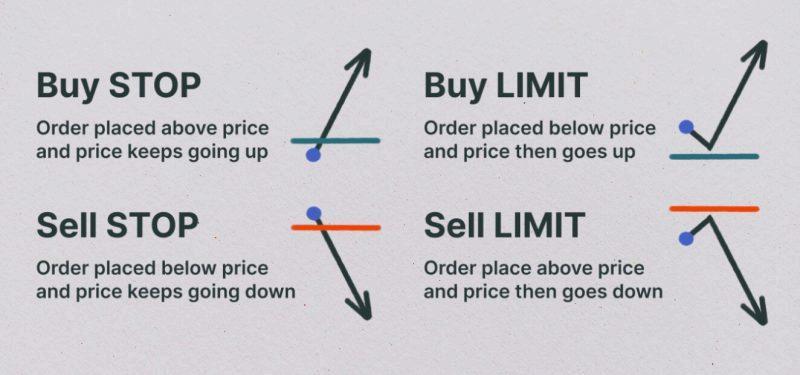
● Market Execution
● Buy Stop
● Sell Stop
● Buy Limit
● Sell Limit
Market execution is the method for trade entry, where the trade is executed immediately at the current market price. If the price changes at the moment of order execution, the trade will be made at an updated price. Use a Limit Order if you want to BUY at the level below current price. Use the Limit Order if you want to SELL you at the level above current price. Use Stop Order if you want to BUY
at the level above the current price. Use Stop Order if you want to SELL it to level below the price. Traders typically set limit orders and stop orders at a point that signals a significant reaction in the market or reflects a specific strategy. Deciding where to place stop orders or limit orders requires careful analysis to avoid unnecessary activation of the order or missing the intended trade action. It’s like setting an alarm clock, you want it to wake you up at the right time, not too early to lose sleep or too late to miss your meeting.
It is of crucial importance to know your initial investment and what date you expect to reach a specific account balance. As a solution, traders can visit compoundaily.org which provides access to a compound interest calculator. A compound interest calculator offers a fun and easy way to calculate the growth of your money over time without any tedious busy work. Most people enjoy watching live scenarios where their money can increase and a compound interest calculator is the perfect tool to complete the task.
Types of Forex Traders
By funding your trading account you are moments away from placing your first trade, but before doing so let's determine your trading style. There are 4 types of forex traders. A day trader is an individual who enters a trade and does not hold the position overnight. A scalper looks to make a lot of money with small moves. Scalpers usually will enter a trade for 5-15 minutes before exiting. Swing traders hold trades for several days and even weeks. Lastly, position traders will place a trade and hold it for months or even a year.
Trading Session
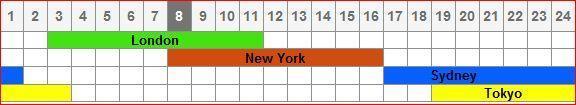

Figure 6, which is above displays 4 trading sessions using military time. Figure 7, displays military time which is a way to tell time using 24 hours. The day starts at 0 hours and ends at 2400 hours. This displays the time period in which the most buying and selling occurs within the forex market. During this time the forex market will only move 3 ways; UP, Down and Sideways.
Moreover, Figure 8 below shows a list of currency pairs along with the preferred trading session. Choosing a trading session and only trading forex pairs in its group is referred to as time confluence. This simply means the forex pair and trading session align with each other. Therefore, forex traders are more likely to capture the move of the day.
8
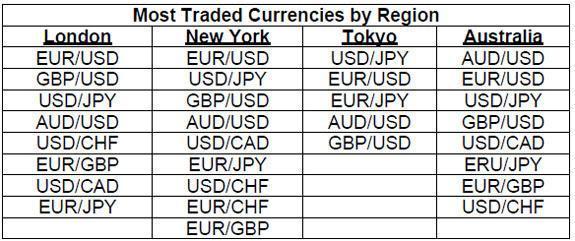

Trading 2-3 currency pairs consistently allows forex traders to notice characteristics such as how quick or sluggish each pair moves. By trading gold (XAUUSD) one will notice that it is volatile. By trading AUDUSD one will notice that it moves much slower than gold. However, by trading cryptocurrency pairs, one would recognize the market hours differ from forex currency pairs.
Trading Cryptocurrency Pairs
Cryptocurrency pairs move like gold, but require a different plan of action. Unlike forex pairs, cryptocurrency pairs like Ethereum (ETHUSD) and Bitcoin (BTCUSD) are available to trade 24 hours per day, 7 days a week. Currently, Bitcoin’s price history ranges from $0.05 to $68,990. Since Bitcoin and other cryptocurrency pairs price are spread so widely, trading cryptocurrencies pair’s can be very profitable. However, with a spread this wide comes an increase of directional changes. Cryptocurrency pairs move like a jump rope being swung wildly in one hand. The best thing to do is keep your distance. To help avoid a stop loss being reached, avoid stacking trades or adding multiple positions. Instead, use a $1 lot size per $500 within a trading account. Allow patience and conservativeness to lead you to profitability. The goal is to win the game, not just be a player.
Trap Days
"Wisdom helps you see danger when it is far away" - Proverbs 27:12 . The amount of money to be made from the forex market is limitless. Yet and still, Mondays and Fridays are not the best days to trade for forex traders. At the start of the week the forex market is chaotic due to major world events and tapers off during the week. Thus, Tuesday through Thursday are the best days to trade.
Fridays are not the best day of the week to trade because the forex market closes at 5pm and sometimes sooner during national holidays. Banks and other large corporations have major influence to move the forex market. Unfortunately, since most banks close on Fridays this causes currency pairs to move slowly. That means, if you open a trade on Friday and do not close it before 5pm, your trade will resume on Monday. Now, when the market resumes on Monday you may be in profit or in unbelievable drawdown. Just trust me on this! As a result, Mondays and Fridays are considered trap days for forex traders.
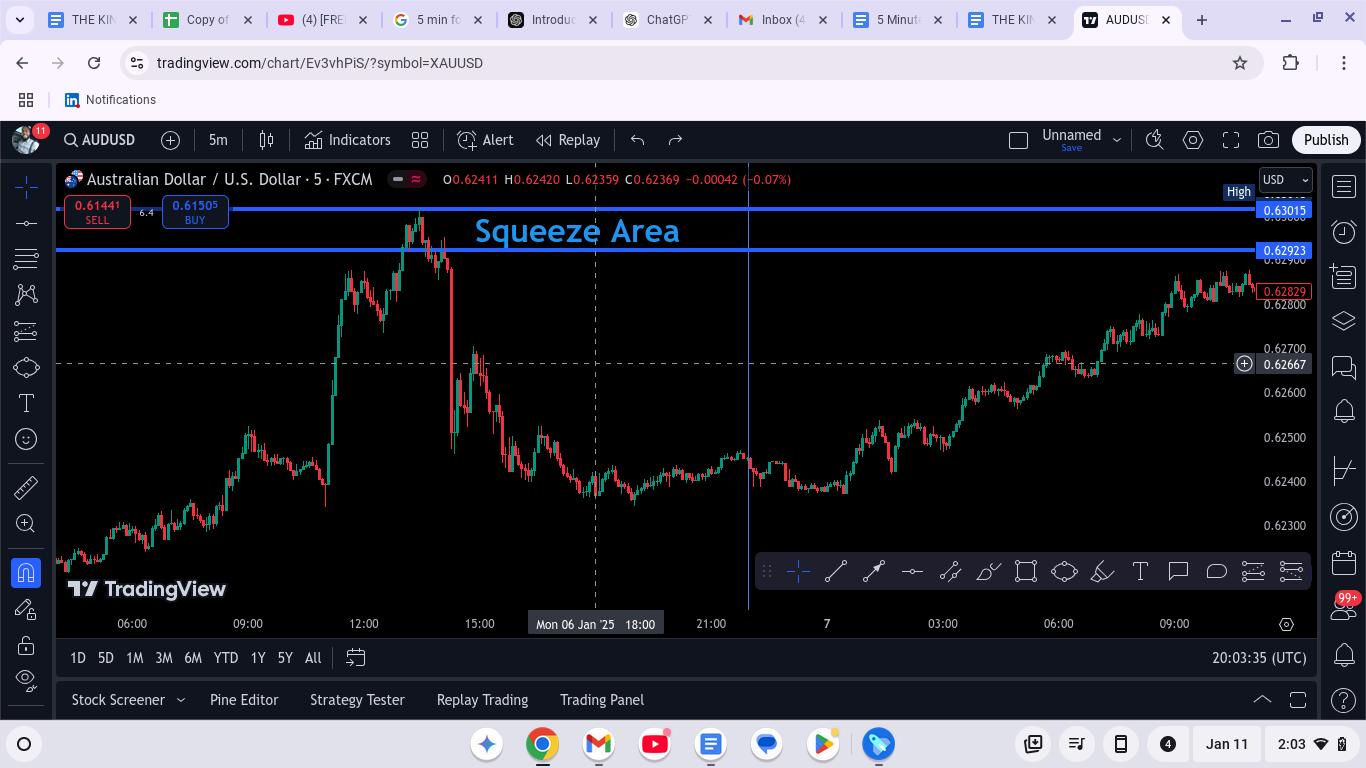
Support and Resistance
Price moves between support and resistance. Support is a level in the forex market that has historically supported a price level. Resistance is a level that has historically rejected a price level. During this period, price bounces from support to resistance like a ball in the house. Since price moves in three directions the 3'R's aid traders in strategically entering the market.
The 3'Rs
● Rejection
● Retest
● Reaction
As price reaches a key level, wait until it touches the key level again. Following that, you can react by entering the trade. The market respects certain selling and buying zones. By looking left prior to the entry you will be able to see what occurred the last time the price was in that area. This is important to identify the previous high and low of the day. This can result in an aggressive entry point.
Candlestick Patterns
There are certain things that offer a message without saying a word. Life gives several messages, but remains silent. Your body gives several messages, but remains silent. Similarly, candlestick patterns do the same. Candlestick patterns are color coded bars on a forex chart used to describe the price movements of a currency pair. Each candlestick is a representation of buying and selling taking place in the market. Candlesticks tell a story and as your knowledge increases your profitability should follow.
Nine Profitable Candlestick Patterns
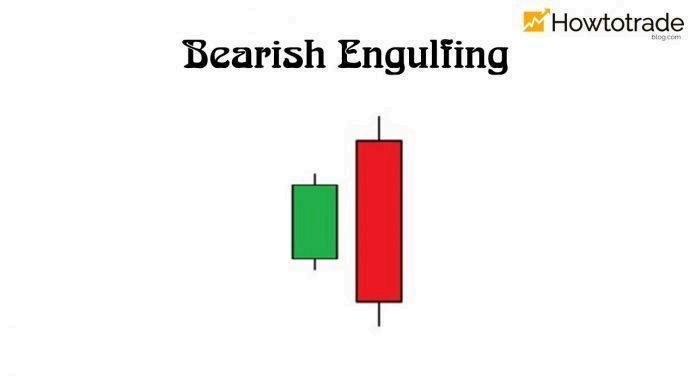
The bearish engulfing candlestick pattern is a warning signal that the market will strongly reverse from trending upward to downward. This pattern consists of 2 candles. The first candle will be a green bullish candle and the second candle will be a strong red bearish candle covering the previous one. This often occurs at the end of an uptrend.
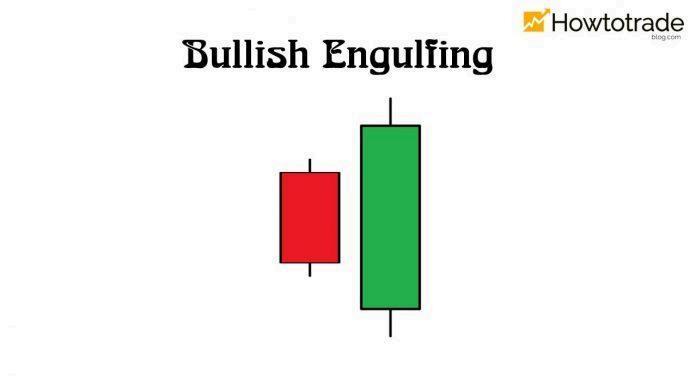
A bullish engulfing candlestick signal that the market will strongly reverse from trending This pattern consists of 2 candles. The first one is a red second one is a strong green bullish candle that covers the bullish engulfing pattern occurs at the end of a downtrend.
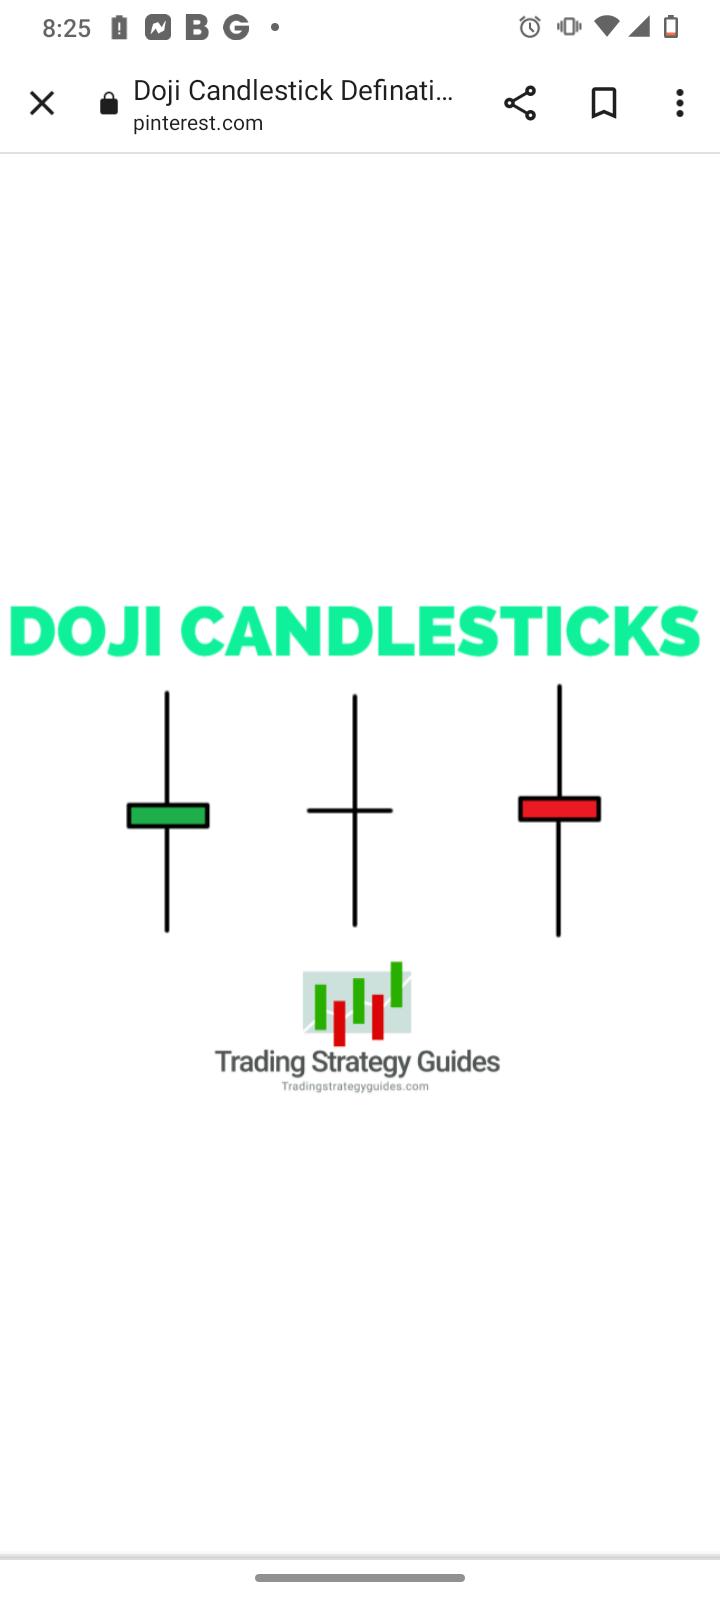
A doji signifies equality It can appear as one of the three options above. A doji or top of a trend. A doji is considered as a sign of a possible
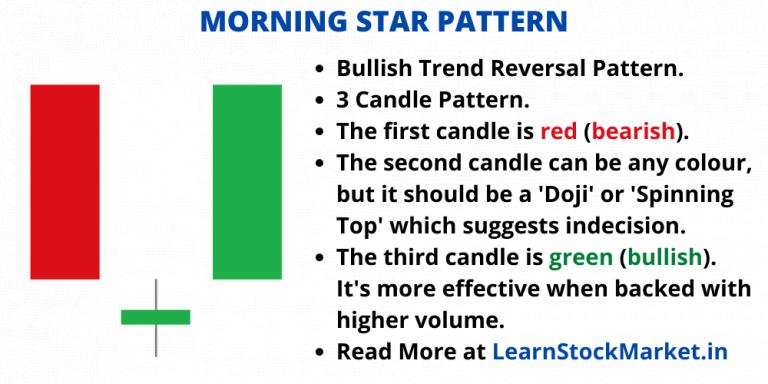
A morning star pattern is pattern. It is a three-stick pattern. The first candle is a red second candle may be any color, but it should be a doji. The bullish candle.
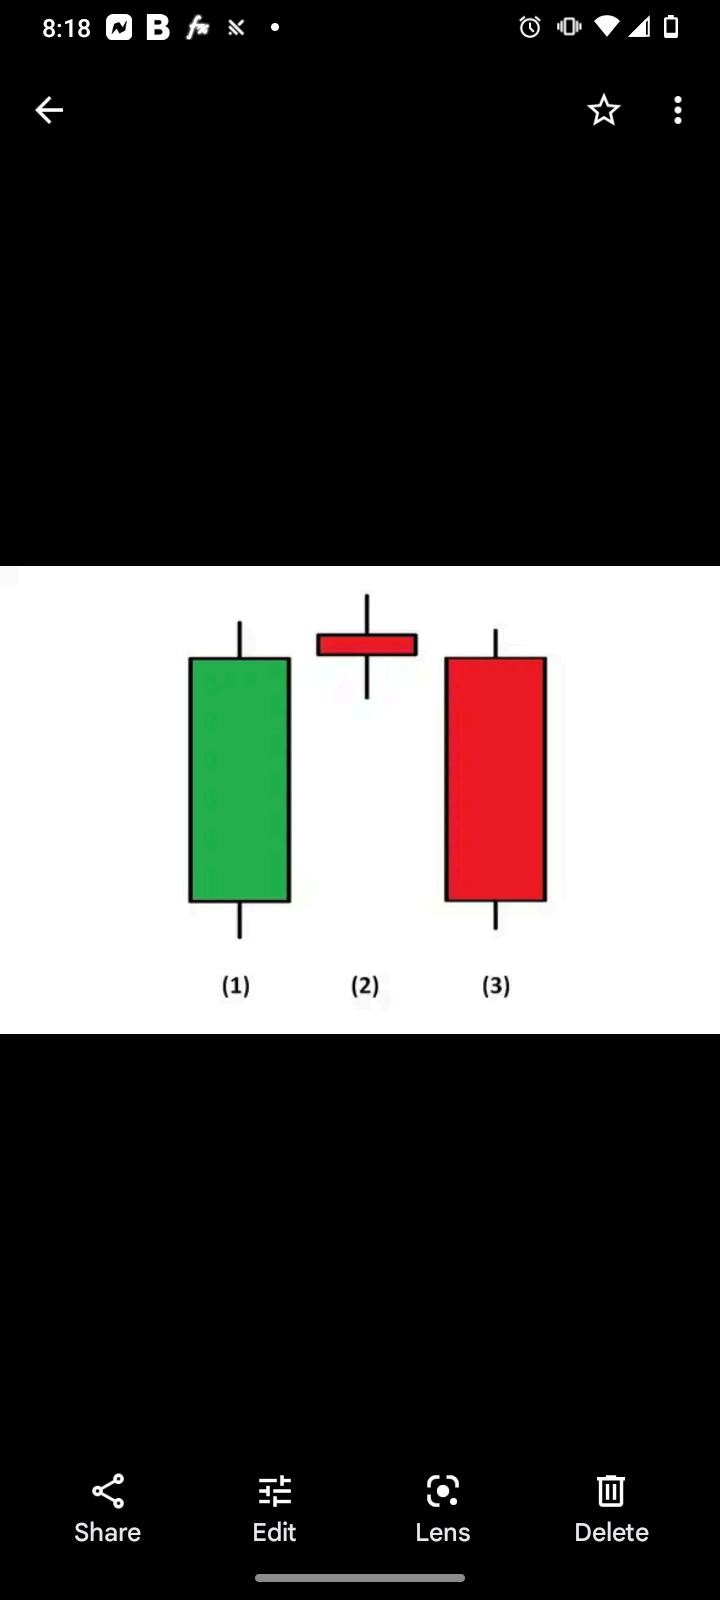
An evening star pattern is pattern. It is a threestick pattern. The first candle is candle. The second candle is a doji, but can be any color. The red bearish candle that will move past the green bullish candlestick.
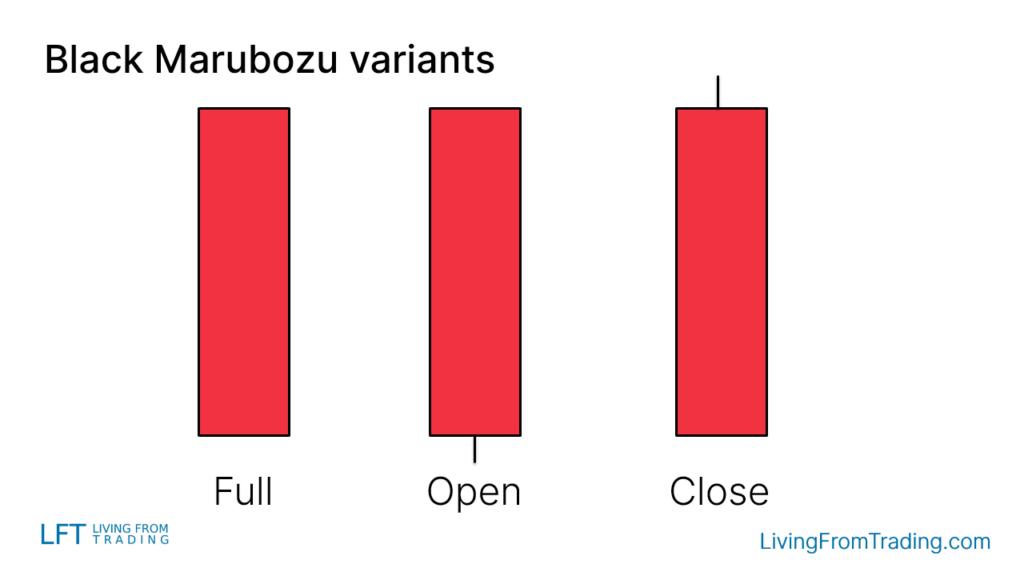
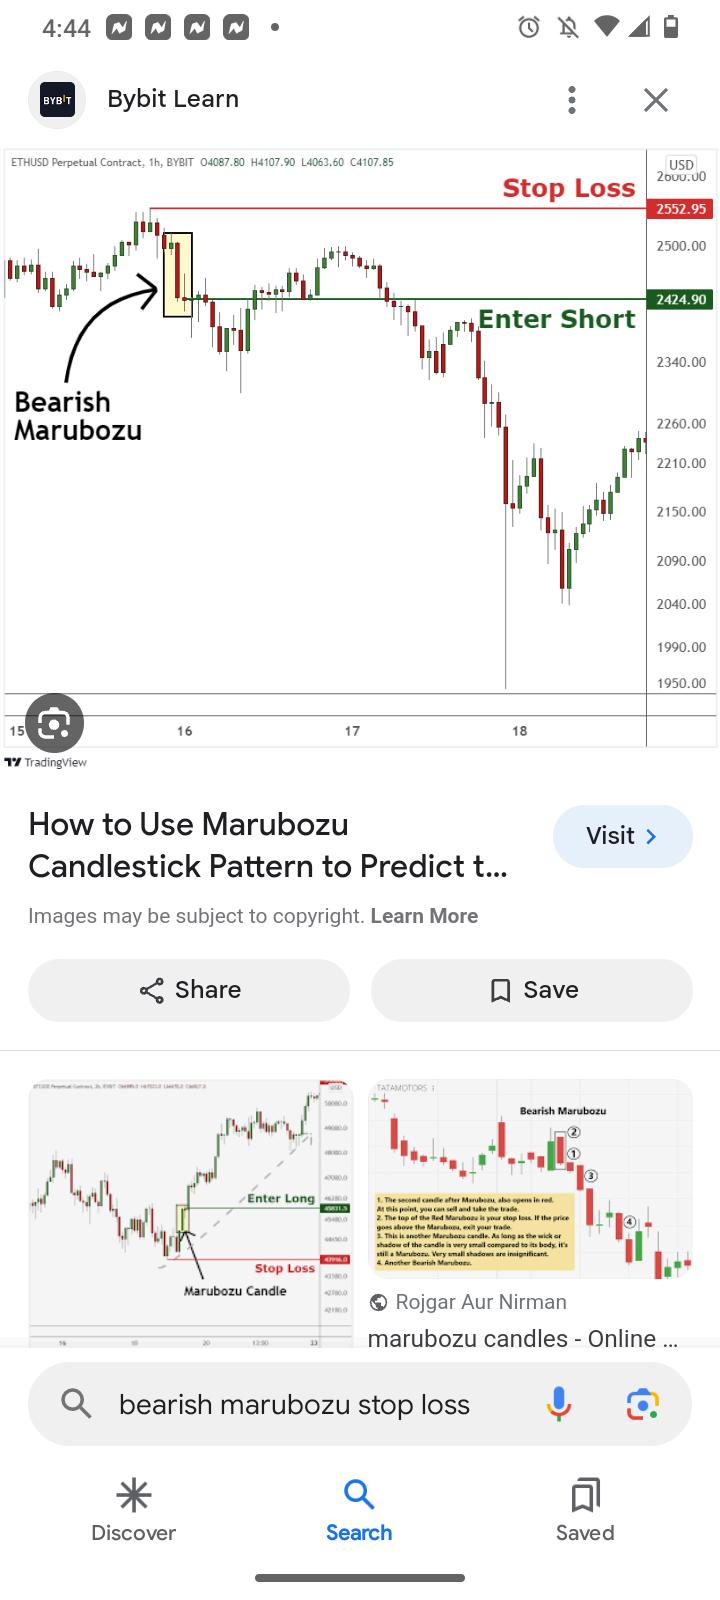
Marubozu is trading, a Marubozu candlestick has a long body and comes in are extremely powerful price movement. The Marubozu a small wick at the top of small wick at the bottom of the indicates that sellers control the candlestick is a continuation pattern, continue moving lower. This said, Marubozu candlesticks rate of 65 -70% when combined
imagine is reversal shadow downtrend inverted rate
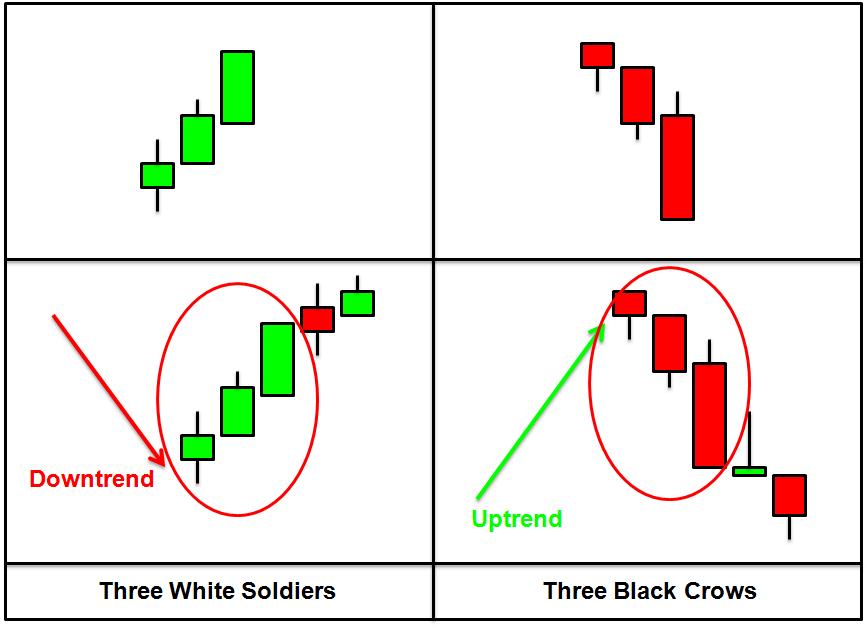
The Three White Soldiers is a reversal candlestick pattern that shifts the market from bearish to bullish. It appears at the end of a downtrend. This pattern includes three green candles in a row, showing that price is going up because more people are buying and the sellers are exhausted.
But before deciding to trade based on this pattern, it’s important to check three things:
1. Market Trend: This pattern only matters if it happens after a long period of falling prices. It should appear at the end of a downtrend or near an important price level.
2. Candle Size: The candles should be big. If they are too small, it might not be a real trend change. Look for long green candles.
3. Trading Volume: More people should be buying when this pattern forms. If the number of trades doesn’t go up, the price increase might not last.
This pattern tells us that people are feeling more positive about a specific forex pair. The candles should not have long wicks, meaning buyers are in control. The pattern should last for three trading days in a row. Meanwhile, the three black crows pattern is formed when the three bearish candles follow a strong uptrend, indicating that a reversal is in the works.
Figure 9
M & W Chart Pattern
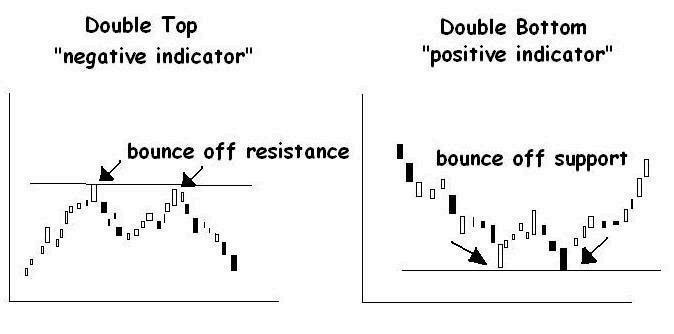
“If you're not willing to learn no one can help you, but if you're determined to learn no one can stop you”- Zig Ziglar. To that point, Figure 9 above displays the Double Top and Double Bottom price pattern. The Double Top pattern makes the shape of an M. The Double Top is a negative indicator, which means once formed the price will begin to move downward. Contrarily, the W is a positive indicator which means once formed price will move upward. Always trade the second leg of the M during a downtrend. Additionally, trade the second leg of the W during an uptrend.
Pullbacks
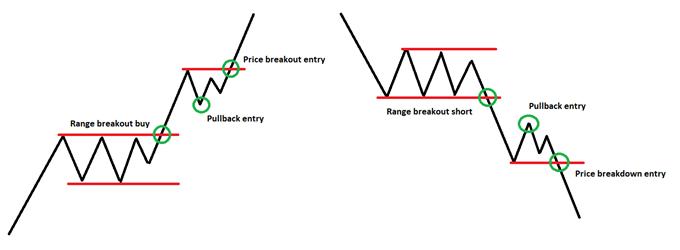
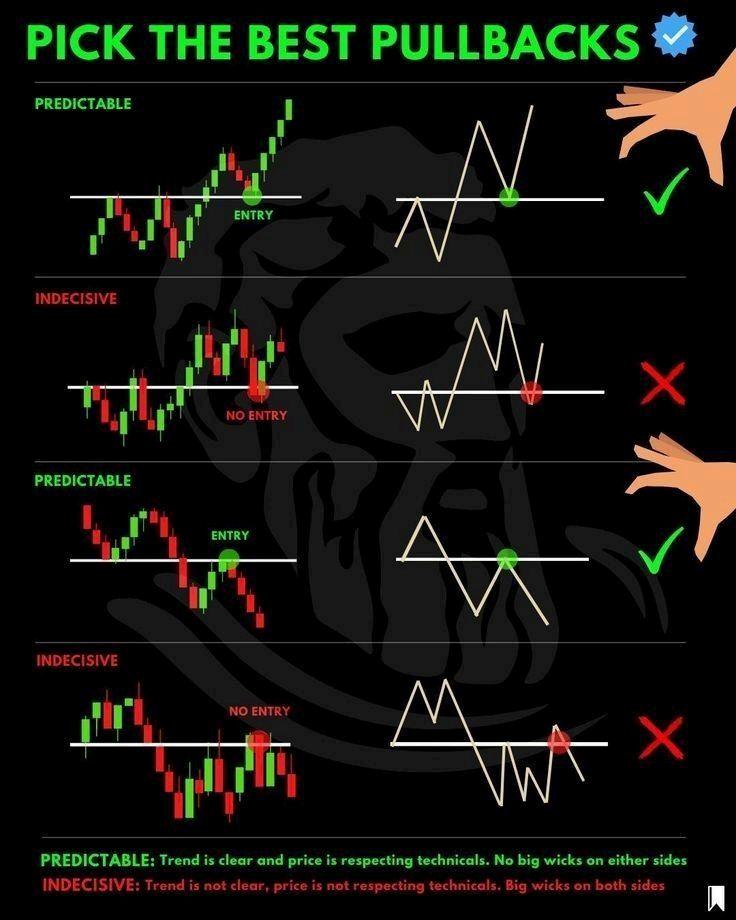
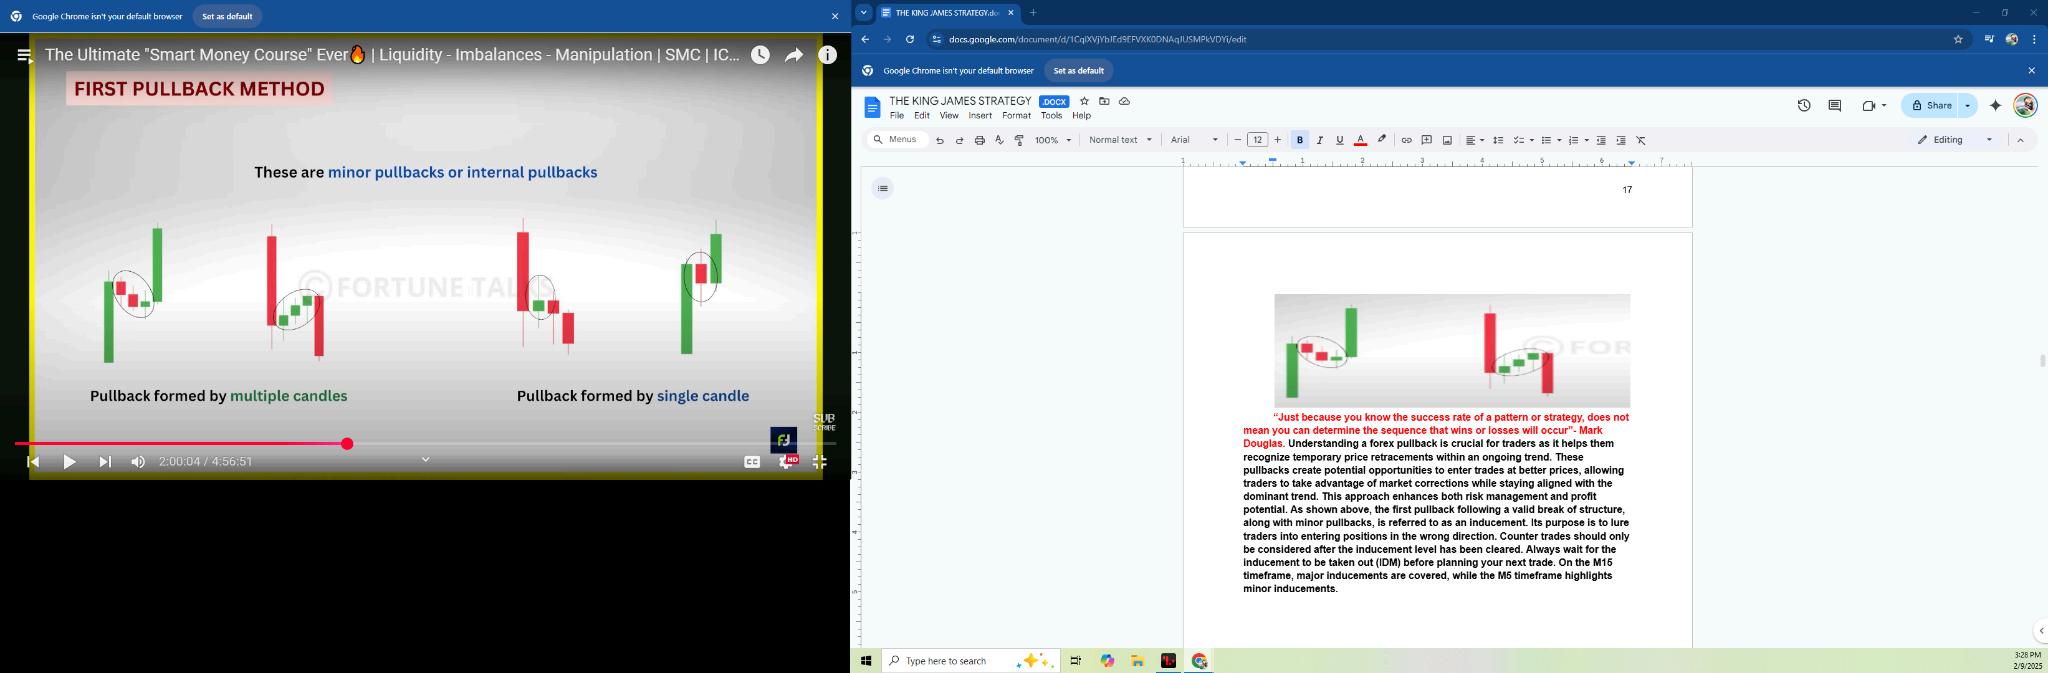
As shown above, there can be several variations of pullbacks. The first pullback following a valid break of structure is referred to as an inducement. Its purpose is to lure traders into entering positions in the wrong direction. Always wait for the inducement (IDM) to be taken out before planning your next trade. On the M15 timeframe, major inducement levels are shown, while the M5 timeframe highlights minor inducements. There are three types of pullbacks usually referred to as small, medium and deep retracement. Small pullbacks do not return to its breakout level because it indicates a strong trend. A medium pullback will return to the break of structure level. During deep retracements the first pullback or inducement level after a break of structure will be the last line of defense before exiting a trade. As shown above, a pullback that rejects above a key level during an uptrend is considered clean. Contrarily, a pullback that rejects below a downtrend is considered clean. Pullbacks that do not respect this structure are considered noisy, indecisive and invalid.
Change Of Character
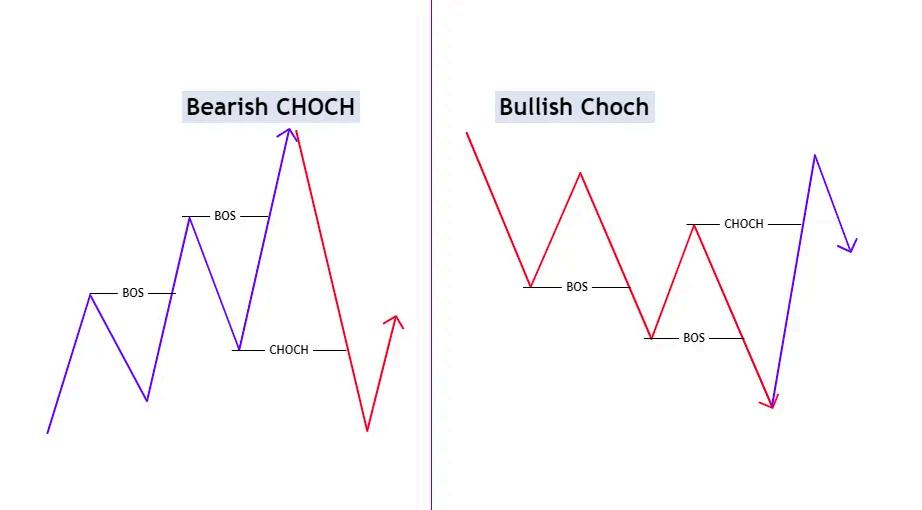
A Change of Character (CHOCH) occurs when dominant market momentum weakens, signaling a potential shift in trend and order flow over time as shown above. This pattern serves as an early indication of a possible transition in market control from buyers to sellers or vice versa. A bearish CHOCH happens when the price breaks and closes below the most recent support zone or Lower Low (LL), whereas a bullish CHOCH occurs when the price breaks and closes above the latest resistance zone creating Higher Low (HL).
Each time the price breaks a support zone, a corresponding resistance zone forms on the opposite side. Identifying high quality trade setups and valid CHOCHs requires adhering to key rules. The most important rule is to focus only on CHOCHs that occur within higher time frame buying and selling zones. For a CHOCH to be considered valid, the price must either reverse from or originate within a higher time frame buying or selling zone. Any CHOCHs that does not meet this criteria is invalid.
In a bullish CHOCH, when the market transitions from bearish to bullish, it is crucial to identify the first pullback or inducement and wait for the price to retrace for a high probability trade. Once the price grabs inducement, buying opportunities can be considered with confirmations such as a market structure shift or trend reversal on lower time frames.
Similarly, in a bearish CHOCH, when the market shifts from bullish to bearish, inducement should be marked, followed by waiting for a retracement to
take out the inducement. Once this occurs, selling opportunities can be sought with confirmations like a market structure shift or trend reversal in lower time frames.
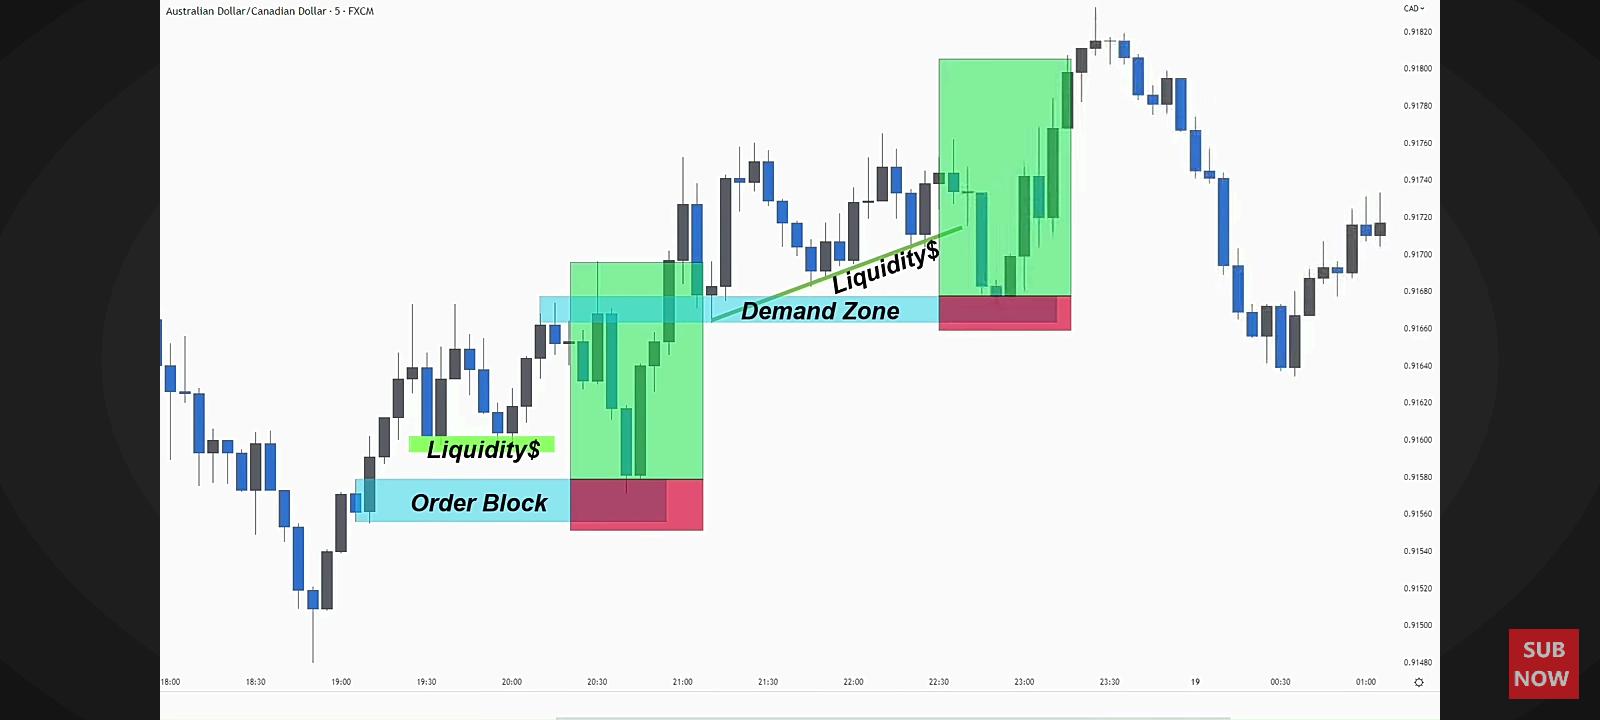
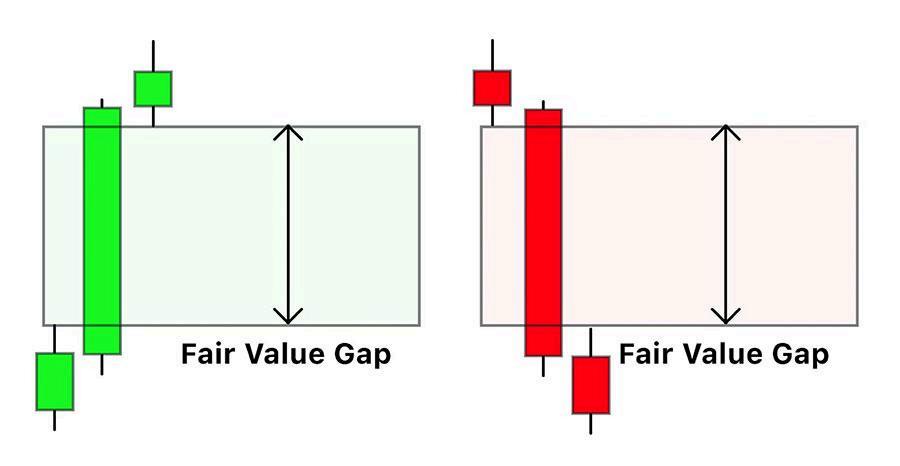
Order Block
In a bullish trend, the last bearish candle before a buy creates an order block. On the flipside, during a bearish trend, the last bullish candle before a sell creates an order block. Order blocks are specific price areas where big traders, like banks, place large buy or sell orders. Order blocks help big traders break up large orders to avoid sudden price changes in the market. To identify an order block look for an engulfing candlestick pattern and watch how the price moves around that range. A valid order block should be followed by a fair value gap to show a clear price imbalance. Order blocks form to allow big traders to buy or sell large amounts without drastically moving prices. Suggested method: Find a downtrend, spot a strong bullish candlestick, and watch price movements. The best identifiers for order blocks are support, resistance, and engulfing patterns. To sum up, order blocks reveal how big traders operate, but it takes practice to use them effectively. Order blocks should be marked on the M15 timeframe or higher.
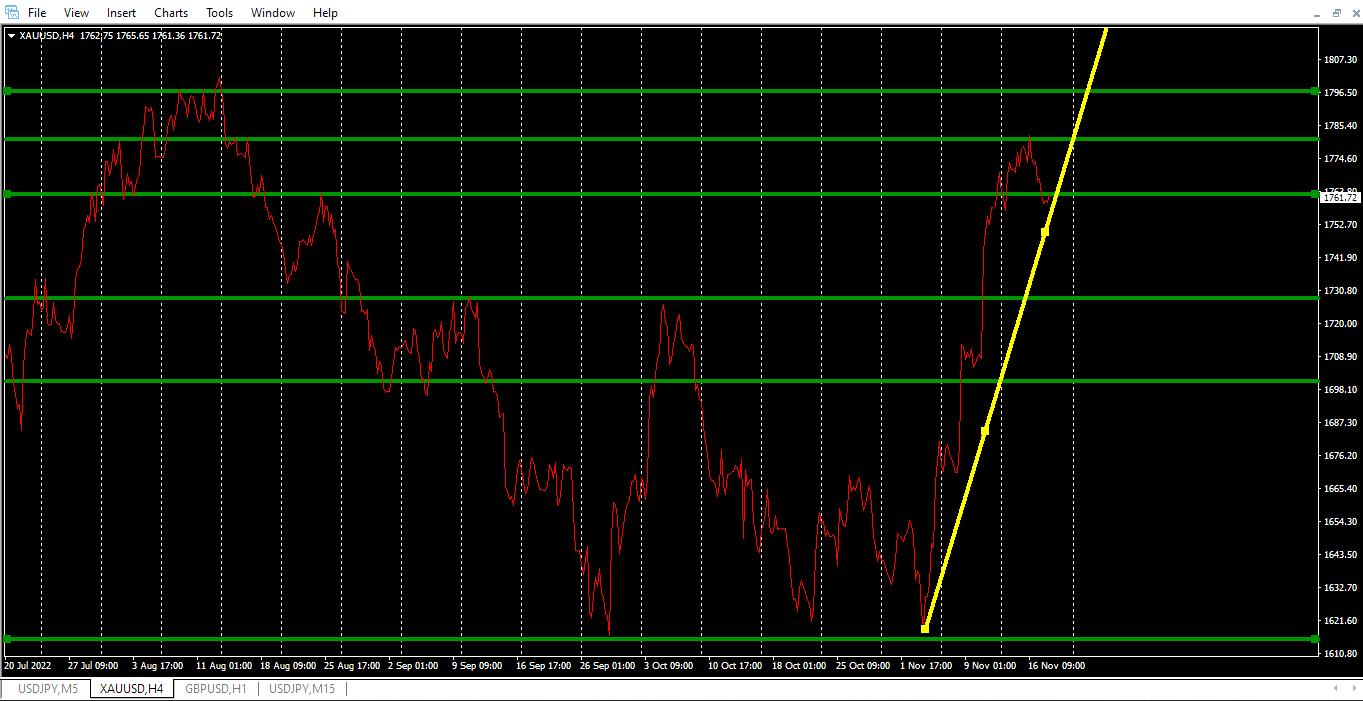
To prepare for the trading week, every Sunday evening traders need to go through their charts to markup key levels with a line graph to establish support
and resistance levels as shown in Figure 10 above. The daily chart is a great starting point before moving to the H4 timeframe. By trading in the direction of the overall trend 50% of your trading is done. Even so, backtesting which consists of reviewing how price moved at key levels in the past is essential as well.
As you backtest, use the crosshair which is a valuable tool used to determine the date, time and price of the currency pair on a chart. The crosshair can also be used to determine the number of pips between two points. To help prevent your stop loss from being reached or overleveraging use the crosshair to calculate the total amount of pips a currency pair typically moves outside of the Bollinger Bands, which will be explained later.
Keep in mind the trading session you trade. Take advantage of your non-trading hours by spending 2-4 hours per week for review, preparation and new discoveries. Although backtesting may show how price performed in the past, it does not guarantee price will move the same way in the future. Backtesting lets forex traders know that a trade has profit potential. With repetition and observation forex traders can become more confident to initiate trades without hesitation.
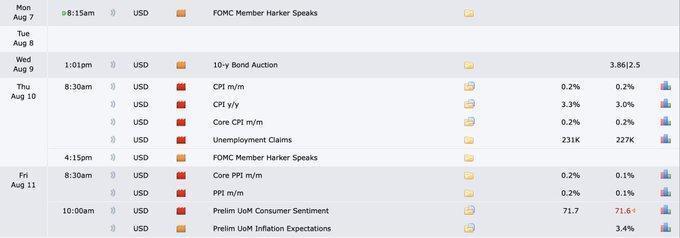
Apply the 2 by 2 rule which consists of identifying current price. Next, draw 2 horizontal lines of support and resistance above and below the current price on the H4 timeframe or higher. Despite that, traders must identify more edges to impact their trade idea. Forexfactory.com offers a market analysis to give insight on things that may cause a trend to reverse abruptly or continue despite forex confirmations such as; breaking news, gas prices, political speeches and much more. All high impact news can be found in red folders along with a specific time traders may be stopped out.
Extremely similar to Forexfactory.com, Myfxbook.com is an online platform offering tools and resources for forex traders to track, analyze, and share their trading performance. Used by both beginner and professional traders, Myfxbook allows users to monitor their trades, assess strategies, and gain valuable insights into market trends. Notably, Myfxbook features an economic calendar, helping traders stay informed about upcoming events that could influence the forex markets. This makes it a valuable tool for making well-informed trading decisions.
Break in Market Structure
As price moves up it is creating an uptrend in the market. Contrarily, as price moves down it is creating a downtrend. Sideways movement is referred to as ranging or consolidation. Sideways movement is the starting point for a new trend. Avoid trading in consolidation. Instead, draw your support and resistance lines on sideways movement on the H4 timeframe.
During consolidation a trendline should be drawn at support or resistance to anticipate an uptrend or downtrend. Waiting for a breakout in market structure can increase profitability. Be mindful that 2 or more touches are confirmations of the trend. As you trade it is still important to be on guard. It is what you don't expect... that most needs looking for!
Week of Cautiousness
“Now these forex streets are not for everybody, that's why they made sidewalks” - Jeremy Cash. You must know the rules of the game to profit. Not knowing, is the difference between the trenches and riches. Be cautious trading during the Non Farm Payroll week (NFP). NFP occurs the first week of each month. During NFP economies take inventory of the total amount of jobs gained, excluding farmers. During NFP technical indicators lose validity. Thus, use this week as time to become more knowledgeable rather than placing trades.
Indicator List
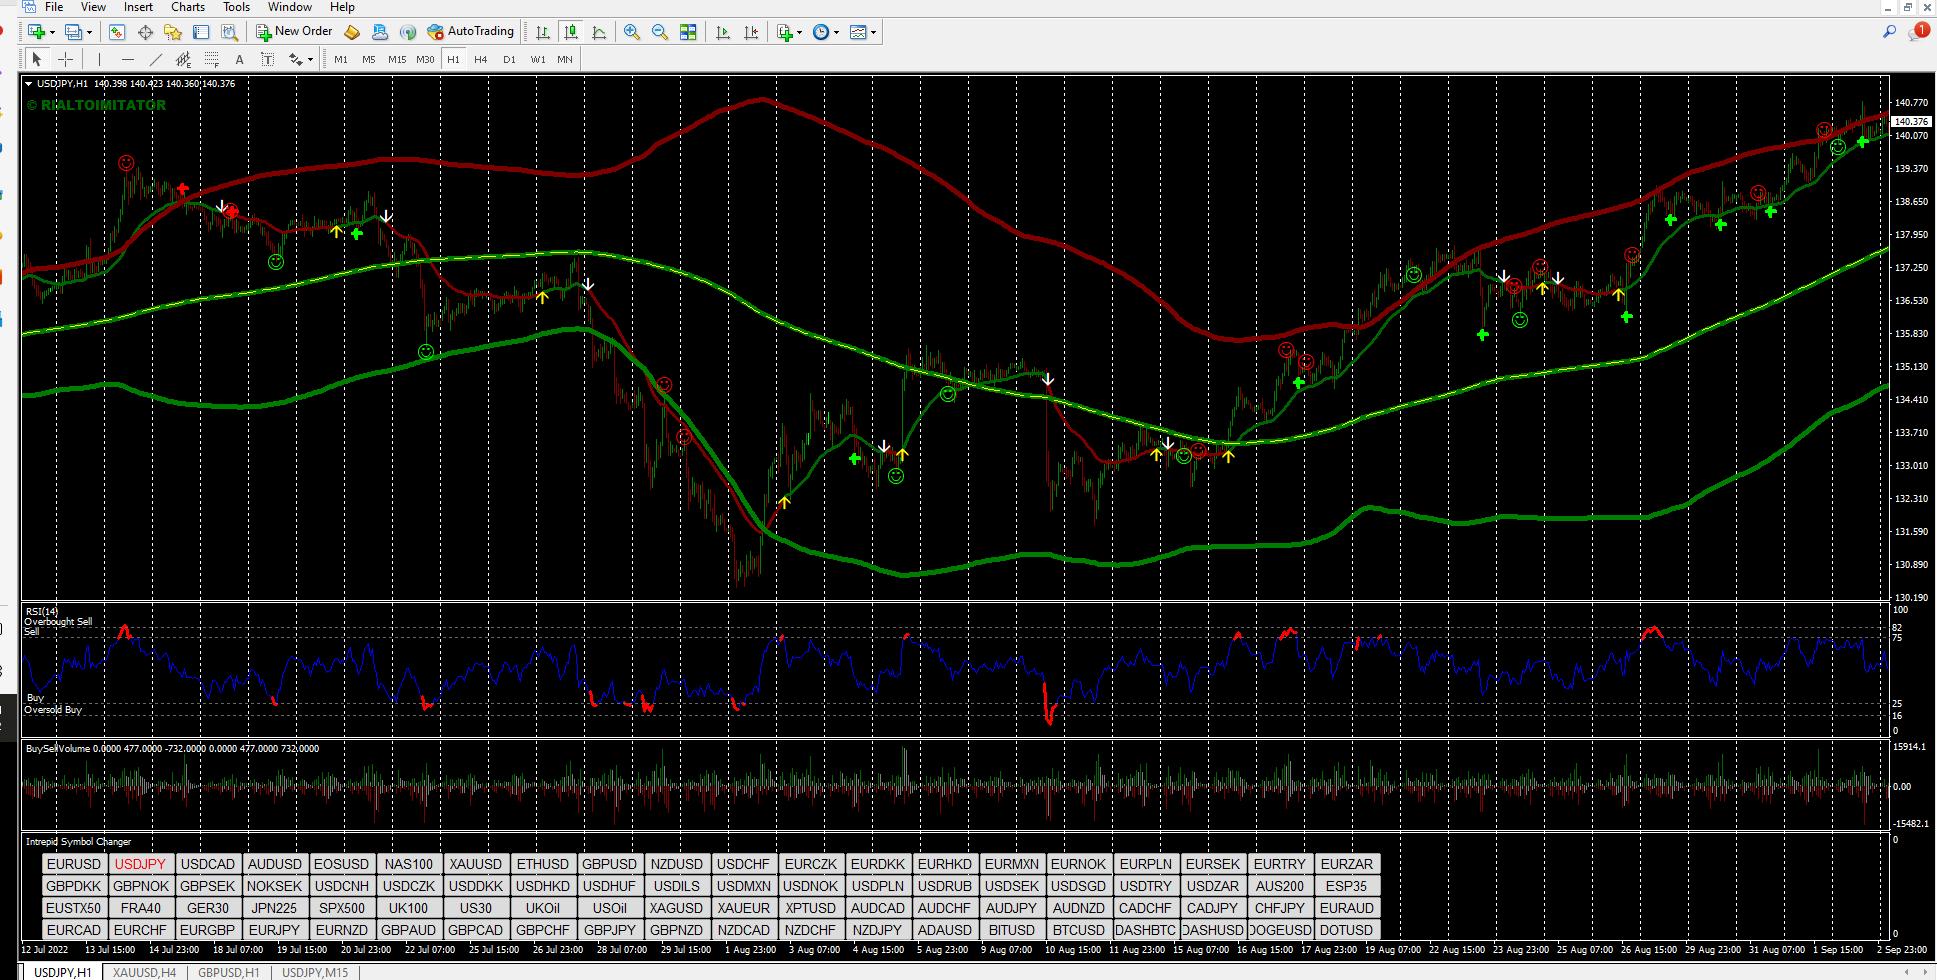
"The execution may not always be precise, so you must have a good plan” - Jay Wayne. Now anything can happen in the forex market. Despite that, forex indicators are technical tools used to give facts to help predict future price. They provide the awareness needed to know when to trade and when to stay out of the forex market. That being said, indicatorspot.com is an online database that provides a collection of downloadable forex indicators to aid in making an educated decision. Thus, below are a list of forex indicators and their role in The King James Strategy.
Volume Indicator- Market reversals and pullbacks usually come after volume and price spikes. Volume spikes can be the first indication of exhaustion, possible pullback or reversal. The volume indicator scans the market for price spikes around overbought and oversold market conditions.
Pinbar Detector- Pinbars are reversal candlestick patterns. The pinbar detector is a price action indicator that detects pinbars. Upon locating a pinbar, the pinbar detector will identify it by placing a green smiley face symbol below a bullish pinbar to signal a buy. Additionally, a red smiley face will appear above bearish pinbars to signal a sell. Smiley face pinbars are more effective at the end of an uptrend or downtrend. They are not as effective when price is moving sideways in consolidation because a clear direction has not been established.
Day Bar Info- This indicator will display a daily candlestick while viewing the lower timeframes. Along with that, you will see the total amount of pips for the day, total amount of pips in the body of the candlestick and total amount of pips for the wick. Lastly, a shadow will outline all price action for the day.
Supertrend Trader- A multi-timeframe indicator that confirms the current trend of a currency pair. Oh but wait! An arrow will appear on the forex chart to validate the trend for entry. Contrarily, the supertrend trader arrow will disappear from your chart if the trend is not valid. The supertrend trader is a must have for your chart. The trend is your friend until it ends. Follow the “money aka trend” that is dominating the market. The supertrend trader validates market structure. Trading against the supertrend arrow may cause immediate drawdown. Lastly, should multiple timeframes have the same supertrend trader arrow for a sell or buy expect price to go in that direction.
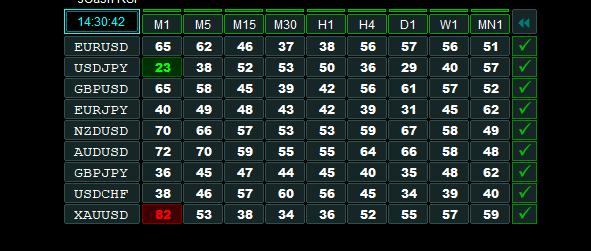
Relative Strength Index (RSI)- The purpose of the RSI is to identify the high and low of the day. The RSI is best used as an alert that price will reverse in the future. "It's not a wish, hope or maybe! It's dropping or going up". The RSI alerts traders to look at their chart and start anticipating a reversal. Use the RSI as a notification for an upcoming reversal. It does not mean to start placing sell or buy trades just yet. The RSI is just an attention getter.
Relative Strength Index (RSI) Scanner- The RSI Scanner is used to find currency pairs with an RSI below 25 or above 75. Also, it will display multiple currency pairs on a dashboard. Lastly, the RSI Scanner will highlight each currency pair and timeframe that meets the criteria.
Bollinger Bands- A trend following tool that uses 3 moving averages. Additionally, it provides buy and sell zones. Bollinger Bands in my opinion can also be used as an entry and exit strategy. For the best results enter sell and buy trades outside of the Bollinger Bands.
The Golden Steps- The Middle Bollinger Band known as “The Golden Steps” acts as support and resistance. Now, every king has a castle and that is exactly where the king is headed whenever price passess above "The Golden Steps". The castle is located outside of the red Bollinger Band. Buyers are in control when price is above “The Golden Steps”. Contrarily, every castle has a dungeon. Anytime the price goes below "The Golden Steps" price is headed to the dungeon. The dungeon is located outside of the green Bollinger Band. Sellers are in control whenever price moves below “The Golden Steps”. This is the case until price moves outside of the green Bollinger Band, then expect a reversal to occur. In the event, price does pullback, do not panic because the king has made up his mind. Pullbacks can be thought of as the king making a stop before heading to his destination.
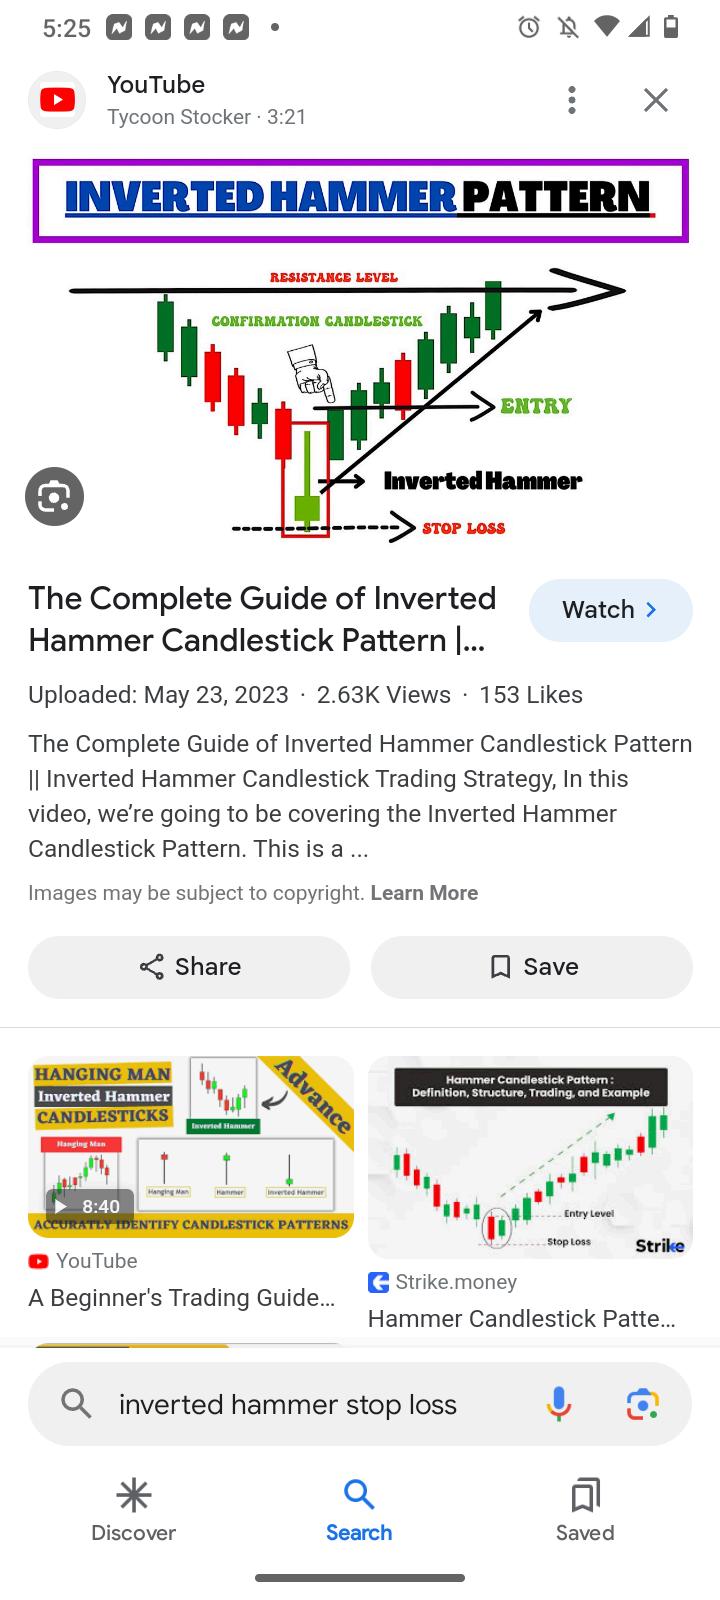
Pinocchio Indicator- This is identified as a shooting star candlestick pattern detector. It appears to represent the end of an uptrend, downtrend or minor pullback. The higher the timeframe the stronger the signal, however the shooting star candlestick pattern should never be used alone.
Tweezer Top & Bottom Indicator - This is a reversal pattern indicator that will produce a circle whenever there are two candlesticks of equal size next to each other. The circle will appear below both candlesticks to symbolize a reversal to the upside. Similarly, a circle will appear above both candlesticks to symbolize a reversal to the downside. Tweezers are helpful clues for when the market will change direction. Because of this, it should be used on the H4 timeframe or higher by itself.
Candle Time Remaining- This timer will be displayed on the chart. It will show the total amount of time left before the current candle ends and a new candle begins. So, before entering a trade make sure the previous candle is in your desired direction.
Intrepid Symbol Changer- This is a chart that will display all currency pairs. It provides a more convenient way to choose and view a specific currency pair.
Pip Counter - This indicator is a pip counter that will display on your chart whenever you are actively in a trade. The pip counter will show the total amount of pips, whether in profit or drawdown.
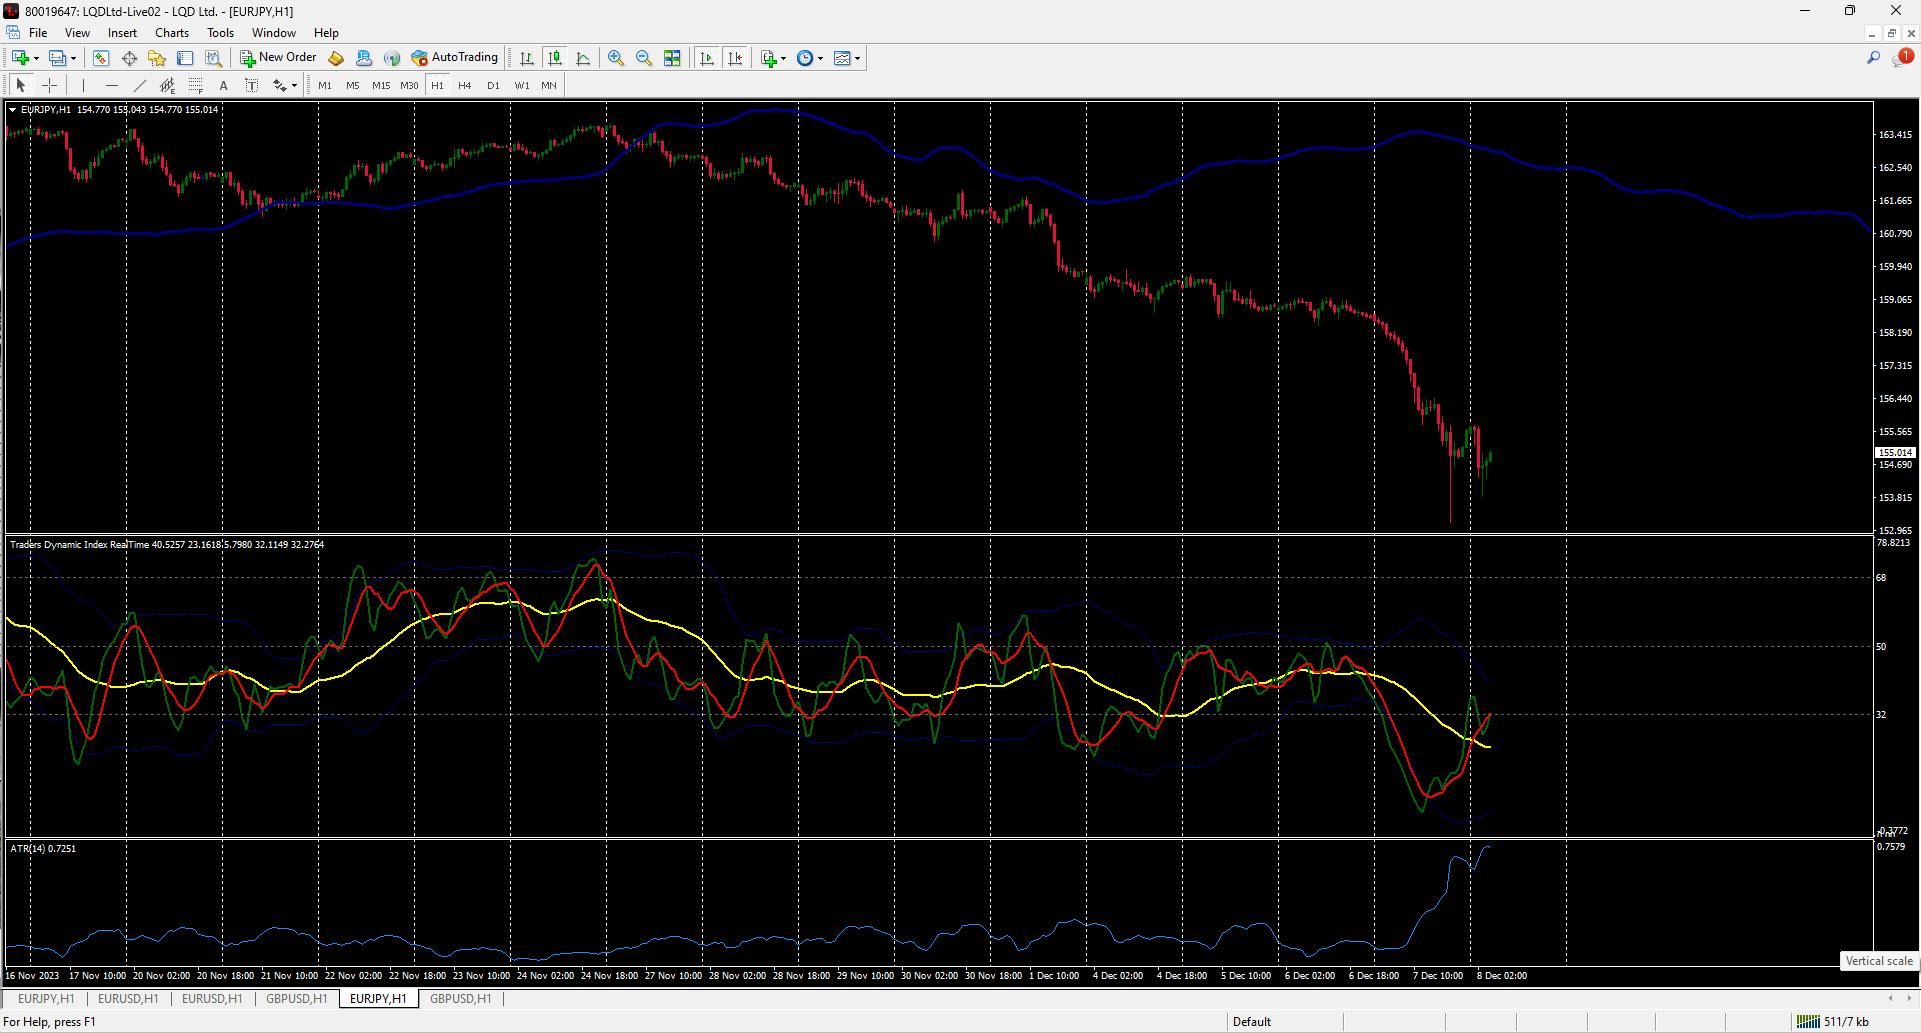
Average True Range (ATR)- Have you ever been stopped out of a trade, just to see it go in your desired direction afterwards? If so, the ATR is a wonderful solution. The ATR is an indicator that displays the average number of pips that a currency pair may move based on the last 14 candles. This indicator is helpful because each currency pair has different volatility, which means depending on the currency pair selected the stop loss may need to be larger or smaller. Using the ATR can help avoid devastating losses. Simply place your stop loss below the higher low on a buy or above the lower high on a sell. Now, the ATR varies per timeframe as well. For example, on the 30 minute timeframe the ATR may be 35 pips, but on the H4 timeframe the ATR may be 267 pips. For added safety, move the ATR value 1.5 times further away from the stop loss. All in all, the ATR is a great indicator tool used to access the market like professional traders.
Trader Dynamic Index (TDI) - This forex indicator is used to identify price action, trend conditions, momentum changes, entry points and exit points. This indicator will be used as a final confirmation. It can help make traders 75 to 85 percent profitable by only trading overbought and oversold levels, so simply sell at the top and buy at the bottom. Limit yourself to opening 3 trades per currency pair at the most because as more trades are placed, risk increases on the account.
The first trade should only be placed when price is outside of the blue volatility bands also known as the “King’s sword” or when the “Shark is out of the water”. Take profit should be placed at the nearest zone. The 15 minute timeframe or higher is the money maker. The 68 line indicates buying exhaustion and the 32 line indicates selling exhaustion. The best trades occur when the yellow line known as the market baseline reaches 68 or 32 on the 4 hour timeframe because it symbolizes a fresh trend, so expect a reversal.
The blue volatility bands act as support and resistance. Close volatility bands represent less price movement, but the further apart they are indicates a lot of price movement. Entering when you see the “King’s sword” or when the “Shark is out of the water” signifies that a stop hunt has occurred, so you can now place your trade. On the chart, the process will be to identify consolidation, a false move, “King’s sword” or when “Shark is out of the water”, see a profit and then close your trade.
The green line represents the current price. The red line is a trade signal line, so any crossover represents an entry and exit point. The yellow line represents overall market condition, but the blue line represents increasing and decreasing volatility. Yellow, red and green lines to the downside indicate a sell. Contrarily, yellow, red and green lines to the upside indicates a buy. Additional positions can be added on a market baseline (yellow line) cross or volatility band cross (the blue band.) All in all, pay attention to the crossovers and be sure to place a stop loss above the high and beneath the low of the day.
3 Moving Averages For Phone or Tablet-
● 10 Day Moving Average
● 21 Day Moving Average
● 50 Day Moving Average
After a careful analysis, whenever the 10 or 21 Day moving average (MA) crosses the 50 (MA) it acts as a signal to buy or sell depending on the direction of the (MA) cross. Moving averages (MA) are used to determine a trend, reduce noise, generate buy/sell signals and smooth out price movement. Two preferable options to choose from will be the exponential moving average (EMA) or Hull moving average (HMA). Price behaves several different ways near an (MA); Price will either trend up or down allowing the (MA) to act as support or resistance, bounce off of the moving average or penetrate through the (MA). That is trend, bounce or penetrate! Now, do not expect the price to always bounce directly off of the (MA) perfectly because that will cause false signals. Instead, seek out momentum candles. Whenever a larger candle is two or three times the size of a previous candle it is known as a momentum candle. Moving averages (MA) offer a way to be opportunistic when volatility arises and serves as an alert to get out of the way in the event of a reversal or cross of two or more moving averages (MA). There are always warning signs before a catastrophic loss. Being stopped out early is a natural part of trading any strategy, yet a moving average (MA) assists in placing trades at a discounted area. Considering everything. Put the odds in your favor, so over a series of trades you come out profitable.