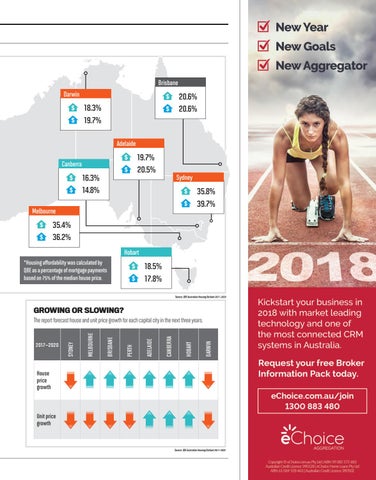
Brisbane Darwin
20.6% 20.6%
18.3% 19.7% Adelaide
19.7% 20.5%
Canberra
16.3% 14.8%
Sydney
35.8% 39.7%
Melbourne
35.4% 36.2% Hobart *Housing affordability was calculated by QBE as a percentage of mortgage payments based on 75% of the median house price.
18.5% 17.8% Source: QBE Australian Housing Outlook 2017–2020
GROWING OR SLOWING?
DARWIN
HOBART
CANBERRA
ADELAIDE
PERTH
BRISBANE
MELBOURNE
2017–2020
SYDNEY
The report forecast house and unit price growth for each capital city in the next three years.
House price growth
Unit price growth
Source: QBE Australian Housing Outlook 2017–2020