

The Next Generation of Animal Health


Preweaning Trial Report RumaCell™ Effect on Volatile Fatty Acid Profile in 600# Calves
Table 1. Effects of dietary treatment on rumen volatile fatty acid concentrations preweaning1
1 Con0 = Control d0, Creep0 = Creep
a,b Means that differ (P ≤ 0.05) are indicated by differing superscripts
a,b
Means that differ (P ≤ 0.05) are indicated by differing superscripts
Trait Treatment Means SEM Trt P-value Time P-value Trt*Time P-value Con0 Creep0 Pre0 Con55 Creep55 Pre55 Acetate, mM 66.51b 61.71b 62.79b 67.69ab 68.04ab 78.92a 2.755 0.17 < 0.01 < 0.01 Propionate, mM 12.91b 12.02b 12.21b 11.28 b 14.01b 17.37a 0.780 < 0.01 < 0.01 < 0.01 Isobutyrate, mM 1.22a 1.09abc 1.13ab 0.75d 0.94bc 0.91cd 0.045 0.74 < 0.01 < 0.01 Butyrate, mM 8.97bc 9.29bc 9.62ab 6.94c 10.40ab 11.83a 0.577 < 0.01 0.33 < 0.01 Isovalerate, mM 1.62a 1.38a 1.50a 0.92b 1.38a 1.35a 0.072 0.14 < 0.01 < 0.01 Valerate, mM 0.78a 0.62ab 0.74a 0.38b 0.71a 0.85a 0.061 < 0.01 0.15 < 0.01 Caproate, mM 0.81 0.77 0.76 0.88 1.00 0.95 0.106 0.95 0.03 0.64 A:P 5.16b 5.15b 5.15b 6.01a 5.10b 4.75b 0.123 < 0.01 0.19 < 0.01 Total VFA, mM 92.81b 86.88b 88.73b 88.83b 96.47ab 112.18a 4.002 0.07 < 0.01 < 0.01
d0, Pre0 = Prebiotic d0, Con55 = Control d55, Creep55 = Creep d55, Pre55 = Prebiotic 55, SEM = Standard Error of the Mean, Trt = Treatment, Trt*Time = Treatment by Time Interaction, A:P = Acetate:Propionate, VFA = Volatile Fatty Acid
Trait Treatment Means SEM Trt P-value Time P-value Trt*Time P-value Con0 Creep0 Pre0 Con55 Creep55 Pre55 Acetate, % 71.63b 71.03b 70.72b 76.12a 70.66b 70.84b 0.496 < 0.01 < 0.01 < 0.01 Propionate, % 13.92abc 13.82abc 13.76bc 12.70c 14.32ab 15.25a 0.357 < 0.01 0.39 < 0.01 Isobutyrate, % 1.31a 1.26a 1.28a 0.85bc 1.00b 0.82c 0.039 0.24 < 0.01 < 0.01 Butyrate, % 9.68a 10.65a 10.81a 7.83b 10.76a 10.34a 0.284 < 0.01 < 0.01 < 0.01 Isovalerate, % 1.76a 1.60ab 1.69a 1.04c 1.45b 1.18c 0.052 0.09 < 0.01 < 0.01 Valerate, % 0.83a 0.72a 0.85a 0.43b 0.72a 0.72a 0.048 0.01 < 0.01 < 0.01 Caproate, % 0.87 0.92 0.88 1.03 1.08 0.85 0.125 0.63 0.28 0.60 1 Con0 = Control d0, Creep0 = Creep d0, Pre0 = Prebiotic d0, Con55 = Control d55, Creep55 = Creep d55, Pre55 = Prebiotic 55, SEM = Standard Error of the Mean, Trt = Treatment, Trt*Time = Treatment by Time Interaction, A:P = Acetate:Propionate, VFA = Volatile Fatty Acid
Table 2. Effects of dietary treatment on rumen volatile fatty acid proportions preweaning1
1 Con0 = Control d0, Creep0 = Creep d0, Pre0 = Prebiotic d0, Con55 = Control d55, Creep55 = Creep d55, Pre55 = Prebiotic 55,
a,b Means that differ (P ≤ 0.05) are indicated by differing superscripts
a,b Means that differ (P ≤ 0.05) are indicated by differing superscripts
Trait Treatment Means SEM Trt P-value Time P-value Trt*Time P-value Con0 Creep0 Pre0 Con55 Creep55 Pre55 Acetate, mM 31.32bc 32.73bc 34.76ab 23.60c 34.31ab 42.67a 2.337 < 0.01 0.76 < 0.01 Propionate, mM 6.12a 6.04ab 6.29a 4.05b 5.92ab 7.55a 0.480 < 0.01 0.43 < 0.01 Isobutyrate, mM 1.04 0.80 0.77 0.85 0.84 0.77 0.075 0.08 0.41 0.26 Butyrate, mM 2.03abc 1.86bc 1.82bc 1.22c 2.78ab 3.00a 0.255 < 0.01 0.04 < 0.01 Isovalerate, mM 0.88 0.60 0.52 0.66 0.59 0.53 0.090 0.02 0.33 0.35 Valerate, mM 0.73 0.67 0.65 0.72 0.68 0.69 0.085 0.79 0.86 0.94 Caproate, mM 0.32 0.139 0.23 0.00 0.00 0.00 0.104 0.69 0.01 0.69 A:P 5.41 5.45 5.71 6.00 5.88 5.73 0.208 0.97 0.02 0.29 Total VFA, mM 42.44bc 42.83bc 45.04ab 31.09c 45.12ab 55.21a 2.975 < 0.01 0.88 < 0.01
Table 3. Effects of dietary treatment on fecal volatile fatty acid concentrations preweaning1
SEM = Standard Error of the Mean, Trt = Treatment, Trt*Time = Treatment by Time Interaction, A:P = Acetate:Propionate, VFA = Volatile Fatty Acid
Trait Treatment Means SEM Trt P-value Time P-value Trt*Time P-value Con0 Creep0 Pre0 Con55 Creep55 Pre55 Acetate, % 74.03 76.11 77.07 75.98 76.07 76.93 0.884 0.11 0.40 0.38 Propionate, % 14.13 14.04 13.72 13.06 13.09 13.67 0.401 0.96 0.02 0.26 Isobutyrate, % 2.46 2.02 1.81 2.78 2.08 1.66 0.193 < 0.01 0.62 0.48 Butyrate, % 4.59abc 4.39bc 4.03bc 3.87c 5.77a 5.27ab 0.318 0.05 0.01 < 0.01 Isovalerate, % 2.06 1.53 1.23 2.12 1.47 1.17 0.199 < 0.01 0.91 0.94 Valerate, % 1.72 1.56 1.48 2.19 1.52 1.30 0.177 0.01 0.54 0.14 Caproate, % 1.01 0.36 0.66 0.00 0.00 0.00 0.323 0.61 0.01 0.61 1 Con0 = Control d0, Creep0 = Creep d0, Pre0 = Prebiotic d0, Con55 = Control d55, Creep55 = Creep d55, Pre55 = Prebiotic 55, SEM = Standard Error of the Mean, Trt = Treatment, Trt*Time = Treatment by Time Interaction, A:P = Acetate:Propionate, VFA = Volatile Fatty Acid
Table 4. Effects of dietary treatment on fecal volatile fatty acid proportions preweaning1
1 Con0 = Control d0, Creep0 = Creep d0, Pre0 = Prebiotic d0, Con55 = Control d55, Creep55 = Creep d55, Pre55 = Prebiotic 55, SEM = Standard
Error of the Mean, Trt = Treatment, Trt*Time = Treatment by Time Interaction
a,b Means that differ (P ≤ 0.05) are indicated by differing superscripts
Control = Pasture with Dam
Creep = Pasture with Dam and Creep Feed Supplemented
Prebiotic = Pasture with Dam and Creep Feed with Prebiotic (RumaCell) Supplemented
d0 = Day 0 – Start of trial on July 9th, 2021
d55 = Day 55 – End of trial on Sept 2nd, 2021
Trait Treatment Means SEM Trt P-value Time P-value Trt*Time P-value Con0 Creep0 Pre0 Con55 Creep55 Pre55 Ribeye Area, in2 7.23 7.27 7.34 8.13 8.63 8.60 0.197 0.46 < 0.01 0.11 Intramuscular Fat, % 3.50b 3.49b 3.54b 4.23a 4.63a 4.53a 0.151 0.57 < 0.01 0.08 Backfat Thickness, in 0.13d 0.13cd 0.13cd 0.17bc 0.22a 0.21ab 0.011 0.09 < 0.01 < 0.01
Table 5. Effects of dietary treatment on carcass ultrasounds preweaning1
Results and Discussion:
• Table 1 contains the rumen volatile fatty acid (VFA) concentration (mM) data from the preweaning trial (July 9th – Sept 2nd). There were no significant differences (P ≥ 0.05) in the concentration of each VFA, or total VFAs, in the rumen at the start of the trial as measured on d0, suggesting that all calves in the study started with similar rumen conditions.
• Propionate, however, was significantly increased (P ≤ 0.04) in the rumen of Prebiotic calves on d55 compared to Control and Creep calves on d55.
• Moreover, butyrate was significantly increased (P ≤ 0.001) in the rumen of Prebiotic and Creep calves compared to the Control calves on d55. Butyrate is believed to be important for rumen development and maintaining gut health through improved gut epithelial cell function and reduced inflammation. Isovalerate and valerate were also significantly increased (P ≤ 0.004) in the rumen of Creep and Prebiotic calves compared to the Control calves on d55.
• Prebiotic and Creep calves had significantly lower (P < 0.001) acetate:propionate ratios in their rumens than Control calves on d55, indicating that they had greater levels of propionate relative to acetate. Lower acetate:propionate ratios, thus, suggest potentially greater energy availability given propionate’s role as a glucose precursor.
• Overall, the Prebiotic calves had significantly greater (P = 0.002) total VFA concentrations in their rumen on d55 compared to the Control calves, with Creep calves being intermediate.
• These results suggest that creep feed along with supplemental prebiotic tended to increase rumen VFA concentrations over just feeding creep feed alone, but provided a significant increase in VFA concentrations over just grazing pasture.
• Table 2 contains the rumen VFA concentrations expressed as a proportion (%) of total VFA concentrations present. These results are largely reflective of the differences noted in the concentrations in Table 1. Briefly, the Creep and Prebiotic calves had significantly lower proportions of acetate and greater proportions of propionate, butyrate, and valerate compared to the rumen of the Control calves on d55.
• Table 3 contains the fecal VFA concentration (mM) data from the preweaning trial (July 9th –Sept 2nd). There were no significant differences (P ≥ 0.05) in fecal concentrations of each VFA, or total VFAs, at the start of the trial as measured on d0, suggesting that all calves entering the study exhibited similar gut function There were significantly greater (P ≤ 0.02) concentrations of acetate in the fecal samples of Creep and Prebiotic calves compared to Control calves on d55. Propionate concentrations in fecal samples on d55 were significantly greater (P < 0.001) in Prebiotic calves compared to Control calves, with Creep calves being intermediate. Butyrate concentrations were significantly greater (P ≤ 0.001) in fecal samples from Prebiotic and Creep calves compared to Control calves on d55. Overall, total fecal VFA concentrations were significantly greater (P ≤ 0.01) in Creep and Prebiotic calves compared to Control calves on d55. Research on fecal VFA concentrations is limited, but it is possible that the greater VFA concentrations in the fecal samples are a reflection of enhanced hindgut fermentation, resulting in greater VFA production in the lower gut. Table 4 contains the fecal VFA concentrations expressed as a proportion (%) of total VFA
concentrations present. Converting the fecal concentration values to proportions greatly reduced the differences noted, such that only the proportion of butyrate was significantly increased (P ≤ 0.03) in Creep and Prebiotic calves compared to Control calves on d55.
Table 5 contains the carcass ultrasound data from the preweaning trial (July 9th – Sept 2nd). There were no significant differences (P ≥ 0.05) in ribeye area, intramuscular fat content (i.e., marbling), or backfat thickness at the start of the trial as measured on d0, suggesting that the calves started the study at a similar body composition. Backfat thickness was significantly greater (P = 0.02) in Creep calves compared to Control calves on d55, with Prebiotic calves being intermediate.
Project Update:
Both phases (pre- and post-weaning) of the study are complete, and all of the samples have been collected. During the pre-weaning phase, we collected samples for feed intake, weight, ultrasound carcass composition, and VFA analysis. The feed intake and weight data were presented previously (Dec 2021). The carcass ultrasound and VFA data are presented above. During the post-weaning phase of the study, we collected samples for the determination of the immune/stress response (cytokines, glucose, cortisol, body temp, respiration rates, sickness behavior scores) as well as to assess alterations in the rumen and fecal microbiomes and VFA concentrations following weaning stress and an immune challenge. These samples are currently being analyzed. Following the post-weaning immune challenge and the conclusion of my research, the calves were shipped to another University farm where they were grouped into one pasture and fed the creep feed diet at 10 lbs/hd/d from the first of October to the first of November. In November, all steers were then shipped to a feedlot in southern Georgia where they began a grower diet. The same grower diet was fed to all steers from November of 2021 to February of 2022. During the grower phase, we collected body weights for the calculation of average daily gain (ADG). In February, the steers entered the feedlot and began a finishing diet which they will be on until May of 2022. At the start and end of the finisher phase, we will be collecting weights as well as rumen and fecal samples. The rumen and fecal samples will be analyzed for microbiome and VFA analysis. Individual feed intake data will be collected throughout the finisher phase using the GrowSafe feed intake monitoring system. From this intake and weight data, we will then be able to calculate individual ADG, feed intake, and feed efficiency parameters for each steer.
Monensin Study
Performance of backgrounding steers fed diets containing monensin or a lactobacillus fermentation product1
John B. Hall,*,†,2 Anne H. Laarman,† Maggie K. Reynolds,† and Wayne K. Smith*
*Nancy M. Cummings Research, Extension and Education Center, University of Idaho, Carmen 83462; †Department of Animal and Veterinary Science, University of Idaho, Moscow 83844
© The Author(s) 2018. Published by Oxford University Press on behalf of the American Society of Animal Science. This is an Open Access article distributed under the terms of the Creative Commons Attribution Non-Commercial License (http://creativecommons.org/licenses/by-nc/4.0/), which permits non-commercial re-use, distribution, and reproduction in any medium, provided the original work is properly cited. For commercial re-use, please contact journals.permissions@oup.com.
Transl. Anim. Sci. 2018.XX:XX–XX doi: 10.1093/tas/txy035
INTRODUCTION
Backgrounding of beef calves after weaning is an increasingly common practice. Many value-added feeder calf programs require calves to be weaned and backgrounded for 45 to 60 d.Although premiums are paid for weaned, backgrounded cattle, the economic advantage to the producer is highly variable and is dependent on a variety of factors and marketing scenarios (Avent et al., 2004; Dhuyvetter et al., 2005). However, increasing the additional kilograms gained by animals during the backgrounding phase consistently improves returns to the operation (Dhuyvetter et al., 2005).
Ionophores (monensin, lasalocid, and laidlomycin proprionate) are often included in backgrounding and finishing cattle diets to improve gains, increase feed efficiency, reduce bloat, and decrease acidosis (Goodrich et al., 1984;
1Research presented in this manuscript was supported by the Idaho Agricultural Experiment Station, UI Department of Animal and Veterinary Science, UI Nancy M. Cummings REEC and the Hatch Program project number IDA01493 of the National Institute of Food and Agriculture, U.S. Department of Agriculture. The authors would like to thank Pacer Technologies, Inc. for donation of the RumaCell containing liquid supplement, and PerforMix Nutrition Systems for formulating and mixing all liquid supplements.
2Corresponding author: jbhall@uidaho.edu
Received March 16, 2018.
Accepted April 14, 2018.
Callaway et al., 2003). Ionophores can also act as a coccidiostat when provided in higher concentrations. Limitations of inclusion of ionophores in backgrounding diets include variable consumption rates and interactions with feed availability.
Organic and most natural beef programs do not allow the use of ionophores in cattle diets ( Troxel, 2012 ). Therefore, calf-backgrounding operations either give up benefits of including ionophores in cattle diets, or experience a reduction in marketing options when ionophores are used. Potential alternatives to ionophores in natural or organic beef operations are probiotics and/or prebiotics. When added to cattle diets, probiotics, and prebiotics can alter ruminal microflora and fermentation ( Dhama et al., 2008 ; Rai et al., 2013 ). These alterations in ruminal fermentation do not consistently result in changes in animal performance ( Uyeno et al., 2015 ). It appears that animal performance is highly dependent on the type and concentration of the probiotic/prebiotic.
Several FDA prebiotic products are available for use in beef cattle. A commercially produced fermentation product of Lactobacillus acidophilus (RumaCell, Pacer Technologies INC., Murtaugh, ID) is readily available to beef and dairy producers. However, producers need more researchbased information on impact of this product and similar prebiotics on rumen function and animal performance.
1
1.5 1.10 1.15 1.20 1.25 1.30 1.35 1.40 1.45 1.50 1.55 1.60 1.65 1.70 1.75 1.80 1.85 1.90 1.95 1.100 1.105 1.110 1.115 1.120
The experimental hypothesis was that steers fed diets containing monensin would outperform steers fed diets containing a L. acidophilus prebiotic. The objectives of this study were to 1) compare effects of a L. acidophilus prebiotic or monensin on animal performance, feed intake and feed efficiency in steers during short-term (42 d) backgrounding period, and 2) conduct a preliminary examination of in vitro fermentation characteristics.
MATERIALS AND METHODS
All in vitro and in vivo procedures were approved by the University of Idaho Animal Care and Use Committee (IACUC 2017–51 and 2015–19).
For the in vitro study, rumen fluid was harvested from three lactating Holstein cows 2 h after morning feeding, squeezed through four layers of cheesecloth in a bottle, and transferred to the laboratory in warm water (40 °C). Once in the lab, incubations were carried out similar to Au et al. (2010), using a 1:4 ratio of rumen fluid to pre-warmed buffer. Each vial contained 0.5 g of a low-starch dairy close-up diet with either monensin (MON), L. acidophilus prebiotic (LaP; RumaCell, Pacer Technologies Inc., Murtaugh, ID) treatment, or a control; two technical replicates were used per day, and the in vitro analysis was carried out on three separate days. Samples were taken at 24 h and analyzed for volatile fatty acids using established gas chromatography methods, as described previously (Laarman et al., 2012).
In the in vivo study, crossbred beef steers (n = 160; 199.9 ± 1.2 d of age) were weaned and placed on pasture for 2 wk prior to initiation of the trial. At the beginning of the experiment, steers were stratified by weight and randomly assigned to receive either MON or LaP treatment. All animals were fed in a GrowSafe system (GrowSafe Systems Ltd, Calgary, AB) consisting of five nodes per pen and two pens per treatment. Steers were fed a total mixed ration consisting of 75% ground alfalfa hay, 10% cracked corn, 10% wheat middlings, and 5% liquid supplement (Table 1). The molasses-based liquid supplement (PerforMix Nutrition Systems, Nampa, ID) provided minerals, vitamins, and MON or LaP (Table 2). Diets were formulated to provide 200 mg per animal per day of MON or 5 mL per animal per day of LaP. Steers were allowed ad libitum access to diets and water. There was a 14-d warm-up period followed by a 42-d test period. For the first 5 d of the warm-up period, liquid supplement was not included in the diets because it serves as the carrier for MON or LaP, and delivery of the LaP was delayed.
Table 1. Nutrient analysis of diets supplemented with monensina or Lactobacillus acidophilus prebiotic (LAP)b to backgrounding steers
Table 2. Composition of basal liquid supplement that included monensina or L. acidophilus prebioticb
Diets were mixed either once or twice daily. Diets were mixed in different feed trucks to prevent cross contamination of diets. Same lots of ground hay,
2 Hall et al. Translate basic science to industry innovation
Feed additive Component Monensin LaP SE P value Dry Matter (DM), % 89.9 88.9 0.31 0.06 Crude protein, %DM 13.1 13.9 0.42 0.25 Acid detergent fiber, %DM 37.5 35.5 1.10 0.26 Neutral detergent fiber, %DM 48.7 46.4 1.44 0.31 Crude fat, %DM 1.35 1.54 0.09 0.18 Ash, %DM 8.82 9.10 0.32 0.55 Ca, %DM 1.02 1.07 0.02 0.26 P, %DM 0.28 0.29 0.01 0.37 Mg, %DM 0.23 0.25 0.01 0.16 K, %DM 2.27 2.27 0.02 0.88 Total digestible nutrients, % 57.0 58.3 1.01 0.41 Net energy maintenance, mcal/kg 1.25 1.26 0.02 0.86 Net energy gain, mcal/kg 0.68 0.69 0.02 0.86
aMonensin—200 mg per animal per day bRumaCell, prebiotic fermentation product of L. acidophilus—5 mL per animal per day
Nutrient name Dry matter Dry matter, % 65.50 Invert sugars, % 31.69 Crude protein, % 20.25 CP as NPN, % 6.88 Crude fat, % 1.52 Salt, % 9.07 Calcium, % 3.15 Phosphorus, % 1.53 Magnesium, % 0.34 Potassium, % 11.15 Sulfur, % 0.52 Iron, ppm 405.50 Manganese, ppm 674.05 Zinc, ppm 840.72 Copper, ppm 269.31 Cobalt, ppm 12.21 Iodine, ppm 78.89 Selenium, ppm 5.02 Vitamin A, IU/kg 53,442.67 Vitamin D, IU/kg 3,817.34 Vitamin E, IU/kg 673.38 Net energy maintenance, mcal/ kg 3.64 Net energy gain, mcal/kg 2.54 Net energy lactation, mcal/kg 3.55 aMonensin—346.17 g/907 kg bRumaCell, prebiotic fermentation product of L. acidophilus—8.3 L/907 kg 2.5 2.10 2.15 2.20 2.25 2.30 2.35 2.40 2.45 2.50 2.55 2.60 2.64 2.70 2.75 2.80 2.85 2.90 2.95 2.100 2.105 2.110 2.115 2.120 2.125 2.129
corn, and commodities were used for diets. However, variation in diets can occur due to loading practices, improper mixing times, weighing errors, segregation of ingredients, and changes in ingredients (Vogel and Laudert, 2015). Feed samples were collected daily from all bunks for each treatment. Daily samples were pooled by treatment. Daily samples were weighed and dried to determine dry matter content. Daily steer feed intakes were adjusted for daily dry matter content to calculate individual animal dry matter intake (DMI). Feed samples from each 14-d period were composited by treatment and analyzed by near infrared spectrometry (Cumberland Valley Analytic Services, Chambersburg, PA).
Steers were weighed on two consecutive days at the beginning and end of the experiment. In addition, steers were weighed every 2 wk during the experiment. Beginning and final weights were used to calculate trial average daily gain (ADG). Individual animal feed intakes were recorded daily. Diet dry matter was determined daily for each treatment and used to calculate individual animal daily DMI. G:F ratio was calculated from using daily DMI and ADG.
Data from feed nutrient analysis were analyzed by ANOVA using GLM Procedures of SAS (Cary, NC). In vitro data were analyzed using MIXED procedure of SAS, with fixed effects of supplement. All performance and intake data were subjected to statistical analysis using MIXED procedures of SAS. The independent variable was diet and dependent variables included beginning weight, final weight, ADG, DMI, and G:F.
RESULTS AND DISCUSSION
Diets for LaP steers had a tendency (P < 0.06) to contain less dry matter than MON-supplemented diets (Table 1), but were isoenergetic and isonitrogenous (Table 1), indicating that differences in performance were due to treatment, not a result of nutrient density of the diet. BW at the beginning and end of the trial were similar (P > 0.89 and P > 0.40, respectively) between MON and LaPsupplemented steers (Table 3). Steers were allocated to treatment based on BW, which ranged from 213.1 to 384.6 kg at the beginning of the study. This variation was maintained throughout the study with final weights ranging from 255.8 to 454.4 kg. Therefore, the animal-to-animal variation in BW and the short duration of the study make detecting a BW difference challenging.
In contrast to impacts on BW, LaP enhanced ADG (P < 0.01) and DMI (P < 0.05) compared with MON (Table 3). However, G:F ratio was similar
Table 3. Performance of steers during a 42-d backgrounding trial when supplemented with monensina or L. acidophilus prebiotic (LaP)b
TreatmentLaPMonensinDifferencec
P value
Initial wt, kg311.6 ± 3.9310.8 ± 3.8 0.80.89
Final wt, kg375.6 ± 4.4370.3 ± 4.4 5.30.40
ADG, kg/d1.52 ± 0.031.42 ± 0.030.100.01
DMI, kg/d10.6 ± 0.1610.1 ± 0.160.50.05
G:F 0.145 ± 0.0040.142 ± 0.0040.0030.50
aMonensin—200 mg per animal per day
bRumaCell, prebiotic fermentation product of L. acidophilus—5 mL per animal per day
cDifference = LaP – Monensin
(P > 0.50) among LaP and MON-supplemented steers. Average daily gains were increased by 0.10 kg/d in LaP-supplemented steers compared to MON-supplemented steers. As G:F were similar, it appears that a majority of the increase in ADG in LaP-supplemented steers was a result of the 0.5 kg/d increase in DMI compared to MON steers. Why LaP increased DMI compared to MON is unclear.
Monensin is well known to act by selectively reducing acetate producing bacteria in the rumen which results in decreased methane production and increased availability of propionate (Calloway et al., 2003). In addition, monensin reduces ruminal amino acid fermentation resulting in increased amino acid availability to the hindgut. The result is enhanced ADG and feed efficiency. In the present study, MON was supplemented at 200 mg per animal per day, a concentration demonstrated to increase ADG in multiple pasture and forage feeding experiments (Kunkle et al, 2000). Therefore, we used MON-supplementation as a positive control for comparison with LaP.
As a prebiotic, LaP should act by enhancing growth of certain types of bacteria in the rumen and perhaps inhibiting others (Dhama et al., 2008; Rai et al., 2013). Inclusion rate was 5 mL per animal per day because this concentration resulted in the most consistent effect on fermentation in vitro based on a preliminary study (data not shown). In the in vitro study, LaP improved (P < 0.05) valerate and isovalerate production similar to MON (Table 4). In contrast to MON, LaP enhanced (P < 0.05) butyrate production and decreased (P < 0.05) propionate production. Therefore, the exact mechanism that resulted in the observed effects in LaP-supplemented steers on this high forage diet is unclear. Propionate is a known appetite suppressant in cattle (Oba and Allen, 2003), so the small decrease in propionate proportions may contribute to greater DMI. More research on mechanisms of
3 Effect of monensin or a prebiotic Translate basic science to industry innovation
3.5 3.10 3.15 3.20 3.25 3.30 3.35 3.40 3.45 3.50 3.55 3.60 3.64 3.70 3.75 3.80 3.85 3.90 3.95 3.100 3.105 3.110 3.115 3.120 3.125 3.129
Table 4. Fermentation profile of diets supplemented with monensin (MON) or a L. acidophilus prebiotic (LaP; 5 mL/d) after 24-h incubation in vitroa
ControlLaPMON P value
DM Digestibility, %51.4 ± 1.350.9 ± 1.349.8 ± 1.30.93
Acetate, %35.0 ± 0.534.1 ± 0.534.4 ± 0.51.00
Propionate, %27.6 ± 0.6b 25.8 ± 0.8c 27.2 ± 0.6b <0.01
Butyrate, %20.3 ± 0.6b 21.8 ± 0.6c 19.9 ± 0.6b <0.01
Isobutyrate, %2.61 ± 0.052.68 ± 0.052.73 ± 0.050.80
Valerate, %7.76 ± 0.43b 8.28 ± 0.43c 8.41 ± 0.43c 0.01
Isovalerate, %6.17 ± 0.25b 6.57 ± 0.25c 6.62 ± 0.25c 0.05
aMeans in the same row with a different superscript are different (P < 0.05)
prebiotic action is needed as other plausible mechanisms may yield similar results
In conclusion, we reject our hypothesis that MON-supplemented steers would outperform LaP-supplemented steers. Caution must be used when interpreting these results as these are shortterm studies. A conservative interpretation is that LaP may be able to replace MON in some diets.
IMPLICATIONS
In the present study, supplementation of a forage-based backgrounding diet with a L. acidophilus prebiotic (LaP), RumaCell, increased ADG and DMI compared with a diet supplemented with monensin. These results indicate that LaP may be an alternative to monensin in diets for cattle in natural beef programs. Further larger scale studies on LaP in diets of varying forage to concentrate ratios are needed to confirm positive effects observed in this study. In addition, investigations into the mechanism of action of LaP, and its impact on the rumen microbiome are warranted.
LITERATURE CITED
Au, F., L. E. McKeown, T. A. McAllister, and A. V. Chaves. 2010. Fermentation characteristics of corn-, triticale-, and wheatbased dried distillers’ grains with solubles in barley-based
diets determined using continuous and batch culture systems. J. Sci. Food Agric. 90:2074–2082. doi:10.1002/jsfa.4054
Avent, R., C. Ward, and D. Lalman. 2004. Market valuation of preconditioning feeder calves. J. of Agri. Applied Econ. 36:173–183. doi:10.1017/S1074070800021933
Callaway, T. R., T. S. Edrington, J. L. Rychlik, K. J. Genovese, T.L. Poole, Y. S. Jung, K. M. Bischoff, R. C. Anderson, and D. J. Nisbet. 2003. Ionophores: their use as ruminant growth promotants and impact on food safety. Curr. Issues Intest. Microbiol. 4:43–51.
Dhama, K., M. Mahendran, S. Tomar, and R. S. Chauhan. 2008. Beneficial effects of probiotics and prebiotics in livestock and poultry: the current perspectives. Intas Polivet. 9:1–2.
Dhuyvetter, K. C., A. M. Bryant and D. A. Blasi. 2005. Case study: preconditioning beef calves: are expected premiums sufficient to justify the practice? Prof. Anim. Scientist. 21:502–514. doi:10.15232/S1080-7446(15)31256-0
Goodrich, R. D., J. E. Garrett, D. R. Gast, M. A. Kirick, D. A.Larson, and J. C. Meiske. 1984. Influence of monensin on the performance of cattle. J. Anim. Sci. 58:1484–1498. doi:10.2527/jas1984.5861484x
Kunkle, W. E., J. T. Johns, M. H. Poore, and D. B. Herd. 2000. Designing supplementation programs for beef cattle fed forage-based diets. J. of Ani. Sci. 77(Suppl E):1–11.
Laarman, A. H., T. Sugino, and M. Oba. 2012. Effects of starch content of calf starter on growth and rumen pH in holstein calves during the weaning transition. J. Dairy Sci. 95:4478–4487. doi:10.3168/jds.2011-4822
Oba, M., and M. S. Allen. 2003. Intraruminal infusion of propionate alters feeding behavior and decreases energy intake of lactating dairy cows. J. Nutr. 133:1094–1099. doi:10.1093/jn/133.4.1094
Rai, V., B. Yadav, and G. P. Lakhani. 2013. Applications of probiotic and prebiotic in animals production: a review. Environ. Ecol. 31:873–876.
Troxel, T. R. 2012. Natural and organic beef. Univ. AR Coop Ext Bulletin FSA3103. [accessed Mar 2, 2018]. https:// www.uaex.edu/publications/PDF/FSA-3103.pdf.
Uyeno, Y., S. Shigemori, and T. Shimosato. 2015. Effect of probiotics/prebiotics on cattle health and productivity. Microbes Environ. 30:126–132. doi:10.1264/jsme2.ME14176
Vogel, G. J., S. B. Laudert, and Elanco Animal Health. 2015. Troubleshooting poor ration uniformity in feedlot rations. Tech Talk, Scientific Update from Elanco Ani. Health. [accessed on Feb 25, 2018]. https://assets. contentful.com/fistk1blxig0/AojLndzaCcUqi8UuUggS8/ 0c106ae82a065ffb373ae866a19ba8e6/usbburum00176_ rationuniformitytechtalk.pdf.
4 Hall et al. Translate basic science to industry innovation
4.5 4.10 4.15 4.20 4.25 4.30 4.35 4.40 4.45 4.50 4.55 4.60 4.64 4.70 4.75 4.80 4.85 4.90 4.95 4.100 4.105 4.110 4.115 4.120 4.125 4.129
Rumen Fermentation
Executive Summary
Impact of Excell on Rumen Fermentation
Anne Laarman University of IdahoIn this study, the fermentation kinetics of Excell were analyzed using a batch culture. We used a dairy close-up ration (low starch) and a finishing beef ration (high starch) and supplemented the feeds with Excell at 0 (Control), 2.5, 5.0, and 10 cc/hd*day, and used Rumensin as a benchmark comparison. Excell improved butyrate production in low- and high-starch diets, and increased production of branched volatile fatty acids. Changes in fermentation were evident only after 12 h; in the first 12 h, fermentation profiles of Excell were similar to other treatments. These data indicate Excell positively impacts rumen fermentation in vitro, and shares similarities in fermentation outcomes with Rumensin.
Objective and Scope
Develop a technical dossier for Excell, starting with in vitro research to inform future in vivo research.
Pacer Technologies’ past research on Excell indicates potential for increasing fiber-digesting microbes, propionate-synthesizing microbes, and lactate-utilizing microbes. Pacer Technologies intends to perform research with Rumensin as a benchmark, to examine the potential for Excell as a viable alternative to Rumensin.
Materials & Methods
In vitro: Dry ration (low starch, high fiber) and beef finishing (high starch, low fiber) were ground and placed in nylon bags and fermented at 102oF in buffered rumen contents without additives, with Excell (2.5, 5, or 10 cc/hd/d), or with Rumensin. Samples were fermented for 0, 1, 2, 4, 8, 12, and 24 hours.
Total samples: 7 timepoints × 5 treatments × 2 diets × 2 replicates × 5 runs = 700 samples
Variables measured:
- Dry matter disappearance/digestibility
- Gas production
- VFA profile/production
- Lactate production
1) Dry matter digestibility was calculated as follows:
2) Gas production was calculated:
1
%�������������������������� = �������������������������������������������� ���������������������������� ∗100%
��������������������������(����)=��������������������������������������×������������������������×0.068004084
Impact of Excell on Rumen Fermentation
Anne LaarmanUniversity of Idaho
Where:
GasProduction = Total gas produced (mL)
VolumeHeadspace = Total volume of headspace in fermentation vial (mL)
Pressure = Pressure of gas at time point (PSI)
3)VFA production was measured by acidifying 1 mL of rumen fluid with 0.25 mL of 25% mphosphoric acid, followed by two 20-minute centrifugation cycles at 10 000 ×g. Samples were analyzed on an Agilent gas chromatograph, and resulting peaks integrated to determine VFA profile.
4)Rumen fluid was analyzed for lactate using a commercial kit (K-D/Late, MegaZyme Inc., Chicago, IL). Rumen fluid was centrifuged at 10 000 ×g for 10 minutes, and then analyzed for DLactate and L-Lactate on a spectrophotometer by measuring absorbance at 340 nm. Total lactate was analyzed, as well as D-Lactate and L-Lactate. The proportion of total lactate that is D-Lactate was also calculated.
Results
Digestibility, Gas Production, and Lactate
Digestibility was unaffected by Excell supplementation at all concentrations, as expected (Figure 1). Neither supplementation nor diet impacted digestibility.
Gas production was unaffected in the low starch diet. In the high starch diet, supplementation with 5 and 10 cc/hd*day increased gas production at 12 h and 24 h (Figure 1).
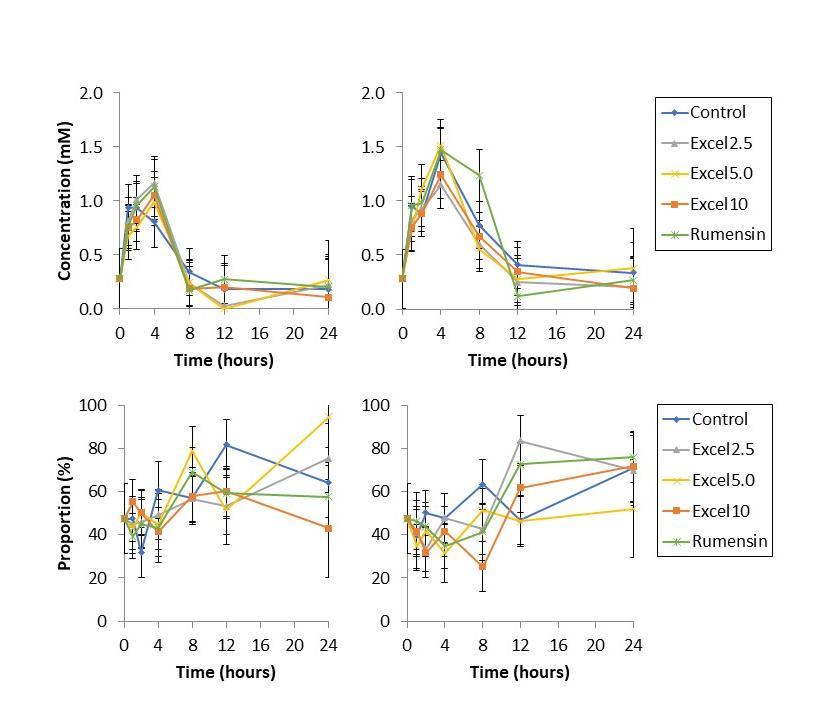
Lactate production was unaffected by Excell supplementation. The relative abundance of DLactate compared to total lactate was unaffected by Excell supplementation (Figure 2).
VFA Profile
Major VFA (acetate, propionate, butyrate) were affected by Excell supplementation principally in the high starch diet (Tables 1 & 2; Figures 3 & 4). Acetate was unaffected by supplementation. Propionate was largely unaffected by diet: in high starch diets, propionate abundance decreased at 24 h compared to control and Rumensin diets. Changes in propionate abundance were not substantial enough to affect acetate:propionate ratio. Butyrate abundance did increase as a result of Excell supplementation. All levels of Excell supplementation increased butyrate proportion at 24 h, but not before.
Minor VFA (isobutyrate, valerate, isovalerate) were also affected by Excell supplementation in both low- and high-starch diets (Tables 1 & 2; Figure 5). In low starch diets, Excell supplementation at 5.0 and 10 cc/hd*day increased proportion of valerate and isovalerate; Excell supplementation at 2.5 cc/hd*day tended to increase isovalerate abundance. In high starch diet, Excell supplementation at 2.5 cc/hd*day increased isobutyrate, valerate, and isovalerate production. Excell supplementation at 5 cc/hd*day: increased isobutyrate compared to Rumensin, but not the control; increased valerate abundance compared to control
2
Impact of Excell on Rumen Fermentation
but not Rumensin; tended to increase isovalerate abundance compared to control and Rumensin (P < 0.10).
Discussion
Digestibility, Gas Production, and Lactate
Changes in the parameters of digestibility, gas production, and lactate are fairly minor, as expected. The only noticeable exception was gas production in fermentation of high starch diet supplemented with 10 cc/hd*day, although there was no concurrent change in digestibility. The implications, if any, of the increased gas production are difficult to deduce without complementary in vivo experimentation. Changes in microbial communities and their resulting effects on propionate production and lactate metabolism may take more than 24 h to take place, making such analysis more appropriate in an in vivo setting.
VFA Profile
Interestingly, Excell appears to have no substantial impact on fermentation kinetics in the first 12 h. Altogether, this is not surprising, as many Direct Fed Microbials and fermentation products must be fed consistently, at every feeding, to impact productivity (AlZahal et al., 2014a,b). In the first 12 hours post-inoculation, production of acetate, propionate, and butyrate appear to follow a similar trajectory.
After 12 hours, the impact of Excell becomes more clear. The decrease in propionate abundance can be explained by the increase in butyrate abundance. While the fermentation pattern shifts from propionate to butyrate between 12 and 24 h, acetate production appears relatively constant. The long-term fermentation pattern may impact propionate production, as first predicted, but that is not clear from these data. Importantly, a shift towards increased butyrate abundance holds much potential for improving rumen development and adaptation, as butyrate is well-established as a promoter of rumen development pre-weaning (Warner et al., 1956), improving VFA absorption capacity (Laarman et al., 2013a), and improving rumen barrier integrity (Baldwin et al., 2012; Laarman et al., 2013b). Thus, Excell is a candidate for a natural product to improve ruminal butyrate production.
In addition to the major VFA, Excell also impacts minor VFA production, specifically isobutyrate, isovalerate, and valerate. The increases observed in the high starch diet are consistent with animals rapidly adapted to a high grain diet (Chen et al., 2011). Isobutyrate and isovalerate are used in long chain fatty acid synthesis by some ruminal microbes such as Ruminococcus spp. (Allison et al., 1962). Increases in isobutyrate, valerate, and isovalerate may therefore also assist in the adaptation of the rumen to a highly fermentable diet, although in vivo testing is needed to draw more concrete conclusions.
Excell vs. Rumensin
In terms of fermentation kinetics, Excell has some similarities with Rumensin, namely an improved valerate and isovalerate production, and a similar propionate production trajectory
3
Anne Laarman University of Idaho
Impact of Excell on Rumen Fermentation
Anne Laarman
University of Idaho
for the first 12 h in both low- and high-starch diets. There are also several factors that differentiate Excell from Rumensin, namely that Excell increases butyrate and minor VFA production. The impact of Excell on fermentation kinetics is more pronounced on high starch diets than on low starch diets, so Excell may be impacting starch-digesting microbes more effectively. Differences between Excell and Rumensin are to be expected, given that Excell is a fermentation product and Rumensin an ionophore. The impact of Excell on branched short chain fatty acids may lead to an understanding of how Excell impacts rumen fermentation. Based on these data, Excell impacts rumen fermentation kinetics positively, though it is not an exact match for Rumensin.
References
Allison, M. J., M. P. Bryant, I. Katz, and M. Keeney. 1962. Metabolic function of branched-chain volatile fatty acids, growth factors for Ruminococci II: Biosynthesis of higher branchedchain fatty acids and aldehydes. J. Bacteriol. 83(5):1084-1093.
AlZahal, O., L. Dionissopoulos, A. H. Laarman, N. Walker, and B. W. McBride. 2014a. Active dry Saccharomyces cerevisiae can alleviate the effect of subacute ruminal acidosis in lactating dairy cows. J. Dairy Sci. 97(12):7751-7763.
AlZahal, O., H. McGill, A. Kleinberg, J. I. Holliday, I. K. Hindrichsen, T. F. Duffield, and B. W. McBride. 2014b. Use of a direct-fed microbial product as a supplement during the transition period in dairy cattle. J. Dairy Sci. 97(11):7102-7114.
Baldwin, R. L. V., S. Wu, W. Li, C. Li, B. J. Bequette, and R. W. Li. 2012. Quantification of transcriptome responses of the rumen epithelium to butyrate infusion using RNA-seq technology. Gene Regul. Syst. Bio. 6:67-80.
Chen, Y., G. B. Penner, M. Li, M. Oba, and L. L. Guan. 2011. Changes in bacterial diversity associated with epithelial tissue in the beef cow rumen during the transition to a highgrain diet. Appl. Environ. Microbiol. 77(16):5770-5781.
Laarman, A. H., L. Dionissopoulos, O. AlZahal, S. L. Greenwood, M. A. Steele, and B. W. McBride. 2013a. Butyrate and subacute ruminal acidosis affect abundance of membrane proteins involved with proton and short chain fatty acid transport in the rumen epithelium of dairy cows. Am. J. Anim. Vet. Sci. 8(4):220-229.
Laarman, A. H., L. Dionissopoulos, O. AlZahal, M. A. Steele, S. L. Greenwood, J. C. Matthews, and B. W. McBride. 2013b. Butyrate supplementation affects mRNA abundance of genes involved in glycolysis, oxidative phosphorylation and lipogenesis in the rumen epithelium of Holstein dairy cows. Am. J. Anim. Vet. Sci. 8(4):239-245.
Warner, R. G., W. P. Flatt, and J. K. Loosli. 1956. Ruminant nutrition, dietary factors influencing development of ruminant stomach. J. Agric. Food Chem. 4(9):788-792.
4
1Means within same row with differing superscripts are different (P < 0.05)
1Means within same row with differing superscripts are different (P < 0.05)
Impact of Excell on Rumen Fermentation Anne Laarman University of Idaho 5
1 Control Excell 2.5 Excell 5 Excell 10 Rumensin Digestibility (%) 51.4 ± 1.3 51.6 ± 1.3 50.9 ± 1.3 53.0 ± 1.3 49.8 ± 1.3 Gas Production (mL) 213.9 ± 10.9 207.1 ± 10.9 209.2 ± 10.9 209.7 ± 10.9 209.4 ± 10.9 Lactate (mM) 0.18 ± 0.28 0.22 ± 0.28 0.27 ± 0.36 0.11 ± 0.36 0.21 ± 0.28 Acetate (%) 35.0 ± 0.5 34.3 ± 0.7 34.1 ± 0.5 34.4 ± 0.5 34.4 ± 0.5 Propionate (%) 27.6 ± 0.6 26.9 ± 0.8 25.8 ± 0.8 25.1 ± 0.6 27.2 ± 0.6 A:P Ratio 1.26 ± 0.07 1.27 ± 0.10 1.31 ± 0.07 1.36 ± 0.07 1.26 ± 0.07 Butyrate (%) 20.3 ± 0.6a 21.4 ± 0.7b 21.8 ± 0.6b 22.0 ± 0.6b 19.9 ± 0.6a Isobutyrate (%) 2.61 ± 0.05 2.64 ± 0.07 2.68 ± 0.05 2.69 ± 0.05 2.73 ± 0.05 Valerate (%) 7.76 ± 0.43a 7.76 ± 0.47a 8.28 ± 0.43b 8.36 ± 0.43b 8.41 ± 0.43a Isovalerate (%) 6.17 ± 0.25a 6.34 ± 0.28ab 6.57 ± 0.25b 6.56 ± 0.25b 6.62 ± 0.25b
Table 1. In vitro fermentation at 24 h of low starch
diet
Control Excell 2.5 Excell 5 Excell 10 Rumensin Digestibility (%) 60.1 ± 1.3 59.9 ± 1.3 58.2 ± 1.3 56.3 ± 1.3 58.8 ± 1.3 Gas Production (mL) 188.3 ± 10.9a 212.9 ± 10.9ab 224.3 ± 10.9b 226.6 ± 10.9b 191.2 ± 11.5a Lactate (mM) 0.33 ± 0.28 0.20 ± 0.28 0.38 ± 0.36 0.19 ± 0.28 0.27 ± 0.28 Acetate (%) 28.1 ± 0.5 29.3 ± 0.5 28.4 ± 0.5 29.9 ± 0.5 27.8 ± 0.5 Propionate (%) 36.6 ± 0.6a 32.2 ± 0.6b 32.5 ± 0.6b 30.3 ± 0.6b 36.5 ± 0.6a A:P Ratio 0.78 ± 0.07 0.92 ± 0.07 0.88 ± 0.07 0.99 ± 0.07 0.77 ± 0.07 Butyrate (%) 20.8 ± 0.6a 23.0 ± 0.6b 23.7 ± 0.6b 23.5 ± 0.6b 20.3 ± 0.6a Isobutyrate (%) 2.05 ± 0.05ab 2.18 ± 0.05c 2.13 ± 0.05b 2.25 ± 0.05c 2.00 ± 0.05a Valerate (%) 4.08 ± 0.47a 7.34 ± 0.43b 7.33 ± 0.43b 7.73 ± 0.43b 7.97 ± 0.43b Isovalerate (%) 5.00 ± 0.25a 5.37 ± 0.25b 5.30 ± 0.25ab 5.60 ± 0.25b 5.03 ± 0.25a
Table 2. In vitro fermentation at 24 h of high starch diet1
Impact of Excell on Rumen Fermentation
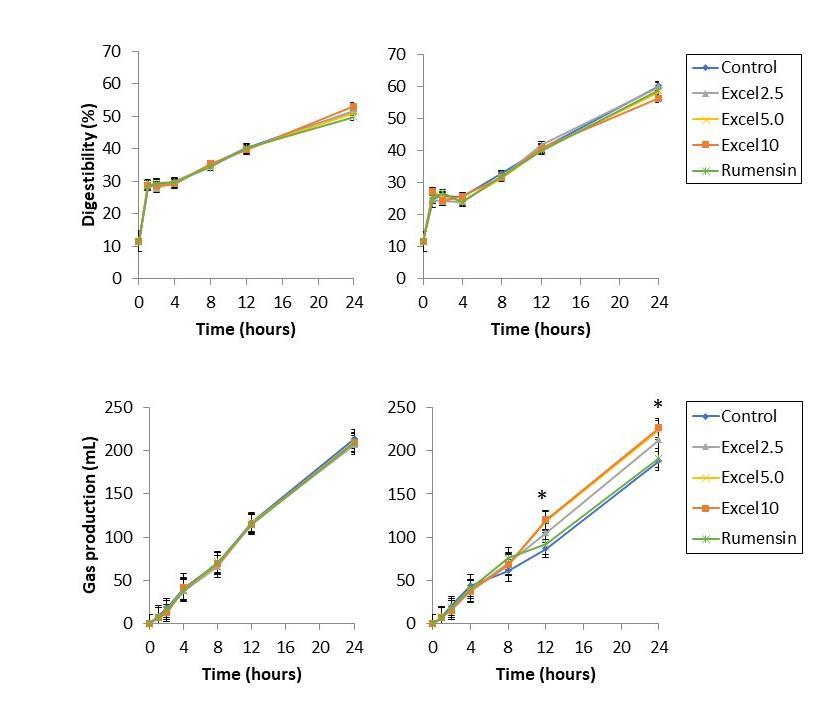
Digestibility was unaffected by Excell supplementation. Gas production was increased at 12 h and 24 h for Excell treatments at 5 and 10 cc/hd*day, and tended to increase gas production at 2.5 cc/hd*day.
6
Anne Laarman University of Idaho
Figure 1. Digestibility (top) and gas production (bottom) of low-starch diet (left) and high-starch diet (right) fermented in vitro for 24 h. *indicates a significant difference from control.
Impact of Excell on Rumen Fermentation
Lactate
and D-Lactate as a percentage
diet
total
diet
fermented in vitro for 24 h. Lactate exists as L-Lactate and DLactate; D-Lactate build-up is associated with metabolic acidosis in ruminants. Excell supplementation did not impact lactate production nor did it impact the proportion of D-lactate.
7
Anne Laarman University of Idaho
Figure 2.
(top)
of
lactate (bottom) of low-starch
(left) and high-starch
(right)
Impact of Excell on Rumen Fermentation
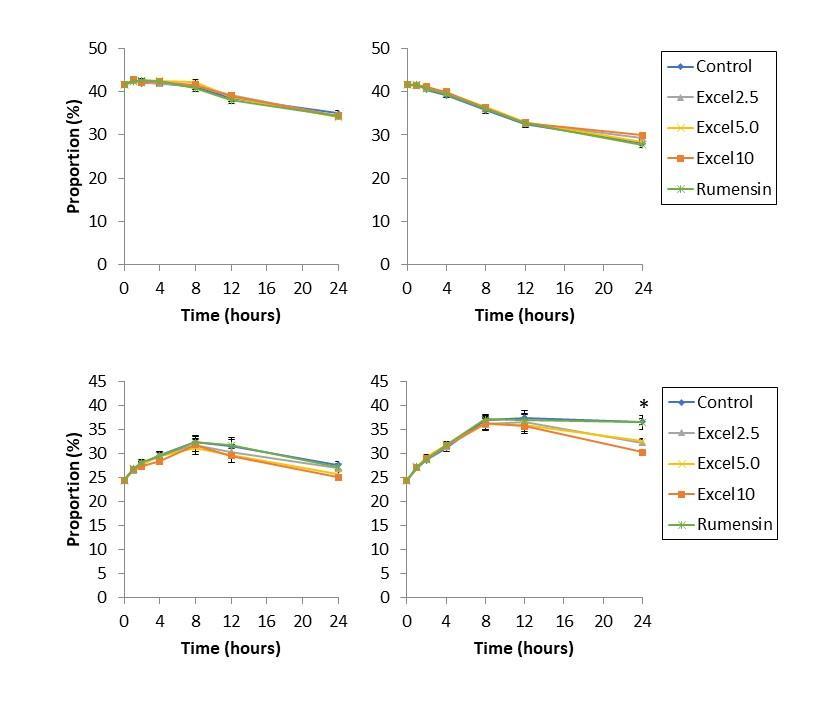
Figure 3. Acetate (top) and propionate (bottom) abundance, as a proportion of total volatile fatty acids, resulting from fermentation of low-starch diet (left) and high-starch diet (right) in vitro for 24 h. Acetate production was unaffected by Excell supplementation. Propionate production was unaffected by Excell for the first 12 h. At 24 h, Excell supplementation at 2.5, 5.0, and 10 cc/hd*day decreased the proportion of propionate.
8
Anne Laarman University of Idaho
Impact of Excell on Rumen Fermentation
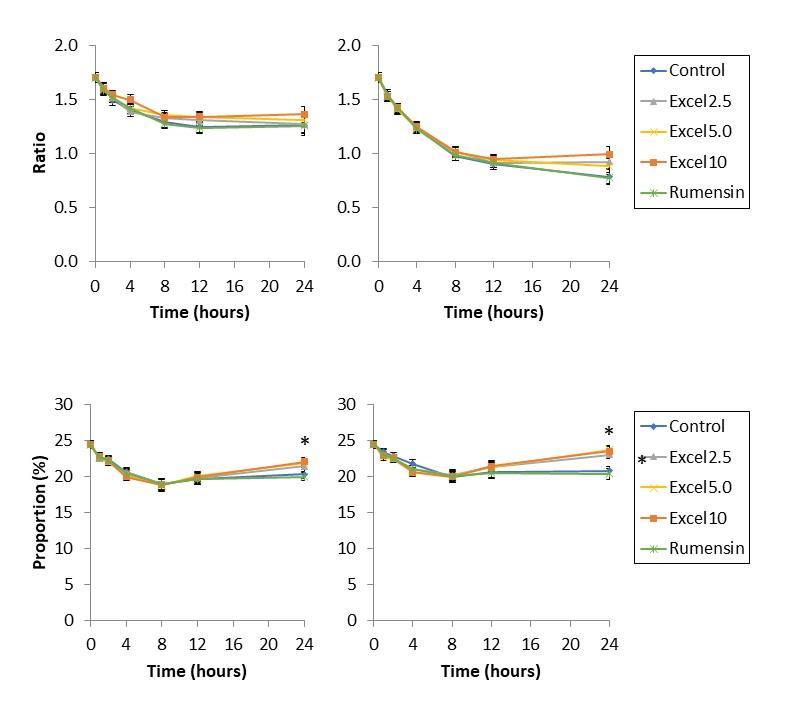
Figure 4. Acetate:propionate ratio (top) and butyrate abundance, as a proportion of total volatile fatty acids (bottom), resulting from fermentation of low-starch diet (left) and highstarch diet (right) in vitro for 24 h. Acetate:propionate ratio was unaffected by Excell supplementation at both low- and high-starch diets. Butyrate abundance increased at 24 h in both low- and high-starch diets for all levels of Excell supplementation.
9
Anne Laarman University of Idaho
Impact of Excell on Rumen Fermentation
Anne Laarman University of Idaho
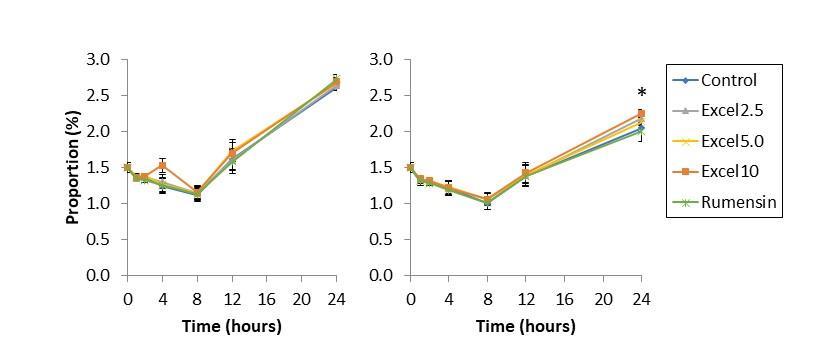
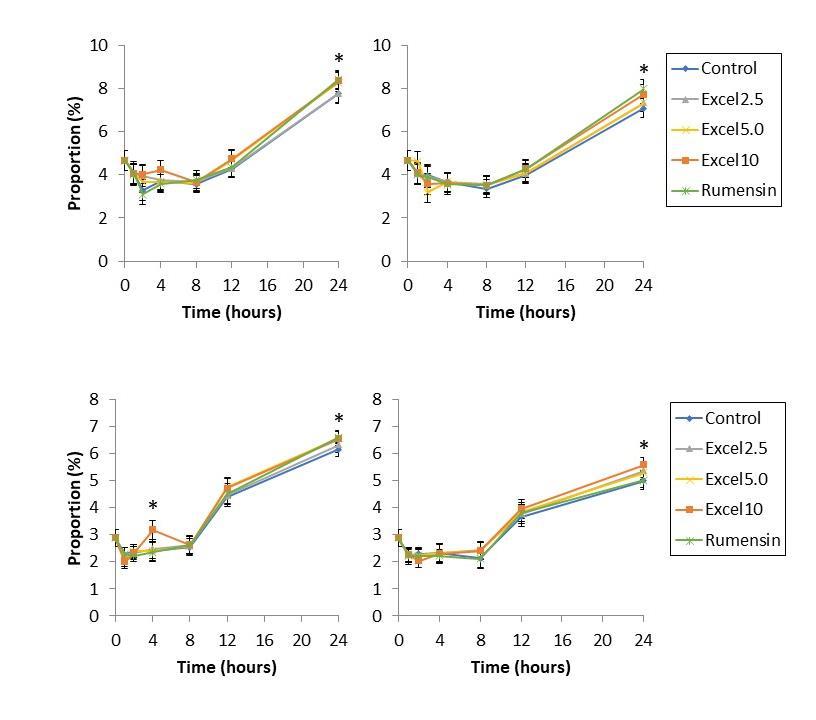
Figure 5. Isobutyrate (top), valerate (middle), and isovalerate (bottom) abundance, as a proportion of total volatile fatty acids, resulting from fermentation of low-starch diet (left) and high-starch diet (right) in vitro for 24 h. In low starch diets, Excell supplementation at 5.0 and 10 cc/hd*day increased proportion of isobutyrate, valerate, and isovalerate. In high starch diet, Excell supplementation at 2.5, 5.0, and 10 cc/hd*day increased isobutyrate, valerate, and isovalerate production.
10
VFA Study
1 SE = Standard Error, Trt = Treatment, Rep = Replicate, T*R = Treatment*Replicate, CH4 = Methane, H2 = Hydrogen, NH3 = Ammonia, DM = Dry Matter
2 Raw values were measured in the in-vitro bottles after 24 hours of incubation whereas production values are the values measured 24 hours after incubation minus the endogenous production measured in the negative control (i.e., no substrate) bottles
a,b Means that differ (P ≤ 0.05) are indicated by differing superscripts
Trait2 Treatment Means SE Trt P-value Rep P-value T*R P-value Control Monensin RumaCell CH4 Concentration, mM 6.59a 4.12b 5.63ab 0.833 0.03 < 0.01 0.41 H2 Concentration, mM 0.25 0.21 0.22 0.076 0.18 < 0.01 0.66 pH 6.22 6.14 6.12 0.050 0.77 < 0.01 0.81 Raw NH3, mg/L 758 674 738 31.7 0.24 < 0.01 0.18 NH3 Production, mg/L 230 147 210 31.7 0.24 0.75 0.18 DM Disappearance, % 49.97 48.68 51.15 0.854 0.42 < 0.01 0.37
Table 1. Effects of Monensin and RumaCell (5 g/hd/d) on rumen fermentation characteristics1
Difference of Treatment Levels Difference of Means SE of Difference Individual 95% CI T-Value P-Value Monensin - Control -2.47 1.18 (-4.89, -0.06) -2.10 0.045 RumaCell 5 - Control -0.95 1.18 (-3.37, 1.46) -0.81 0.425 RumaCell 5 - Monensin 1.52 1.18 (-0.90, 3.93) 1.29 0.209
Fisher Individual Tests for Differences of Means – CH4 Concentration
1 SE = Standard Error, Trt = Treatment, Rep = Replicate, T*R = Treatment*Replicate, A:P = Acetate:Propionate, VFA = Volatile Fatty Acid
2 Raw values were measured in the in-vitro bottles after 24 hours of incubation whereas production values are the values measured 24 hours after incubation minus the endogenous production measured in the negative control (i.e., no substrate) bottles
a,b Means that differ (P ≤ 0.05) are indicated by differing superscripts
Trait2 Treatment Means SE Trt P-value Rep P-value T*R P-value Control Monensin RumaCell Raw Acetate, mM 36.10 34.71 36.92 0.838 0.14 < 0.01 0.72 Acetate Production, mM 27.54 26.15 28.36 0.838 0.14 < 0.01 0.72 Raw Propionate, mM 18.70b 20.88a 19.15b 0.562 0.03 0.34 0.43 Propionate Production, mM 16.81b 18.98a 17.25b 0.562 0.03 0.94 0.43 Raw Isobutyrate, mM 0.63 0.56 0.63 0.024 0.10 < 0.01 0.47 Isobutyrate Production, mM 0.32 0.25 0.32 0.024 0.10 0.09 0.47 Raw Butyrate, mM 14.02a 10.55b 14.56a 0.419 < 0.01 0.15 0.36 Butyrate Production, mM 11.23a 7.76b 11.76a 0.419 < 0.01 0.28 0.36 Raw Isovalerate, mM 1.26 1.08 1.23 0.065 0.26 < 0.01 0.35 Isovalerate Production, mM 0.52 0.33 0.48 0.065 0.26 0.04 0.35 Raw Valerate, mM 1.55b 1.83a 1.64b 0.062 0.02 < 0.01 0.99 Valerate Production, mM 1.19b 1.47a 1.28b 0.062 0.02 < 0.01 0.99 Raw A:P 1.94a 1.66b 1.93a 0.036 < 0.01 < 0.01 < 0.01 A:P Production 1.65a 1.38b 1.64a 0.036 < 0.01 < 0.01 < 0.01 Raw Total VFA, mM 72.39 69.70 74.23 1.815 0.27 < 0.01 0.87 Total VFA Production, mM 57.71 55.02 59.55 1.815 0.27 0.35 0.87
Table 2. Effects of Monensin and RumaCell (5 g/hd/d) on rumen volatile fatty acid concentrations1
Difference of Treatment Levels Difference of Means SE of Difference Individual 95% CI T-Value P-Value Monensin - Control 2.171 0.795 (0.542, 3.800) 2.73 0.011 RumaCell 5 - Control 0.442 0.795 (-1.187, 2.071) 0.56 0.583 RumaCell 5 - Monensin -1.729 0.795 (-3.358, -0.100) -2.17 0.038
Fisher Individual Tests for Differences of Means – Raw Propionate, mM
Difference of Treatment Levels Difference of Means SE of Difference Individual 95% CI T-Value P-Value Monensin - Control 2.171 0.795 (0.542, 3.800) 2.73 0.011 RumaCell 5 - Control 0.442 0.795 (-1.187, 2.071) 0.56 0.583 RumaCell 5 - Monensin -1.729 0.795 (-3.358, -0.100) -2.17 0.038
Fisher Individual Tests for Differences of Means – Propionate Production, mM
Difference of Treatment Levels Difference of Means SE of Difference Individual 95% CI T-Value P-Value Monensin - Control -3.475 0.593 (-4.690, -2.261) -5.86 0.000 RumaCell 5 - Control 0.532 0.593 (-0.682, 1.747) 0.90 0.377 RumaCell 5 - Monensin 4.008 0.593 (2.793, 5.223) 6.76 0.000
Fisher Individual Tests for Differences of Means – Raw Butyrate, mM
Difference of Treatment Levels Difference of Means SE of Difference Individual 95% CI T-Value P-Value Monensin - Control -3.475 0.593 (-4.690, -2.261) -5.86 0.000 RumaCell 5 - Control 0.532 0.593 (-0.682, 1.747) 0.90 0.377 RumaCell 5 - Monensin 4.008 0.593 (2.793, 5.223) 6.76 0.000
Fisher Individual Tests for Differences of Means – Butyrate Production, mM
Difference of Treatment Levels Difference of Means SE of Difference Individual 95% CI T-Value P-Value Monensin - Control 0.2807 0.0880 (0.1005, 0.4609) 3.19 0.003 RumaCell 5 - Control 0.0907 0.0880 (-0.0895, 0.2709) 1.03 0.311 RumaCell 5 - Monensin -0.1900 0.0880 (-0.3702, -0.0098) -2.16 0.040
Individual Tests for Differences of Means – Valerate Production, mM Difference of Treatment Levels Difference of Means SE of Difference Individual 95% CI T-Value P-Value Monensin - Control 0.2807 0.0880 (0.1005, 0.4609) 3.19 0.003 RumaCell 5 - Control 0.0907 0.0880 (-0.0895, 0.2709) 1.03 0.311 RumaCell 5 - Monensin -0.1900 0.0880 (-0.3702, -0.0098) -2.16 0.040
Fisher Individual Tests for Differences of Means – Raw Valerate, mM
Fisher
Difference of Treatment Levels Difference of Means SE of Difference Individual 95% CI T-Value P-Value Monensin - Control -0.2760 0.0503 (-0.3791, -0.1730) -5.49 0.000 RumaCell 5 - Control -0.0136 0.0503 (-0.1167, 0.0895) -0.27 0.789 RumaCell 5 - Monensin 0.2624 0.0503 (0.1594, 0.3655) 5.22 0.000 Fisher Individual Tests for Differences of Means – A:P Production Difference of Treatment Levels Difference of Means SE of Difference Individual 95% CI T-Value P-Value Monensin - Control -0.2679 0.0505 (-0.3713, -0.1646) -5.31 0.000 RumaCell 5 - Control -0.0047 0.0505 (-0.1080, 0.0987) -0.09 0.927 RumaCell 5 - Monensin 0.2633 0.0505 (0.1599, 0.3666) 5.22 0.000
Fisher Individual Tests for Differences of Means – Raw A:P
1 SE = Standard Error, Trt = Treatment, Rep = Replicate, T*R = Treatment*Replicate
2 Raw values were measured in the in-vitro bottles after 24 hours of incubation whereas production values are the values measured 24 hours after incubation minus the endogenous production measured in the negative control (i.e., no substrate) bottles
a,b,c Means that differ (P ≤ 0.05) are indicated by differing superscripts
Trait2 Treatment Means SE Trt P-value Rep P-value T*R P-value Control Monensin RumaCell Raw Acetate, % 49.78 49.73 49.62 0.261 0.79 < 0.01 0.12 Acetate Production, % 47.71 47.51 47.57 0.312 0.62 < 0.01 0.06 Raw Propionate, % 25.91b 29.93a 25.86b 0.366 < 0.01 < 0.01 < 0.01 Propionate Production, % 29.15b 34.50a 29.01b 0.476 < 0.01 0.17 < 0.01 Raw Isobutyrate, % 0.86a 0.80b 0.84ab 0.017 0.03 < 0.01 0.18 Isobutyrate Production, % 0.54a 0.44b 0.53a 0.028 0.04 0.06 0.30 Raw Butyrate, % 19.37b 15.16c 19.61ab 0.221 < 0.01 < 0.01 0.02 Butyrate Production, % 19.45b 14.09c 19.73ab 0.271 < 0.01 0.45 0.01 Raw Isovalerate, % 1.74 1.54 1.65 0.058 0.22 0.01 0.17 Isovalerate Production, % 0.89 0.59 0.80 0.091 0.21 < 0.01 0.26 Raw Valerate, % 2.17bc 2.69a 2.27b 0.052 < 0.01 < 0.01 0.27 Valerate Production, % 2.07bc 2.71a 2.19b 0.064 < 0.01 < 0.01 0.34
Table 3. Effects of Monensin and RumaCell (5 g/hd/d) on rumen volatile fatty acid proportions1
Difference of Treatment Levels Difference of Means SE of Difference Individual 95% CI T-Value P-Value Monensin - Control 4.016 0.518 (2.955, 5.076) 7.75 0.000 RumaCell 5 - Control -0.051 0.518 (-1.111, 1.010) -0.10 0.923 RumaCell 5 - Monensin -4.066 0.518 (-5.127, -3.005) -7.85 0.000
Fisher Individual Tests for Differences of Means – Raw Propionate, %
Difference of Treatment Levels Difference of Means SE of Difference Individual 95% CI T-Value P-Value Monensin - Control 5.349 0.673 (3.970, 6.728) 7.95 0.000 RumaCell 5 - Control -0.141 0.673 (-1.520, 1.238) -0.21 0.835 RumaCell 5 - Monensin -5.490 0.673 (-6.869, -4.111) -8.16 0.000
Fisher Individual Tests for Differences of Means – Propionate Production, %
Difference of Treatment Levels Difference of Means SE of Difference Individual 95% CI T-Value P-Value Monensin - Control -0.0644 0.0245 (-0.1145, -0.0143) -2.63 0.014 RumaCell 5 - Control -0.0203 0.0245 (-0.0704, 0.0298) -0.83 0.413 RumaCell 5 - Monensin 0.0441 0.0245 (-0.0060, 0.0942) 1.80 0.082
Fisher Individual Tests for Differences of Means – Raw Isobutyrate, %
Difference of Treatment Levels Difference of Means SE of Difference Individual 95% CI T-Value P-Value Monensin - Control -0.1010 0.0395 (-0.1820, -0.0200) -2.56 0.016 RumaCell 5 - Control -0.0164 0.0395 (-0.0974, 0.0646) -0.42 0.681 RumaCell 5 - Monensin 0.0846 0.0395 (0.0036, 0.1656) 2.14 0.041
Fisher Individual Tests for Differences of Means – Isobutyrate Production,
%
Difference of Treatment Levels Difference of Means SE of Difference Individual 95% CI T-Value P-Value Monensin - Control -4.203 0.313 (-4.844, -3.561) -13.42 0.000 RumaCell 5 - Control 0.245 0.313 (-0.397, 0.886) 0.78 0.441 RumaCell 5 - Monensin 4.447 0.313 (3.806, 5.089) 14.20 0.000
Fisher Individual Tests for Differences of Means – Raw Butyrate, %
Difference of Treatment Levels Difference of Means SE of Difference Individual 95% CI T-Value P-Value Monensin - Control -5.366 0.384 (-6.152, -4.580) -13.99 0.000 RumaCell 5 - Control 0.280 0.384 (-0.505, 1.066) 0.73 0.471 RumaCell 5 - Monensin 5.646 0.384 (4.861, 6.432) 14.72 0.000
Fisher Individual Tests for Differences of Means – Butyrate Production, %
Difference of Treatment Levels Difference of Means SE of Difference Individual 95% CI T-Value P-Value Monensin - Control 0.5129 0.0735 (0.3623, 0.6635) 6.98 0.000 RumaCell 5 - Control 0.0942 0.0735 (-0.0564, 0.2448) 1.28 0.211 RumaCell 5 - Monensin -0.4187 0.0735 (-0.5693, -0.2681) -5.69 0.000
Fisher Individual Tests for Differences of Means – Raw Valerate, %
Difference of Treatment Levels Difference of Means SE of Difference Individual 95% CI T-Value P-Value Monensin - Control 0.6437 0.0900 (0.4593, 0.8280) 7.15 0.000 RumaCell 5 - Control 0.1210 0.0900 (-0.0633, 0.3053) 1.34 0.190 RumaCell 5 - Monensin -0.5227 0.0900 (-0.7070, -0.3383) -5.81 0.000
Fisher Individual Tests for Differences of Means – Valerate Production, %
1 SE = Standard Error, Trt = Treatment, Rep = Replicate, T*R = Treatment*Replicate, CH4 = Methane, H2 = Hydrogen, NH3 = Ammonia, DM = Dry Matter
2 Raw values were measured in the in-vitro bottles after 24 hr of incubation whereas production values are the values measured 24 hr after incubation minus the endogenous production measured in the negative control (i.e., no substrate) bottles
a,b,c Means that differ (P ≤ 0.05) are indicated by differing superscripts
Fisher Individual Tests for Differences of Means – CH4 Concentration
Trait2 Treatment Means SE Trt P-value Rep P-value T*R P-value Control Monensin RumaCell (5 g/hd/d) RumaCell (10 g/hd/d) CH4 Concentration, mM 6.59ab 4.12c 5.64bc 7.93a 0.638 < 0.01 0.10 0.10 H2 Concentration, mM 0.25 0.21 0.22 0.41 0.067 0.16 < 0.01 0.66 pH 6.22 6.14 6.12 6.14 0.051 0.50 < 0.01 0.60 Raw NH3, mg/L 758 674 738 718 31.4 0.31 < 0.01 0.11 NH3 Production, mg/L 230 147 210 190 31.4 0.31 0.95 0.11 DM Disappearance, % 49.97 48.68 51.15 50.56 0.848 0.24 < 0.01 0.13
Table 4. Effects of Monensin and RumaCell on rumen fermentation characteristics
1
Difference of Treatment Levels Difference of Means SE of Difference Individual 95% CI T-Value P-Value Monensin - Control -2.471 0.902 (-4.382, -0.559) -2.74 0.015 RumaCell 10 - Control 1.345 0.902 (-0.567, 3.256) 1.49 0.155 RumaCell 5 - Control -0.954 0.902 (-2.865, 0.958) -1.06 0.306 RumaCell 10 - Monensin 3.815 0.902 (1.904, 5.727) 4.23 0.001 RumaCell 5 - Monensin 1.517 0.902 (-0.395, 3.429) 1.68 0.112 RumaCell 5 - RumaCell 10 -2.299 0.902 (-4.210, -0.387) -2.55 0.021
1 SE = Standard Error, Trt = Treatment, Rep = Replicate, T*R = Treatment*Replicate, A:P = Acetate:Propionate, VFA = Volatile Fatty Acid
2 Raw values were measured in the in-vitro bottles after 24 hours of incubation whereas production values are the values measured 24 hours after incubation minus the endogenous production measured in the negative control (i.e., no substrate) bottles
a,b Means that differ (P ≤ 0.05) are indicated by differing superscripts
Trait2 Treatment Means SE Trt P-value Rep P-value T*R P-value Control Monensin RumaCell (5 g/hd/d) RumaCell (10 g/hd/d) Raw Acetate, mM 36.10 34.71 36.92 34.94 0.915 0.32 < 0.01 0.91 Acetate Production, mM 27.54 26.15 28.36 26.38 0.915 0.32 < 0.01 0.91 Raw Propionate, mM 18.70b 20.88a 19.15b 18.60b 0.571 0.04 0.19 0.17 Propionate Production, mM 16.81b 18.98a 17.25b 16.70b 0.571 0.04 0.49 0.17 Raw Isobutyrate, mM 0.63 0.56 0.63 0.59 0.024 0.18 < 0.01 0.82 Isobutyrate Production, mM 0.32 0.25 0.32 0.28 0.024 0.18 0.06 0.82 Raw Butyrate, mM 14.02a 10.55b 14.56a 13.70a 0.329 < 0.01 0.01 0.59 Butyrate Production, mM 11.23a 7.76b 11.76a 10.91a 0.329 < 0.01 0.02 0.59 Raw Isovalerate, mM 1.26 1.08 1.23 1.13 0.058 0.13 < 0.01 0.34 Isovalerate Production, mM 0.52 0.33 0.48 0.39 0.058 0.13 0.24 0.34 Raw Valerate, mM 1.55b 1.83a 1.64ab 1.57b 0.068 0.04 < 0.01 0.83 Valerate Production, mM 1.19b 1.47a 1.28ab 1.21b 0.068 0.04 < 0.01 0.83 Raw A:P 1.94a 1.66b 1.93a 1.88a 0.027 < 0.01 < 0.01 < 0.01 A:P Production 1.65a 1.38b 1.64a 1.58a 0.028 < 0.01 < 0.01 < 0.01 Raw Total VFA, mM 72.39 69.70 74.23 70.66 1.798 0.33 < 0.01 0.93 Total VFA Production, mM 57.71 55.02 59.55 55.97 1.798 0.33 0.11 0.93
Table 5. Effects of Monensin and RumaCell on rumen volatile fatty acid concentrations1
Difference of Treatment Levels Difference of Means SE of Difference Individual 95% CI T-Value P-Value Monensin - Control 2.171 0.808 (0.459, 3.883) 2.69 0.016 RumaCell 10 - Control -0.106 0.808 (-1.818, 1.606) -0.13 0.897 RumaCell 5 - Control 0.442 0.808 (-1.270, 2.154) 0.55 0.592 RumaCell 10 - Monensin -2.277 0.808 (-3.989, -0.565) -2.82 0.012 RumaCell 5 - Monensin -1.729 0.808 (-3.442, -0.017) -2.14 0.048 RumaCell 5 - RumaCell 10 0.547 0.808 (-1.165, 2.260) 0.68 0.508
Fisher Individual Tests for Differences of Means – Raw Propionate, mM
Difference of Treatment Levels Difference of Means SE of Difference Individual 95% CI T-Value P-Value Monensin - Control 2.171 0.808 (0.459, 3.883) 2.69 0.016 RumaCell 10 - Control -0.106 0.808 (-1.818, 1.606) -0.13 0.897 RumaCell 5 - Control 0.442 0.808 (-1.270, 2.154) 0.55 0.592 RumaCell 10 - Monensin -2.277 0.808 (-3.989, -0.565) -2.82 0.012 RumaCell 5 - Monensin -1.729 0.808 (-3.442, -0.017) -2.14 0.048 RumaCell 5 - RumaCell 10 0.547 0.808 (-1.165, 2.260) 0.68 0.508
Fisher Individual Tests for Differences of Means – Propionate Production, mM
Difference of Treatment Levels Difference of Means SE of Difference Individual 95% CI T-Value P-Value Monensin - Control -3.475 0.465 (-4.461, -2.490) -7.48 0.000 RumaCell 10 - Control -0.323 0.465 (-1.309, 0.662) -0.70 0.496 RumaCell 5 - Control 0.532 0.465 (-0.453, 1.518) 1.15 0.269 RumaCell 10 - Monensin 3.152 0.465 (2.167, 4.137) 6.78 0.000 RumaCell 5 - Monensin 4.008 0.465 (3.023, 4.993) 8.62 0.000 RumaCell 5 - RumaCell 10 0.856 0.465 (-0.129, 1.841) 1.84 0.084
Fisher Individual Tests for Differences of Means – Raw Butyrate, mM
Difference of Treatment Levels Difference of Means SE of Difference Individual 95% CI T-Value P-Value Monensin - Control -3.475 0.465 (-4.461, -2.490) -7.48 0.000 RumaCell 10 - Control -0.323 0.465 (-1.309, 0.662) -0.70 0.496 RumaCell 5 - Control 0.532 0.465 (-0.453, 1.518) 1.15 0.269 RumaCell 10 - Monensin 3.152 0.465 (2.167, 4.137) 6.78 0.000 RumaCell 5 - Monensin 4.008 0.465 (3.023, 4.993) 8.62 0.000 RumaCell 5 - RumaCell 10 0.856 0.465 (-0.129, 1.841) 1.84 0.084
Fisher Individual Tests for Differences of Means – Butyrate Production, mM
Difference of Treatment Levels Difference of Means SE of Difference Individual 95% CI T-Value P-Value Monensin - Control 0.2807 0.0962 (0.0767, 0.4847) 2.92 0.010 RumaCell 10 - Control 0.0170 0.0962 (-0.1870, 0.2210) 0.18 0.862 RumaCell 5 - Control 0.0907 0.0962 (-0.1133, 0.2947) 0.94 0.360 RumaCell 10 - Monensin -0.2637 0.0962 (-0.4677, -0.0597) -2.74 0.015 RumaCell 5 - Monensin -0.1900 0.0962 (-0.3940, 0.0140) -1.97 0.066 RumaCell 5 - RumaCell 10 0.0737 0.0962 (-0.1303, 0.2777) 0.77 0.455
Fisher Individual Tests for Differences of Means – Raw Valerate, mM
Difference of Treatment Levels Difference of Means SE of Difference Individual 95% CI T-Value P-Value Monensin - Control 0.2807 0.0962 (0.0767, 0.4847) 2.92 0.010 RumaCell 10 - Control 0.0170 0.0962 (-0.1870, 0.2210) 0.18 0.862 RumaCell 5 - Control 0.0907 0.0962 (-0.1133, 0.2947) 0.94 0.360 RumaCell 10 - Monensin -0.2637 0.0962 (-0.4677, -0.0597) -2.74 0.015 RumaCell 5 - Monensin -0.1900 0.0962 (-0.3940, 0.0140) -1.97 0.066 RumaCell 5 - RumaCell 10 0.0737 0.0962 (-0.1303, 0.2777) 0.77 0.455
Fisher Individual Tests for Differences of Means – Valerate Production, mM
Fisher Individual Tests for Differences of Means
–
Difference of Treatment Levels Difference of Means SE of Difference Individual 95% CI T-Value P-Value Monensin - Control -0.2760 0.0375 (-0.3556, -0.1965) -7.36 0.000 RumaCell 10 - Control -0.0635 0.0375 (-0.1431, 0.0160) -1.69 0.110 RumaCell 5 - Control -0.0136 0.0375 (-0.0931, 0.0660) -0.36 0.722 RumaCell 10 - Monensin 0.2125 0.0375 (0.1330, 0.2920) 5.66 0.000 RumaCell 5 - Monensin 0.2624 0.0375 (0.1829, 0.3420) 6.99 0.000 RumaCell 5 - RumaCell 10 0.0499 0.0375 (-0.0296, 0.1295) 1.33 0.202
Raw A:P
Difference of Treatment Levels Difference of Means SE of Difference Individual 95% CI T-Value P-Value Monensin - Control -0.2679 0.0388 (-0.3503, -0.1856) -6.90 0.000 RumaCell 10 - Control -0.0697 0.0388 (-0.1520, 0.0127) -1.79 0.092 RumaCell 5 - Control -0.0047 0.0388 (-0.0870, 0.0777) -0.12 0.906 RumaCell 10 - Monensin 0.1983 0.0388 (0.1159, 0.2806) 5.10 0.000 RumaCell 5 - Monensin 0.2633 0.0388 (0.1809, 0.3456) 6.78 0.000 RumaCell 5 - RumaCell 10 0.0650 0.0388 (-0.0173, 0.1474) 1.67 0.114
Fisher Individual Tests for Differences of Means – A:P Production
1 SE = Standard Error, Trt = Treatment, Rep = Replicate, T*R = Treatment*Replicate
2 Raw values were measured in the in-vitro bottles after 24 hours of incubation whereas production values are the values measured 24 hours after incubation minus the endogenous production measured in the negative control (i.e., no substrate) bottles
a,b Means that differ (P ≤ 0.05) are indicated by differing superscripts
Trait2 Treatment Means SE Trt P-value Rep P-value T*R P-value Control Monensin RumaCell (5 g/hd/d) RumaCell (10 g/hd/d) Raw Acetate, % 49.78 49.73 49.62 49.30 0.237 0.49 < 0.01 0.04 Production Acetate, % 47.71 47.51 47.57 47.04 0.312 0.47 < 0.01 0.04 Raw Propionate, % 25.91b 29.93a 25.86b 26.34b 0.321 < 0.01 < 0.01 < 0.01 Production Propionate, % 29.15b 34.50a 29.01b 29.83b 0.424 < 0.01 0.07 < 0.01 Raw Isobutyrate, % 0.86 0.80 0.84 0.84 0.019 0.16 < 0.01 0.24 Production Isobutyrate, % 0.54 0.44 0.53 0.50 0.030 0.12 0.09 0.50 Raw Butyrate, % 19.37a 15.16b 19.61a 19.45a 0.278 < 0.01 0.05 0.21 Production Butyrate, % 19.45a 14.09b 19.73a 19.54a 0.344 < 0.01 0.21 0.15 Raw Isovalerate, % 1.74 1.54 1.65 1.61 0.056 0.14 0.04 0.06 Production Isovalerate, % 0.89 0.59 0.80 0.70 0.086 0.11 0.06 0.17 Raw Valerate, % 2.17b 2.69a 2.27b 2.27b 0.064 < 0.01 < 0.01 0.49 Production Valerate, % 2.07b 2.71a 2.19b 2.19b 0.079 < 0.01 < 0.01 0.54
Table 6. Effects of Monensin and RumaCell on rumen volatile fatty acid proportions
1
Difference of Treatment Levels Difference of Means SE of Difference Individual 95% CI T-Value P-Value Monensin - Control 4.016 0.453 (3.054, 4.977) 8.86 0.000 RumaCell 10 - Control 0.426 0.453 (-0.535, 1.387) 0.94 0.362 RumaCell 5 - Control -0.051 0.453 (-1.012, 0.910) -0.11 0.912 RumaCell 10 - Monensin -3.590 0.453 (-4.551, -2.628) -7.92 0.000 RumaCell 5 - Monensin -4.066 0.453 (-5.027, -3.105) -8.97 0.000 RumaCell 5 - RumaCell 10 -0.477 0.453 (-1.438, 0.485) -1.05 0.309
Fisher Individual Tests for Differences of Means – Raw Propionate, %
Difference of Treatment Levels Difference of Means SE of Difference Individual 95% CI T-Value P-Value Monensin - Control 5.349 0.599 (4.079, 6.619) 8.93 0.000 RumaCell 10 - Control 0.672 0.599 (-0.599, 1.942) 1.12 0.279 RumaCell 5 - Control -0.141 0.599 (-1.412, 1.129) -0.24 0.817 RumaCell 10 - Monensin -4.677 0.599 (-5.948, -3.407) -7.80 0.000 RumaCell 5 - Monensin -5.490 0.599 (-6.761, -4.220) -9.16 0.000 RumaCell 5 - RumaCell 10 -0.813 0.599 (-2.083, 0.458) -1.36 0.194
Fisher Individual Tests for Differences of Means – Propionate Production, %
Difference of Treatment Levels Difference of Means SE of Difference Individual 95% CI T-Value P-Value Monensin - Control -4.203 0.393 (-5.035, -3.370) -10.70 0.000 RumaCell 10 - Control 0.087 0.393 (-0.746, 0.920) 0.22 0.828 RumaCell 5 - Control 0.245 0.393 (-0.588, 1.077) 0.62 0.542 RumaCell 10 - Monensin 4.290 0.393 (3.457, 5.122) 10.92 0.000 RumaCell 5 - Monensin 4.447 0.393 (3.614, 5.280) 11.32 0.000 RumaCell 5 - RumaCell 10 0.158 0.393 (-0.675, 0.990) 0.40 0.694
Fisher Individual Tests for Differences of Means – Raw Butyrate, %
Difference of Treatment Levels Difference of Means SE of Difference Individual 95% CI T-Value P-Value Monensin - Control -5.366 0.487 (-6.398, -4.334) -11.02 0.000 RumaCell 10 - Control 0.086 0.487 (-0.946, 1.118) 0.18 0.862 RumaCell 5 - Control 0.280 0.487 (-0.752, 1.313) 0.58 0.573 RumaCell 10 - Monensin 5.452 0.487 (4.420, 6.484) 11.20 0.000 RumaCell 5 - Monensin 5.646 0.487 (4.614, 6.679) 11.60 0.000 RumaCell 5 - RumaCell 10 0.195 0.487 (-0.838, 1.227) 0.40 0.695
Fisher Individual Tests for Differences of Means – Butyrate Production, %
Difference of Treatment Levels Difference of Means SE of Difference Individual 95% CI T-Value P-Value Monensin - Control 0.5129 0.0907 (0.3206, 0.7051) 5.65 0.000 RumaCell 10 - Control 0.0978 0.0907 (-0.0944, 0.2901) 1.08 0.297 RumaCell 5 - Control 0.0942 0.0907 (-0.0981, 0.2865) 1.04 0.314 RumaCell 10 - Monensin -0.4150 0.0907 (-0.6073, -0.2227) -4.58 0.000 RumaCell 5 - Monensin -0.4187 0.0907 (-0.6109, -0.2264) -4.62 0.000 RumaCell 5 - RumaCell 10 -0.0036 0.0907 (-0.1959, 0.1886) -0.04 0.968
Fisher Individual Tests for Differences of Means – Raw Valerate, %
Difference of Treatment Levels Difference of Means SE of Difference Individual 95% CI T-Value P-Value Monensin - Control 0.644 0.111 (0.407, 0.880) 5.78 0.000 RumaCell 10 - Control 0.122 0.111 (-0.114, 0.358) 1.09 0.290 RumaCell 5 - Control 0.121 0.111 (-0.115, 0.357) 1.09 0.294 RumaCell 10 - Monensin -0.522 0.111 (-0.758, -0.285) -4.68 0.000 RumaCell 5 - Monensin -0.523 0.111 (-0.759, -0.286) -4.69 0.000 RumaCell 5 - RumaCell 10 -0.001 0.111 (-0.237, 0.235) -0.01 0.993
Fisher Individual Tests for Differences of Means – Valerate Production, %
Butyrate PPS 2 Wean
WeanedHolsteincalvesfedan experimentalbotanicalextractaloneor incombinationwithaneubioticproduct
David P. Casper1,2*, Michael Officer3, and Keith Klanderman4
1Casper’s Calf Ranch, LLC, Freeport, IL
2North Carolina A&T University, Greensboro, NC
3Pacer Technology, Inc. Murtaugh, ID &

4Adisseo North America, Inc.


INTRODUCTION
•Growing Holstein calves can encounter a host of challenges during early growth when transitioning to dry feed.
•Botanical extracts (BE; garlic oil, anise oil, cinnamaldehyde, rosemary and thyme blend) have been shown to enhance dry matter intake and gut health.
•Eubiotics(EU; lactobacillus acidophilus fermentation product) has been show to improve gut health and growth performance.
•Combinations of these technologies could be additive, neutral or even antagonistic. Previous report of antagonism with essential oil and monensin (Wu et al., 2020).
HYPOTHESIS&OBJECTIVE(S)
•The combination of botanical extracts and eubioticscould be synergistic to post-weaning neonatal calf growth.
•Evaluate BE and EU alone and in combination on calf growth performance and feed conversions.
MATERIALS AND METHODS
•77 49 d old sale barn Holstein bull calves from the previous milk replacer study were blocked by body weight and randomly assigned to 1 of 4 treatments using a RCBD experimental design.
•Treatments:
•Control: Calf Starter (CS) without BE or EU added.
•BE: CS with 275.6 g/ton of an experimental BE (Adisseo)
•EU: CS with 0.22% EU (RumaCell, Pacer Technology) added
•BE&EU: CS with added BE and EU at same rates.
MATERIALS AND METHODS
•Calves remained housed in 4 x 8 Calf-Tel Hutches.
•Free choice water available at all times.
•22% CP calf starter (mini-pellet) fed free choice with amounts fed and orts recorded daily.
•No forage was fed but bedded with wheat straw
•Body weights collected weekly
•Frame measurements collected at 7 and 10 weeks.
•Heart girth, withers height, body length, hip height and hip width.
•All treatment and disease incidences were recorded.
STATISTICS
•All data were checked for normal distribution and outliers using the PROC UNIVARIATE procedure.
•All data were subjected to least squares ANOVA using PROC MIXED.
•Treatment, week and treatment by week.
•Block was considered random.
•Week was a repeated measurement having an autoregressive covariance structure.
•Initial body weight was tested as a covariate and found to be nonsignificant.
•All data are reported as Least Squares Means.
•Significance declared at P < 0.05 and trends at 0.05 ≤ P ≤ 0.10.
WeekTemperature,0CHumidity,%Windspeed,km/hTHI,0CRain,cm 1 23.168.79.870.90.19 222.961.79.270.00.00 325.064.19.173.20.00 Mean23.764.89.571.40.19
AVERAGE WEATHER DATA BY WEEK
THI = Temperature humidity index.
a,bMeanswith unlike superscripts differ, P < 0.05.
MeasurementControlBEEUBE&EUSE Calves,#19182020----Bodyweight Start,kg72.371.074.774.81.76 Final,kg92.791.796.895.61.76 Average,kg81.3b80.8b84.8a84.2ab1.68 Gain,kg20.3b20.7b22.1a20.8ab1.14 ADG,g/d965.5b984.3ab1052.8a989.1ab36.3
GROWTHPERFORMANCE
MeasurementControlBEEUBE&EUSE DMI,kg/d2.192.182.312.140.11 Gain/DMI,kg/kg0.450.460.450.450.02 BUN,mg/dL14.714.614.913.40.81
CALF STARTER INTAKE
MeasurementControlBEEUBE&EUSE Hipheightgain,cm4.143.714.484.320.53 Hipwidthgain,cm1.58b1.85b2.32a2.09ab0.21 Withersheightgain,cm4.474.544.704.600.47 Heartgirthgain,cm7.88b8.48b10.36a8.76ab0.83 Bodylengthgain,cm3.064.004.774.250.76
FRAME MEASUREMENTS
a,bMeanswith unlike superscripts differ, P < 0.05.
SUMMARY
Calves fed EU demonstrated greater body weights and body weight gains compared with calves fed Control and BE with calves fed the BE&EU combination being intermediate and similar.
Calves fed EU demonstrated greater average daily gains (i.e. growth performance) compared with calves fed Control with calves fed BE and BE&EU being intermediate and similar.
No differences were observed for dry matter intake and feed conversions.
Hip width and heart girth gains were greater for claves fed EU compared with calves fed Control and BE with calves fed BE&EU being intermediate and similar.
CONCLUSIONS
•Feeding a combination of BE and EU resulted in similar growth performance compared to feeding the products alone.
•Feeding a EU product offered significantly greater growth performance compared with calves fed the Control, i.e. no E.U.
Effect
of a Lactobacillus fermentation product on postweaning heifer performanceReproduction
Effect of a Lactobacillus fermentation product on postweaning heifer performance
John B. Hall,†,‡,1, Maggie R. Bloomsburg,‡ and Sandra A. Goddard†
†Nancy M. Cummings Research, Extension and Education Center, University of Idaho, Carmen, ID 83462, USA
‡Department of Animal, Veterinary, and Food Science, University of Idaho, Moscow, ID 83844, USA
1Corresponding author: jbhall@uidaho.edu
ABSTRACT
The objective of the experiment was to compare the effect of dietary inclusion of a prebiotic fermentation product of Lactobacillus acidophilus (LaP, RumaCell; 5 mL animal−1 d−1) or monensin on performance of replacement beef heifers. Heifers received a total mixed ration containing either LaP (n = 77) or monensin (MON; Rumensin; 200 mg animal−1 d−1; n = 79). Heifers were fed for 71 d in a GrowSafe unit, so individual feed intake could be measured. Heifers were weighed every 2 wk and feed efficiency calculated by residual feed intake (RFI). At the end of the RFI trial, heifers remained on their diets for an additional 27 d and were estrus synchronized using the 14-d CIDR + PG protocol and bred by artificial insemination (AI) followed by natural service. Prior to estrous synchronization, reproductive tract scores (RTS; 1 = infantile to 5 = cycling/ presence of corpus luteum) were measured. Continuous variables were analyzed using generalized mixed models, whereas categorical data were analyzed by logistic regression. Body weights, average daily gain, feed intake, and RFI value were similar (P > 0.30) among MON- and LaP-supplemented heifers. Across treatments, heifers gained 0.9 ± 0.1 kg/d while consuming 9.3 ± 0.5 kg of diets daily. Reproductive development as indicated by RTS was similar (P > 0.28) between treatments. However, estrus response increased (P < 0.01) and AI pregnancy rates tended to be greater (P < 0.07) for MON compared to LaP heifers. In contrast, the percentage of heifers pregnant by 60 and 100 d (80.4% and 90.5%, respectively) was not different (P > 0.33) for MON and LaP heifers. In conclusion, addition of LaP to replacement heifer diets may result in growth and reproductive performance similar to an ionophore, if dietary energy is adequate for normal heifer growth.
Key words: efficiency, heifer, ionophore, nutrition, prebiotic, reproduction
INTRODUCTION
Developing replacement heifers is a critical and expensive enterprise of the cow-calf operation. Nutrition during the postweaning development phase will impact heifer reproductive development as well as direct costs (Hall, 2013). Addition of ionophores to replacement heifer diets improves average daily gain (ADG) and may decrease age at puberty (Moseley et al, 1977; Moseley et al, 1982). However, the use of ionophores is not allowed in natural and organic programs (Troxel, 2012). Ionophores may also pose a toxicity risk to monogastric livestock such as horses (Blomme et al., 1999). Therefore, the use of alternative products that produce results similar to ionophores may be advantageous.
Prebiotics and probiotics may offer an alternative to ionophores in growing cattle diets. These feed additives alter rumen microflora populations and resulting fermentation products (Dhama et al., 2008; Rai et al., 2013). However, the impact on animal productivity by these products appears to be highly variable and, at least partially, dependent on the specific product and concentration (Uyeno et al., 2015; Markowiak and Slizewska, 2018).
Previously, we reported increased ADG and dry matter intake (DMI) in steers supplemented with a L. acidophilus prebiotic product (LaP; RumaCell, Pacer Technologies Inc., Murtaugh, ID) compared to steers supplemented with monensin (Hall et al., 2018). The experiment was a shortterm backgrounding study. The impact of LaP in developing
Received for publication: November 15, 2021
heifers is not known, and LaP may offer an alternative to ionophores in heifer diets. Therefore, an experiment was designed to compare supplementation with LaP or monensin on prebreeding growth, DMI, feed efficiency, and pregnancy rate in confinement fed heifers. The working hypothesis was that LaP supplementation would produce results similar to monensin.
MATERIALS AND METHODS
All procedures were approved by the University of Idaho Animal Care and Use Committee (protocol numbers 2017-61 and 2018-27).
Animals and Experimental Design
Crossbred replacement beef heifers ( n = 162) were stratified by age, weight, and previous preweaning and backgrounding treatments and then randomly assigned to receive diets containing either monensin (MON; 200 mg animal−1 d−1; n = 81) or LaP (5 mL animal−1 d−1; n = 81) feed additive. Heifers were born to Angus × Hereford dams and sired by Angus, Hereford, or SimAngus sires. Heifers previously had been used on projects which involved different preweaning grazing locations (range vs. pasture; Hall et al., 2020) and a backgrounding study (alfalfa vs. grass grazing; Bloomsburg, 2018). Prior nutritional management may affect heifer development (Cushman and Perry,
© The Author(s) 2022. Published by Oxford University Press on behalf of the American Society of Animal Science. This is an Open Access article distributed under the terms of the Creative Commons Attribution License (https://creativecommons.org/licenses/by/4.0/), which permits unrestricted reuse, distribution, and reproduction in any medium, provided the original work is properly cited.
Downloaded from https://academic.oup.com/tas/article/6/1/txac015/6515920 by guest on 29 March 2022
Translational Animal Science, 2022, 6, 1–7 https://doi.org/10.1093/tas/txac015
27
2022
Advance access publication
January
2019). Therefore, previous treatments were taken into consideration when allocating heifers to treatment in the present study. Heifers were weaned at an average of 207 d of age, and the backgrounding study lasted 85 d. At the beginning of the current study, heifers were similar ( P < 0. 20) in age and weight averaging 322.1 ± 2.1 d of age and 285.5 ± 13.8 kg.
Diets and Feeding
Heifers were fed a total mixed ration consisting of 42.5% ground alfalfa hay, 42.5% ground orchardgrass hay, 10% wheat middlings, and 5% liquid supplement on a DM basis. The molasses-based liquid supplement (PerforMix Nutrition Systems, Nampa, ID) provided minerals, vitamins, and MON or LaP (Table 1). Diets were formulated to provide 200 mg animal−1 d−1 of MON or 5 mL animal−1 d−1 of LaP. Heifers were allowed ad libitum access to diets and water.
The MON and LaP diets were mixed in separate feed trucks to eliminate possibility of cross contamination of diets. Feed was delivered at 0700, 1400, and 2000 h daily. Bunks were cleaned once weekly, and all orts discarded. To minimize variation in treatment, the same lots of ground hay and wheat middlings were used for both diets. However, variation in diets can occur due to small errors in the loading and
mixing procedures (Vogel et al., 2015). Feed samples were collected daily from all bunks for each feed additive. Daily samples were pooled by feed additive. Daily samples were weighed and oven dried at 60 °C to determine dry matter content. Daily heifer feed intakes were adjusted for daily feed dry matter content to calculate individual animal DMI. Feed samples from each 14-d period were composited by feed additive and analyzed by near infrared spectrometry (Cumberland Valley Analytic Services, Chambersburg, PA). Nutrient content of MON- and LaP-containing diets was compared to ensure that there were no differences other than the MON or LaP supplement (Table 2).
All heifers were fed in a GrowSafe System (GrowSafe Systems Ltd, Model 6000 Calgary, AB) consisting of 5 nodes per pen and 2 pens per MON and LaP treatment for a total of 4 pens. Each pen was designed to provide enough physical and GrowSafe bunk space to support 40 to 45 heifers per pen. A 14-d warm-up period was followed by a 98-d experimental period. After the 14-d warm-up period, 6 heifers were removed from the experiment due to failure to eat out of the GrowSafe bunks resulting in 77 MON and 79 LaP heifers, respectfully.
Data Collection
Heifers were weighed on two consecutive days at the beginning of the experiment (days 1 and 2), at the end of the residual feed intake trial (days 70 and 71), and end of the experiment (days 97 and 98). Consecutive weights were averaged. In addition, heifers were weighed every 2 wk during the experiment. Beginning and final weights were used to calculate trial ADG. Individual animal feed intakes were recorded daily. Diet dry matter was determined daily for each diet and used to calculate individual animal daily DMI. Fat thickness between the 12th and 13th ribs was measured by ultrasound at the conclusion of the residual feed intake (RFI) trial. Residual feed intake was calculated based on methodology
Downloaded from https://academic.oup.com/tas/article/6/1/txac015/6515920 by guest on 29 March 2022
1Monensin—382 mg/kg supplement. 2Prebiotic fermentation product of Lactobacillus acidophilus—8.3 L/907 kg supplement.
1 Basal diet was a total mixed ration consisting of 42.5% ground alfalfa hay, 42.5% ground orchardgrass hay, 10% wheat middlings, and 5% liquid supplement on a DM basis. Liquid supplement contained the feed additives.
2Monensin—200 mg animal−1 d−1
3LaP (RumaCell; prebiotic fermentation product of Lactobacillus acidophilus), 5 mL animal−1 d−1
2 Hall et al.
Nutrient name Dry matter Dry matter, % 65.50 Invert sugars, % 31.69 Crude protein, % 20.25 Crude protein as non-protein N, % 6.88 Crude fat, % 1.52 Salt, % 9.07 Calcium, % 3.15 Phosphorus, % 1.53 Magnesium, % 0.34 Potassium, % 11.15 Sulfur, % 0.52 Iron, ppm 405.50 Manganese, ppm 674.05 Zinc, ppm 840.72 Copper, ppm 269.31 Cobalt, ppm 12.21 Iodine, ppm 78.89 Selenium, ppm 5.02 Vitamin A, IU/kg 53442.67 Vitamin D, IU/kg 3817.34 Vitamin E, IU/kg 673.38 Net energy maintenance, Mcal/kg 1.65 Net energy gain, Mcal/kg 1.15 Net energy lactation, Mcal/kg 1.61
Table 1. Composition of basal liquid supplement that included monensin1 or L. acidophilus prebiotic2
Component Feed additive Std Err P-Value Monensin LaP Dry matter (DM),% 92.3 92.7 0.18 0.22 Crude protein, %DM 9.3 9.8 0.34 0.36 Acid detergent fiber, %DM 46.7 45.8 0.52 0.27 Neutral detergent fiber, %DM 64.8 63.1 0.99 0.25 Ash, %DM 7.38 7.96 0.15 0.03 Ca, %DM 0.48 0.55 0.03 0.16 P, %DM 0.19 0.21 0.01 0.01 Mg, %DM 0.16 0.17 0.01 0.28 K, %DM 2.18 2.25 0.07 0.42 Total digestible nutrients, % 53.5 53.0 0.85 0.66 Net energy maintenance, Mcal/kg 0.50 0.49 0.02 0.62 Net energy gain, Mcal/kg 0.24 0.23 0.01 0.69
Table 2. Comparison of nutrient analysis of diets1 supplemented with monensin2 or LAP3 fed to developing replacement beef heifers during a 98-d trial
previously used in our laboratory (McGee et al., 2013). The final formula was RFI = DMI − [1.75 + 2.09 (ADG) + 0.081 (metabolic mid-point BW) − 0.046(rib fat thickness)]. Heifers were assigned to RFI groups as Efficient (<−0.5 S.D.), Average (−0.5 S.D. < X < 0.5 S.D.), or Inefficient (> 0.5 S.D.).
After the conclusion of the RFI feeding period, heifers remained in their respective pens and were fed the same diet until the conclusion of artificial insemination. Prior to estrous synchronization, heifers were weighed, body condition scored, and reproductive tracts scored. Body condition scores were from 1 = emaciated to 9 = obese (Herd and Sprott, 1986). Reproductive tracts scores (RTS) were from 1 = Infantile to 5 = Cycling/corpus luteum present (Anderson et al, 1991). After prebreeding evaluations, eight heifers (n = 3 MON; n = 5 LaP) were eliminated from breeding due to size or an RTS = 1. Heifers were estrus synchronized using the 14-d CIDR + PG protocol (Mallory et al., 2010). Briefly, heifers received a controlled internal drug release (CIDR; 1.38 g of progestin; Zoetis) device for 14 d followed by an injection of PGF2α (25 mg i.m.; Lutalyse; Zoetis) 16 d after CIDR removal and artificially inseminated (AI) with one of two Angus bulls at 72 h after PGF2α administration. An estrus detection aid (Estrotect; Estrotect Innovative, Spring Valley, WI) was applied to each heifer at the time of PGF2α administration. Fourteen days after AI, clean-up bulls were introduced for an additional 30 d. Pregnancy status was determined via ultrasonography at 60 d and via palpation at 100 d after AI. Ultrasound examination at 60 d was used to differentiate AI sired fetuses from natural service sired fetuses.
Statistics
Animal was the experimental unit as the GrowSafe system allows for calculation of individual animal intakes. The data analysis for this paper was generated using SAS software (v9.4), Copyright © 2016 SAS Institute Inc., Cary, NC. Body weights were analyzed by generalized mixed model with repeated
measures using MIXED procedures. The model included feed additive, time and feed additive × time interaction as fixed effects with feed additive × backgrounding regime, sire breed, summer grazing location, and feed additive × backgrounding regime × time as random effects. Generalized mixed model was used to analyze each weighing event ADG, trial ADG, and trial weight gain included fixed effect of feed additive, backgrounding regime, and feed additive × backgrounding regime interaction with pen × feed additive, sire breed, and summer grazing location as random effects.
Residual feed intake and DMI were analyzed by generalized mixed model with fixed effect of feed additive, backgrounding regime, and feed additive × backgrounding regime interaction with pen, sire breed, and summer grazing location as random effects. General mixed model (GLIMMIX) analysis using a multinomial categorical model was used to compare percentage of heifers LaP and MON heifers in each RFI group. Logistic regression modeling the probability of pregnancy at AI, 60 d, and 100 d was used. Models were adjusted for body condition, BW, and age.
For all analyses, a 95% confidence interval was used with P < 0.05 considered significant and P < 0.10 considered a tendency.
RESULTS
Across all analyses, there were no effects (P > 0.50) of preweaning grazing location or backgrounding regime or their interactions with feed additive. However, these fixed effects remained in the model.
Body weights were similar (P = 0.169) for heifers receiving MON or LaP at all weighing events. Body weights increased (P < 0.0001) over time (Figure 1) and there was no feed additive × time interaction (P = 0.99). Overall experiment ADG was similar (P < 0.99) between MON and LaP heifers averaging 0.9 ± 0.1 kg/d. Average daily gain by weighing event
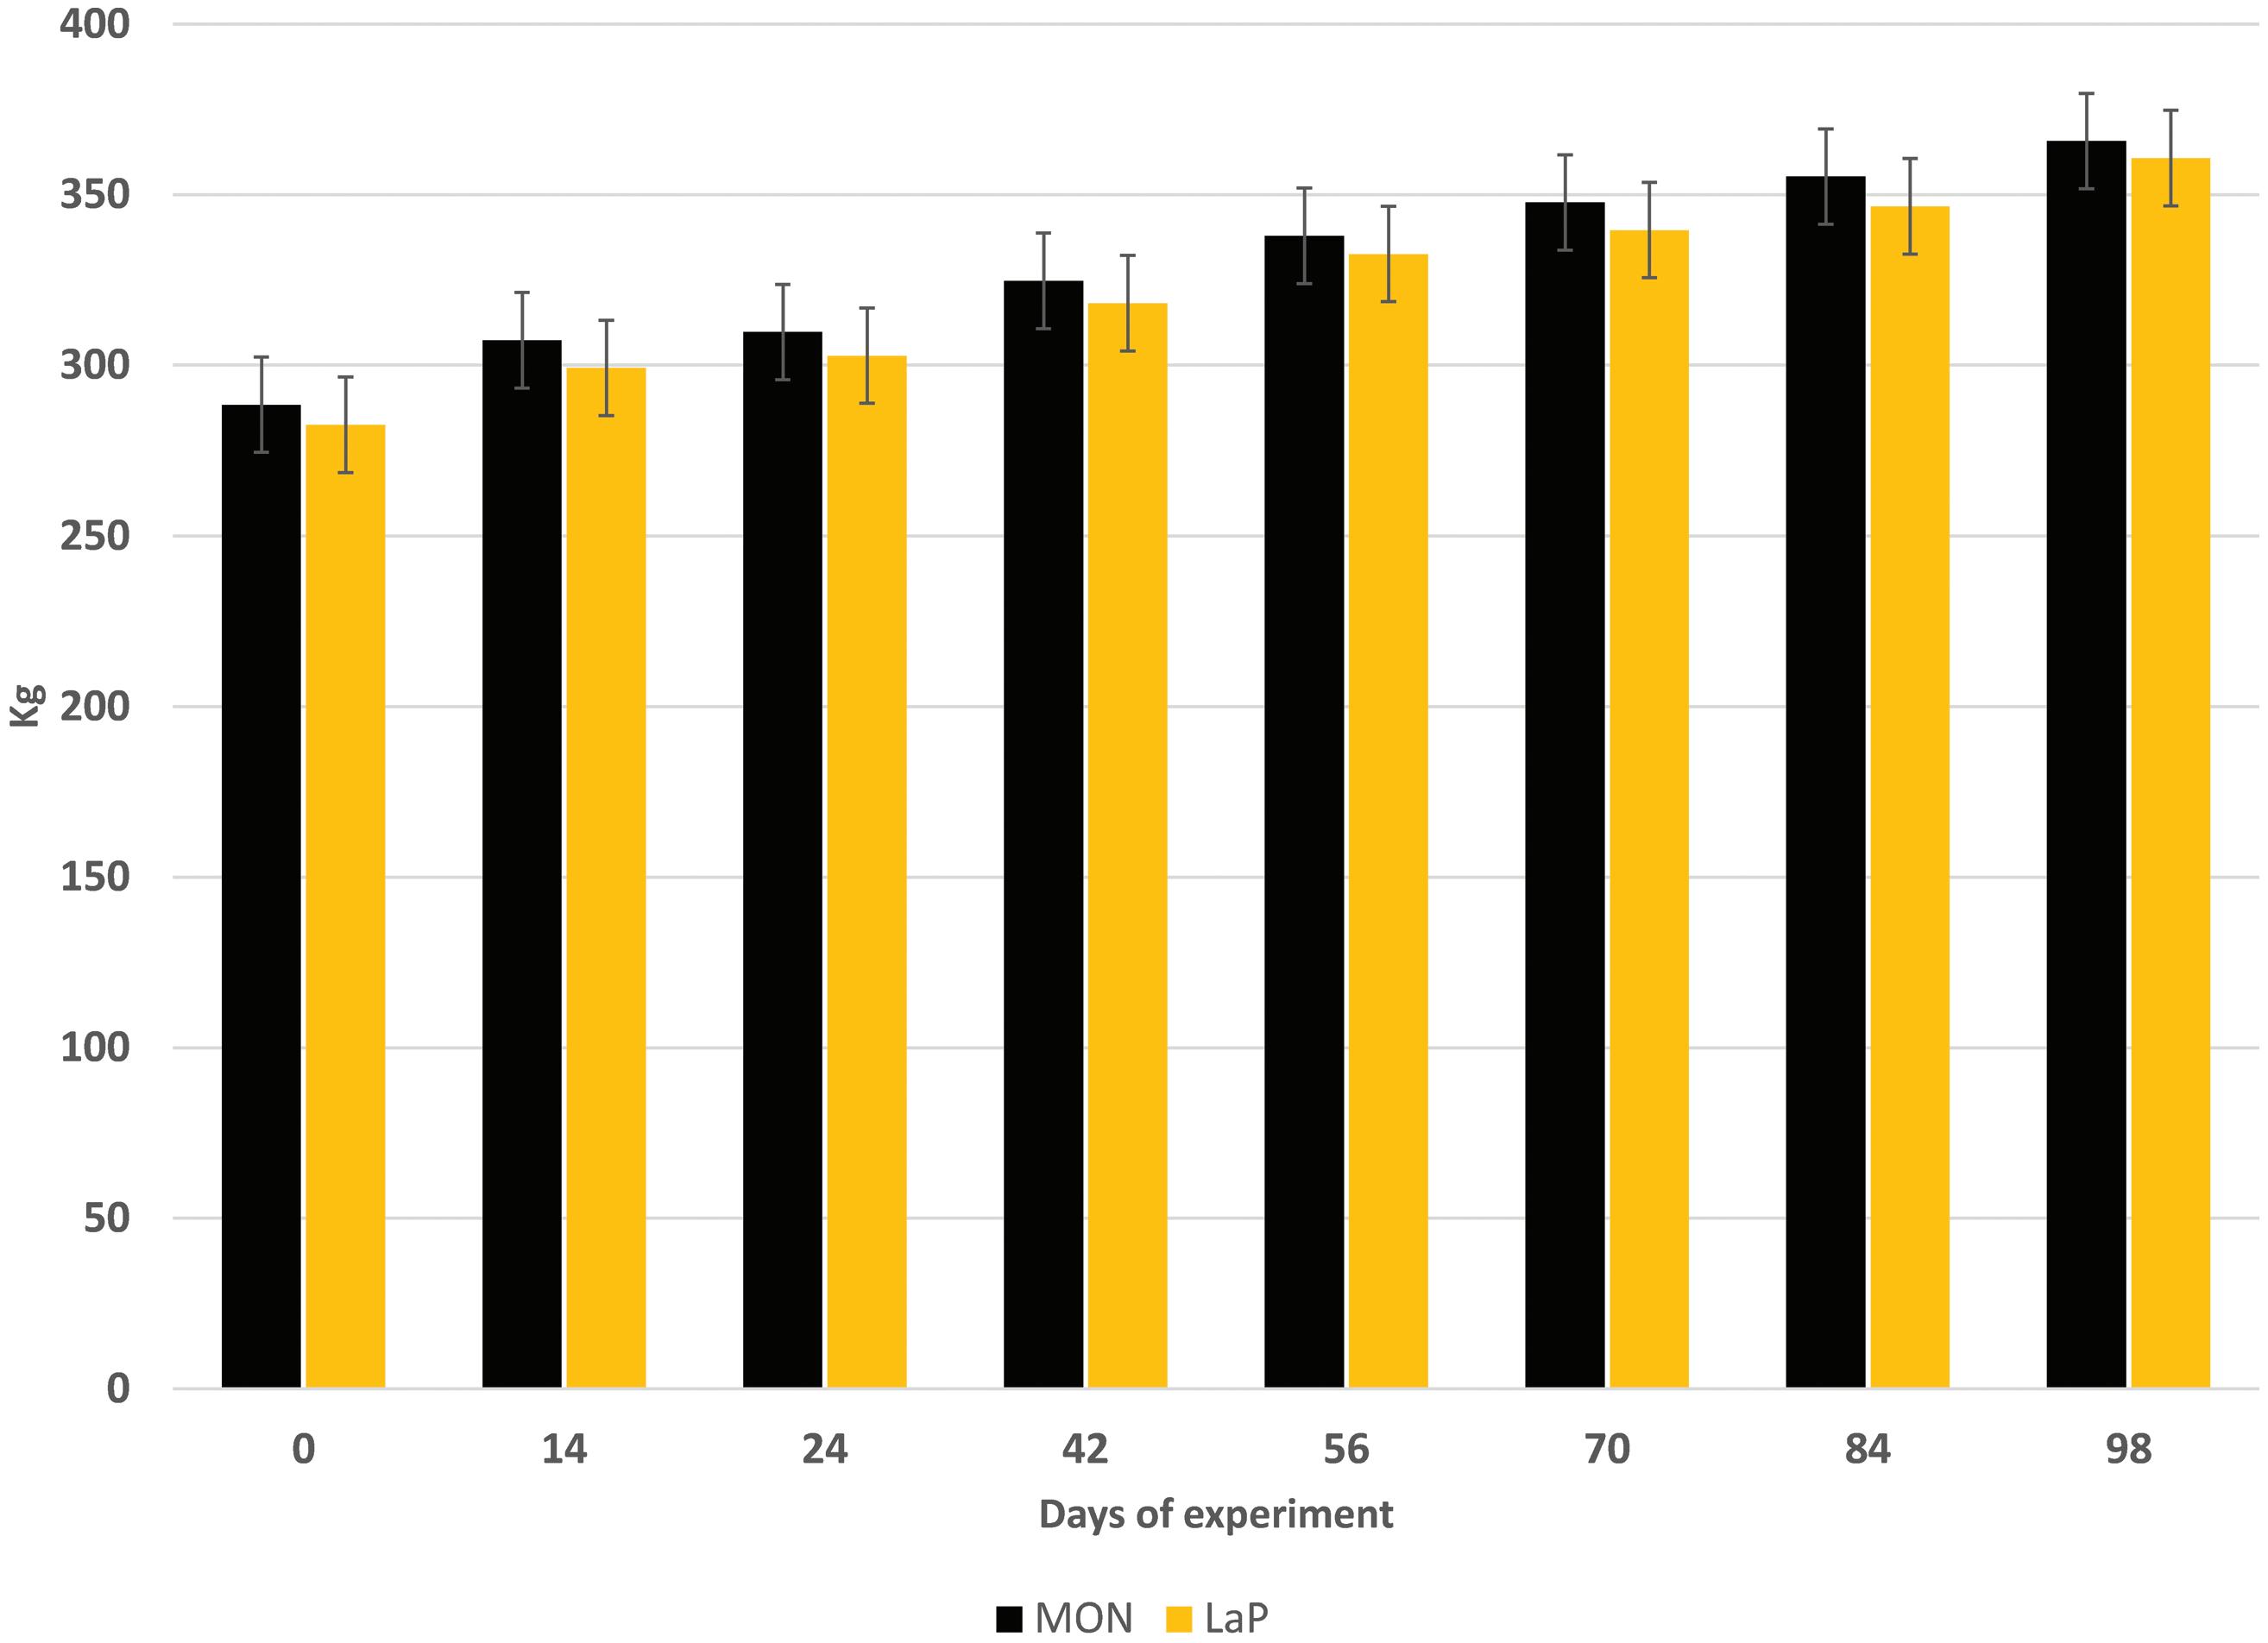
Figure 1. Changes in body weight of replacement beef heifers receiving a total mixed ration (85% hay, 15% concentrate) containing monensin (MON; Rumensin; 200 mg animal−1 d−1; n = 79; black bars) or a prebiotic fermentation product of Lactobacillus acidophilus (LaP, RumaCell; 5 mL animal−1 d−1; n = 77; gold bars). Diets were fed for 98 d. No effect of feed additive on body weight was detected (P > 0.17). Day effect (P < 0.05).
Downloaded from https://academic.oup.com/tas/article/6/1/txac015/6515920 by guest on 29 March 2022
Prebiotic effect on heifers 3
was not affected (P > 0.26) by feed additive; however, gains among weighing events varied (P < 0.05; Table 3).
Dry matter intake was similar (P = 0.83) between heifers receiving MON and LaP averaging 9.2 ± 0.5 and 9.4 ± 0.5 kg/d, respectively. Average RFI did not differ (P = 0.45) between feed additives (−0.106 ± 0.30 and 0.059 ± 0.30, for MON and LaP, respectively). Percentage of heifers in RFI groups was not affected (P = 0.54) by feed additive. Distribution by RFI group for MON and LaP, respectively, was Efficient (28.6%, 31.6%), Average (45.5%, 34.2%), and Inefficient (26.0, 34.2%).
Prebreeding BW and RTS were not different (P > 0.28) between MON and LaP heifers (Table 4). Prebreeding body condition score was greater (P < 0.01) for LaP compared to MON heifers (Table 4). The percentage of heifers expressing estrus after synchronization was increased (P < 0.01) in MON compared to LaP. There was a tendency for more MON heifers to conceive to AI than LaP heifers (P < 0.07). However, pregnancy rates were similar at 60 d (P = 0.33) and 100 d (P = 0.66) after AI for heifers consuming MON or LaP, and across feed additives averaged 80.4% and 90.5% for 60 and 100 d, respectively.
DISCUSSION
Enhancing growth rate or improving feed efficiency may reduce the costs associated with replacement beef heifer production. In general, heifers are developed to reach 55% to 65% of their mature weight by breeding (Hall, 2013). Rate of gain to achieve this developmental goal usually varies from 0.45 to 0.80 kg/d from weaning until breeding (Patterson et al., 1992; Hall, 2013). Optimum rate of gain is dependent on weaning weight and percent of mature weight desired. Since the post-weaning development period can be 8 to 9 mo long, feed costs become a significant factor. Feed additives that improve weight gain or feed efficiency are one strategy to reduce heifer development costs.
This study compared growth, feed intake, and reproductive responses of peripuberal heifers to a feed additive which improves growth and feed efficiency, monensin, to heifers
Table 4. Body weights, body condition, and reproductive responses for replacement beef heifers receiving monensin (MON; n = 76) or prebiotic fermentation product of Lactobacillus acidophilus (LaP; n = 72) containing liquid supplements in a total mixed ration during a 98-d trial1
1 Basal diet was a total mixed ration consisting of 42.5% ground alfalfa hay, 42.5% ground orchardgrass hay, 10% wheat middlings, and 5% liquid supplement on a DM basis. Liquid supplement contained the feed additives. Monensin—200 mg animal−1 d−1; LaP = RumaCell 5 mL animal−1 d−1.
a,b,cWithin columns, means with different superscripts differ (P < 0.05).
1Basal diet was a total mixed ration consisting of 42.5% ground alfalfa hay, 42.5% ground orchardgrass hay, 10% wheat middlings, and 5% liquid supplement on a DM basis. Liquid supplement contained the feed additives.
Monensin—200 mg animal−1 d−1; LaP = RumaCell 5 mL animal−1 d−1.
receiving the prebiotic, LaP. Overall, the prebiotic-treated heifers responded similarly to the ionophore-supplemented heifers. Previous experiments with prebiotics in cattle focused on supplementation of pre-ruminant calves with oligosaccharides (Quigley et al., 2002; Heinrichs et al., 2003, Ghosh and Mehla, 2012; Grand et al., 2013). In general, these experiments demonstrated beneficial effects on health and growth through alterations in the hindgut microbiome. Most studies involving cattle with functional rumens examined the effects of probiotics, in contrast to prebiotics, on animal performance and rumen function (see reviews by Uyeno et al., 2015; Retta, 2016). More recently, studies compared the effects of probiotics or synbiotics (pre- and probiotic combination) to effects of monensin on growth and/ or health in growing/finishing cattle (Columbo et al., 2021; Neves et al., 2021). The current experiment is among the few reports of the impacts of this L. acidophilus prebiotic on cattle performance.
It is well established that ionophores, such as monensin, improve growth rate and feed efficiency in cattle (Potter et al., 1976; Raun et al., 1976; Goodrich et al., 1984). In growing replacement heifers, inclusion of monensin in the diet increased growth rate and decreased age at puberty compared to diets without monensin (Moseley et al, 1977; Moseley et al, 1982). Since the positive effects of monensin when included in a total mixed ration, with sufficient energy, are well documented in the literature, we designed the study to use MON as the reference or control diet.
Actual average intake of feed additives based on DMI and inclusion rate in the total mixed ration was 177.6 mg animal−1 d−1 and 4.26 mL animal−1 d−1 for MON and LaP, respectively. Therefore, average feed additive intake was ≥ 85% of target for both treatments. Positive effects of monensin in a range of doses from 50 to 400 mg animal−1 d−1 are well documented with 200 mg animal−1 d−1 considered an effective dose for growth promotion (Goodrich et al., 1984; Potter et al., 1976; Kunkle et al., 2000). Monensin increases ADG and feed efficiency in supplemented animals compared to unsupplemented controls (Goodrich et al., 1984; Kunkle et al., 2000). Therefore, we are confident that the performance of the MON heifers reflects the positive effect of monensin,
Downloaded from https://academic.oup.com/tas/article/6/1/txac015/6515920 by guest on 29 March 2022
4 Hall et al.
of experiment Feed additive P-value MON LaP 0 to 14 1.5 ± 0.1a 1.3 ± 0.1a 0.26 14 to 28 0.3 ± 0.2b 0.5 ± 0.2b 0.31 28 to 42 1.0 ± 0.2c 1.1 ± 0.2c 0.82 42 to 56 1.0 ± 0.2c 1.0 ± 0.2c 0.90 56 to 70 0.9 ± 0.6b,c 0.6 ± 0.6b,c 0.79 70 to 84 0.6 ± 0.4b,c 0.5 ± 0.4b,c 0.90 84 to 98 0.7 ± 0.2b,c 0.9 ± 0.2c 0.27
Table 3. Average daily gains (kg/d ± SE) for replacement beef heifers receiving monensin (MON) or prebiotic fermentation product of Lactobacillus acidophilus (LaP) containing liquid supplements in a total mixed ration during a 98-d trial1
Days
Item Feed additive P-value MON LaP Body weight (kg) 359.4 ± 3.8 353.4 ± 3.8 0.26 Body condition score 5.8 ± 0.1 6.2 ± 0.1 0.02 Reproductive tract score 3.3 ± 0.1 3.1 ± 0.1 0.22 Estrus response (%) 77.0 ± 5.0 56.5 ± 6.1 0.01 AI pregnancy rate (%) 58.0 ± 5.8 42.4 ± 5.9 0.07 60-d Pregnancy rate (%) 83.6 ± 4.4 77.2 ± 5.1 0.33 100-d Pregnancy rate (%) 89.4 ± 3.6 91.6 ± 3.3 0.66
but a negative control was not part of the experimental design. There are no available published dose–response studies for LaP; however, the inclusion rate in this study was according to the recommendations of the manufacturer.
Dry matter intake for both groups was only 0.25 to 0.30 kg per day greater than that predicted by the Nutrient Requirements of Beef Cattle (NRBC, National Academies 2020). Similarly, BW and growth rates were not markedly different between treatments. Animal performance, as indicated by ADG, agreed with NRBC projections for yearling cattle receiving an ionophore. Previously, we observed an increase in DMI and ADG in steers receiving LaP compared to steers receiving MON (Hall et al., 2018). In that study, animals received a higher concentrate, lower roughage diet (25% concentrate; Hall et al., 2018) than animals in the present study (15% concentrate). In addition, the treatment period was only half the duration of the present study. Whether the previously observed impacts of LaP on DMI and ADG are dependent on dietary energy content or duration of treatment is not clear and warrants further study.
The growth response was similar among LaP- and MON-treated heifers. As previously mentioned, addition of monensin improves growth rate and feed efficiency. With high energy, high concentrate feedlot diets, animals receiving monensin had increased feed efficiency, which was a result of both increased ADG and reduced DMI (Goodrich et al., 1984). In contrast, when monensin was included in diets of animals grazing pasture or consuming high roughage diets, feed intake was not suppressed, but modest improvements in ADG (0.05 to 0.21 kg/d) resulted in minor improvements in feed efficiency (Potter et al., 1976; Moseley et al., 1982; Kunkle et al., 2000). In high roughage diets, increases in growth rate in response to monensin may be dependent on ad libitum access to feed (Moseley et al., 1982). In the present study, animal access to feed was not restricted. In agreement with the present study, Colombo et al. (2021) observed no difference in growth rates in feeder cattle consuming receiving diets that included a synbiotic or a monensin-tylosin feed additive. Adding a prebiotic to finishing diets containing monensin did not alter growth rate in steers (Pancini et al., 2020). In contrast, diets including a probiotic increased ADG in steers compared to diets containing monensin (Neves et al., 2021).
The lack of difference between DMI in MON and LaP in the present study would be consistent previously described limited effects of monesin on DMI in high forage diets (Potter et al., 1976; Kunkle et al., 2000). Colombo et al. (2021) observed a transient increase in DMI in steers receiving diets containing a synbiotic, but this increase was not maintained and trial DMI was similar among treatments. Probiotics either as an alternative to monensin or an additive to monesin containing diets did not improve DMI (Pancini et al., 2020; Neves et al., 2021). The design and animal numbers used in the present study, admittedly, may allow for potential type II statistical error. As growth and intake responses were similar between MON- and LaP-supplemented heifers, we cautiously conclude that LaP inclusion in replacement beef heifer diets results in similar performance as addition of an ionophore. As there are few studies examining the effect of LaP on animal performance, additional studies are warranted.
Consistent with the lack of effect of treatment on growth or dry matter intake, feed efficiency, as determined by average RFI value, was not altered in the present study. Similarly,
distribution of heifers in efficient, average, or inefficient groups was not impacted by treatment. Residual feed intake estimates feed efficiency regardless of productivity, and it measures the deviation from predicted intake for a particular level of performance (Herd and Arthur, 2009). Approximately 19% of the variation in RFI can be attributed to digestive and heat increment alterations. Alterations in rumen microbial populations have been associated with differences in RFI (Elolimy et al., 2018). Although we had previously described alterations in fermentation due to LaP (Hall et al., 2018), LaP did not result in changes in efficiency in the current study.
Positive reproductive responses may be related to increased growth rate and greater propionate production in monensinsupplemented heifers (Mosley et al., 1977; Mosley et al., 1982; Lalman et al., 1993). Reported differences in pregnancy rate between control and monesin supplemented heifers range from 0% to 19% in favor of monensin (Mosley et al., 1977; Mosley et al., 1982; Lalman et al., 1993). Often the number of animals in these studies limits the ability to detect differences below 20%. The information on L. acidophilus supplementation on reproduction in large ruminants is limited. Work from El-Nagar et al. (2021) demonstrated improved reproductive performance in lactating Egyptian buffaloes in response to oral supplementation with a L. acidophilus probiotic.
In the present study, MON and LaP heifers had a similar rate of reproductive development as indicated by RTS. However, MON heifers had improved estrous response to estrous synchronization and a tendency for increased pregnancy rates to artificial insemination compared to LaP heifers. Monensin supplementation increases responsiveness of the ovary to gonadotrophins compared to controls (Bushmich et al., 1980). An increase in ovarian responsiveness to estrous synchronization may explain the improvements in early pregnancy rates in the present study. However, by 60 and 100 d after initiation of the breeding season, those differences were no longer apparent. In this study, the detection limit for differences in reproductive traits was 15% due to the number of animals per treatment. Therefore, only dramatic differences in reproductive traits could be detected. Large-scale reproductive experiments on the effects of pre- and probiotics are needed.
Animal response to prebiotics or probiotics can be highly variable and may be dependent on a variety of factors including health or age of the animal, percentage of concentrates in the diet, or type of prebiotic/probiotic provided (Dhama et al., 2008; Rai et al., 2013; Uyeno et al., 2015). Uyeno et al. (2015) reviewed studies examining the effects of probiotics (n = 8) or prebiotics (n = 8) on performance and health in calves. Although 71% of the probiotic trials examined resulted in increased weight gain compared to controls, only 25% of the prebiotic studies demonstrated a growth advantage. Only 25% of both prebiotic and probiotic studies reported increases in feed efficiency, whereas 50% of trials indicated health benefits.
Prebiotics are usually fermentable ingredients, which may alter bacterial populations in the large intestine or rumen through stimulation or suppression of specific species (Rai et al., 2013; Markowiak and Slizewska, 2018). Most commercially available prebiotics for livestock are poly- or oligosacchraides. Response to prebiotics in non-ruminants include increases in Lactobacillus and Bifidobacterium with concomitant reductions in Salmonella and E. coli (Markowiak and Slizewska, 2018). In general, these Downloaded
Prebiotic effect on heifers 5
from https://academic.oup.com/tas/article/6/1/txac015/6515920 by guest on 29 March 2022
microbial responses also translated into enhanced animal health and performance. However, response to prebiotics may depend on species as prebiotics benefits were noted in pigs and chickens but not turkeys (Markowiak and Slizewska, 2018). As previously noted, most of the studies reviewed on prebiotics in calves resulted in little or no response (Uyeno et al., 2015). Response to prebiotics may be affected by diet as well. Calves supplemented with cellooligosaccaride and fed whole milk exhibited positive responses, whereas calves fed milk replacer did not respond to the prebiotic (Uneyo et al., 2015). Grains that differed in carbohydrate composition resulted in alterations in the intestinal microbiome of piglets, and these dietary-induced alterations may also affect response to the prebiotic (Markowiak and Slizewska, 2018).
The prebiotic used in the present study is a L. acidophilus fermentation product, which contains spent Lactobacillus cells, organic compounds of fermentation, and the media on which it was grown (RumaCell, Pacer Technologies). Based on this information, it is not clear what components of this product may have the greatest effect on animal response or the precise mechanism of action. Previously, we reported reductions in production of propionate and increases in butyrate, valerate, and isovalerate in vitro between LaP compared to MON supplementation (Hall et al., 2018). Lactobacillus acidophilus produces the bacterioncins lactocin B, lactacin F, acidocin A, and acidocin B (Gopal, 2011). Whether these bactericidal compounds are still present in the product or have activity in the rumen are not known.
In summary, the use of a L. acidophilus fermentation product as a prebiotic may be a viable substitute for ionophores in replacement heifer diets. Based on the conditions of the present study, growth and reproductive responses to this type of prebiotic appear to be similar to monensin in diets containing sufficient energy to support recommended growth rates in heifers. Further investigation on L. acidophilus fermentation products on growth as well as focusing on dose-response, rumen function, and mechanisms of action is warranted.
Acknowledgment
We acknowledge financial and facilities support from the Idaho Agricultural Experiment Station, the University of Idaho Department of Animal, Veterinary and Food Science, the University of Idaho Nancy M. Cummings Research, Extension and Education Center and the Hatch Program project number IDA01493 of the National Institute of Food and Agriculture, U.S. Department of Agriculture. We would like to thank Dr. William J. Price for statistical consulting, the staff of the Nancy M. Cummings Center for their assistance, Zoetis and EstroTect for estrous synchronization materials, Pacer Technologies, Inc. for donation of the RumaCell containing liquid supplement, and PerforMix Nutrition Systems for formulating and mixing all liquid supplements.
LITERATURE CITED
Anderson, K. J., D. G. Lefever, J. S. Brinks, and K. G. Odde. 1991. The use of reproductive tract scoring in beef heifers. Agri-Pract. 12:19–26.
Bloomsburg (Reynolds), M. 2018. The effects of pre- and postweaning nutrition on fertility and feed efficiency in beef heifers. Master of Science. December 2018. University of Idaho Thesis SF207.B56 2018.
Blomme, E. A. G., K. M. D. La Perle, P. Wilkins, F. Del Piero, and J. Hayes. 1999. Ionophore toxicity in horses. Equine Vet. Educ. 11:153–158. doi:10.1111/j.2042-3292.1999.tb00937.x
Bushmich, S. L., R. D. Randel, M. M. McCartor, and L. H. Carroll. 1980. Effect of dietary monensin on ovarian response following gonadotropin treatment in prepuberal heifers. J. Anim. Sci. 51:692–697. doi:10.2527/jas1980.513692x
Cushman, R. A., and G. A. Perry. 2019. Developmental programming of fertility in livestock. Vet. Clin. Food Anim. 35:321–330. doi:10.1016/j.cvfa.2019.02.003
Colombo, E. A., R. F. Cooke, A. P. Brandão, J. B. Wiegand, K. M. Schubach, C. A. Sowers, G. C. Duff, E. Block, and V. N. Gouvêa. 2021. Performance, health, and physiological responses of newly received feedlot cattle supplemented with pre- and probiotic ingredient. Animal. 15:100214. doi:10.1016/j.animal.2021.100214
Dhama, K., M. Mahendran, S. Tomar, and R. S. Chauhan. 2008. Beneficial effects of probiotics and prebiotics in livestock and poultry: the current perspectives. Intas Polivet. 9:1–2. https://www. indianjournals.com/ijor.aspx?target=ijor:ipo&volume=9&issue=1 &article=001.
El-Nagar, H. A., A. M. El-Hais, and M. S. Mandouh. 2021. Influence of yeast and Lactobacillus products as feed supplements on blood parameters and reproductive performance of lactating Egyptian buffaloes. Egyptian J. Anim. Prod. 58:1–8. doi:10.21608/ ejap.2021.45550.1004
Elolimy, A. A., M. K. Abdelmegeid, J. C. McCann, D. W. Shike, and J. J. Loor. 2018. Residual feed intake in beef cattle and its association with carcass traits, ruminal solid-fraction bacteria, and epithelium gene expression. J. Anim. Sci. Biotechnol. 9:67. doi:10.1186/ s40104-018-0283-8
Ghosh, S., and R. K. Mehla. 2012. Influence of dietary supplementation of prebiotics (mannanoligosaccharide) on the performance of crossbred calves. Trop. Ani. Health Prod. 44:617–622. doi:10.1007/s11250-011-9944-8
Goodrich, R. D., J. E. Garrett, D. R. Gast, M. A. Kirick, D. A. Larson, and J. C. Meiske. 1984. Influence of monensin on the performance of cattle. J. Anim. Sci. 58:1484–1498. doi:10.2527/ jas1984.5861484x
Gopal, P. K. 2011. Lactic Acid Bacteria | Lactobacillus spp.: Lactobacillus acidophilus. In: Fuquay, J. W., Editor-in-Chief. Encyclopedia of dairy science. 2nd ed. Academic Press; p. 91–95. doi:10.1016/ B978-0-12-374407-4.00260-0
Grand, E., F. Respondek, C. Martineau, J. Detilleux, and G. Bertrand. 2013. Effects of short-chain fructooligosaccharides on growth performance of preruminant veal calves. J. Dairy Sci. 96:1094–1101. doi:10.3168/jds.2011-4949
Hall, J. B. 2013. Nutritional development and the target weight debate. In “Management considerations in beef heifer development and puberty.” Vet. Clin. N. Am. Food Anim. Pract. 29:537–554. doi: 10.1016/j.cvfa.2013.07.015
Hall, J. B., A. H. Laarman, M. K. Reynolds, and W. K. Smith. 2018. Performance of backgrounding steers fed diets containing monensin or a Lactobacillus fermentation product. Transl. Anim. Sci. 2:S130–S133. doi:10.1093/tas/txy035
Hall, J. B., J. E. Sprinkle, M. Ellison, S. Goddard, B. Taylor, and J. B. Glaze. 2020. Comparison of range-based and irrigated cow-calf systems—grazing season performance. J. Anim. Sci. 98(Suppl. 4):385–386. doi:10.1093/jas/skaa278.678
Heinrichs, A. J., C. M. Jones, and B. S. Heinrichs. 2003. Effects of mannan oligosaccharide or antibiotics in neonatal diets on health and growth of dairy calves. J. Dairy Sci. 86:4064–4069. doi:10.3168/jds.S0022-0302(03)74018-1
Herd, R. M., and P. F. Arthur. 2009. Physiological basis for residual feed intake. J. Anim. Sci. 87(E. Suppl.):E64–E71. doi:10.2527/jas.20081345
Downloaded from https://academic.oup.com/tas/article/6/1/txac015/6515920 by guest on 29 March 2022
6 Hall et al.
Herd, D.B, and L.R. Sprott. 1986. Body condition, nutrition and reproduction of beef cows. Texas Agricultural Extension Service. B-1526. http://agrilifecdn.tamu.edu/victoriacountyagnr/files/2010/07/BodyCondition-Nutrition-Reproduction-of-Beef-Cows.pdf
Kunkle, W. E., J. T. Johns, M. H. Poore, and D. B. Herd. 2000. Designing supplementation programs for beef cattle fed forage-based diets. J. Anim. Sci. 77(Suppl. E):1–12. doi: 10.2527/jas2000.00218812007 700ES0012x
Lalman, D. L., M. K. Petersen, R. P. Ansotegui, M. W. Tess, C. K. Clark, and J. S. Wiley. 1993. The effects of ruminally undegradable protein, propionic acid, and monensin on puberty and pregnancy in beef heifers. J. Anim. Sci. 71:2843–2852. doi:10.2527/1993.71112843x
Mallory, D. A., D. J. Wilson, D. C. Busch, M. R. Ellersieck, M. F. Smith, D. J. Patterson. 2010. Comparison of long-term progestin-based estrus synchronization protocols in beef heifers. J. Anim. Sci. 88:3568–3578. doi: 10.2527/jas.2010-3084
Markowiak, P., and K. Śliżewska. 2018. The role of probiotics, prebiotics and synbiotics in animal nutrition. Gut Pathogens 10:21. doi:10.1186/s13099-018-0250-0
McGee, M., C. M. Welch, J. B. Hall, W. Small, and R. A. Hill. 2013. Evaluation of Wagyu for residual feed intake: optimizing feed efficiency, growth, and marbling in Wagyu cattle. Prof. Anim. Sci 29:51–56. doi:10.15232/S1080-7446(15)30195-9
Moseley, W. M., M. M. McCartor, and R. D. Randel. 1977. Effects of monensin on growth and reproductive performance of beef heifers. J. Anim. Sci. 45:961–968. doi:10.2527/jas1977.455961x
Moseley, W. M., T. G. Dunn, C. C. Kaltenbach, R. E. Short, and R. B. Staigmiller. 1982. Relationship of growth and puberty in beef heifers fed monensin. J. Anim. Sci. 55:357–362. doi: 10.2527/ jas1982.552357x
National Academies of Sciences, Engineering, and Medicine. 2020. Nutrient requirements of beef cattle: Eighth Revised Edition. The National Academies Press, Washington, DC. doi: 10.17226/19014
Neves, N. F., C. A. Pedrini, E. R. Oliveira, O. F. C. Marques, J. T. Silva, R. A. S. Becker, W. S. Gouvea, A. R. M. Fernandes, and J. R. Gandra. 2021. Probiotics improve productive performance and carcass ultrasonographic quality of steers under grazing during dry‐water transition season. Iranian J. Appl. Anim. Sci. 11:33–38. http://ijas. iaurasht.ac.ir/article_680288.html.
Pancini, S., R. F. Cooke, A. P. Brandão, N. W. Dias, C. L. Timlin, P. L. P. Fontes, A. F. F. Sales, J. C. Wicks, A. Murray, R. S. Marques, et al. 2020. Supplementing a yeast-derived product to feedlot cattle consuming monensin: impacts on performance, physiological responses, and carcass characteristics. Livest. Sci. 232:103907. doi:10.1016/j.livsci.2019.103907
Patterson, D. J., R. C. Perry, G. H. Kiracofe, R. A. Bellows, R. B. Staigmiller, and L. R. Corah. 1992. Management considerations in heifer development and puberty. J. Anim. Sci. 70:4018–4035. doi: 10.2527/1992.70124018x
Potter, E. L., C. O. Cooley, L. F. Richardson, A. P. Raun, and R. P. Rathmacher. 1976. Effect monensin on performance of cattle fed forage. J. Anim. Sci. 43:665–669. doi: 10.2527/jas1976.433665x
Quigley, J. D. III, C. J. Kost, and T. A. Wolfe. 2002. Effects of spraydried animal plasma in milk replacers or additives containing serum and oligosaccharides on growth and health of calves. J. Dairy Sci. 85:413–421. doi: 10.3168/jds.S0022-0302(02)74089-7
Rai, V., B. Yadav, and G. P. Lakhani. 2013. Applications of probiotic and prebiotic in animal production: a review. Environ. Ecol. 31:873–876. https://drive.google.com/file/d/1JFRuvyjStvWYR9MobFennix4aQVzFAP/view?usp=sharing.html
Raun, A. P., C. O. Cooley, E. L. Potter, R. P. Rathmacher, and L. F. Richardson. 1976. Effect of monensin on feed efficiency of feedlot cattle. J. Anim. Sci. 43(3):670–677. doi: 10.2527/jas1976.433670x
Retta, K. S. 2016. Role of probiotics in rumen fermentation and animal performance: a review. Intern. J. Livestock Prod. 7:24–32. doi: 10.5897/IJLP2016.0285
Troxel, T. R. 2012. Natural and organic beef. Univ. AR Coop Ext Bulletin FSA3103.—[accessed March 2, 2018]. https://www.uaex. edu/publications/PDF/FSA-3103.pdf.
Uyeno, Y., S. Shigemori, and T. Shimosato. 2015. Effect of probiotics/prebiotics on cattle health and productivity. Microb. Environ 30:126–132. doi: 10.1264/jsme2.ME14176
Vogel, G. J., S. B. Laudert, and Elanco Animal Health. 2015. Troubleshooting poor ration uniformity in feedlot rations. Tech Talk, Scientific Update from Elanco Ani. Health.—[accessed February 25, 2018]. https://assets.contentful.com/fistk1blxig0/AojL ndzaCcUqi8UuUggS8/0c106ae82a065ffb373ae866a19ba8e6/ usbburum00176_rationuniformitytechtalk.pdf
Downloaded from https://academic.oup.com/tas/article/6/1/txac015/6515920 by guest on 29 March 2022
Prebiotic effect on heifers 7
Milk Replacer - Calf Starter Study
Date: March 7, 2024
To: Michael Officer
From:
David Casper, Ph.D., P.A.S., DPL ACAS, ASAS-Fellow Janet Casper, Casper’s Calf Ranch, LLCTrial Number: CCR-06 Phase 1 (Milk Replacer and Calf Starter)
Trial Title:
Evaluation of Excell™ fed during the milk replacer and calf starter phase
Objective: To evaluate the Eubiotic, Excell™, for improving growth rates, feed conversions and intestinal health and development for neonatal calves fed milk replacer and calf starter from 0 to months of age.
EXPERIMENTAL OBSERVATIONS
1.The milk replacer was a 22:20 (CP:Fat) amino acid with Deccox and Clarify added.
2. Excell™ was added to the milk at 5 g/calf/d or no additive added (Control).
3.Calf starter was a 22% CP (As Fed) either without (Control) or with Excell™ added at 0.25% of the formula.
4.Rumensin added to Control and Excell™ calf starters at 0.08% of the formula. Clarify was added to both at 0.20%.
5. Milk replace met formulation specifications.
6. Nutrient composition was similar among both calf starters except for slight differences in Fe and Mn trace minerals, which would have minimal impact.
7. Milk replacer amino acid concentrations were similar too formulation specifications.
8.Calf starter amino acid consternations were similar except for Arg and Trp which should have minimal impact on calf performance.
9. Heat stress was minimal for conducting a summer trial.
10. A trend for a treatment by week interaction indicated that calves fed Excell™ demonstrated significant lower body weights during weeks 6, 7, and 8 of the study.
11. Overall (study) average daily gains (ADG) were significantly lower for calves fed Excell™ compared with calves fed Control. The overall study (final-initial) 56 ADG confirmed this observation.
12. Calves fed Excell™ tended to be lower in calf starter dry matter intake and total dry matter intake compared with calves fed Control and significantly lower during weeks 6, 7, and 8 of the study.
13. Days for calves fed Excell™ to achieved desired calf starter intake for weaning was greater when compared to calves fed Control.
14. Feed conversions were similar for calves fed both treatments except for week 2.
15.Gains in heart girth and hip width were greater for calves fed Control compared with calves fed Excell™, while remaining gains in frame growth were similar
16. Fecal and nasal scores were similar for calves fed both treatments.
17.Blood beta-hydroxy butyrate concentrations (BHBA) tended to be greater for calves fed Control compared with calves fed Excell™.
18. BHBA concentrations did not indicate when calves-initiated rumination.
19. Calves fed Excell™ tended (P < 0.13) to have less days with a body temperature greater than 39.5 oC
20. The treatment by week interactions figures for body weight, calf starter intake and BHBA are included at the end of the report.
21. These data tend to support the conclusion that feeding Excell™ reduces the number of days with a body temperature being greater than 39.5 oC compared to calves fed Control.
CONCLUSION
Nearing the end of the 8 week study, body weight gains, ADG, and calf starter dry matter intake were lower for calves fed Excell™ compared with calves fed Control. Therefore, this study did not demonstrate an advantage to feeding Excell™ to neonatal calves during the milk replacer/calf starter phase. These study observations are in contrast to field observations and previous Excell™ research. Why? This study obviously demonstrates a growth and intake antagonist between various feed additives when comparing growth performance for calves fed Excell™ with calves fed Control. The antagonist possibilities are Excell™, Deccox, Rumensin, and possibly Clarify. Previous research experience would direct attention to a possible Excell™ and Rumensin antagonism. Future research should be directed at understanding this antagonism to ensure growth performance when Excell™ is fed to livestock In addition, the body temperature data indicates that Excell™ may be reducing the number of days with a body temperature.
1
Replacer Ingredient 22:20 with AA of 24% CP (% of Mix) Whey, whey protein concentrate 62.11 Fat blend base 33.17 Decoquinate 0.5% 1.00 Vitamin premix 0.91 L-Lysine HCL 0.86 DL-Methionine 0.55 Threonine 0.45 Dicalcium phosphate 0.41 Organic trace mineral mix 0.38 Vitamin E 100,000 0.09 Flavor 0.06 Clarify 8% 0.02 1Tag guarantee of 22% crude protein, 20% fat, not less than 55,000 international units (IU) of Vitamin A, 16,500 IU of Vitamin D, and 220 IU of Vitamin E per kg on an “As Fed” basis.
Table
. Ingredient composition of milk replacer.
Milk
2.
1Pacer Technology, Murtaugh, ID.
2ClariFly, Central Life Science, Schaumberg, IL.
3Yeast culture, XPC Diamond V Mills, Cedar Rapids, IA.
4Rumensin, 198 g/kg Elanco, Greenfield, IN.
5Vitamin B and E premix contains vitamin E 135,800 mg/kg, biotin 418 mg/kg, choline 1,079 g/kg, niacin 85,200 mg/kg, folic acid 7,500 mg/kg, pantothenic acid 83,800 mg/kg, riboflavin 18,950 mg/kg, pyridoxine 6,250 mg/kg, and vitamin B12 104 mg/kg.
6Trace mineral premix contains cobalt 385 mg/kg, copper 47,500 mg/kg, iodine 3,875 mg/kg, manganese 182,630 mg/kg, and zinc 171,000 mg/kg.
7Flavor, Ralco Inc., Marshall, MN.
8Vitamin ADE premix contains 110,230,000 iu/kg vitamin A, 11,023,000 iu/kg of vitamin D and 11,023 iu/kg of vitamin E.
Treatment Ingredient Control Excell™ (% of Mix) Wheat midds 35.24 35.24 Soybean meal 27.40 27.40 Corn, ground 20.00 20.00 Dried molasses 5.00 5.00 Dried distiller’s grains with solubles 4.00 4.00 Alfalfa meal 2.50 2.50 Calcium carbonate 1.89 1.64 Soy hulls 1.25 1.25 Salt, white 1.00 1.00 Pellet binder 0.50 0.50 Corn oil 0.45 0.45 Excell™1 0.25 Diflubenzuron2 0.20 0.20 Choline, 60% 0.15 0.15 Yeast culture3 0.13 0.13 Rumensin4 0.08 0.08 Vitamin B & E premix5 0.07 0.07 Trace mineral premix6 0.05 0.05 Flavor7 0.05 0.05 Vitamin ADE premix8 0.02 0.02 Niacin 99.5% 0.02 0.02 Selenium yeast 3000 0.01 0.01
Table
Ingredient composition of mini-pelleted (~4 mm) calf starter without (Control) or with Excell™.
1Analyses conducted by Dairyland Laboratory, Arcadia WI.
2N = number of samples.
3Dry matter.
4Crude protein.
5Soluble protein.
6Acid detergent fiber.
7Neutral detergent fiber.
8Acid detergent fiber insoluble crude protein.
10Acid detergent fiber insoluble crude protein.
11Non-fiber carbohydrate.
12Water soluble carbohydrate.
13Metabolizable energy.
14Net energy maintenance.
15Dietary cation anion difference.
*Means within calf starter differ, P <
Nutrient Replacer Std Dev Control Excell™ SEM N2 2 2 2 2 DM3, % 97.1 0.10 90.5 89.3 0.24 CP4, % 23.1 0.32 23.9 24.4 0.20 SP5, % of CP 98.0 0.16 36.3 35.5 1.92 ADF6, % 9.12 9.44 0.48 NDF7, % 20.5 21.9 1.51 ADF-ICP8, % 0.46 0.45 0.02 NDF-ICP9, % 1.30 1.33 0.02 Lignin, % 2.00 1.97 0.16 NFC10, % 47.9 0.02 43.6 42.9 1.44 WSC11, % 40.3 0.22 13.41 12.50 0.11 Starch, % 0.73 0.21 20.5 20.9 0.49 Fat, % 21.1 0.35 3.52 3.63 0.23 ME12, Mcal/kg 4.94 0.05 5.85 5.93* 0.01 NEm13, Mcal/kg 3.55 <0.01 4.28 4.34* 0.01 NEg14, Mcal/kg 2.59 <0.01 3.15 3.19 < 0.01` Ash, % 7.86 0.05 10.3 8.95 0.42 Ca, % 0.94 0.01 2.11 1.38 0.22 P, % 0.80 <0.01 0.75 0.77 0.03 Mg, % 0.13 <0.01 0.36 0.36 0.01 K, % 1.66 0.01 1.50 1.50 0.06 S, % 0.43 0.03 0.35 0.37 0.01 Na, % 0.79 0.01 0.56 0.56 0.03 Cl, % 1.26 0.06 0.92 0.97 0.14 B, ppm 1.00 <0.01 15.0 16.5 1.00 Al, ppm 97.0 1.41 163.5 113.5 10.5 Fe, ppm 81.5 16.3 256.0 195.5* 12.0 Mn, ppm 66.5 13.4 332.5 231.0* 9.50 Zn, ppm 77.5 2.12 628.0 357.5 72.5 Cu, ppm 8.0 8.49 101.0 41.0 30.0 DCAD15, meq/kg 14.2 2.87 16.0 12.7 4.60
Table 3. Nutrient composition of milk replacer or calf starter without (Control) or Excell™1. Milk Treatment
0.05.
Milk Treatment Amino acid Replacer Std Dev Control Excell™ SEM N 2 2 2 2 DM, % 97.1 0.10 90.0 89.3 0.24 CP, % 23.1 0.32 23.9 24.4 0.20 Arg 0.50 0.04 1.40 1.35* 0.01 His 0.41 0.03 0.59 0.58 0.01 Ile 1.11 0.09 0.87 0.89 0.01 Leu 2.04 0.12 1.70 1.69 0.03 Lys 3.28 1.54 1.21 1.18 0.02 Met 0.91 0.08 0.38 0.36 0.01 Lys:Met 3.71 2.02 3.21 3.28 0.09 Phe 0.71 0.04 1.11 1.09 0.02 Trp 0.38 0.13 0.52 0.32** 0.01 Val 1.06 0.10 1.00 1.02 0.01 TESS 12.03 0.85 9.64 9.31 0.13 Ala 0.96 0.05 1.08 1.06 0.01 Asp 0.96 0.11 2.27 2.24 0.03 Cys 0.43 0.02 0.35 0.35 0.01 Gly 0.42 0.02 1.01 1.01 0.01 Glu 3.49 0.19 4.29 4.29 0.04 Pro 1.21 0.08 1.41 1.43 0.02 Ser 1.08 0.04 1.11 1.06 0.02 Tyr 0.63 0.01 0.80 0.77 0.03 TNESSAA 10.3 0.52 12.3 12.2 0.15 Total AA 22.3 0.33 21.9 21.5 0.27
Table 4. Amino acid composition of milk replacer or calf starter without (Control) or Excell™.
P < 0.05.
*Means differ within calf starter,
< 0.01.
**Means differ within calf starter, P
Table
Temperature, 0C Humidity, % Wind speed, km/h THI, 0C1 Rain, cm Week Max Mean Min Max Mean Min Max Mean Min Max Mean Min Mean Total 1 29.0 22.2 16.5 92.3 72.1 47.0 8.8 0.8 0.0 83.1 69.8 60.7 0.26 1.85 2 27.9 21.4 15.9 96.1 79.0 56.6 8.8 0.8 0.0 81.7 69.0 60.0 0.55 3.86 3 30.2 23.0 15.8 97.9 73.7 46.6 8.1 0.7 0.0 86.1 71.1 59.6 0.05 0.38 4 31.3 24.5 18.6 98.4 80.9 55.7 8.8 0.6 0.0 88.1 74.2 63.6 1.41 9.88 5 29.0 22.8 17.8 96.4 80.0 57.3 7.2 0.6 0.0 83.8 71.3 62.6 0.00 0.00 6 26.9 21.2 16.6 97.7 83.1 60.7 8.0 0.6 0.0 80.7 69.0 60.9 0.36 2.49 7 30.1 23.2 15.8 94.1 75.3 53.4 8.0 0.8 0.0 85.3 71.6 59.9 0.00 0.00 8 30.6 24.1 18.4 96.9 80.6 58.0 8.3 0.8 0.0 86.7 73.6 63.6 0.00 0.00 Mean 29.4 22.8 16.9 96.2 78.1 54.4 8.2 0.7 0.0 84.4 71.2 61.4 0.33 18.5 SD 3.17 2.63 2.88 3.69 7.04 9.72 2.34 0.32 0.00 5.77 4.32 3.96 1.31 1.31
5. Weather data for the 8 week experimental period of July 4, 2023 through August 29, 2023.
1Temperature humidity index.
1Probably of treatment and interaction of treatment with week effect, P <.
*Means within row differ, P < 0.05.
**Means within row differ, P < 0.01.
Treatment P <1 Measurement Control Excell™ SEM Trt Trt x week Calves, # 15 15 Lost 1 1 ----- ----- ----TSP, mg/mL 5.29 5.18 0.19 0.60 BW, kg Week 0, initial 47.0 47.0 2.00 0.15 0.09 Week 1 48.9 48.6 Week 2 50.6 49.3 Week 3 56.2 54.1 Week 4 60.8 58.3 Week 5 66.1 63.1 Week 6 70.0 65.3* Week 7 73.6 69.0* Week 8, final 79.2 72.5** Study average 61.4 58.6 1.86 BW gain, kg 32.2 25.6* 2.54 0.05 ADG, g/d Week 1 274.5 238.8 90.3 0.02 0.65 Week 2 240.8 89.8 Week 3 798.0 685.7 Week 4 657.1 606.1 Week 5 755.1 679.6 Week 6 555.1 322.5 Week 7 518.4 530.6 Week 8 804.1 500.0* Study ADG, g/d 575.4 456.6* 34.6 0.02 0 – 56 d ADG, g/d 575.4 456.6* 45.3 0.05
Table 6. Calves fed Control milk replacer and calf starter or fed Excell™ in milk replacer and calf starter.
1Probably of treatment and interaction of treatment with week effect, P <.
+Means within row differ, P < 0.10.
*Means within row differ, P < 0.05.
**Means within row differ, P < 0.01.
Treatment P <1 Measurement Control Excell™ SEM Trt Trt x week Calves, # 14 14 MR DMI, kg/d Weeks 1 & 2 0.55 0.55 Weeks 3, 4, & 5 0.83 0.83 Week 6 0.41 0.41 Total MR, kg 27.9 27.9 CS DMI, kg/d Week 1 0.03 0.02 0.09 0.07 0.14 Week 2 0.08 0.04 Week 3 0.14 0.08 Week 4 0.23 0.11 Week 5 0.38 0.21 Week 6 0.78 0.49* Week 7 1.61 1.22** Week 8 1.89 1.56** Study average 0.64 0.47+ 0.08 0.07 Total CS DMI, kg 36.1 25.4* 3.21 0.02 Days to achieve 0.9 kg/d for 3 d 41.0 44.7* 1.20 0.03 Total DMI, kg/d Week 1 0.58 0.57 0.09 0.07 0.14 Week 2 0.63 0.59 Week 3 0.97 0.90 Week 4 1.06 0.94 Week 5 1.20 1.03 Week 6 1.19 0.90* Week 7 1.61 1.22** Week 8 1.89 1.56** Study average 1.14 0.97+ 0.08 0.07 Total DMI, kg 56d 64.0 54.1* 3.21 0.04
Table 7. Calves fed Control milk replacer and calf starter or fed Excell™ in milk replacer and calf starter.
1Probably of treatment and interaction of treatment with week effect, P <. *Means within row differ, P < 0.05. **Means within row differ, P < 0.01.
Treatment P <1 Measurement Control Excell™ SEM Trt Trt x week Gain/DMI, kg/kg Week 1 0.462 0.422 0.088 0.15 0.62 Week 2 0.382 0.142* Week 3 0.802 0.757 Week 4 0.623 0.654 Week 5 0.621 0.657 Week 6 0.440 0.295 Week 7 0.296 0.359 Week 8 0.406 0.368 Study average 0.504 0.457 0.026 Study 0 - 56 d 0.497 0.477 0.025 0.53
Table 8. Feed conversion of calves fed Control milk replacer and calf starter or fed Excell™ in milk replacer and calf starter.
Treatment P <1 Measurement Control Excell™ SEM Treatment Calves, # 14 14 Heart girth Initial, cm 80.6 81.4 0.61 0.30 Final, cm 99.2 96.7 1.25 0.18 Gain, cm 18.6 15.3 0.87 0.03 Withers height Initial, cm 78.6 75.5 1.79 0.14 Final, cm 88.6 85.7 0.81 0.01 Gain, cm 10.1 10.2 2.20 0.98 Body length Initial, cm 55.4 53.2 0.52 0.01 Final, cm 65.9 64.8 0.82 0.17 Gain, cm 10.5 11.4 0.80 0.40 Hip height Initial, cm 83.5 81.8 0.82 0.15 Final, cm 92.4 91.1 0.75 0.11 Gain, cm 8.88 9.16 0.80 0.78 Hip width Initial, cm 21.4 21.7 0.21 0.19 Final, cm 25.7 25.0 0.38 0.09 Gain, cm 4.25 3.27 0.33 0.03
Table 9. Frame measurements for calves fed Control milk replacer and calf starter or fed Excell™ in milk replacer and calf starter.
1Probably of treatment effect, P <.
Treatment P <1 Measurement Control Excell™ SEM Treatment Trt x week Calves, # 14 14 Total days of fecal scores Score = 0 28.0 27.9 1.49 0.96 Score = 1 6.4 7.1 0.90 0.54 Score = 2 3.6 4.2 0.71 0.46 Score = 3 4.1 2.9 0.74 0.19 Fecal scores, d/wk Score = 0, d 4.68 4.65 0.24 0.93 0.88 Score = 1, d 1.06 1.18 0.14 0.49 0.46 Score = 2, d 0.60 0.69 0.10 0.47 0.83 Score = 3, d 0.68 0.48 0.12 0.18 0.79 Total days of nasal scores Score = 0 38.3 38.5 0.86 0.87 Score = 1 2.9 2.9 0.79 1.00 Score = 2 0.8 0.5 0.23 0.38 Score = 3 Nasal score, d/wk Score = 0 6.4 6.4 0.15 0.86 0.14 Score = 1 0.49 0.49 0.14 1.00 0.19 Score = 2 0.13 0.08 0.04 0.39 0.44 Score = 3 Total days of eye/ear scores Score = 0 39.6 36.5 1.38 0.06 Score = 1 1.8 3.9 0.89 0.05 ----Score = 2 0.5 1.2 0.45 0.20 Score = 3 0.07 0.36 0.20 0.19 Eye/Ear Score, d/wk Score = 0 6.6 6.1 0.20 0.03 0.03 Score = 1 0.30 0.65 0.13 0.03 0.01 Score = 2 0.08 0.20 0.06 0.13 0.58 Score = 3 0.01 0.06 0.04 0.25 0.04
Table 10. Fecal, nasal, and eye/ear scores for calves fed Control milk replacer and calf starter or fed Excell™ in milk replacer and calf starter.
1Probably of treatment and interaction of treatment with week effect, P <.
Table 11. Blood beta-hydroxy butyrate concentrations (BHBA) from calves fed Control milk replacer and calf starter or fed Excell™ in milk replacer and calf starter.
1Probably of treatment and interaction of treatment with week effect, P <.
Treatment P <1 Measurement Control Excell™ SEM Trt Trt x week Calves, # 14 14 BHBA, mg/Dl Week 3 31.3 31.8 5.16 0.07 0.83 Week 4 40.4 35.0 5.16 Week 5 40.4 36.6 5.16 Week 6 56.6 45.2 5.16 Week 7 69.9 59.1 5.16 Week 8 112.0 109.9 5.16 Study average 58.4 52.9 2.09
Table 12. Parameters measured by rumen bolus for calves fed milk replacer and calf starter without (Control) or with Excell™ during the first 8 weeks of life (i.e. 0-8 weeks of age).
P <1
Probability of treatment and interaction of treatment by week.
Treatment P <1 Measurement Control Excell™ SEM Trt Trt x week Calf, # 9 8 Temperature, 0C 38.4 38.4 1.03 1.00 1.00 Days > 39.5 0C 33.2 32.1 1.36 0.13 Rumination, index 236.6 266.6 30.08 0.45 0.95 Activity 0.14 0.13 0.01 0.25 0.90 THI, 52.8 52.8 0.01 0.17 0.71 Air temperature, 0C 22.9 22.9 0.004 0.69 0.98 Humidity, % 77.3 77.4 0.02 0.18 0.84 Water temp, 0C 21.9 21.9 0.002 0.58 0.81 Water, L 4.80 4.49 0.59 0.70 0.83
1. 45 50 55 60 65 70 75 80 0 1 2 3 4 5 6 7 8 Body weight , kg Experimental week Control Excel * Body weight for calves fed Control orExcel Treatment, P < 0.15: Treatment by week interac�on, P < 0.09. Excell™
Figure
0 0 0 2 0 4 0 6 0 8 1 0 1 2 1 4 1 6 1 8 0 1 2 3 4 5 6 7 8 Calf starter dry matter intake , kg / d Experimental week Control Excel *
Figure 2.
Calf starter dry ma�er intake for calves fed Control or Excel Treatment, P < 0.07; Treatment by week interac�on, P < 0.14. Excell™
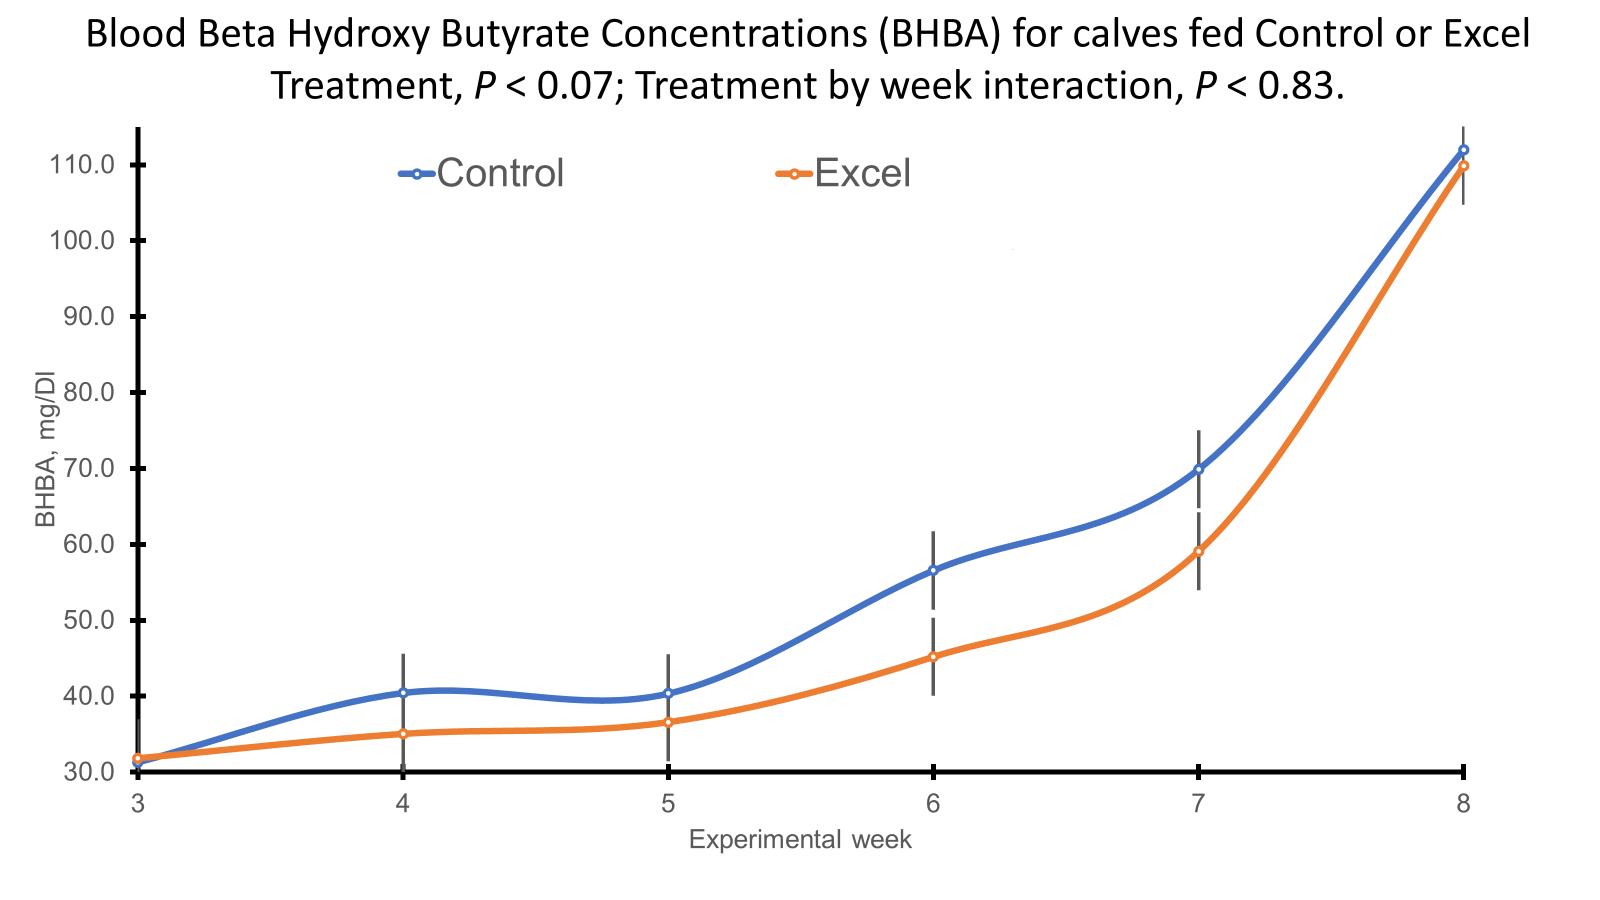 Figure 3.
Excell™
Figure 3.
Excell™
Table of weekly least squares means for CCR-06.
Phase 1. 0 to 8 weeks.
Phase 2. Straight means versus covariate adjusted means for body weight.
Body weight, kg Treatment Week Control Excell™ 0 47.0 47.0 1 48.9 48.6 2 50.6 49.3 3 56.2 54.1 4 60.8 58.3 5 66.1 63.1 6 70.0 65.3* 7 73.6 69.0* 8 79.2 72.5** Study mean 61.4 58.6 BW gain, kg 32.2 25.6*
Body weight Straight means Covariate adjusted means Treatment Treatment Week/Week1 Control Excell™ Control Excell™ 8 or 0 79.2 72.5 72.1 78.6 10 or 2 88.1 84.3 81.7 90.7 12 or 4 106.7 104.3 100.3 110.7 14 or 6 115.7 114.8 109.3 121.2 16 or 8 133.3 131.1 127.0 137.5 Mean, kg 104.4 101.4 98.1 107.8 BW gain, kg 54.1 58.6 48.5 65.1
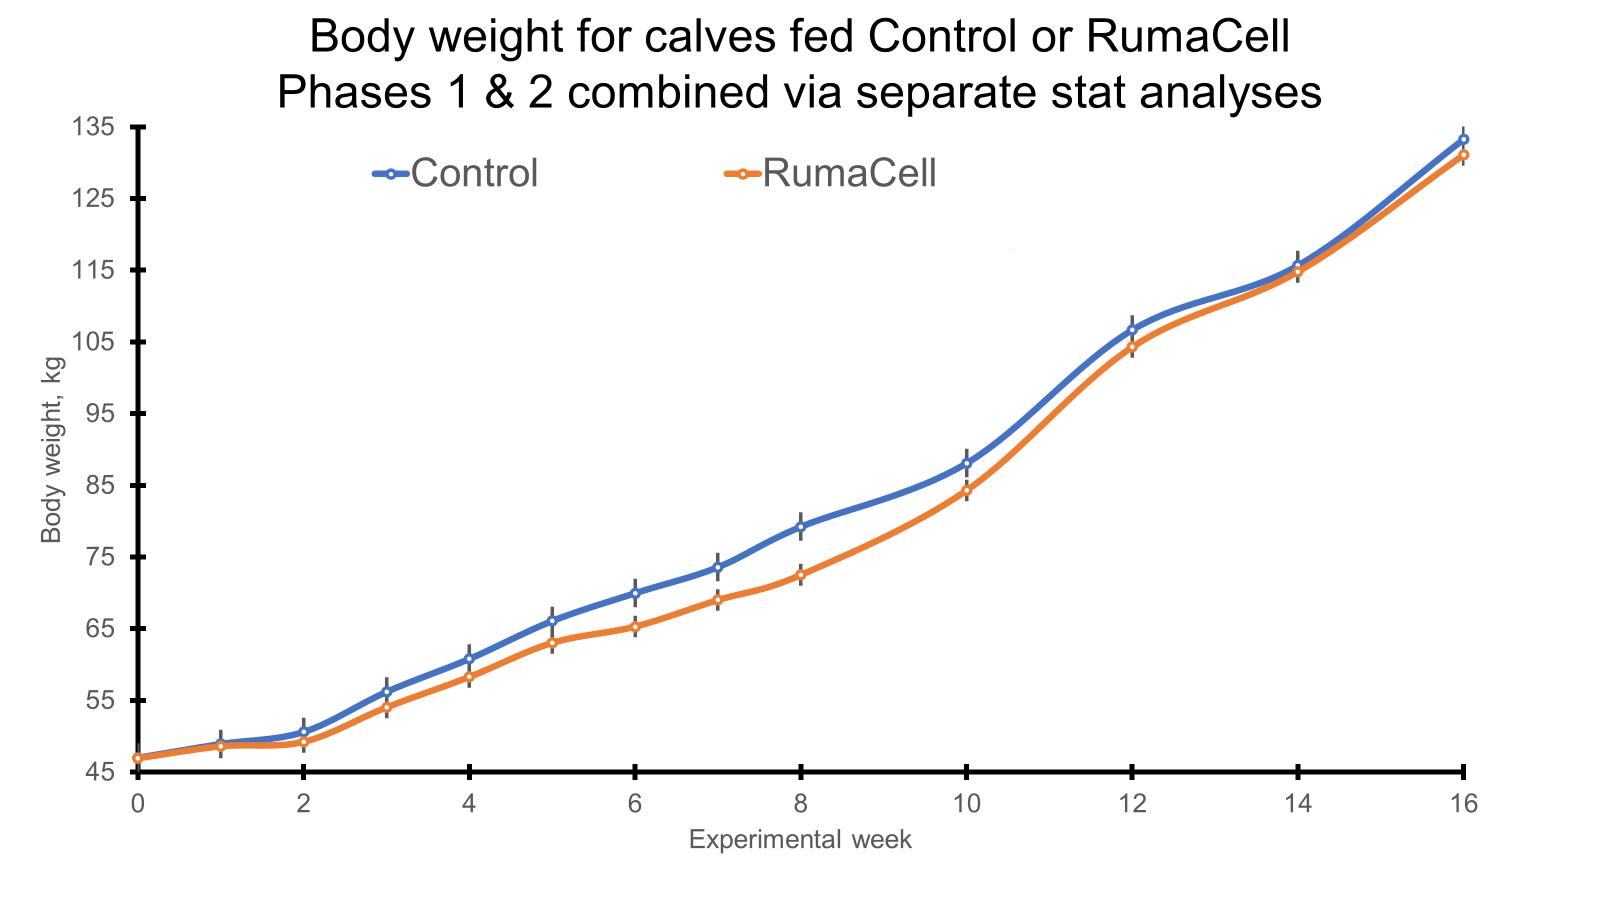
Excell™
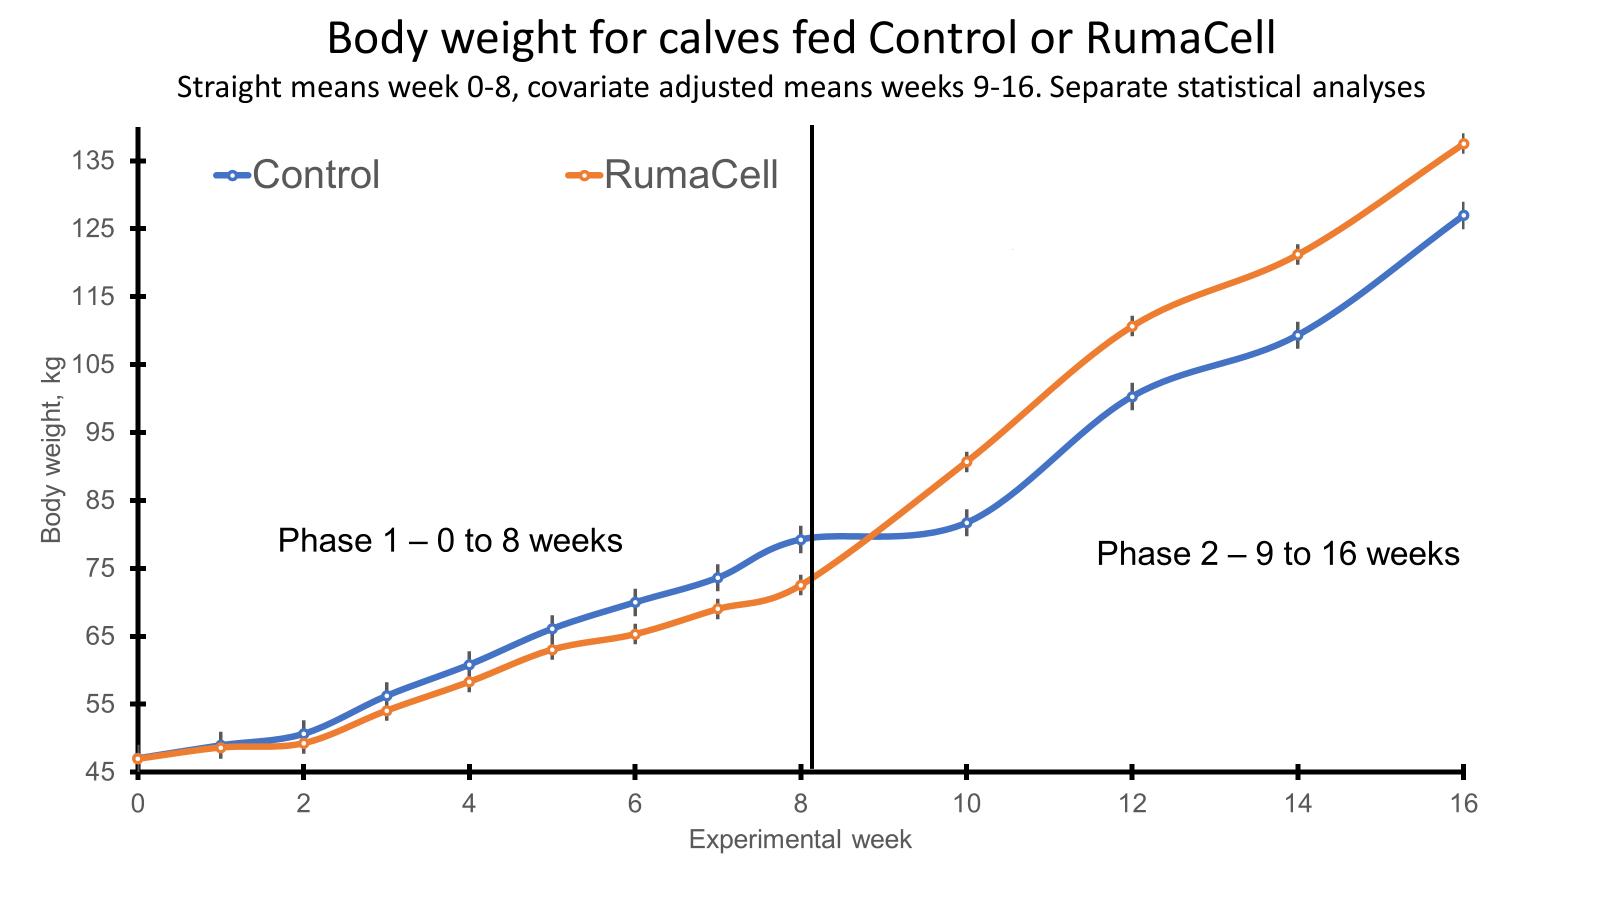
Excell™
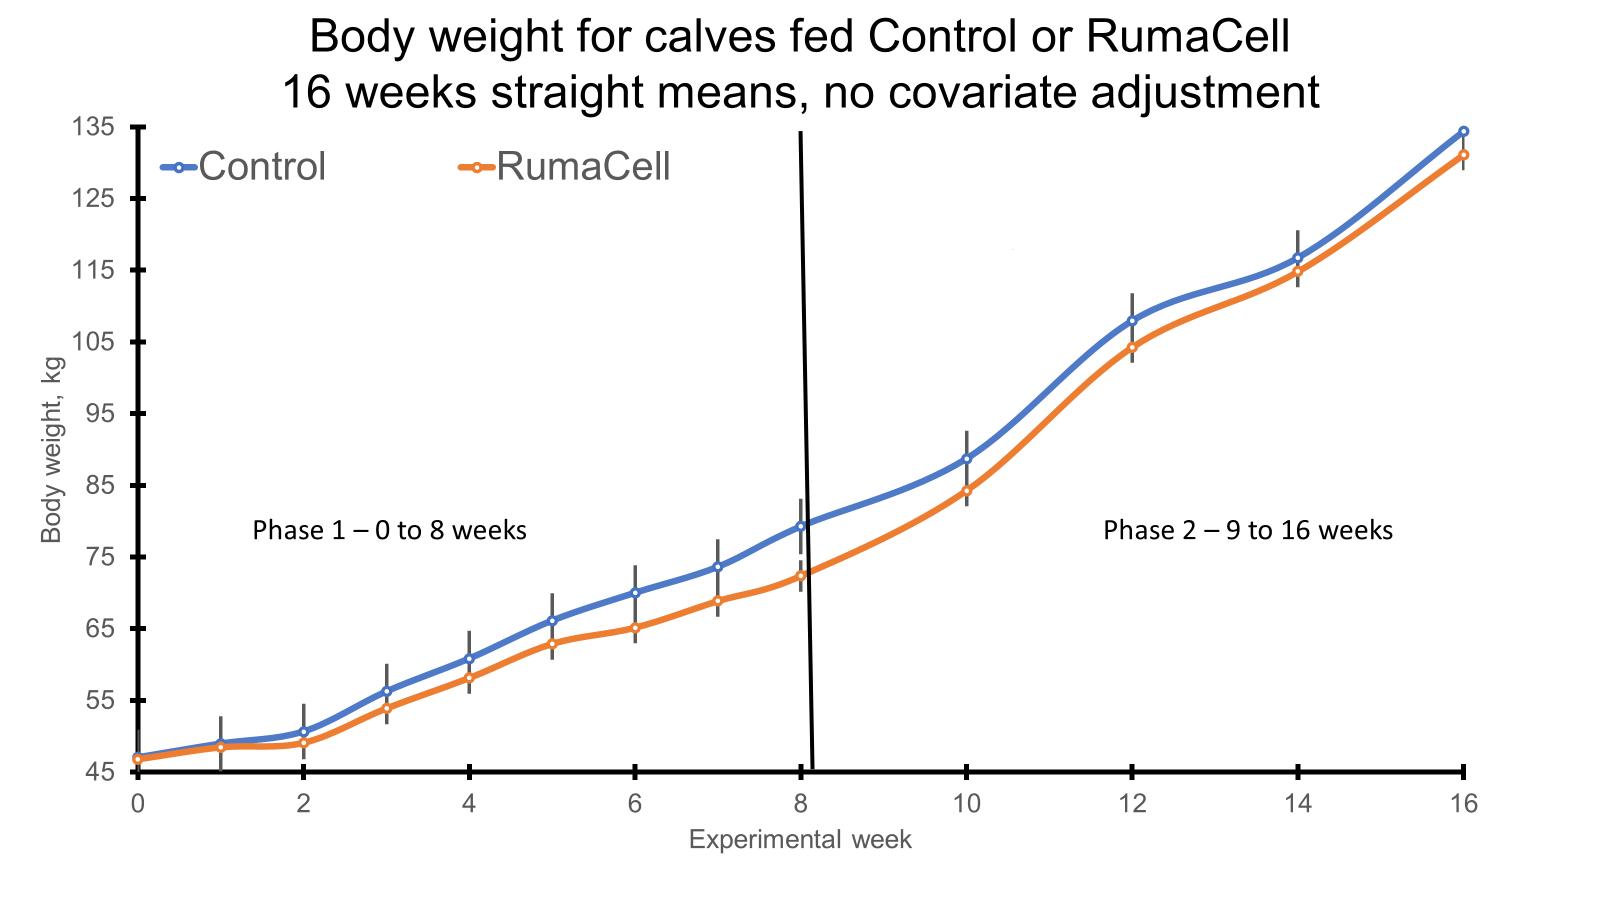
Excell™
The Next Generation of Animal Health
Contact: Matt Jones 208-490-1662 matt.jones@keyag.com Michael Officer 314-308-0348 michael.officer@pacer.technology