THE BEACON REPORT
March 2024

COMPILED BY DONNIE MONTAGNER
STATE CERTIFIED RESIDENTIAL APPRAISER
donnie@beaconappraisal.net
Information obtained from the MLS of Central Oregon
With permission from COAR

BendareaSFR-NumberofSales
FromMLSforBendarea.SingleFamilyResidential,notincludingcondominiums,manufacturedhomes,andacreageproperties.Datasubjectto change
BendareaSFR-DaysonMarketforSoldProperties
FromMLSforBendarea.SingleFamilyResidential,notincludingcondominiums,manufacturedhomes,andacreageproperties.Datasubjectto change
*Inventory= Current listings divided by
12
rounded
the nearest
3/6/2024 3/6/2024 BEACONREPORT Page 1 - Beacon Report © Central Oregon Association of Realtors. All Rights Reserved. For the exclusive use of COAR members and theirdesignated clients only. $575 $590 $651 $628 $640 $650 $635 $650 $645 $683$675$683 $740 $773$770 $740 $722 $762 $717$725 $680 $696$678$685 $660 $685 $669 $745 $785$800 $742$750$735$730$725 $700 $682 $450 $500 $550 $600 $650 $700 $750 $800 $850 $900 MedianPrice Month FromMLSforBendarea.SingleFamilyResidential,notincludingcondominiums,manufacturedhomes,andacreageproperties.Datasubjecttochange
Note:Medianisthemidpointwithhalfaboveandhalfbelow BeaconAppraisalGroupLLC 117 175 237 228 247246 229232 210 197 171 131131 202 183 218 194 175189182 160 137 98 84 112 125129 157 172 141 156 135 121114 9089 106 75 125 175 225 275 325 Number of Sales
prior
months' sales,
to
whole month.
BendareaSFR-MedianPriceinThousands
Month
Inventory*asofreportdate=1.5Month 444445678 1112 9 44456 10 15 20 28 18 30 36 51 13 10 7 13 9 161717 31 29 43 40 0 10 20 30 40 50 60 Feb-21Mar-21Apr-21May-21Jun-21Jul-21Aug-21Sep-21Oct-21Nov-21Dec-21Jan-22Feb-22Mar-22Apr-22May-22Jun-22Jul-22Aug-22Sep-22Oct-22Nov-22Dec-22Jan-23Feb-23Mar-23Apr-23May-23Jun-23Jul-23Aug-23Sep-23Oct-23Nov-23Dec-23Jan-24Feb-24 Medain Days on Market Month
Totalsold12monthspriortoreportdate=1566Totalcurrentlylisted=205
BeaconAppraisalGroupLLC BeaconAppraisalGroupLLC
Page 2 - Beacon Report3/6/2024 69 56 90 56 59 47 545251 32 29 37 79 87 5455 71 4950 3937 24 16 22 29 18 33 53 61 28 40 5051 34 31 25 53 0 20 40 60 80 100 Building Permits Month NEWSINGLEFAMILYDETACHED-Notincludingsinglefamilyattached,multifamilyormobilehomes BendareaSFR-BuildingPermits BeaconAppraisalGroupLLC 80 125 174171175178 156167162 146 131 105103 149 130 158 139 115 134129 117 7267 56 7577 8985 105 97 105 7679 67 5252 66 31 475550 69 625860 38442934374550564352474338552625323733 6059 4043463439283031 0 50 100 150 200 250 Transactions Month BendareaSFR-ConventionalandCashTransactions ConventionalCash BeaconAppraisalGroupLLC 0.4 0.3 0.50.5 0.7 1111 0.6 0.4 0.3 0.4 0.6 1 1.3 1.9 2.061.9522 1.51.5 111 1.4 1.7 2222222 1.51.5 0 0.5 1 1.5 2 2.5 3 Months Month NEWSINGLEFAMILYDETACHED-Notincludingsinglefamilyattached,multifamilyormobilehomes BendareaSFR-MonthsSupply BeaconAppraisalGroupLLC
Page 3 - Beacon Report 3/6/2024 $297$292 $325 $315$325 $329$325 $322 $330$335 $357$356$355 $389$383$374$368$380 $355$359 $339 $352 $340$335 $315 $335 $347 $371$370$370 $356 $379 $367$363$359 $349 $319 $225 $275 $325 $375 $425 Median Price per SF Month FromMLSforBendarea.SingleFamilyResidential,notincludingcondominiums,manufacturedhomes,andacreageproperties.Datasubjecttochange BendareaSFR-MedianSalesPriceperSF BeaconAppraisalGroupLLC
#Saleslastmonth(February)

#Saleslast12months
CurrentlyListed
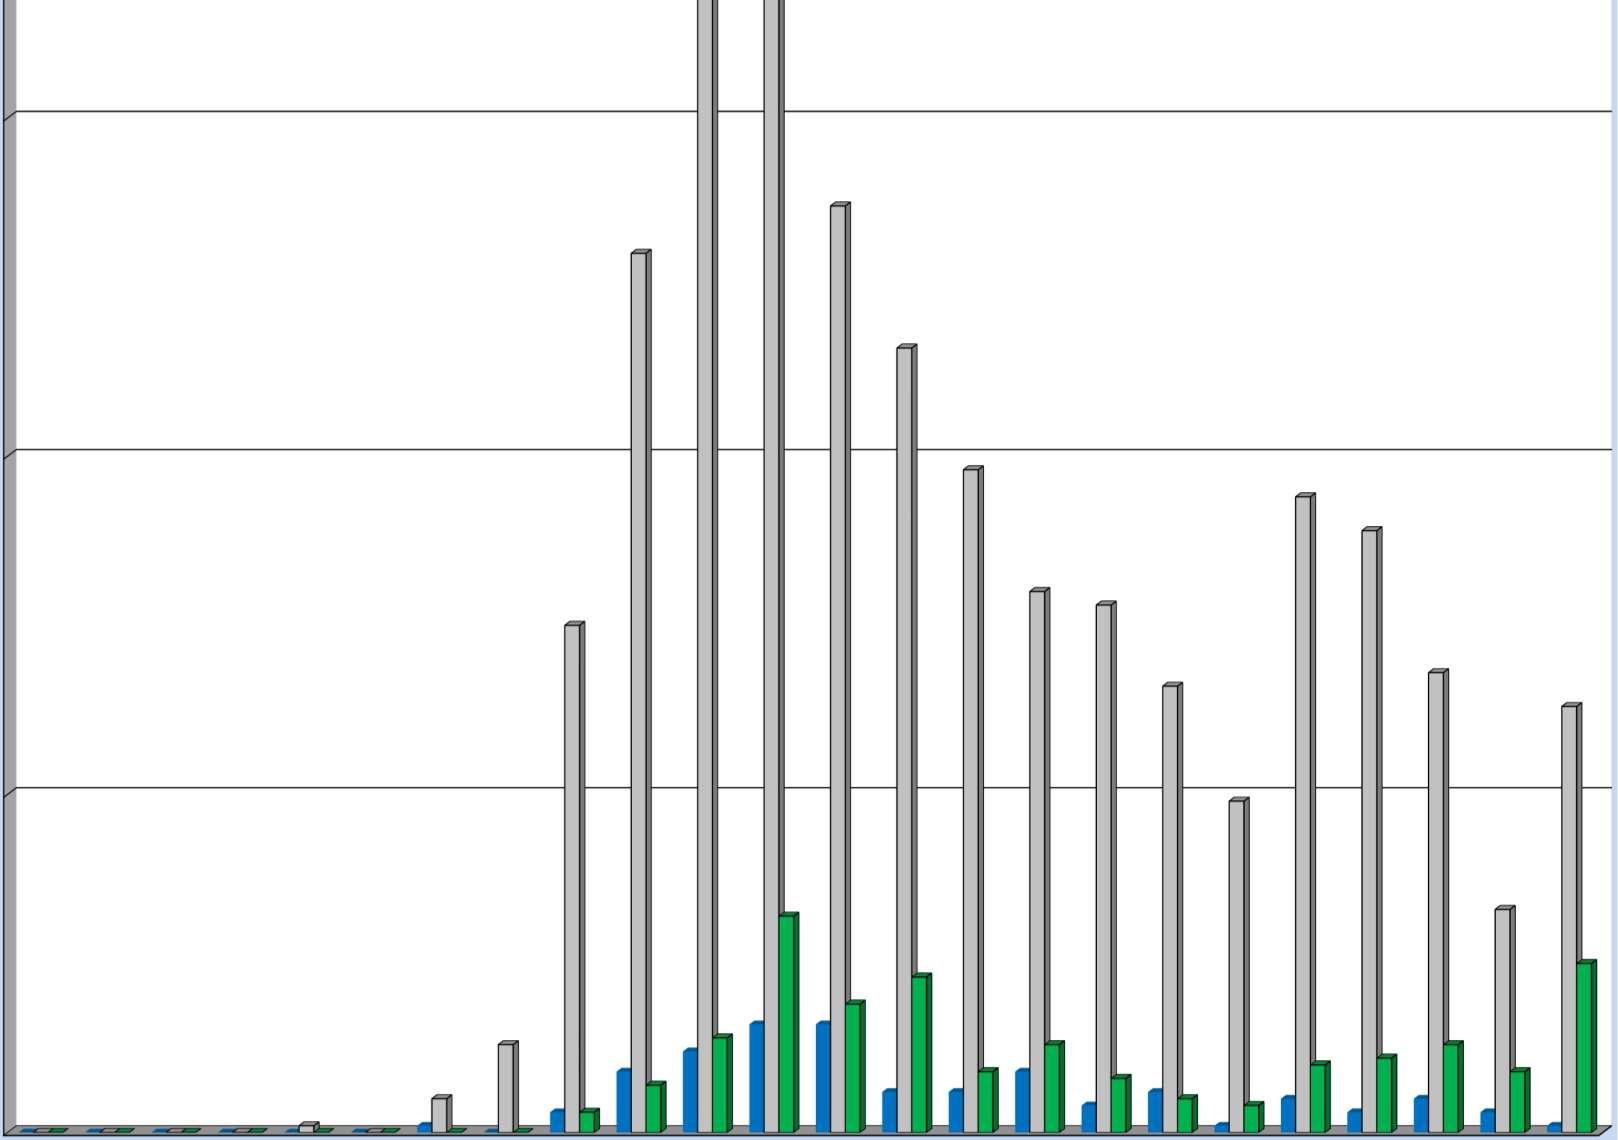
Page 4 - Beacon Report 3/6/2024 FromMLS for Bend area. Single family residential, not including condos, townhomes, manufactured homes and acreage. Data subject to change. 0 50 100 150 200 250 0$100K $100$150K $150$200K $200$250K $250$300K $300$350K $350$400K $400$450K $450$500K $500$550K $550$600K $600$650K $650$700K $700$750K $750$800K $800$850K $850$900K $900$950K $950$1Mill $1M$1.2 $1.2M1.4M $1.4M$1.6M 1.6M$1.8M 1.8M+ 00000010 3 9 12 1616 66 9 4 6 1 5 3 5 3 1 00 0010 5 13 75 130 199 172 137 116 98 80 78 66 49 94 89 68 33 63 00000000 3 7 14 32 19 23 9 13 8 5 4 101113 9 25
Bend area SFR:# Sales vs. Current Listings
BeaconAppraisalGroupLLC
RedmondareaSFR-NumberofSales
RedmondareaSFR-DaysonMarketforSoldProperties
*Inventory = Current listings divided by prior 12 months' sales, rounded to the nearest whole month. Note: Prior to April 2020, the Days on Market represented the time from the list date to the sales date. As of April 2020, the Days on Market represent the time from the listing date to contract date only. Page 5 - Beacon Report 3/6/2024 $373 $412$413 $443$451$436$450$450$449$450 $467 $500 $483 $520 $538 $519 $530 $505 $542 $525 $478 $453 $425$420 $440$439 $469$472$473 $500$505$506 $520 $499$510$507$511 $300 $350 $400 $450 $500 $550 $600 Median Price Month FromMLSforRedmondarea.Singlefamilyresidential,notincludingcondos,townhomes,manufacturedhomesandacreage.Datasubjecttochange
Note:Medianisthemidpointwithhalfaboveandhalfbelow 62 8991 96 105 117 100 8885 7774 4952 105 66 85 71 79 57 45 73 60 333537 42 50 58 74 6665 54 41 36 27 36 49 25 45 65 85 105 125 Number of Sales Month FromMLSforRedmondarea.Singlefamilyresidential,notincludingcondos,townhomes,manufacturedhomesandacreage.Datasubjecttochange
RedmondareaSFR-MedianPriceinTHOUSANDS
Totalsoldduring12monthspriortoreportdate=614Totalcurrentlylisted=124 Inventory*asofreportdate=2Months 4445446566 10 14 74666 10 1918 24 35 4042 56 27 19 28 161416 22 34 23 33 41 28 0 10 20 30 40 50 60 70 Median Days on Market Month FromMLSforRedmondarea.Singlefamilyresidential,notincludingcondos,townhomes,manufacturedhomesandacreage.Datasubjecttochange
BeaconAppraisalGroupLLC BeaconAppraisalGroupLLC BeaconAppraisalGroupLLC
RedmondareaSFR-ConventialandCashTransactions

RedmondareaSFR-BuildingPermits
RedmondareaSFR-MonthsofInventory

Page 6 - Beacon Report3/6/2024 41 35 41 51 42 62 52 29 24 20 1715 25 19 23 31 20 6 14 6 10 2220 28 18 30 26 35 32 23 28 32 28 21 12 1717 0 10 20 30 40 50 60 70 Number of Permits Month NEWSINGLEFAMILYDETACHED-Notincludingsinglefamilyattached,multifamilyormobilehomes
BeaconAppraisalGroupLLC 0.30.30.3 0.50.5 0.7 111 0.70.40.50.50.6 0.830.9 1.2 1.71.8 2222 1.51.41.61.5 222 33333 22 0 0.5 1 1.5 2 2.5 3 3.5 4 4.5 5 Months Month NEWSINGLEFAMILYDETACHED-Notincludingsinglefamilyattached,multifamilyormobilehomes
36 6870 62 76 83 73 65 57 47 50 3938 64 51 58 45 50 37 27 45 32 16 19 222324 35 42 45 31 28 24 21 11 17 22 18 14 11 182018 23 7 1517 10 5 11 21 11 15 10 1614 8 17 14 11 66 11131013 7 19 119108812 0 10 20 30 40 50 60 70 80 90 100 Transactions Month
ConventionalCash
Page 7 - Beacon Report 3/6/2024 $218 $240$243$247$242$250 $268$268$271 $284 $264$266 $288$288 $326 $315$315 $273 $303$302 $292$292 $300 $267 $280 $304 $298$290$293 $317 $303$298 $278 $295$299$292 $286 $190 $210 $230 $250 $270 $290 $310 $330 $350 Median Price per Sq-Ft Month FromMLSforRedmondarea.Singlefamilyresidential,notincludingcondos,townhomes,manufacturedhomesandacreage.Datasubjecttochange RedmondareaSFR-MedianSalePriceperSq-Ft
#Saleslastmonth(February)

#Saleslast12months
CurrentlyListed

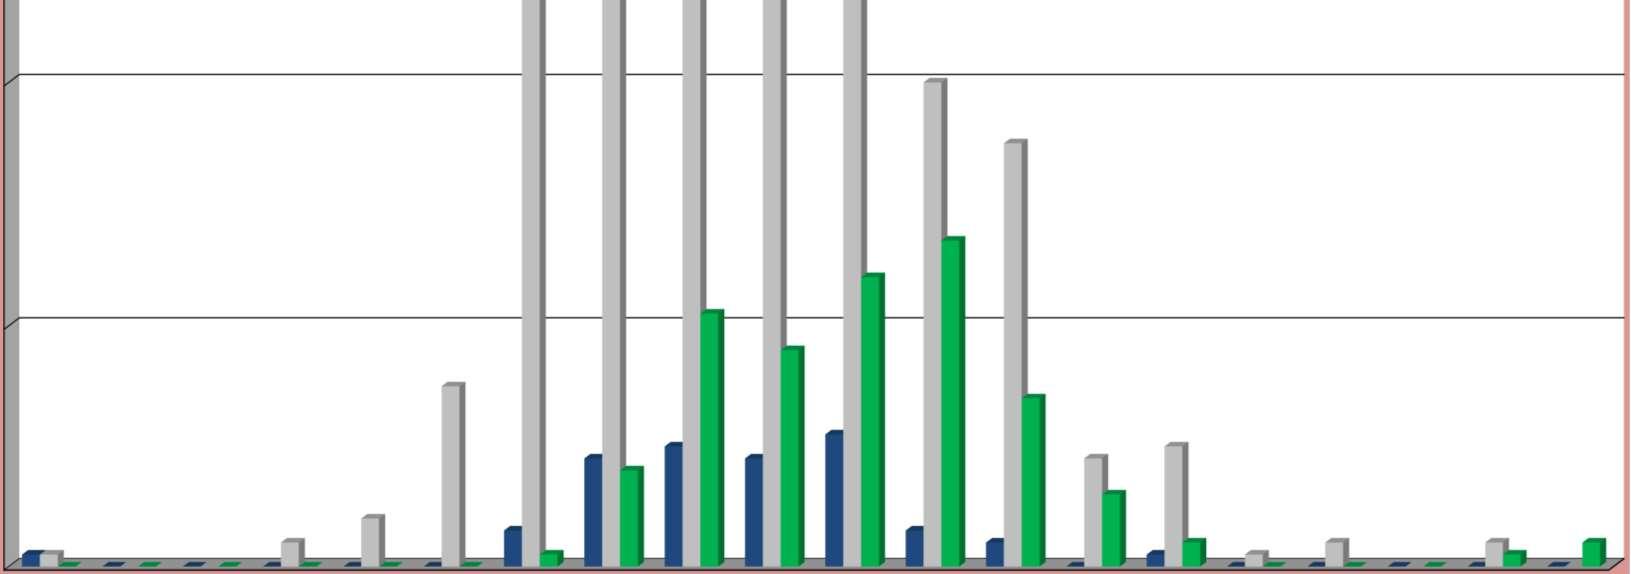
Page 8 - Beacon Report3/6/2024 Redmond area SFR: # Sales vs. Current Listings 0 20 40 60 80 100 120 140 0-$100K$100$150K $150$200K $200$250K $250$300K $300$350K $350$400K $400$450K $450$500K $500$550K $550$600K $600$650K $650$700K $700$750K $750$800K $800$850K $850$900K $900$950K $950-$1 Mill $1Mill+ 1 00000 3 9 10 9 11 3 2 0 1 00000 1 00 2 4 15 59 118 128 104 84 40 35 9 10 1 2 0 2 0 000000 1 8 21 18 24 27 14 6 2 000 1 2
BeaconAppraisalGroup LLC
February
Median Price SFR in Thousands = $965
Number of SFR Sales = 6
Days on Market for Sold SFR = 28
Current Inventory* = 1
Sunriver
Median Price SFR in Thousands = $923
Number of SFR Sales = 4
Days on Market for Sold SFR = 4
Current Inventory* = 3Months
LaPine
Median Price SFR in Thousands = $475
Number of SFR Sales = 6
Days on Market for Sold SFR = 43
Current Inventory* = 4Months
JEFFERSON COUNTY
Median Price SFR in Thousands = $327
Number of SFR Sales = 4
Days on Market for Sold SFR = 102
Current Inventory* = 4Months
CROOK COUNTY
Median Price SFR in Thousands = $397
Number of SFR Sales = 20
Days on Market for Sold SFR = 74
Current Inventory* = 3Months
FromMLS system. Single family residential, not including condos, townhomes, manufactured homes and acreage. Data subject to change. *Inventory = Current listings divided by prior 12 months' sales, rounded to the nearest whole month. Page 9 - Beacon Report
SmallerMarketMonthlyReportfortheMonthof
Months
3/6/2024 The following graphs, #13 - #27, cover smaller market areas and therefore the graphs use quarterly figures. However, the numbers on this page represent the most recent month's sales data for these areas.
BeaconAppraisalGroupLLC
SISTERS
SistersareaSFR-MedianDaysonMarket
Page 10 - Beacon Report3/6/2024 $296 $189$215 $292 $173$195 $239 $210$191 $240$267$260 $233 $273 $325$323 $239 $290$294$310$310$310 $349$337$355$380$340$363$348 $410$411 $384$379$427$417$450$398$430$447$435$400$393$456$459$479 $510 $585 $645$667$668 $623 $620 $585 $694$668$679 $120 $220 $320 $420 $520 $620 $720 1st Q 2010 2nd Q 2010 3rd Q 2010 4th Q 2010 1st Q 2011 2nd Q 2011 3rd Q 2011 4th Q 2011 1st Q 2012 2nd Q 2012 3rd Q 2012 4th Q 2012 1st Q 2013 2nd Q 2013 3rd Q 2013 4th Q 2013 1st Q 2014 2nd Q 2014 3rd Q 2014 4th Q 2014 1st Q 2015 2nd Q 2015 3rd Q 2015 4th Q 2015 1st Q 2016 2nd Q 2016 3rd Q 2016 4th Q 2016 1st Q 2017 2nd Q 2017 3rd Q 2017 4th Q 2017 1st Q 2018 2nd Q 2018 3rd Q 2018 4th Q 2018 1st Q 2019 2nd Q 2019 3rd Q 2019 4th Q 2019 1st Q 2020 2nd Q 2020 3rd Q 2020 4th Q 2020 1st Q 2021 2nd Q 2021 3rd Q 2021 4th Q 2021 1st Q 2022 2nd Q 2022 3rd Q 2022 4th Q 2022 1st Q 2023 2nd Q 2023 3rd Q 2023 4th Q 2023 Median Price Quarter FromMLSforSistersarea.Singlefamilyresidential,notincludingcondos,townhomes,manufacturedhomesandacreage.Datasubjecttochange SistersareaSFR-MedianPriceinTHOUSANDS BeaconAppraisalGroupLLC 1926242322192827272724 52 16 22 35 44 32 20 383841 17 474846 24 45 54 45 36 5150 63 33 42 58 49 3936 68 3837 5153 43 38 46 3637 26 32 41 47 0 10 20 30 40 50 60 70 80 90 100 4th Q 2010 1st Q 2011 2nd Q 2011 3rd Q 2011 4th Q 2011 1st Q 2012 2nd Q 2012 3rd Q 2012 4th Q 2012 1st Q 2013 2nd Q 2013 3rd Q 2013 4th Q 2013 1st Q 2014 2nd Q 2014 3rd Q 2014 4th Q 2014 1st Q 2015 2nd Q 2015 3rd Q 2015 4th Q 2015 1st Q 2016 2nd Q 2016 3rd Q 2016 4th Q 2016 1st Q 2017 2nd Q 2017 3rd Q 2017 4th Q 2017 1st Q 2018 2nd Q 2018 3rd Q 2018 4th Q 2018 1st Q 2019 2nd Q 2019 3rd Q 2019 4th Q 2019 1st Q 2020 2nd Q 2020 3rd Q 2020 4th Q 2020 1st Q 2021 2nd Q 2021 3rd Q 2021 4th Q 2021 1st Q 2022 2nd Q 2022 3rd Q 2022 4th Q 2022 1st Q 2023 2nd Q 2023 3rd Q 2023 4th Q 2023 Number of Sales Quarter FromMLSforSistersarea.Singlefamilyresidential,notincludingcondos,townhomes,manufacturedhomesandacreage.Datasubjecttochange SistersareaSFR-NumberofSales Totalsoldduring12monthspriortoreportdate=134Totalcurrentlylisted=15 BeaconAppraisalGroupLLC 146 169 154 123 161 236 205 76 122 158 119 94 127 167 100 87 123 170 131 89 155149 185 131 116 99 64 84 126 112 71 102 119118 95 81 108 137 2119121545122310 44 62 171817 0 50 100 150 200 250 4th Q 2010 1st Q 2011 2nd Q 2011 3rd Q 2011 4th Q 2011 1st Q 2012 2nd Q 2012 3rd Q 2012 4th Q 2012 1st Q 2013 2nd Q 2013 3rd Q 2013 4th Q 2013 1st Q 2014 2nd Q 2014 3rd Q 2014 4th Q 2014 1st Q 2015 2nd Q 2015 3rd Q 2015 4th Q 2015 1st Q 2016 2nd Q 2016 3rd Q 2016 4th Q 2016 1st Q 2017 2nd Q 2017 3rd Q 2017 4th Q 2017 1st Q 2018 2nd Q 2018 3rd Q 2018 4th Q 2018 1st Q 2019 2nd Q 2019 3rd Q 2019 4th Q 2019 1st Q 2020 2nd Q 2020 3rd Q 2020 4th Q 2020 1st Q 2021 2nd Q 2021 3rd Q 2021 4th Q 2021 1st Q 2022 2nd Q 2022 3rd Q 2022 4th Q 2022 1st Q 2023 2nd Q 2023 3rd Q 2023 4th Q 2023 Median Days on Market Quarter FromMLSforSistersarea.Singlefamilyresidential,notincludingcondos,townhomes,manufacturedhomesandacreage.Datasubjecttochange
BeaconAppraisalGroupLLC
Quarter
FromMLSforSunriverarea.Singlefamilyresidential,notincludingcondos,townhomes,manufacturedhomesandacreage.Datasubjecttochange
SunriverareaSFR-DaysonMarketForSoldProperties
Quarter
FromMLSforSunriverarea.Singlefamilyresidential,notincludingcondos,townhomes,manufacturedhomesandacreage.Datasubjecttochange
Page 11 - Beacon Report3/6/2024 $379 $330 $383$365 $420$350$324$343$365$367$351$350$370$392$375$352$385$353$368$400$384$428$385$389$435 $490$484 $410$425 $493 $535$485$475$504$523$504$539$506$514$550 $725 $784 $855$831$865$885 $1,000 $950 $840 $923 $877 $965$976 $300 $400 $500 $600 $700 $800 $900 $1,000 $1,100 4th Q 2010 1st Q 2011 2nd Q 2011 3rd Q 2011 4th Q 2011 1st Q 2012 2nd Q 2012 3rd Q 2012 4th Q 2012 1st Q 2013 2nd Q 2013 3rd Q 2013 4th Q 2013 1st Q 2014 2nd Q 2014 3rd Q 2014 4th Q 2014 1st Q 2015 2nd Q 2015 3rd Q 2015 4th Q 2015 1st Q 2016 2nd Q 2016 3rd Q 2016 4th Q 2016 1st Q 2017 2nd Q 2017 3rd Q 2017 4th Q 2017 1st Q 2018 2nd Q 2018 3rd Q 2018 4th Q 2018 1st Q 2019 2nd Q 2019 3rd Q 2019 4th Q 2019 1st Q 2020 2nd Q 2020 3rd Q 2020 4th Q 2020 1st Q 2021 2nd Q 2021 3rd Q 2021 4th Q 2021 1st Q 2022 2nd Q 2022 3rd Q 2022 4th Q 2022 1st Q 2023 2nd Q 2023 3rd Q 2023 4th Q 2023 Median Price Quarter FromMLSforSunriverarea.Singlefamilyresidential,notincludingcondos,townhomes,manufacturedhomesandacreage.Datasubjecttochange
BeaconAppraisalGroupLLC 222126252522 36 4043 22 38 49 39 20 394341 34 46 56 64 38 73 47 52 40 51 45 41 33 56 50 61 30 50 46 52 31 45 83 47 36 51 56 47 3331 49 202023 3330 0 10 20 30 40 50 60 70 80 90 100 4th Q 2010 1st Q 2011 2nd Q 2011 3rd Q 2011 4th Q 2011 1st Q 2012 2nd Q 2012 3rd Q 2012 4th Q 2012 1st Q 2013 2nd Q 2013 3rd Q 2013 4th Q 2013 1st Q 2014 2nd Q 2014 3rd Q 2014 4th Q 2014 1st Q 2015 2nd Q 2015 3rd Q 2015 4th Q 2015 1st Q 2016 2nd Q 2016 3rd Q 2016 4th Q 2016 1st Q 2017 2nd Q 2017 3rd Q 2017 4th Q 2017 1st Q 2018 2nd Q 2018 3rd Q 2018 4th Q 2018 1st Q 2019 2nd Q 2019 3rd Q 2019 4th Q 2019 1st Q 2020 2nd Q 2020 3rd Q 2020 4th Q 2020 1st Q 2021 2nd Q 2021 3rd Q 2021 4th Q 2021 1st Q 2022 2nd Q 2022 3rd Q 2022 4th Q 2022 1st Q 2023 2nd Q 2023 3rd Q 2023 4th Q 2023 Number of Sales
SunriverareaSFR-MedianPriceinTHOUSANDS
SunriverareaSFR-NumberofSales Totalsoldduring12monthspriortoreportdate=98Totalcurrentlylisted=23 BeaconAppraisalGroupLLC 228 265 95 106 233 190 134 117 196 137132 106 136 211 79 104 207208 104 176 165 97 71 101107 155 69807387 6062 72 83 4648 107 71 26 853445347 21 50 91827 0 50 100 150 200 250 4th Q 2010 1st Q 2011 2nd Q 2011 3rd Q 2011 4th Q 2011 1st Q 2012 2nd Q 2012 3rd Q 2012 4th Q 2012 1st Q 2013 2nd Q 2013 3rd Q 2013 4th Q 2013 1st Q 2014 2nd Q 2014 3rd Q 2014 4th Q 2014 1st Q 2015 2nd Q 2015 3rd Q 2015 4th Q 2015 1st Q 2016 2nd Q 2016 3rd Q 2016 4th Q 2016 1st Q 2017 2nd Q 2017 3rd Q 2017 4th Q 2017 1st Q 2018 2nd Q 2018 3rd Q 2018 4th Q 2018 1st Q 2019 2nd Q 2019 3rd Q 2019 4th Q 2019 1st Q 2020 2nd Q 2020 3rd Q 2020 4th Q 2020 1st Q 2021 2nd Q 2021 3rd Q 2021 4th Q 2021 1st Q 2022 2nd Q 2022 3rd Q 2022 4th Q 2022 1st Q 2023 2nd Q 2023 3rd Q 2023 4th Q 2023 Median Days on Market
BeaconAppraisalGroupLLC
FromMLSforLaPinearea.Singlefamilyresidential,notincludingcondos,townhomes,manufacturedhomesandacreage.Datasubjecttochange
LaPineareaSFR-DaysonMarketForSoldProperties
Page 12 - Beacon Report3/6/2024 $87$75$85 $144 $85 $115$95$105$93 $140$145$142$137$128$150$162$152$137$145 $198$192$199 $175 $213$204$207$232$227$220$212$240$250 $270 $233 $255 $277 $246 $276 $300$327$315$315 $352 $371 $395 $452$452$440 $420 $385$401$399 $427 $70 $120 $170 $220 $270 $320 $370 $420 $470 4th Q 2010 1st Q 2011 2nd Q 2011 3rd Q 2011 4th Q 2011 1st Q 2012 2nd Q 2012 3rd Q 2012 4th Q 2012 1st Q 2013 2nd Q 2013 3rd Q 2013 4th Q 2013 1st Q 2014 2nd Q 2014 3rd Q 2014 4th Q 2014 1st Q 2015 2nd Q 2015 3rd Q 2015 4th Q 2015 1st Q 2016 2nd Q 2016 3rd Q 2016 4th Q 2016 1st Q 2017 2nd Q 2017 3rd Q 2017 4th Q 2017 1st Q 2018 2nd Q 2018 3rd Q 2018 4th Q 2018 1st Q 2019 2nd Q 2019 3rd Q 2019 4th Q 2019 1st Q 2020 2nd Q 2020 3rd Q 2020 4th Q 2020 1st Q 2021 2nd Q 2021 3rd Q 2021 4th Q 2021 1st Q 2022 2nd Q 2022 3rd Q 2022 4th Q 2022 1st Q 2023 2nd Q 2023 3rd Q 2023 4th Q 2023 Median Price Quarter FromMLSforLaPinearea.Singlefamilyresidential,notincludingcondos,townhomes,manufacturedhomesandacreage.Datasubjecttochange LaPineareaSFR-MedianPriceinTHOUSANDS BeaconAppraisalGroupLLC 24 1717 111513 1818 23 13 23 1918 9 15 2019 11 2023 31 12 293028 11 36 32 26 20 313335 20 38 3233 25 29 58 3129 58 54 37 51 40 47 2523 35 40 32 0 10 20 30 40 50 60 70 80 90 100 4th Q 2010 1st Q 2011 2nd Q 2011 3rd Q 2011 4th Q 2011 1st Q 2012 2nd Q 2012 3rd Q 2012 4th Q 2012 1st Q 2013 2nd Q 2013 3rd Q 2013 4th Q 2013 1st Q 2014 2nd Q 2014 3rd Q 2014 4th Q 2014 1st Q 2015 2nd Q 2015 3rd Q 2015 4th Q 2015 1st Q 2016 2nd Q 2016 3rd Q 2016 4th Q 2016 1st Q 2017 2nd Q 2017 3rd Q 2017 4th Q 2017 1st Q 2018 2nd Q 2018 3rd Q 2018 4th Q 2018 1st Q 2019 2nd Q 2019 3rd Q 2019 4th Q 2019 1st Q 2020 2nd Q 2020 3rd Q 2020 4th Q 2020 1st Q 2021 2nd Q 2021 3rd Q 2021 4th Q 2021 1st Q 2022 2nd Q 2022 3rd Q 2022 4th Q 2022 1st Q 2023 2nd Q 2023 3rd Q 2023 4th Q 2023 Number of Sales
Quarter
Totalsoldduring12monthspriortoreportdate=119Totalcurrentlylisted=46 BeaconAppraisalGroupLLC 81 113 75 177 86 97 82 122 138 104111 79 88 206 72 141142 158 8073 105 142 100 89 111 149 72 96 119 191 162 88 117 128 69 117 129 154 49 20 10548 39 73 20 3832 68 32 4743 0 50 100 150 200 250 4th Q 2010 1st Q 2011 2nd Q 2011 3rd Q 2011 4th Q 2011 1st Q 2012 2nd Q 2012 3rd Q 2012 4th Q 2012 1st Q 2013 2nd Q 2013 3rd Q 2013 4th Q 2013 1st Q 2014 2nd Q 2014 3rd Q 2014 4th Q 2014 1st Q 2015 2nd Q 2015 3rd Q 2015 4th Q 2015 1st Q 2016 2nd Q 2016 3rd Q 2016 4th Q 2016 1st Q 2017 2nd Q 2017 3rd Q 2017 4th Q 2017 1st Q 2018 2nd Q 2018 3rd Q 2018 4th Q 2018 1st Q 2019 2nd Q 2019 3rd Q 2019 4th Q 2019 1st Q 2020 2nd Q 2020 3rd Q 2020 4th Q 2020 1st Q 2021 2nd Q 2021 3rd Q 2021 4th Q 2021 1st Q 2022 2nd Q 2022 3rd Q 2022 4th Q 2022 1st Q 2023 2nd Q 2023 3rd Q 2023 4th Q 2023 Median Days on Market Quarter
LaPineareaSFR-NumberofSales
FromMLSforLaPinearea.Singlefamilyresidential,notincludingcondos,townhomes,manufacturedhomesandacreage.Datasubjecttochange
BeaconAppraisalGroupLLC
$66$73$55$70$78$67$69$80$80$81$85$78$100$93$103$115$115$90$110$130$137$121$141$148$144
Quarter
FromMLSforJeffersonCountyandCCRareas.Singlefamilyresidential,notincludingcondos,townhomes,manufacturedhomesandacreage.Datasubjecttochange
JeffersonCounty&CrookedRiverRanchSFR-DaysonMarketforSold Properties
FromMLSforJeffersonConutyandCCRarea.Singlefamilyresidential,notincludingcondos,townhomes,manufacturedhomesandacreage.Datasubjecttochange
Page 13 - Beacon Report3/6/2024
$170$162$190$175$185$203$215$224$178$236$217$220$217$250$262$275$277 $305$323$318 $356$379$365$375$342$348$359$375 $50 $100 $150 $200 $250 $300 $350 $400 $450 4th Q 2010 1st Q 2011 2nd Q 2011 3rd Q 2011 4th Q 2011 1st Q 2012 2nd Q 2012 3rd Q 2012 4th Q 2012 1st Q 2013 2nd Q 2013 3rd Q 2013 4th Q 2013 1st Q 2014 2nd Q 2014 3rd Q 2014 4th Q 2014 1st Q 2015 2nd Q 2015 3rd Q 2015 4th Q 2015 1st Q 2016 2nd Q 2016 3rd Q 2016 4th Q 2016 1st Q 2017 2nd Q 2017 3rd Q 2017 4th Q 2017 1st Q 2018 2nd Q 2018 3rd Q 2018 4th Q 2018 1st Q 2019 2nd Q 2019 3rd Q 2019 4th Q 2019 1st Q 2020 2nd Q 2020 3rd Q 2020 4th Q 2020 1st Q 2021 2nd Q 2021 3rd Q 2021 4th Q 2021 1st Q 2022 2nd Q 2022 3rd Q 2022 4th Q 2022 1st Q 2023 2nd Q 2023 3rd Q 2023 4th Q 2023 Median Price Quarter FromMLSforJeffersonCountyandCCRareas.Singlefamilyresidential,notincludingcondos,townhomes,manufacturedhomesandacreage.Datasubjecttochange
BeaconAppraisalGroupLLC 2425 37 20 15 20 33 26 20 13 31 2226253029 41 24 37 49 42 26 363334 21 42 31 3637 48 5857 22 46 41 353536 73 60585455 6062 75 51 27 34 46 40 53 0 20 40 60 80 100 120 4th Q 2010 1st Q 2011 2nd Q 2011 3rd Q 2011 4th Q 2011 1st Q 2012 2nd Q 2012 3rd Q 2012 4th Q 2012 1st Q 2013 2nd Q 2013 3rd Q 2013 4th Q 2013 1st Q 2014 2nd Q 2014 3rd Q 2014 4th Q 2014 1st Q 2015 2nd Q 2015 3rd Q 2015 4th Q 2015 1st Q 2016 2nd Q 2016 3rd Q 2016 4th Q 2016 1st Q 2017 2nd Q 2017 3rd Q 2017 4th Q 2017 1st Q 2018 2nd Q 2018 3rd Q 2018 4th Q 2018 1st Q 2019 2nd Q 2019 3rd Q 2019 4th Q 2019 1st Q 2020 2nd Q 2020 3rd Q 2020 4th Q 2020 1st Q 2021 2nd Q 2021 3rd Q 2021 4th Q 2021 1st Q 2022 2nd Q 2022 3rd Q 2022 4th Q 2022 1st Q 2023 2nd Q 2023 3rd Q 2023 4th Q 2023 Number of Sales
JeffersonCounty&CrookedRiverRanchSFRMedianPriceinTHOUSANDS
JeffersonCounty&CRRSFR-NumberofSales Totalsoldduring12monthspriortoreportdate=158Totalcurrentlylisted=46 BeaconAppraisalGroupLLC 134 100 90 110 51 113 97101 165 93 127 113 8795 108118110 90 122 96 8381829389 126 57 7779 109 100 7573 89 109 67 126 141 50 1114710612151015 54 73 22 55 42 0 50 100 150 200 250 4th Q 2010 1st Q 2011 2nd Q 2011 3rd Q 2011 4th Q 2011 1st Q 2012 2nd Q 2012 3rd Q 2012 4th Q 2012 1st Q 2013 2nd Q 2013 3rd Q 2013 4th Q 2013 1st Q 2014 2nd Q 2014 3rd Q 2014 4th Q 2014 1st Q 2015 2nd Q 2015 3rd Q 2015 4th Q 2015 1st Q 2016 2nd Q 2016 3rd Q 2016 4th Q 2016 1st Q 2017 2nd Q 2017 3rd Q 2017 4th Q 2017 1st Q 2018 2nd Q 2018 3rd Q 2018 4th Q 2018 1st Q 2019 2nd Q 2019 3rd Q 2019 4th Q 2019 1st Q 2020 2nd Q 2020 3rd Q 2020 4th Q 2020 1st Q 2021 2nd Q 2021 3rd Q 2021 4th Q 2021 1st Q 2022 2nd Q 2022 3rd Q 2022 4th Q 2022 1st Q 2023 2nd Q 2023 3rd Q 2023 4th Q 2023 Median Days on Market
Quarter
BeaconAppraisalGroupLLC
Quarter
FromMLSforCrookCountyarea.Singlefamilyresidential,notincludingcondos,townhomes,manufacturedhomesandacreage.Datasubjecttochange
CrookCountySFR-DaysonMarketforSoldProperties
Page 14 - Beacon Report 3/6/2024 $87$71$75$82$87$79$102$105$105$80 $133$130$145$118$135$132$140$144$155$172$161$160$173 $200$210$221$203$223$232$240$230$234$235$247$251$255$255$250 $289 $307 $331 $372$369$378$395$390$417$401$410$415$409$425$428 $50 $100 $150 $200 $250 $300 $350 $400 $450 4th Q 2010 1st Q 2011 2nd Q 2011 3rd Q 2011 4th Q 2011 1st Q 2012 2nd Q 2012 3rd Q 2012 4th Q 2012 1st Q 2013 2nd Q 2013 3rd Q 2013 4th Q 2013 1st Q 2014 2nd Q 2014 3rd Q 2014 4th Q 2014 1st Q 2015 2nd Q 2015 3rd Q 2015 4th Q 2015 1st Q 2016 2nd Q 2016 3rd Q 2016 4th Q 2016 1st Q 2017 2nd Q 2017 3rd Q 2017 4th Q 2017 1st Q 2018 2nd Q 2018 3rd Q 2018 4th Q 2018 1st Q 2019 2nd Q 2019 3rd Q 2019 4th Q 2019 1st Q 2020 2nd Q 2020 3rd Q 2020 4th Q 2020 1st Q 2021 2nd Q 2021 3rd Q 2021 4th Q 2021 1st Q 2022 2nd Q 2022 3rd Q 2022 4th Q 2022 1st Q 2023 2nd Q 2023 3rd Q 2023 4th Q 2023 Median Price Quarter FromMLSforCrookCountyarea.Singlefamilyresidential,notincludingcondos,townhomes,manufacturedhomesandacreage.Datasubjecttochange CrookCountySFR-MedianPriceinTHOUSANDS BeaconAppraisalGroupLLC 56 50 43 48 57 495247 57 4748 63 39 34 58 65 57 46 67 76 60 52 70 88 64 44 80 89 80 63 78 67 96 70 76 82 71 55 79 114 104 78 9188 82 70 100 6463 56 71 7776 0 20 40 60 80 100 120 4th Q 2010 1st Q 2011 2nd Q 2011 3rd Q 2011 4th Q 2011 1st Q 2012 2nd Q 2012 3rd Q 2012 4th Q 2012 1st Q 2013 2nd Q 2013 3rd Q 2013 4th Q 2013 1st Q 2014 2nd Q 2014 3rd Q 2014 4th Q 2014 1st Q 2015 2nd Q 2015 3rd Q 2015 4th Q 2015 1st Q 2016 2nd Q 2016 3rd Q 2016 4th Q 2016 1st Q 2017 2nd Q 2017 3rd Q 2017 4th Q 2017 1st Q 2018 2nd Q 2018 3rd Q 2018 4th Q 2018 1st Q 2019 2nd Q 2019 3rd Q 2019 4th Q 2019 1st Q 2020 2nd Q 2020 3rd Q 2020 4th Q 2020 1st Q 2021 2nd Q 2021 3rd Q 2021 4th Q 2021 1st Q 2022 2nd Q 2022 3rd Q 2022 4th Q 2022 1st Q 2023 2nd Q 2023 3rd Q 2023 4th Q 2023 Number of Sales
CrookCountySFR-NumberofSales Totalsoldduring12monthspriortoreportdate=257Totalcurrentlylisted=56 BeaconAppraisalGroupLLC 88 139 107109 778882 112 121 147 90 104 115 146 131 104 128 104 8893 123 8281 999494 7770 9684928594 117 106 76 113 88 3429 11105102215922 51 76 3835 49 0 50 100 150 200 250 4th Q 2010 1st Q 2011 2nd Q 2011 3rd Q 2011 4th Q 2011 1st Q 2012 2nd Q 2012 3rd Q 2012 4th Q 2012 1st Q 2013 2nd Q 2013 3rd Q 2013 4th Q 2013 1st Q 2014 2nd Q 2014 3rd Q 2014 4th Q 2014 1st Q 2015 2nd Q 2015 3rd Q 2015 4th Q 2015 1st Q 2016 2nd Q 2016 3rd Q 2016 4th Q 2016 1st Q 2017 2nd Q 2017 3rd Q 2017 4th Q 2017 1st Q 2018 2nd Q 2018 3rd Q 2018 4th Q 2018 1st Q 2019 2nd Q 2019 3rd Q 2019 4th Q 2019 1st Q 2020 2nd Q 2020 3rd Q 2020 4th Q 2020 1st Q 2021 2nd Q 2021 3rd Q 2021 4th Q 2021 1st Q 2022 2nd Q 2022 3rd Q 2022 4th Q 2022 1st Q 2023 2nd Q 2023 3rd Q 2023 4th Q 2023 Median Days on Market Quarter FromMLSforCrookCountyarea.Singlefamilyresidential,notincludingcondos,townhomes,manufacturedhomesandacreage.Datasubjecttochange
BeaconAppraisalGroupLLC
