


Q2 2023 MARKET REPORT NORTHERN VIRGINIA, MARYLAND & WASHINGTON, D.C. ® Each office independently owned and operated.
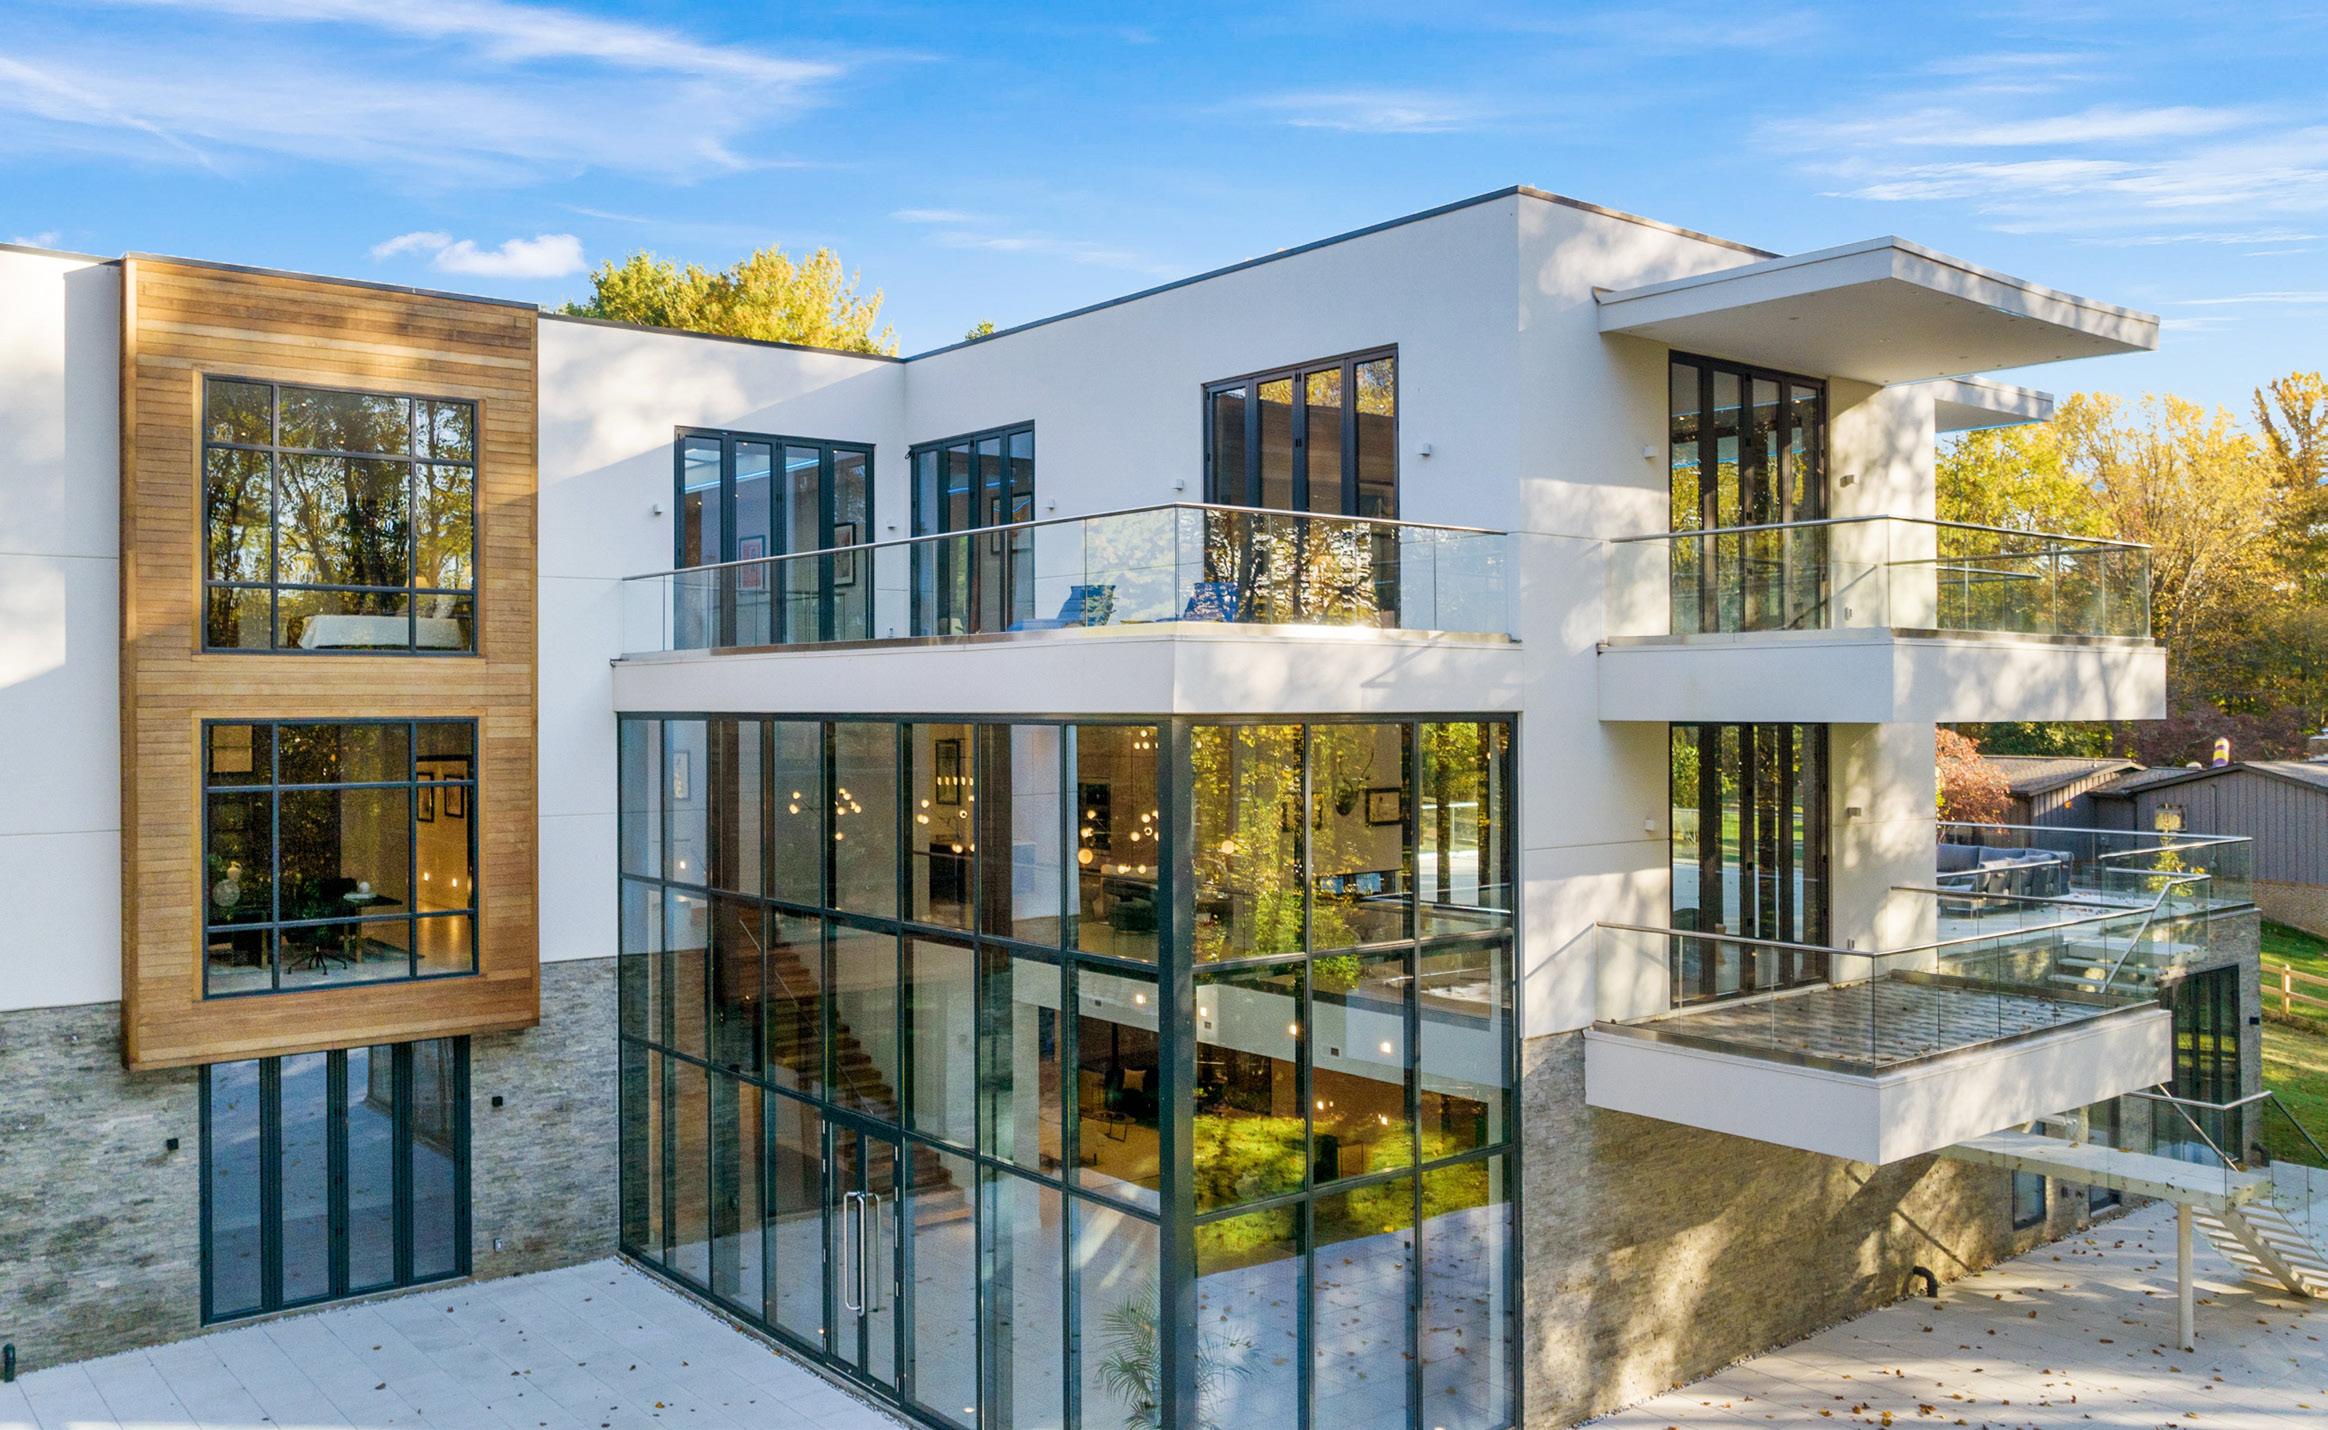
Congratulations to Kelly Martinez and the Fine Nest Realty Group for selling the third most expensive home in Northern Va this year at $5.4M!
As we look back on the second quarter of the real estate market in the greater Washington, D.C. Metro area, one thing stands out - The housing market continues to struggle to find level ground. The market remains tepid at best, thanks to continued high interest rates, constrained inventory levels and elevated home prices thereby perpetuating the current affordability crisis. Unit sales across the region continued their decline with all counties reporting a significant drop quarter over quarter. Home prices, as a whole, remained somewhat static with minor decreases in about half of the jurisdictions and marginal gains in the other half.
The Northern Virginia market showed some resilience with most counties having modest gains in home prices with Alexandria City (+5.1%) and Fairfax County (+2%) leading the way. Unit sales across all counties were down significantly based on the factors referenced in the paragraph above. Minor increases for the Days on Market (DOM), with 14 days vs 9 days, did little to hamper what unit sales there were.
Washington, D.C. continued to experience a soft market in Q2. Both home prices (-3.7%) and unit sales (-23%) showed the ongoing effects of inflation concerns, mortgage rates and of course the ever-present inventory shortage. A handful of individual neighborhoods showed positive growth in average home prices quarter over quarter with Kalorama (+25%), Downtown (+21%) and Foggy Bottom (+11.5%) outpacing Washington, D.C. as a whole.
Montgomery County, where unit sales were down -27.5%, showed average sale price resilience at +2.5%. The cities of Bethesda (+6%), Chevy Chase (+7.5%) and Potomac (+1.6%) were the stronger performers with other cities in Montgomery County showing negligible decreases in average home prices. The outlying counties of Prince George’s, Calvert, Charles and Saint Mary’s reflected a mixed bag of metrics compared to Montgomery County.
Demand for the region will remain soft as some households have been priced out of the market due to the startling interest rate increases while others lament missing out on the 3% rates that were prevalent during the past several years. However, there does seem to be some acceptance of today’s higher rates that have now become the “norm” bringing some buyers back into the market. Ever increasing rental rates, employment opportunities and a desire to “move on” are also contributing to a slow increase in this demand. As such, it will continue to be a seller’s market although pent up demand for the choicest properties remains extremely competitive where full price and over-list-price offers once again permeate the real estate landscape.
We are seeing average home prices begin to flatten and, in some cases, decline across our markets from the dizzying increases over the past several years but on balance you can expect prices to rise somewhere in the 1-2% range in 2023. However, prices for specific market segments (single family, townhomes & condominiums) could vary significantly. Unit sales are expected to continue their decline somewhere in the 10-15% range based on inventory and affordability factors thereby keeping home prices on trend.
2023 will be a year of unpredictability for the housing market but, as discussed in previous reports, we operate in a market that is somewhat insulated from other metropolitan markets. Still, sellers are woe to venture away from their 2.5-3% new and refinanced rates to perhaps chancing doubling their rate and looking for properties that may not fit their requirements nor be available. The ripple effect this tends to have on entry level price and mid-price point buyers can have a significant impact on the sales of homes in our markets, hence one of the reasons for the decrease in unit sales. All this being said, we have seen a slight uptick in buyers venturing back into the market buoyed by a strong job market, massive infrastructure/building projects, as well as the ever-present federal government influence. The market is also laden with cash heavy clients that have sat on the sidelines but are now taking advantage of the current trend in home prices - significantly increasing more cash buyers than in past years. The greater Washington, D.C. area still affords opportunities for those ready to sell or buy as the economy slowly regains confidence, families grow, the stock market shows positive growth and the reality of the current real estate market becomes the norm.
A MESSAGE
FROM THE BROKER-
KW METRO CENTER ALEXANDRIA · ARLINGTON · TYSONS · VIENNA · MIDLOTHIAN All information deemed reliable but not guaranteed. Data sourced from Bright MLS/SmartCharts Cover photo courtesy of Fine Nest Realty Group
9 CAPITOL HILL 9 DUPONT 9 FOGGY BOTTOM 9 GEORGETOWN 9 KALORAMA 9 LOGAN CIRCLE WASHINGTON D.C. 5 ALEXANDRIA 5 ARLINGTON 5 ASHBURN 5 FAIRFAX CO 5 FAIRFAX STATION 5 LORTON 5 McLEAN 5 SPRINGFIELD 5 VIENNA 6 WOODBRIDGE 6 LOUDOUN CO 6 PRINCE WILLIAM CO NORTHERN VIRGINIA CONTENTS MARKET SUMMARY 2 DMV MARKET ANALYSIS 13 BETHESDA 13 CHEVY CHASE 13 POTOMAC 13 ROCKVILLE 13 SILVER SPRING 13 CALVERT CO MARYLAND 13 CHARLES CO 13 FREDERICK CO 13 HOWARD CO 14 MONTGOMERY CO 14 PRINCE GEORGE’S CO 14 SAINT MARY’S CO


AVG SALE PRICE $748,334 NORTHERN
TOTAL UNITS SOLD 8,710 AVG DAYS ON MARKET 14 TOTAL DOLLAR VOLUME $6.5B Single family, townhouses & condominiums
2023
VIRGINIA
Q2
5 Q2 2023 % diff from 2022 Q2 2023 % diff from 2022 Q2 2023 % diff from 2022 single family units sold avg price avg days 111 $1,205,433 16 -22 -4 +100 264 $1,371,967 17 -17 +2 +31 177 $1,068,255 9 -22 +1 +50 townhome units sold avg price avg days 172 $980,556 17 -38 +6 +143 72 $929,764 15 -14 +2 +67 194 $707,177 12 -31 -2 +50 condo/co-op units sold avg price avg days 366 $518,444 14 -21 +18 -7 431 $486,271 29 -15 -2 +21 128 $528,244 32 -14 +15 +256 ALEXANDRIA
ASHBURN Q2 2023 % diff from 2022 Q2 2023 % diff from 2022 Q2 2023 % diff from 2022 single family units sold avg price avg days 1,938 $1,060,752 15 -24+67 58 $1,110,536 8 -35 -644 $924,358 11 -35 +9 +38 townhome units sold avg price avg days 958 $626,120 10 -29 +2 +67--35 $538,915 5 -34 -3 -29 condo/co-op units sold avg price avg days 731 $381,704 12 -29 +1 -14--13 $376,123 5 -24 +10 -50 FAIRFAX CO FAIRFAX STATION LORTON Q2 2023 % diff from 2022 Q2 2023 % diff from 2022 Q2 2023 % diff from 2022 single family units sold avg price avg days 140 $2,148,739 24 -13 +3222 $793,412 11 -17 +1 +57 157 $1,340,196 17 -27+70 townhome units sold avg price avg days 21 $1,007,727 28 -49 -1 +75 88 $571,747 9 -41 +1 +80 39 $770,993 5 -19 -1 -17 condo/co-op units sold avg price avg days 88 $535,372 40 -20 -1 +60 18 $345,277 7 -42 +4 +17 29 $433,175 7 -19 -7 -61 McLEAN SPRINGFIELD VIENNA
ARLINGTON
Photo courtesy of Fine Nest Realty Group (opposite)
WOODBRIDGE LOUDOUN CO PRINCE WILLIAM CO
24% → single family homes FAIRFAX COUNTY

2,543units soldQ22022
1,938 units sold Q2 2023
MARKET BALANCE
The market balance is determined by the average months of supply, June 2023
SELLER’S BALANCED BUYER’S $2.1B
TOTAL SALES (SINGLE FAMILY HOMES) Q2 2023
6 Q2 2023 % diff from 2022 Q2 2023 % diff from 2022 Q2 2023 % diff from 2022 single family units sold avg price avg days 323 $571,191 12 -26 -2 +50 715 $982,068 13 -29 -1 +86 914 $672,085 14 -29 -1 +100 townhome units sold avg price avg days 186 $438,864 10 -43 +5 +67 481 $655,051 12 -33 +1 +71 467 $478,399 11 -29 +5 +57 condo/co-op units sold avg price avg days 87 $375,652 12 -34 +8 +100 298 $466,525 23 -13 +8 +188 191 $389,130 11 -32 +8 +83


7
Photos courtesy of Fine Nest Realty Group


WASHINGTON, D.C. TOTAL UNITS SOLD 2,151 AVG DAYS ON MARKET 30 AVG SALE PRICE $853,529 TOTAL DOLLAR VOLUME $1.8B Single family, townhouses & condominiums Q2 2023

9 Q2 2023 % diff from 2022 Q2 2023 % diff from 2022 Q2 2023 % diff from 2022 single family units sold avg price avg days 2 $1,732,500 11 -71 +1 -35-----townhome units sold avg price avg days 70 $1,203,551 19 -41 -4 +27 7 $1,930,000 31 +600 -26 +520 1 $850,000 5 -50 +2 -74 condo/co-op units sold avg price avg days 41 $655,367 18 -24 -2 +20 10 $472,100 32 -71 -8 +33 47 $592,120 74 +12 +45 -6 CAPITOL HILL DUPONT FOGGY BOTTOM 24 Q2 2023 % diff from 2022 Q2 2023 % diff from 2022 Q2 2023 % diff from 2022 single family units sold avg price avg days 4 $3,258,750 18 -33 -47 -78 2 $4,797,500 54+22 +29 1 $1,270,000 92-9townhome units sold avg price avg days 28 $2,055,922 39 -33 -11 +200 6 $3,114,166 22 -14 +44 +69 4 $1,906,750 27 -71 +8 +59 condo/co-op units sold avg price avg days 20 $1,041,225 44 -39 +14 +38 39 $800,309 22 -7 +17 +10 40 $847,392 25 -37 +14 +67 GEORGETOWN KALORAMA LOGAN CIRCLE
Photo courtesy of George Mrad (above)
27% → condo & co-op WASHINGTON, D.C.

1,507units soldQ22022
1,104 units sold Q2 2023
MARKET BALANCE
The market balance is determined by the average months of supply, June 2023
SELLER’S BALANCED BUYER’S
$674M TOTAL SALES (CONDO & CO-OP) Q2 2023
10 2

11
Photos courtesy of Fine Nest Realty Group


MARYLAND TOTAL UNITS SOLD 2,855 AVG DAYS ON MARKET 15 AVG SALE PRICE $752,188 TOTAL DOLLAR VOLUME $2.1B Single family, townhouses & condominiums*
2023 *Data above represents Montgomery County only.
Q2
BETHESDA CHEVY CHASE POTOMAC
13 Q2 2023 % diff from 2022 Q2 2023 % diff from 2022 Q2 2023 % diff from 2022 single family units sold avg price avg days 215 $1,640,465 15 -24 +5 +67 72 $1,912,947 12 +3 -6148 $1,502,363 13 -18 +1townhome units sold avg price avg days 14 $1,265,668 20 -36 +38 +150 1 $315,000 24 -83 -74 -25 17 $920,705 7 -58 -16 -22 condo/co-op units sold avg price avg days 83 $438,799 21 -20 +14 -50 40 $774,574 42 -42 +4 -7 3 $905,000 19 +50 +7 -39
Q2 2023 % diff from 2022 Q2 2023 % diff from 2022 Q2 2023 % diff from 2022 single family units sold avg price avg days 192 $786,238 10 -30 -3 +11 348 $678,781 12 -31+33 298 $493,510 29 -29 -3 +164 townhome units sold avg price avg days 78 $805,571 13 -6 +12 +30 79 $480,717 9 -35 -2 +29 22 $391,994 8 -37 +5 +60 condo/co-op units sold avg price avg days 122 $371,892 16 -28-6 233 $282,619 24 -22 +4 +14 7 $402,700 29 -43 -1 -60 ROCKVILLE SILVER SPRING CALVERT CO Q2 2023 % diff from 2022 Q2 2023 % diff from 2022 Q2 2023 % diff from 2022 single family units sold avg price avg days 474 $485,144 27 -23 -3 +93 604 $588,840 20 -25 +1 +43 533 $787,307 14 -28 +1 +27 townhome units sold avg price avg days 168 $368,272 22 -25 +7 +144 384 $414,919 13 -30 -1 +44 248 $486,017 9 -31 +6 +29 condo/co-op units sold avg price avg days 8 $173,250 8 -43 -1 -60 89 $335,889 13 -28 +9 +86 185 $380,755 10 -27 +6 +25 CHARLES CO FREDERICK CO HOWARD CO
PRINCE GEORGE’S CO SAINT MARY’S CO
25% → single family homes MONTGOMERY COUNTY

2,106units soldQ22022
1,574 units sold Q2 2023
MARKET BALANCE
The market balance is determined by the average months of supply, June 2023
SELLER’S BALANCED BUYER’S $1.6B TOTAL SALES (SINGLE FAMILY HOMES) Q2 2023
14 Q2 2023 % diff from 2022 Q2 2023 % diff from 2022 Q2 2023 % diff from 2022 single family units sold avg price avg days 1,574 $1,002,846 13 -25 +1 +30 1,382 $494,005 24 -20+71 315 $445,792 23 -25 +2 +44 townhome units sold avg price avg days 583 $553,990 12 -31 +2 +33 567 $415,103 24 -22 +6 +60 69 $293,350 18 -27 -2 +13 condo/co-op units sold avg price avg days 698 $352,854 20 -29-5 396 $275,607 27 -7 +17 +59 5 $215,100 8 -34 -3 +60
MONTGOMERY CO

15
Photos courtesy of George Mrad
get to know the good life. ALEXANDRIA 1701 Duke Street, Suite 100 Alexandria, VA 22314 703-535-3610 ARLINGTON 2111 Wilson Boulevard, Suite 1050 Arlington, VA 22201 703-224-6000 MIDLOTHIAN 15871 City View Drive, Suite 120 Midlothian, VA 23113 804-858-9000 VIENNA 144 Church Street NW Vienna, VA 22180 703-564-4000
