Kentucky Educational Collaborative for State Agency Children (KECSAC)
Staff
Executive Director
Ronnie Nolan, Ed.D.
Associate Director
Sherri L. Clusky
Assistant Director Communications & Development
Cindy Held
Assistant Director Conferencing & Events
Katie Helton
Assistant Director Financial Affairs
Kristine Smith
Program Improvement Specialists
Angie Austin
Peggy Shearer
Interagency Advisory Group (IAG)
Kentucky Department of Education
Christina Weeter
Lalah Brewer
Department of Juvenile Justice
Shannon Jett
Lacheena Carothers
Department for Community Based Services
Lorraine Wilbur
Angela Harris Winkfield
Department for Behavioral Health, Developmental & Intellectual Disabilities
Diane Gruen-Kidd
SAC School Administrator Association (SACSAA)
Jeremy Camron, President, Daviess County Schools
Sarah Vivian, President-Elect, Franklin County Schools
Superintendent
Mark Kopp, Franklin County Schools
EXECUTIVE DIRECTOR’S MESSAGE
Dear KECSAC Partners and Friends,
State agency children are a complex, multi-faceted, diverse population. To better understand them and their needs we must examine who they are, where they are served, where they excel and where we should focus additional attention. The annual KECSAC census of State Agency Children provides us with a glimpse into the lives of these youth, the school districts who serve them and the partner agencies who have supervisory responsibilities. The data presented in this report helps us develop a better understanding of what is happening in our partnering programs across the Commonwealth while providing a context for the varying types of students we serve, the needs they have and the potential they hold. Our 2024 Annual Census of State Agency Children, a Social and Demographic Profile, does just that and so much more. As a critical component of our work, these results reflect the wide diversity of both programs and students being served in our 70 education programs in 46 school districts across the Commonwealth.
We continue to serve a large number of students in our programs throughout the course of a year, with nearly 8,700 students being served during the preceding year, a significant increase over the previous year. The data also reflects the significant numbers of students who have an identified disability, making our work even more pertinent at this critical time in our history. In presenting this data, we hope it will be beneficial to state policy makers, school officials, program directors and other professionals in their efforts to develop educational plans for state agency children. The data included in this report, and others published annually by KECSAC, demonstrates the continued needs of our students, including the need for appropriate funding to help our local school districts meet the challenges identified in this report. If we are to continue helping this vulnerable population reach new achievement heights, we must invest in their education so they will have the skills and resources to become contributing members of our Commonwealth and our country.
With the information this data provides, we are making steady progress in communicating the needs of our students to our stakeholders. The great work we have accomplished is only possible with the tremendous support of our partners and friends. The Kentucky State Board of Education, the Departments of Education, Juvenile Justice, Community Based Services and Behavioral Health, as well, as our local education agencies, have all championed the cause of State Agency Children.
Sincerely,
Ronnie Nolan, Ed.D.
EXECUTIVE SUMMARY
Each year since KECSAC began in 1992, KECSAC staff have gathered and reported demographic information about the students served in KECSAC-funded programs. The information received from the census provides a one-day descriptive snapshot of the students educated in KECSAC-funded programs, including but not limited to: age, grade level, race, gender, identified disability, the number of students in the program on the specified day, and the total number of children served during the previous 12month period.
On December 2, 2024, the census collection date, 1,605 students received all or part of their educational services from one of seventy KECSAC-funded programs located in forty-six school districts throughout the state contracted with KECSAC through a Memorandum of Agreement (MOA). KECSAC also asked administrators to report the number of children served in their program during the 12-month period between December 2, 2023, and December 2, 2024. Administrators report that 8,668 different youth received educational services during that period. This information was also confirmed by data collected in the student information system, Infinite Campus.
Service to state agency children (SAC) is provided by one of Kentucky’s three state agencies that provide direct care to children: the Department for Community Based Services (DCBS), Department of Juvenile Justice (DJJ) and the Department for Behavioral Health, Developmental and Intellectual Disabilities (DBHDID).
Approximately 51.6 percent (n=828) of all state agency youth receive educational services while living in one of thirty programs contracted with DCBS. These students may live in group homes, psychiatric residential treatment facilities, hospital settings, treatment centers, or temporary shelters. DCBS contracts with private providers to administer the necessary care and treatment for these students. Programs operated by or contracted with DJJ provided educational services to 46.7 percent (n=750) of all state agency children in one of thirty-eight operated or contracted programs. DJJ operates and owns twelve residential facilities, five day-treatment programs and two residential group homes. Youth in DJJoperated residential programs have been adjudicated by the courts and committed or probated to the custody of DJJ for a specific period. Sixty-two percent (n=467) of the DJJ population are in DJJ owned and operated programs. DJJ also contracts with local school districts to provide nineteen additional daytreatment programs. Youth in contracted day-treatment programs are court ordered to attend the program as an attempt to stabilize the youth before placement in a more restrictive environment, such as a residential program, or as a requirement of probation. Thirty-eight percent (n=283) of the DJJ population attend contracted treatment programs. In 2024, 1.7 percent (n=27) of all youth in KECSACfunded programs receive services from a mental health day treatment (DBHDID) program.
The KECSAC census, conducted as part of the IDEA Child Find project, identifies state agency children who have been diagnosed with an IDEA educational disability. On December 2, 2024, 46 percent (n=739) of all youth receiving educational services in a program funded by KECSAC had been identified with an educational disability that adversely affects their educational progress. As illustrated in figure eight on page seventeen, 34.2 percent (n=253) of all children identified with an educational disability and receiving educational services in a KECSAC-funded state agency program on December 2 have been diagnosed with Emotional-Behavioral Disability (EBD) while 29.8 percent (n=220) of SAC diagnosed with an educational disability have a disability in the Other Health Impaired (OHI) category. Disabilities in this category include chronic or acute health problems such as attention deficit disorder (ADD) or attention
deficit hyperactivity disorder (ADHD), diabetes, epilepsy, heart condition, leukemia, and Tourette syndrome. From year to year, the types of disabilities diagnosed most often change in the population of state agency children. Although the types of educational disabilities change, one thing stays constant: students in the care and custody of the state and placed in a SAC program continue to have extensive educational needs because of the severity of the educational disabilities they exhibit.
The census taken each year provides valuable information about the race and ethnicity of the youth in state care. According to the December 2 census, 65 percent (n=1044) of SAC are classified as White while 21.9 percent (n=352) are classified as Black or African American. According to the state 2023-2024 School Report Card, 71.4 percent (n=453,870) of all students in Kentucky public schools are classified as White and 10.8 percent (n=68,938) are classified as Black or African American. With two times the percentage of Black students in state agency programs than in traditional Kentucky public schools, a disproportional number of Black or African American youth are being educated in state agency programs. Youth classified as Two or More races represent 7.6 percent (n=122), and youth identified as Hispanic/Latino account for 4.5 percent (n=72) of all SAC. Just .9 percent (n=15) of all SAC in a KECSACfunded program on December 2 was identified as American Indian or Alaskan Native (n=2); Asian (n=11); or Native Hawaiian or Pacific Islander (n=2).
KECSAC-funded state agency educational programs provide funding to students between the ages of 5 and 21. On December 2, 2024, the average age of a youth in KECSAC-funded programs was 12 years old. The largest age group of state agency children are 16-year-olds with 20.9 percent (n=336) of the population followed by 17-year-old students with 18.4 percent (n=296).
The largest numbers of SAC were in 9th and 10th grade, representing 41.4 percent (n=665) of the entire SAC population in a KECSAC-funded program. Youth in grade eleven represent 15.5 percent (n=248) of the SAC population while seven percent (n=113) are in grade twelve. Grades six through eight represent 26.8 percent (n=430) of the population. Students in grades Kindergarten through five represent 8.3 percent (n=133) of the population. Students in grade 14 (special education students participating in alternate assessment who have previously progressed through grade twelve assessments), and graduates represent just one percent (n=16) of the SAC receiving educational services in a KECSACfunded program.
The gender division of youth in KECSAC-funded programs changes very little from year to year. According to information submitted on December 2, males represented 68 percent (n=1098) and females represented 32 percent (n=507) of the total population.
Local school districts employ the equivalent of 307.50 full-time certified teachers who provide educational services to youth in KECSAC funded programs across the state. These teachers generally teach in classrooms located at the treatment program (not in a district building) and may teach several grade levels in one classroom. Seven of these teachers hold a National Board Certification and 59 percent (n=181.25) are certified in special education. Fourteen teachers in KECSAC-funded programs were emergency certified. School districts also provide 88.5 full-time equivalent teaching assistants and 100.55 full-time equivalent educational support staff to meet the intense educational needs of state agency children. Thirty-three districts provide a full-time administrator to oversee SAC education programs.
INTRODUCTION
State Agency Children (SAC) are one of Kentucky’s most unique populations of students. These students are in custody or supervision of one of Kentucky’s state agencies, i.e., the Departments for Community Based Services (DCBS), Juvenile Justice (DJJ), or Behavioral Health, Developmental and Intellectual Disabilities (DBHDID). Many state agency children have emotional or behavioral issues while others may have suffered physical or emotional abuse. These youth may have been abandoned by their parents or removed from the family by the courts. Some have committed crimes and have been committed to the juvenile justice system by the courts. Many have identified disabilities and special education needs. Other characteristics of SAC include a history of low school performance, substance abuse in the family, abuse and neglect, behavioral issues, and poverty. SAC are usually educated in non-traditional settings, such as group homes, juvenile justice detention centers, mental health day treatments, residential treatment programs, community-based shelter programs or hospital settings.
Prior to 1992, this population of students often did not receive the same educational resources or opportunities as students in traditional schools. Kentucky legislators recognized this inequality and established legislation to mandate local education agencies to provide these students with the same quality education afforded to other students in Kentucky public schools. In 1992, legislators passed Senate Bill (SB) 260, which established the Kentucky Educational Collaborative for State Agency Children (KECSAC). Because the local school district where the students reside has the responsibility of providing educational services, legislators also mandated a special fund be established to provide additional funding to school districts that educate SAC. One of the primary duties of KECSAC is to oversee this funding, commonly referred to as the state agency children’s fund (SACF).
To be eligible to receive KECSAC funding to help offset the added cost of providing educational services to SAC, a local school district must sign a Memorandum of Agreement (MOA) with KECSAC. The MOA establishes specific requirements that must be followed, including:
• Provide a 210-day instructional school year.
• Maintain a teacher-to-student ratio of no more than ten (10) students to one teacher without a classroom aide and no more than fifteen (15) students to one teacher with a classroom aide.
• Provide a comprehensive annual budget for the program.
• Prepare an interagency agreement between the school district and treatment provider at the program detailing responsibilities of each entity.
• Develop a Program Improvement Plan that coordinates with the District Improvement Plan and monitors the plan for implementation and impact.
• Develop a transition plan for each student.
Some of these items are legislatively required, such as the extended school days and the student-toteacher ratio, while others are required under the Individuals with Disabilities Education Act (IDEA) or requested by the Kentucky Board of Education (KBE). Some are considered best practices for alternative education.
KECSAC appears to be a one-of-a-kind organization: a collaboration between state agencies established to ensure all children in Kentucky receive equitable resources. Mandated by state legislation and included as part of the Kentucky Department of Education’s biennial budget, KECSAC brings state agencies together to ensure quality educational services are provided to this vulnerable population of
students. With such significant needs, providing educational services to SAC must truly be a collaborative effort. KECSAC partners include the Kentucky Department of Education (KDE); Department of Juvenile Justice (DJJ); Department for Community Based Services (DCBS); Department for Behavioral Health, Developmental and Intellectual Disabilities (DBHDID); Local Education Agencies (LEA); SAC and School Administrator Association (SACSAA); working together to educate all of Kentucky’s Children.
CENSUS DESCRIPTION
Each year since KECSAC began in 1992, as part of the Department of Education’s Child Count, KECSAC staff have gathered and reported demographic information about the students served in KECSAC-funded programs. Student information was gathered using a survey distributed to each program in November with instructions to complete the survey and provide information about students being served by the program on December 1st, or the census collection date. Because the information was self-reported, the data collection process and data reliability were concerns for KECSAC staff when compiling and analyzing the data.
To alleviate some of these concerns, KECSAC staff worked with the Kentucky Department of Education data analyst to develop a process that would allow SAC’s demographic information to be extracted directly from Kentucky’s statewide student information system, Infinite Campus (IC). First, a process was developed that would allow districts/programs to identify SAC within the IC system. Then, the data analyst worked with KECSAC staff to create an Alternative Programs/KECSAC custom tab within IC to identify SAC receiving education services from a KECSAC-funded program. This custom tab asked users to enter a start and end date for each student, as well as specify the student’s classification for SAC eligibility. To be eligible for SAC funding, students must fall within one of six classifications:
1. Court-ordered to attend the program.
2. Committed to or in the custody of DCBS, a department within the Cabinet for Health and Family Services.
3. Committed to or in the custody or supervision of DJJ.
4. Placed or financed in a private facility with an agreement with the Cabinet for Health and Family Services.
5. Probated by the court
6. Referred to an operated or contracted day treatment program by a Family Accountability, Intervention and Response (FAIR) team.
Next, the previous KECSAC data collection process was reviewed, and KDE data analysts worked with programmers to create a KECSAC Membership Report within IC. This report allows programs to pull the exact information needed for the KECSAC census from IC thus eliminating the need to manually enter data into a survey form. The data from the report is produced in an Excel file to allow the facility to conduct data quality reviews and confirm accuracy of data. Finally, the extracted data from each KECSAC program is combined into one worksheet for analysis. Using the process described above, KECSAC is confident that the student demographic information used in this report is accurate for the collection date. The information received from the census provides a one-day descriptive snapshot of the students educated in KECSAC-funded programs, including but not limited to: age, grade level, race, gender, identified disability, and the number of students in the program on that day.
We also ask administrators to report on the total number of children served during the previous 12month period as well as information about where the youth transitioned from when entering a state agency program. This information is self-reported and is not verifiable by KECSAC staff. However, we report this information because it helps complete the picture of SAC in Kentucky.
The annual census is used to inform state agency partners of the number of students served by KECSAC. It is also used to inform and guide policy and activities for next year’s projects, including professional development training and research projects. Census data will inform legislators and the Kentucky Board of Education about the financial need of districts with KECSAC programs.
CENSUS ANALYSIS
Definition of SAC
Every year on December 1st or as close as possible to that date, KECSAC conducts a census of Kentucky SAC served in KECSAC-funded programs. KRS 158.135 (1) (a) defines a state agency child as:
1. a. Those children of school age committed to or in custody of the Cabinet for Health and Family Services and placed, or financed by the cabinet, in a Cabinet for Health and Family Services operated or contracted institution, treatment center, facility, including those for therapeutic foster care and excluding those for nontherapeutic foster care; or b. Those children placed or financed by the Cabinet for Health and Family Services in a private facility pursuant to childcare agreements, including those for therapeutic foster care and excluding those for nontherapeutic foster care.
2. Those children of school age in home and community-based services provided as an alternative to intermediate care facility services for the intellectually disabled; and
3. Those children committed to or in custody of the Department of Juvenile Justice and placed in a department operated or contracted facility or program; and (amended in 2018)
4. Those children referred by the Family Accountability, Intervention, and Response (FAIR) team as described in KRS 605.035 and admitted to a Department of Juvenile Justice operated or contracted day treatment program.
December 2, 2024 “Snapshot”
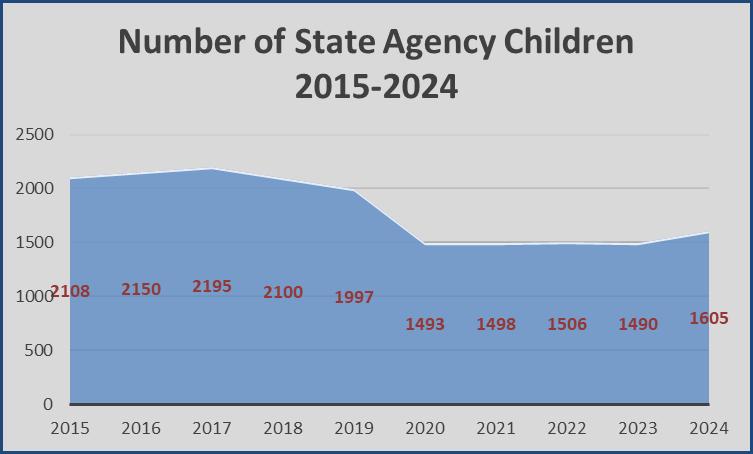
In 2024 a census was taken on December 2nd, as December 1st fell on a Sunday. This one-day “snapshot” taken each year of children in the care and custody of the Commonwealth of Kentucky and receiving educational services in a KECSAC-funded program, provides valuable information to KECSAC, our state agency partners, and legislators regarding this vulnerable population of students. Census reports indicate 1,605 students were receiving educational services from a KECSAC-funded program.
This 2024 count is higher than the previous four years. The COVID-19 pandemic and the new guidelines provided by the different agencies contributed to the significant change in the student counts. However,
Figure 1: Number of State Agency Children 2015-2024
in the 10-year period since 2015, the number of students receiving educational services in SAC programs on December 2nd has decreased by 503 or 24 percent. This decline is the result of KECSAC strictly enforcing the legal definition of SAC as provided in KRS 158.135, and the drive to keep status offenders out of juvenile justice programs. Another driving force behind the decline in the number of students receiving educational services at a KECSAC-funded program is the decrease in state education funding which prompted several school districts to end their contract with KECSAC because the SAC funds provided to the district did not cover the cost of funding the extended days and smaller student-toteacher ratio required by KECSAC. Senate Bill 200, passed in 2014, designed to keep youth from entering the court system, has also impacted on the number of students being served in KECSAC programs, particularly in the juvenile justice day treatment programs which required court involvement to be eligible for SAC funding. The definition of SAC was amended in July 2018 to include students referred to contracted or operated day treatment programs by the local Family Accountability, Intervention, and Response (FAIR) team. Allowing youth referred by local FAIR teams to be counted as SAC will allow students to receive the services provided by a day treatment without requiring court involvement and will serve as a community resource per Senate Bill 200. On December 2, 2024, twenty-four youth had been referred to a day treatment program by the local FAIR team. This is a decrease from previous year when thirty-one youth were referred by the local FAIR team.
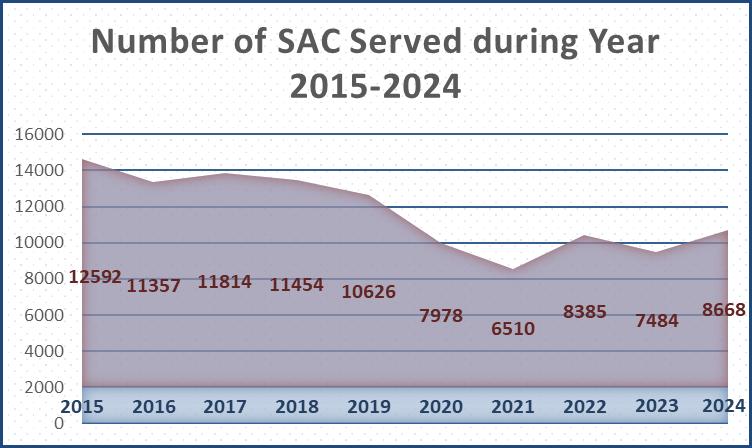
KECSAC also requested that administrators report how many students they served in their program during the 12-month period between December 2, 2023, and December 2, 2024. Administrators report that 8,668 different youth received educational services during that period. Figure 2 illustrates an increase of 1,184 youths served during the twelve months between 2023 and 2024. Between 2015 and 2024 programs have experienced a 31 percent (n=3,924) decrease in the number of different SAC who received educational services from a KECSAC-funded program at some time during the 12-month period. The possible reasons for this decline are discussed in the preceding paragraph.
Figure 2: Number of SAC Served During Year 2015-2024
Agencies Serving State Agency Children
One of Kentucky’s three state agencies provide services to SAC:
• Department for Community Based Services (DCBS)
• Department of Juvenile Justice (DJJ)
• Department for Behavioral Health, Developmental and Intellectual Disabilities (DBHDID).
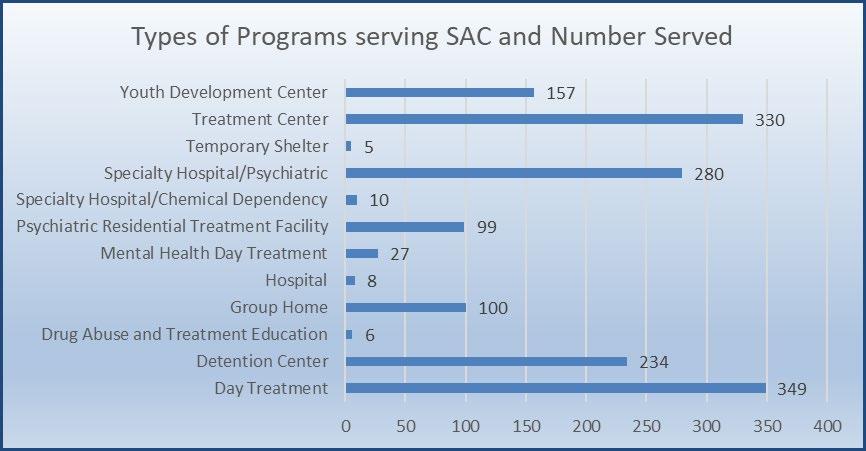
Services to state agency children are provided in a variety of programs. The State Agency directly or via a contract provides care and treatment while the school district in which the program is located provides the educational services, with one exception where a neighboring district provides the educational services. Figure 3 illustrates the types of programs that serve state agency children. All programs are residential except for the day treatment programs. The largest number of students, 21 percent (n=330), receive services while living at a treatment center. Youth receiving services from a specialty hospital or psychiatric hospital account for 17 percent (n=280) of all state agency children and youth who attend juvenile justice contracted or operated day treatment programs account for 22 percent (n=349). Many programs serve two separate functions, such as a treatment center and group home, or a temporary shelter and a group home. Youth are often moved between the different types of programs based on the specific needs of the youth and the time in state care.
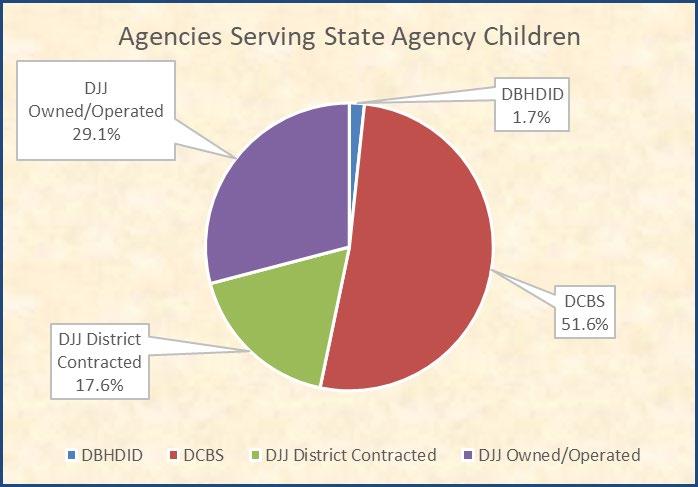
As shown in Figure 4 on the next page, 51.6 percent (n=828) of all state agency children receive educational services while living in one of thirty programs contracted with DCBS. These students may live in group homes, psychiatric residential treatment programs, hospital settings, treatment centers, or temporary shelters. DCBS contracts with private providers to administer the necessary care and treatment for these students.
KECSAC programs operated by or contracted with DJJ provided educational services to 46.7 percent (n=750) of all SAC in one of thirty-eight operated or contracted programs. DJJ operates twelve residential programs, five day-treatment programs and two residential group homes. Youth in DJJoperated residential programs have either been adjudicated by the courts and committed or probated to the custody of DJJ for a specific period or are awaiting adjudication.
Figure 3: Type of Programs Serving SAC and Number Served
DJJ also contracts with local school districts to provide nineteen additional day treatment programs. Youth in contracted day treatment programs are court-ordered to attend the program as an attempt to stabilize the youth before placement in a more restrictive environment, such as a residential program or as a requirement of probation. In 2018, legislation expanded the definition of SAC to include students referred to operated or contracted day treatment programs by a local Family Accountability, Intervention, and Response (FAIR) team. This change allows students referred by the FAIR team to be counted on the KECSAC census and for the program to receive SACF funding to help pay for the additional services provided by the day treatment program.
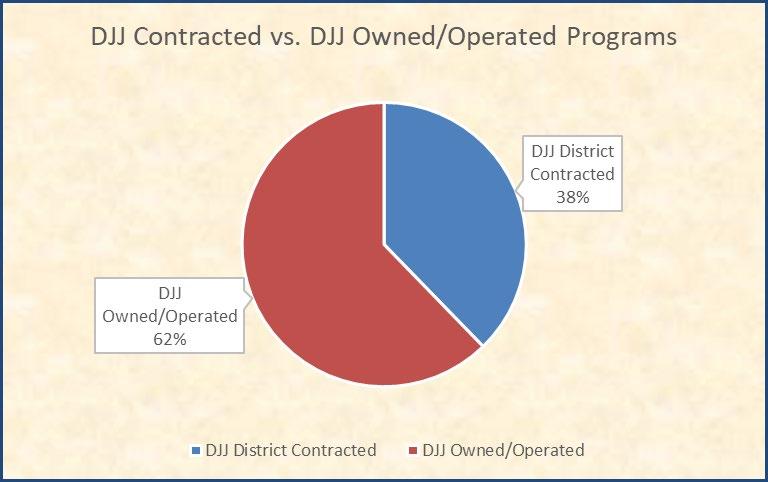
As shown in Figure 5, 81 percent (n=283) of the population of students who attend day treatment programs are in district-contracted day treatment programs while 19 percent (n=66) of students attending day treatments are in DJJ owned/operated day treatment programs. DJJ owned/ operated day treatment programs are generally located in areas with a DJJ-operated group home.
Figure 4: Agencies Serving State Agency Children
Figure 5: DJJ Contracted versus DJJ Owned/Operated Programs
In 2024, 2 percent (n=27) of all youth in KECSAC-funded programs received services from a mental health day treatment (MHDT) program. MHDT programs are district-operated programs that have a service contract with a DBHDID approved provider to provide mental health services. Youth attending MHDTs receive intensive mental health treatment, including individual, group, and family therapy, in addition to their educational services. The number of MHDT programs contracted with KECSAC dropped from five in 2012 to just two in 2013. This drop in the number of MHDT programs was prompted by a review of these programs by representatives from the DBHDID. After a thorough review of documents and interviews with both district personnel and mental health service providers, it was determined that three programs no longer met the description of a MHDT program.
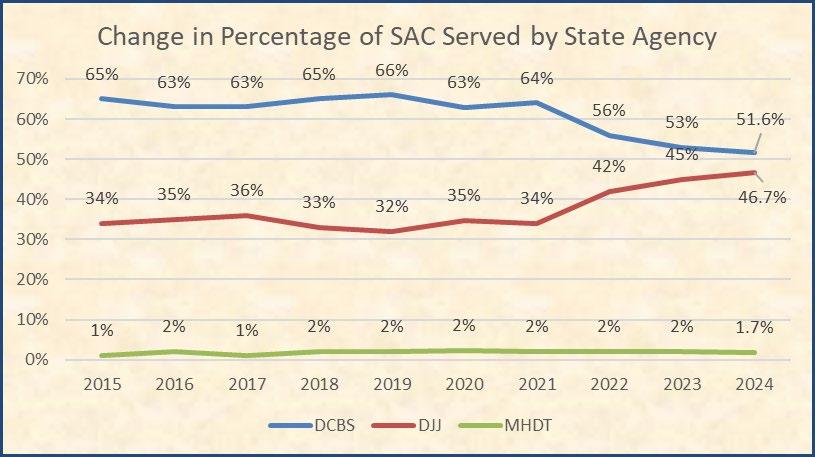
The population of SAC is continually shifting between the three different state agencies providing care for children. Figure 6 illustrates the shifting nature of the SAC population, a graphic reminder of the transitional nature of the life of a child in state care. The percentages used in Figure 6 have been rounded for consistency across the years. As shown, in 2015 the population of SAC in DCBS programs and DJJ programs was 31 percentage points apart: 65 percent in DCBS programs and 34 percent in DJJ programs. In the ten years since, the percentage of SAC in KECSAC-funded DCBS programs has decreased to 51.6 percent (n=750) while the percentage of SAC in DJJ programs is consistent at 46.7 percent (n=750) of the entire SAC population.
Figure 6: Change in Percentage of SAC Served by State Agency
State Agency Classifications
KECSAC’s governing statute, KRS 158.135, provides a clear definition of exactly which youth may be classified as a state agency child. To be counted on the census, administrators must identify how each youth qualifies by placing the student in one of six classification categories. Figure 7 shows the six classifications and the percentage of SAC in each category.
Those youth who are committed to or in custody of the Department for Community Based Services (DCBS) have most often been temporarily or permanently removed from the family home under the order of a court and placed under custodial control or supervision of DCBS. These SAC usually live in a residential group home setting and receive their educational services in classrooms located on-site at the facility, although some attend day treatment programs, and some attend traditional public schools if it is determined to be the best educational placement for the student. In addition to their educational services, these youth often receive intensive treatment while in the group home. Youth committed to or in the custody of DCBS represent 51.6 percent (n=828) of the entire SAC population in KECSAC-funded programs.
“Placed or financed in a private facility pursuant to a childcare agreement with the Cabinet for Health and Family Services” is another category of youth who qualify as SAC. Thirty-one percent (n=494) of the SAC population fall into this classification. This includes youth who have been placed in a private facility that contracts with one of the state agencies to provide specific services for children in need. These facilities include any program that has a childcare agreement with DCBS or a service contract through DBHDID. The services for these youth may be paid for by the Department of Medicaid Services. Youth in this classification are most often seen in hospital settings, psychiatric residential treatment facilities, mental health day treatments, or group homes offering intensive treatment services.
Youth committed to or in the custody of DJJ are usually youth who have been arrested and placed in one of Kentucky’s six detention centers while awaiting trial or have been adjudicated and placed in a youth development center or treatment center for a specific period. These youth attend classrooms within the DJJ facility and may receive treatment in addition to their educational services. DJJ also operates two group homes throughout Kentucky. Group homes serve younger or less serious public offenders and often serve as a step-down program for youth leaving youth development centers. Youth in DJJ group homes may attend day treatment programs or local public schools. 46.7 percent (n=750) of the entire population of SAC is committed to or in custody of DJJ.
Youth who are court-ordered to attend most often receive their educational services from one of twenty-four DJJ operated or contracted day treatment programs. Other youth have been placed in
Figure 7: Classification of State Agency Children
residential treatment facilities or group homes to receive treatment or to remove the youth from a threatening home environment. The parental rights of these children usually remain intact.
Approximately 18 percent (n=282) of all SAC have been court-ordered to attend a treatment program. Day treatment programs have seen a significant reduction in their average daily membership count since implementation of Senate Bill 200 in 2014, which seeks to implement community intervention rather than court involvement for youth committing juvenile offenses.
SAC probated by the court system may attend a day treatment program. Probation may be a step-down program for youth returning from a youth development center or an effort by the courts to keep a youth from a more restrictive environment. One percent (n=20) of the entire SAC population falls in the probated category.
Youth referred by the FAIR Team to a contracted day treatment program are youth who have “High Needs” as determined by a needs assessment administered by the court designated worker (CDW); have failed to appear for a preliminary intake inquiry; have declined to enter a diversion program; or failed to complete the terms of diversion. One percent, or twenty-four students, were referred by the FAIR team on December 2, 2024.
Disability
The KECSAC census, conducted as part of the IDEA Child Find project, identifies SAC who have been diagnosed with an IDEA educational disability. On December 2, 2024, 46 percent (n=739) of all youth receiving educational services in a program funded by KECSAC had been identified with an educational disability that adversely affects their educational progress. In comparison, only 18 percent (n=115,438) of all Kentucky public school students (n=635,563) have been diagnosed with an educational disability, according to the Kentucky Department of Education 2023-2024 School Report Card 1
As illustrated in Figure 8, 34.2 percent (n=253) of all children diagnosed with a disability on December 2, 2024, have been diagnosed with an emotional-behavioral disorder (EBD). According to the EBD Task Force established by the Kentucky Department of Education, a student identified as EBD clearly demonstrates an emotional-behavioral disability that significantly interferes with the student's educational performance. Educational performance reflects the total involvement of a child or youth in the school environment. It includes social and emotional development, communication skills, and participation in classroom activities, as well as academic achievement. 2
1 Kentucky Department of Education, School Report Card: Home - Kentucky School Report Card.
2 Kentucky Emotional-Behavioral Disability, Technical Assistance Manual, Definition: BHP, EBD TA Manual, Definition (state.ky.us)
A little over 29.8 percent (n=220) of SAC diagnosed with an educational disability have a disability in the Other Health Impaired category. Disabilities in this category include chronic or acute health problems such as attention deficit disorder (ADD) or attention deficit hyperactivity disorder (ADHD), diabetes, epilepsy, heart condition, leukemia, and Tourette syndrome.
Of the SAC diagnosed with an educational disability, 12.3 percent (n=91) were diagnosed with a Mild Mental Disability and another 2.8 percent (n=21) classified as having Functional Mental Disability. Mild mental and functional mental are examples of Intellectual Disabilities.
Almost 9 percent (n=65) of all youth with an educational disability have been diagnosed with a Specific Learning Disability, which means a disorder in one or more of the basic psychological processes involved in understanding or using language, spoken, or written, that may manifest itself in the imperfect ability to listen, think, speak, read, write, spell, or to do mathematical calculations. The term includes such conditions as perceptual disabilities, brain injury, minimal brain dysfunction, dyslexia, and developmental aphasia. 3
Approximately 5.7 percent (n=42) of students educated in KECSAC programs have been identified with autism spectrum disorder, a developmental disability that covers a wide range of symptoms and skills, but mainly affects social skills, communication, and behavior. Multiple Disabilities, the combination of disabilities that cause such severe educational needs that they cannot be accommodated in a special education program solely for one of the impairments, has been identified in approximately 3.5 percent (n=26) of SAC with disabilities The term does not include deaf blindness
3 U.S. Department of Education, IDEA 2004 Regulations: Part 300/A/308/c.
To calculate SEEK funding add-ons, the IDEA disability categories are placed in incidence categories based on the frequency the disability is diagnosed in the public and the severity that the educational disability adversely affects the student’s educational progress. Guidance from the Office of Education Accountability is provided on page 36 of Understanding How Tax Provisions Interact with the SEEK Formula. This document provides information on weights and categories of disabilities for Kentucky’s SEEK funding.
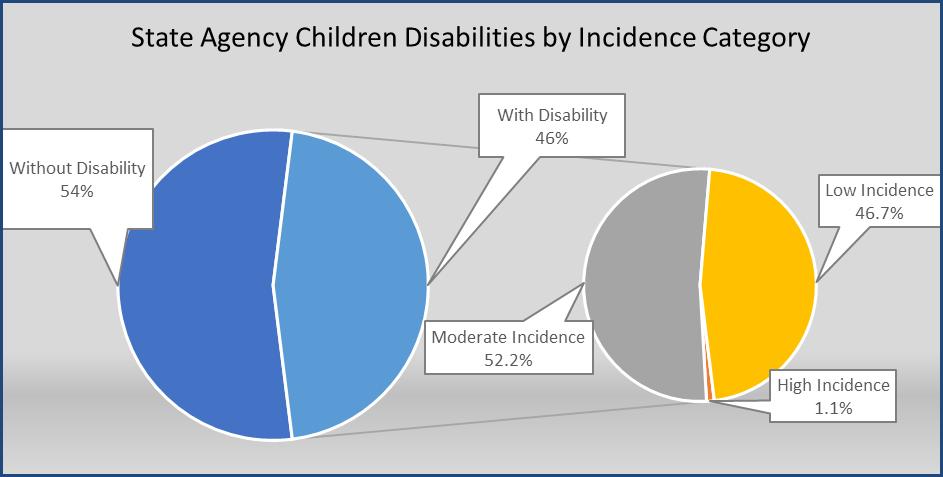
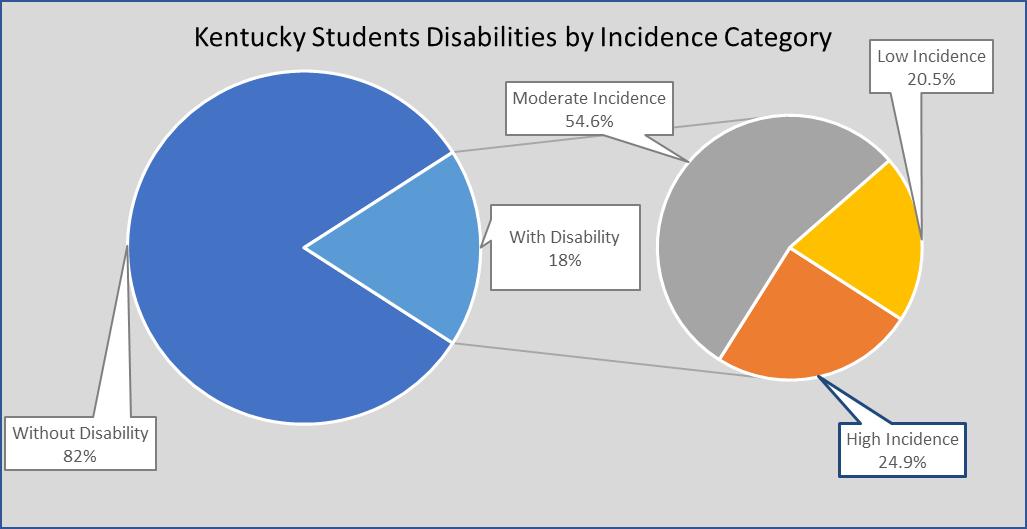
Figures 9 and 10 (shown in coordinating colors and positioned for comparison) clearly illustrate the severity of educational disabilities of students in SAC educational programs compared to the general population of Kentucky school students. This is one reason youth in SAC programs need the extended
Figure 9: State Agency Children Disabilities by Incidence Category
Figure 10: Kentucky Students’ Disabilities by Incidence Category
school year and a smaller student-to-teacher ratio if they are to reach their highest level of educational achievement.
The Low Incidence category includes types of disability seen least frequently in the public and requiring the most intensive educational support. As illustrated in Figure 9, 46 percent (n=739) of SAC identified with an educational disability, 46.7 percent (n=345) have been diagnosed with a Low Incidence disability. In contrast, as shown in Figure 10, just 20.5 percent (n= 23,687) of Kentucky public school students with a disability have been diagnosed with a Low Incidence disability. Low Incidence disabilities include the following disabilities:
• Functional Mental Disability
• Hearing Impairment
• Visually Impaired
• Emotional Behavioral Disability
• Deaf-Blind
• Multiple Disabilities
• Autism
• Traumatic Brain Injury
State agency children diagnosed with an educational disability in the Moderate Incidence category represent 52.2 percent (n=386) of the population of state agency youth with an educational disability. Moderate Incidence disabilities include:
• Mild Mental Disability
• Orthopedic Impairment
• Other Health Impaired
• Specific Learning Disability
• Developmentally Delayed (students aged 9 or younger)
State agency children with a High Incidence disability account for 1.1 percent (n=8) of the population. High Incidence disabilities, or speech language disability, are the most common in the general population and usually require the least intensive educational support. In comparison to SAC, 24.9 percent (n= 28,707) of all diagnosed educational disabilities in Kentucky public schools are High Incidence disabilities (Figure 10).
According to the information provided in the December census: 55 percent (n=454) of all students in KECSAC programs contracted with DCBS; 36 percent (n=269) of all students in DJJ contracted or owned/operated programs; and 59 percent (n=16) of all students in MHDT programs have been diagnosed with an educational disability that adversely affects their educational achievement.
From year to year, the types of disabilities diagnosed change most often in the SAC population, but one trend stays constant. Students in the care and custody of the state and placed in a state agency program continue to have extensive educational needs because of the severity of the educational disabilities they exhibit.
In addition to IDEA educational disabilities, 5 percent (n=85) of students in KECSAC educational programs have a 504 Plan designed to ensure a child with special health care needs fully participates in
school. Usually, a 504 Plan is used by a general education student who is not eligible for special education services.
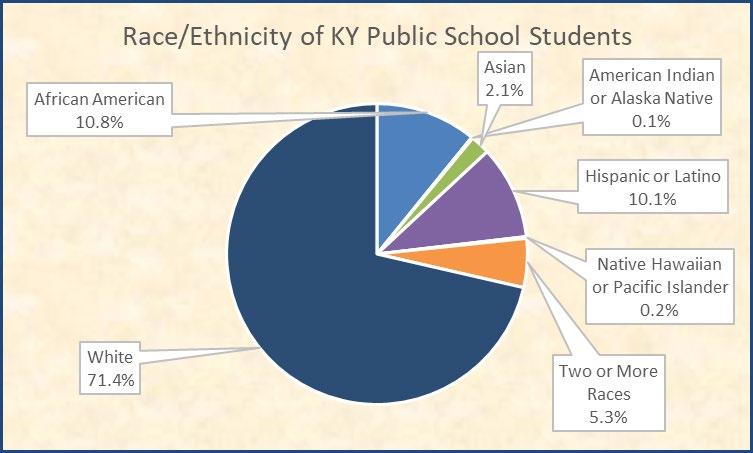
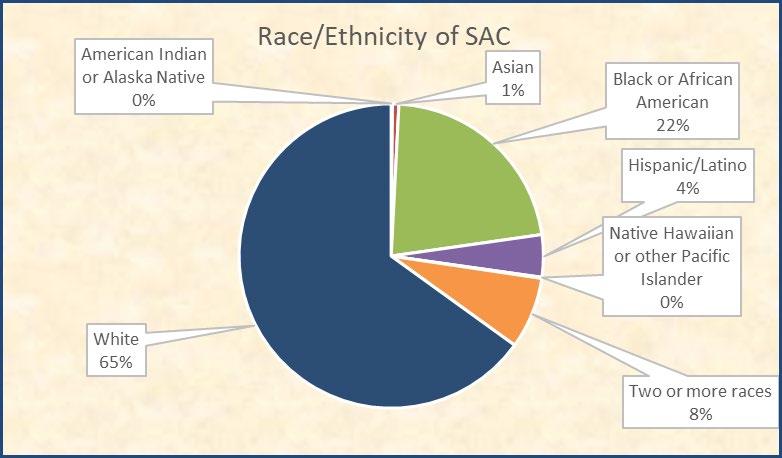
Race
The census taken each year provides valuable information about the race and ethnicity of the youth in state care. Understanding the racial make-up of these youth is helpful in ensuring all students receive equal access to resources and achieve high standards. According to the December census, 65 percent (n=1044) of SAC are classified as White while almost 22 percent (n=352) are classified as Black or African American. In comparison as illustrated in Figure 11, 71.4 percent (n=453,870) of all students in Kentucky public schools are classified as White and almost 10.8 percent (n=68,938) are classified as Black or African-American, according to the 2023-2024 School Report Card. 4
With more than twice the percentage of Black students in state agency programs than in regular Kentucky public schools, it is clear a disproportional number of Black or African American youth are being educated in state agency programs. The disproportionality of youth in the child welfare system and juvenile justice is a well-documented and extensively researched topic, not only in Kentucky but throughout the country.
Youth classified as Two or More races represent 7.6 percent (n=122), and youth identified as Hispanic/Latino account for 4.5 (n=72) percent of all SAC. Less than 1 percent, or fifteen students, of all SAC in a KECSAC- funded program on December 2nd was identified as American Indian or Alaska Native; Asian; or Native Hawaiian or Pacific Islander.
4
Kentucky Department of Education, School Report Card: Home - Kentucky School Report Card
Figure 11: Race/Ethnicity of Kentucky Public School Students
Figure 12: Race/Ethnicity of State Agency Children
Age
KECSAC-funded state agency educational programs provide services to students between the ages of 5 and 21. On December 2, 2024, the average age of a youth in KECSAC-funded programs was twelve years old. Figure 13 shows the count of the population at each age level. The largest age group of SAC students are 16-year-olds at 336, or 20.9 percent of all SAC, followed by 17-year-olds with 296 or 18.4 percent. There were five Kindergarten students and three students aged 20 being served on this date
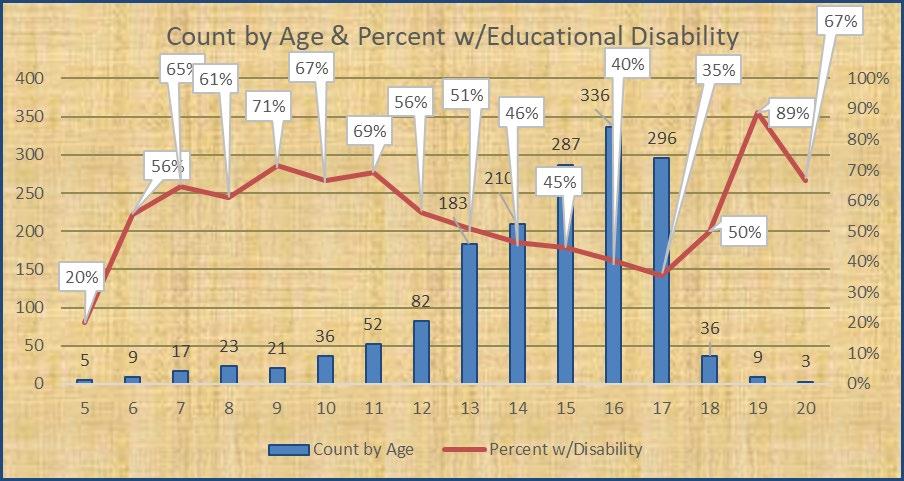
Figure 14 illustrates the number of students at each age-level and the percentage of children at that age diagnosed with an IDEA educational disability. As shown, seventy-one percent of all 9-year-olds (n=15) have been diagnosed with an educational disability, as have 51 percent of all 13-year-olds (n=93) and 35 percent (n=105) of all 17-year-olds
Figure 13: Age of State Agency Children
Figure 14: Count by Age & Percent w/Educational Disability
Grade
Figure 15 indicates the number of SAC by grade. On December 2, the largest numbers of SAC were in grades 9 and 10, representing 41.4 percent (n=665) of the entire SAC population in a KECSAC-funded program. Youth in grades 11 and 12 represent 22.5 percent (n=361) of the SAC population while 26.8 percent (n=430) are in grades 6 through 8. Students in grades Kindergarten through 5 represent 8.3 percent (n=133) of the population. Students in grade 14 and graduates represent 1 percent (n=16) of the SAC population. KECSAC regulations allow youth who have earned a high school diploma but are still receiving services from the district to generate KECSAC funding.
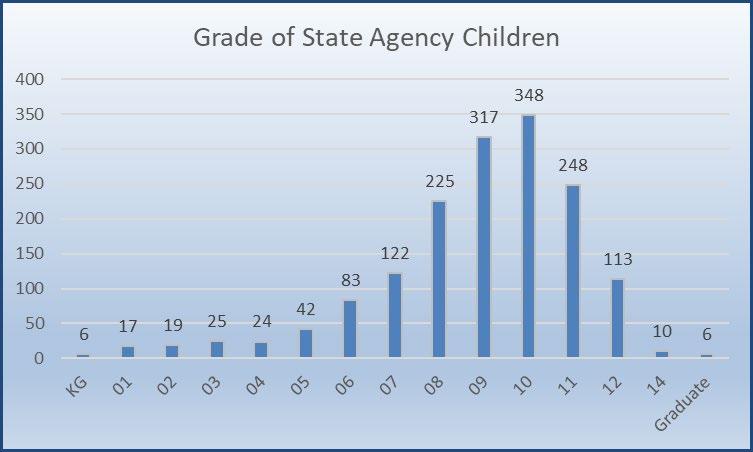
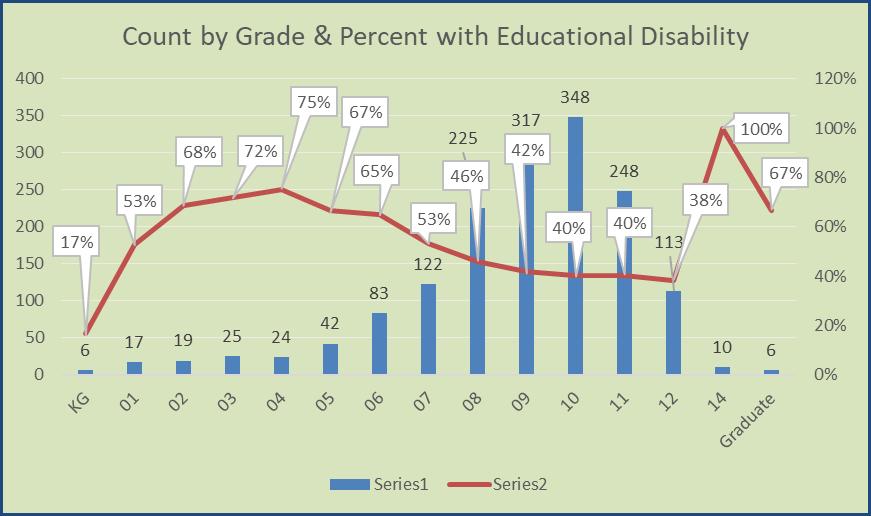
Figure 16 illustrates the count and percentage of students in grades Kindergarten through 12 diagnosed with an educational disability. As shown, the elementary grade levels have the highest percentage of disabilities. Seventy-two percent (n=18) of all SAC students in third grade and 65 percent (n=54) of all sixth graders receiving educational services in a KECSAC-funded program have been identified with an educational disability. More than half of students in grades 1-8 also have an identified educational disability.
Figure 15: Grade of State Agency Children
Figure 16: Count by Grade & Percent w/Educational Disability
School administrators in KECSAC programs reported that 149 students received a high school diploma between December 2, 2023, and December 2, 2024. Fifty-eight students applied and were admitted to a post-secondary program while attending a KECSAC educational program. Since the implementation of Senate Bill 97 in the 2014-2015 school year which raised the official dropout age from sixteen to eighteen, youth in SAC programs have not had the option of earning a high school equivalency degree rather than a diploma. Students had to reach the official withdrawal age and be officially withdrawn from school for ninety days before being eligible to earn a high school equivalent diploma. However House Bill 522, signed in 2017 once again gave state agency children who are at least seventeen years of age the option of attaining a high school equivalency diploma. During the 12-month period between the 2023 census and the 2024 census, administrators reported fifteen youth earned a high school equivalency diploma. Administrators also reported that fifty-one youth eighteen years of age or older left their care without either a diploma or high school equivalent.
Gender
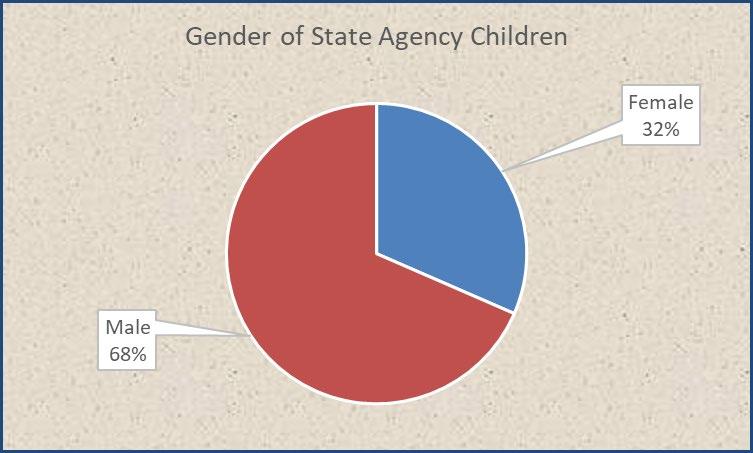
The gender division of youth in KECSAC-funded programs changes very little from year to year. According to information submitted on December 2, 2024, males represented 68 percent (n=1098), and females represented 32 percent (n=507) of the total SAC population. Forty-nine percent (n=537) of all males in KECSAC programs have been diagnosed with an educational disability while 40 percent (n=202) of females have been diagnosed. By comparison, statewide only 12 percent (n= 75,559) of males and just 6 percent (n= 39,879) of females have an educational disability according to the 2023-2024 School Report Card 5
5 Kentucky Department of Education, School Report Card: Home - Kentucky School Report Card
Figure 17: Gender of State Agency Children
Teaching Staff
According to information reported on the December 2 census, districts employ the equivalent of 307.50 full-time certified teachers who provide educational services to youth in KECSAC funded programs across the state. These teachers generally teach in classrooms located at the treatment program (not in a district building) and may teach several grade levels in one classroom. Of these teachers, seven are Nationally Board Certified and 59 percent (n=181.25) are certified in special education, which means they have received training in adapting and modifying instruction to meet the individual needs of each student. This special training helps the student to develop academically as well as socially and emotionally. Additionally, teachers with special education certification can provide appropriate intervention assistance many students need to make curriculum connections. KECSAC facilities reported that thirty full-time equivalent (FTE) certified teachers are a minority
Fourteen teachers in KECSAC-funded programs were emergency certified according to information provided on the census forms, which is three less than in 2023. Teachers with emergency certification generally do not have training in special education services or core content areas, but because a qualified teacher is not available for the position, they may be hired as the classroom teacher. 6
Many districts provide a full-time administrator to oversee the educational component of the SAC program. The number of full-time administrators has decreased slightly from seventy-eight in 2023 to seventy-four in 2024. School districts also provide 88.50 full-time equivalent teaching assistants and one hundred full-time equivalent educational support staff to meet the intense educational needs of state agency children.
Length of Stay
The length of time a youth continues to receive education services from a state agency education program varies based on the type of program as well as the behavioral, emotional, and educational needs of the youth. For youth in a DJJ operated facility, a judge determines the length of stay while youth in a DCBS group home may stay until the treatment program is complete, or until a permanent or foster home is available. Youth receiving education services at a MHDT program may stay for a specific treatment period or until a mental health professional approves the transition back to a traditional classroom. In some programs, youth may only stay a few days while other programs may have youth for one year or more. The average length of stay for a youth in a KECSAC-funded program is 104.3 days. The average length of stay for SAC in DJJ facilities was 94 days. DCBS facilities average length of stay was 111 and in MHDT were 201 days as reported on the 2024 Census.
STATE AGENCY SNAPSHOTS
Kentucky’s three state agency programs that provide direct care to SAC are the Department for Community Based Services (DCBS), Department of Juvenile Justice (DJJ), and the Department for Behavioral Health, Developmental and Intellectual Disabilities (DBHDID). This section looks at students served by DCBS and DJJ.
Department for Community Based Services
According to the information provided on the 2024 census, 51.6 percent (n=828) of all children receiving educational services in a KECSAC-funded program were in one of thirty residential programs contracted with DCBS to provide direct care to children. The percentage of the SAC population receiving educational services while in a DCBS program decreased from 53 percent in 2023 to 51.6 percent in 2024. Youth under the DCBS umbrella may live in group homes, treatment centers, temporary shelters, psychiatric residential treatment facilities, or hospital settings in programs that are operated by or contracted with the Cabinet for Health and Family Services or financed by the Cabinet in a private facility pursuant to a childcare agreement. Figure 18 illustrates the number of DCBS youth found in each program type.
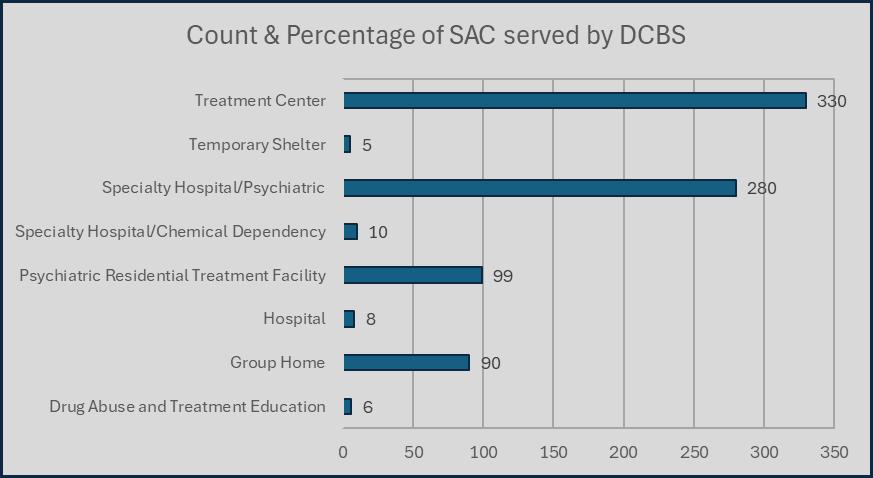
The largest group of youth, 40 percent (n=330) are in treatment centers while the second largest group, thirty-four percent (n=280) of youth, were in psychiatric hospitals. The third largest group, 12 percent (n=99), live in psychiatric residential treatment facility. Hospitals also provide chemical dependency treatment and other services needed to help this vulnerable population of students navigate their oftentroubled childhood. Data shows that five youth are housed in temporary shelters which provide services for a short period of time, usually around three days.
Administrators of DCBS-contracted programs reported providing educational services to 3,177 different children during the 12-month period between December 2, 2023, and December 2, 2024
Fifty-five percent of all youth in DCBS contracted programs (n=454) have been identified with an educational disability that adversely affects their learning process. Forty-four students or 5 percent of
Figure 18: Count and Percent of SAC served by DCBS
the population have a 504 plan that document accommodations provided to a student with unique learning needs, so the student has access to the same learning environment as students without a disability.
Figure 19: Educational Disabilities of SAC served by DCBS
Figure 19 illustrates the types of educational disabilities experienced by youth in DCBS programs and the count within each category. The largest percentage, 30 (n=136), of youth in DCBS educational programs identified with an educational disability have been identified as Emotional Behavioral Disability (EBD) The other educational disability most frequently identified in youth in DCBS programs is Other Health Impaired with 28.4 percent (n=129) of the population. Disabilities in this category include attention deficient disorder and attention deficient/hyperactivity disorder. Youth with mild mental disability represent 13.2 percent (n=60), while youth with functional mental disability represent 4.6 percent (n=21) of the population. A little over 1 percent (n=5) of youth with an educational disability have been identified with a speech language impairment, the educational disability seen most frequently in Kentucky public schools.
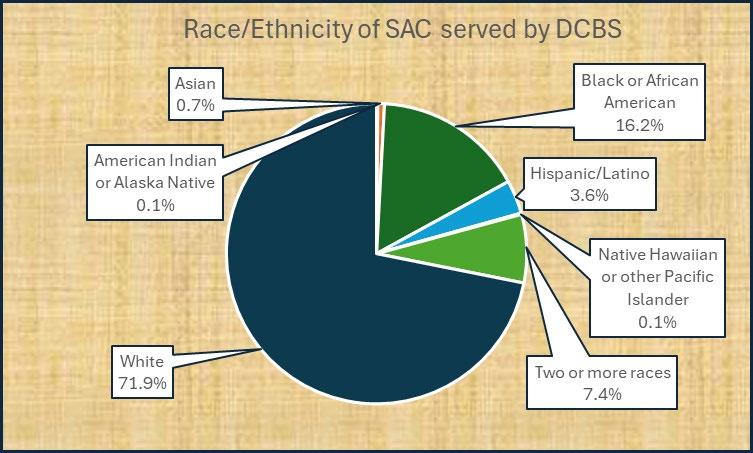
On census day 2024, 71.9 percent (n=595) of youth receiving educational services while in a DCBScontracted facility were identified in race as White and 16.2 percent (n=134) were identified as Black or African American. Students identified as Two or More races accounted for 7.4 percent (n=61) of the DCBS population and 3.6 percent (n=30) were identified as Hispanic/Latino. Six students, or 0.7 percent of the DCBS population were identified as Asian. American Indian or Alaska Native and Native Hawaiian or Pacific Islander represent 0.2% (n=2) of the DCBS population
Figure 20: Race/Ethnicity of SAC served by DCBS
DCBS programs serve students between the ages of 5 and 21. Figure 21 shows the count of SAC at each age. The largest age group of children in DCBS programs on December 2, 2024 was between the ages of 13 and 16 with 62 percent (n=513) of all youth in this age group. Youth ages 5 through 12 account for 24.5 percent (n=203) of all students in DCBS programs. Youth aged 17 through 20 account for just 13.5 percent (n=112) of youth in DCBS contracted facilities. The average age of a youth in a DCBS facility is fourteen; however, the age seen most frequently is sixteen
Figure 21: Age of SAC Served by DCBS
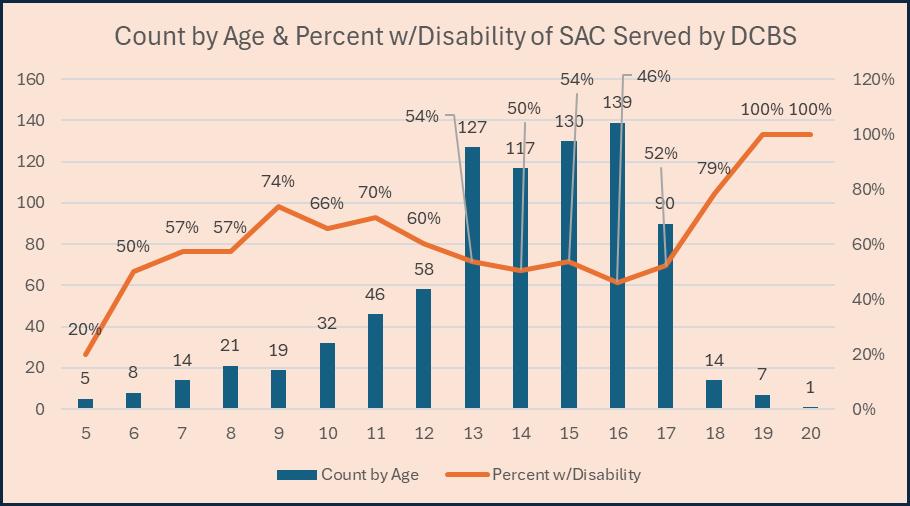
Figure 22 illustrates the count of each age as well as the percentage of that age identified with an educational disability. As shown, 57 percent (n=12) of all 8-year-olds in DCBS-contracted programs have been identified with an educational disability as have 50 percent (n=59) of 14-year-olds and 52 percent (n=47) of 17-year-olds. Also, note that 100 percent of eighteen through twenty-year-olds have been diagnosed with an educational disability.
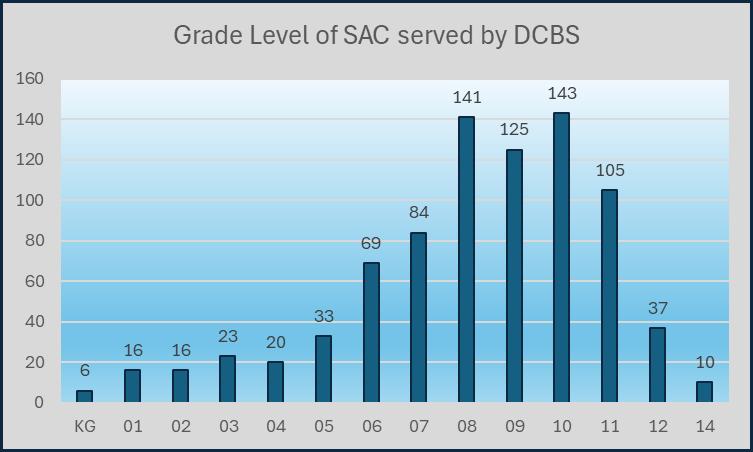
Students in the 8th and 10th grades represent the largest group of students receiving educational services in a DCBS facility. With seventeen percent in 8th grade (n=141) and 17.3 percent in 10th grade (n=143), students in these grades account for 34.3 percent (n=284) of SAC in DCBS facilities.
Students in grades 5 through 7 represent 22.5 percent (n=186) of the youth population in DCBS contracted facilities. A little under 9 percent (n=81) of the population were in grades Kindergarten through 4, and 12.7 percent (n=105) are in the 11th grade. Students in the 9th grade represent 15.1 percent of the population (n=125). Students in the 12th and grade 14 represent 5.7 percent (n=47). No graduates were reported on December 2nd count for DCBS programs.
Figure 22: Count by Age & Percent w/Disability of SAC served by DCBS
Figure 23: Grade Level of SAC served by DCBS
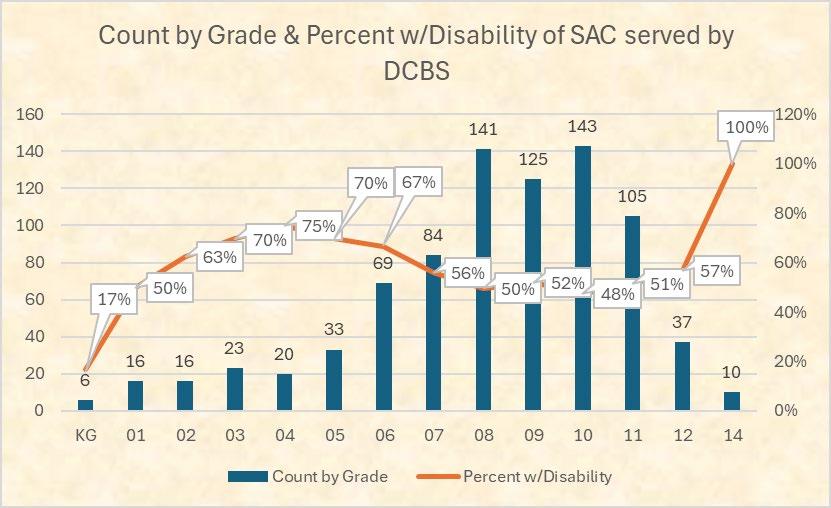
Figure 24 illustrates the count and percent of students in DCBS contracted programs at each grade identified with an educational disability. Seventy percent (n=16) of all children in 3rd grade have an educational disability as have 56 percent (n=47) of 7th grade students and 51 percent (n=54) of 11th grade students
School districts with DCBS-contracted programs employ 169.5 full-time equivalent (FTE) certified teachers, of which 121.5, 72 percent, hold a certification in special education. Seven teachers in DCBS educational programs are emergency certified. Thirty-five DCBS-contracted programs employ one fulltime administrator to oversee the education of SAC. Additionally, districts employ 42.5 teaching assistants and the FTE of thirty-seven other support staff to provide necessary educational services to SAC.
School administrators at DCBS programs reported that forty-three students graduated from high school between December 2, 2023, and December 2, 2024 Nineteen students applied and were admitted to college while in a DCBS educational program. During the 12-month period between the 2023 census and the 2024 census, administrators reported that three youth earned a high school equivalency diploma.
The average length of stay for a youth in a DCBS contracted program was 124 days, which is a slightly longer stay than the SAC population because youth with the most severe educational, mental, and physical needs are in DCBS residential programs where they could stay for years. The median length of the stay was 129.5 days.
Figure 24: Count by Grade & Percent w/Disability of SAC served by DCBS
Department of Juvenile Justice
According to information reported on the December 2nd census count, 46.7 percent (n=750) of all students receiving educational services from a KECSAC-funded program were in a Department of Juvenile Justice (DJJ) program.
DJJ owns and operates six regional detention centers, six youth development centers, five day treatment programs, and two group homes. DJJ contracts with school districts that have implemented a memorandum of agreement with KECSAC to operate nineteen-day treatment programs. Youth who received services in a DJJ-owned/operated program were either in pre-trial detention awaiting trial or had been adjudicated by the court system and placed in a department operated facility for a specific period. Except for the five day treatment programs, all DJJ-owned programs are residential programs.
Figure 25 illustrates the number of SAC in each type of DJJ program as well as the percentage of the DJJ population in the program type.
Figure 25: Type of DJJ Programs
As noted above, DJJ contracts with nineteen local school districts to provide day treatment services to court ordered or probated youth within the district’s region. These programs are operated by the contracted school districts and provide both educational services as well as counseling and treatment services to youth from the local and surrounding districts.
Youth in these programs have been court ordered to attend the program, which is often seen as a community effort to stabilize the youth before placement in a more restrictive environment is required.
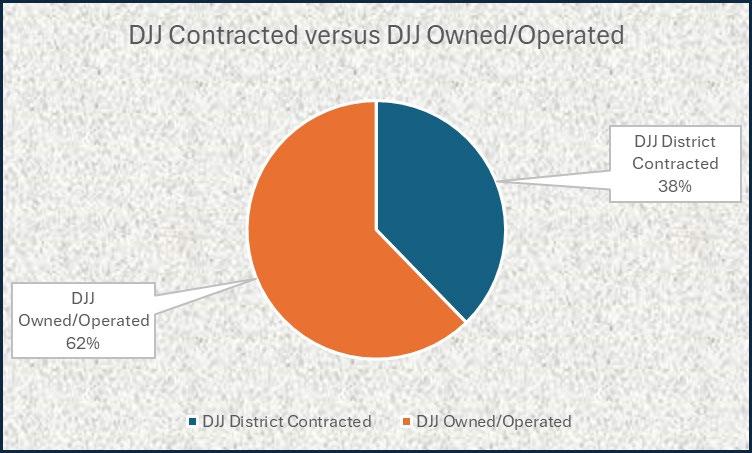
As illustrated in Figure 26, 62 percent (n=467) of the DJJ population receive their educational services at a DJJ-owned/operated treatment program while 38 percent (n=283) attend contracted, district operated day treatment programs.
Figure 26: DJJ Contracted versus DJJ Owned/Operated
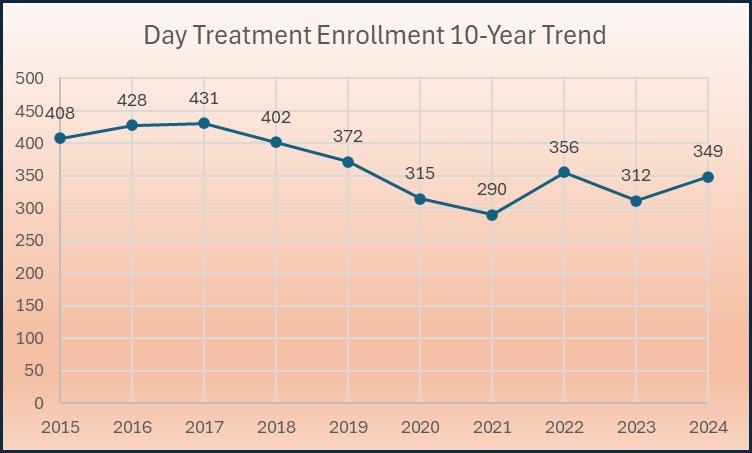
DJJ operated and contracted programs have experienced a significant decline in the number of students served due to the strict enforcement of the legal definition of SAC as defined by KAR 158.135. Another contributing factor of the decline is the implementation of Senate Bill 200 (2014), which promotes the reduction of out-of-home placements, strengthening early intervention, and improving community supervision of juveniles. 7 DJJ operated and contracted day treatment programs have experienced a significant decline in the number of students being served, as illustrated in Figure 27 on the next page To receive designation as a state agency child and be eligible for KECSAC funding, youth receiving educational services at a day treatment program have been issued a court order to attend the day treatment. Because the underlying desire of SB 200 is to keep youth out of the court system using a Family Accountability, Intervention, and Response team (FAIR team), many juvenile cases never reach the level of the court system but are processed through FAIR team meetings led by a court designated worker. As a result, overall enrollment in day treatment programs has declined. This decrease in the number of court-ordered youth creates a significant funding problem for contracted day treatment programs, recognized by the supporters of SB 200 as a community intervention service that could intervene and deter youth involvement with the juvenile justice system.
7 Kentucky SB 200. 2014. Regular Session. (2014, April 25).
Figure 27 illustrates the enrollment in day treatment programs since 2015. To help with the funding problems faced by district contracted day treatment programs, KECSAC, with support from Department of Juvenile Justice introduced legislation during the 2018 legislative session to change the definition of state agency children to include those referred to a DJJ day treatment program by the local FAIR team. This legislation was passed and signed by the governor in April 2018 and became effective for the 20182019 school year. On census day 2024, local FAIR teams had referred to twenty-three youth to day treatment programs. This is a decrease from thirty-one referrals on the 2023 census.
Thirty-six percent (n=269) of all youth in DJJ programs have been identified with an educational disability that adversely affects their educational progress. Figure 28 illustrates the total number of SAC in DJJ programs within each educational disability. As shown, 42 percent (n=114) are diagnosed with Emotional Behavioral Disorder (EBD). The next largest disability type diagnosed is Other Health Impaired (OHI), which includes ADD and ADHD. Thirty-two percent (n=85) of the DJJ population are diagnosed with this type of disability. Twelve percent (n=31) of youth in DJJ programs have a Mild Mental Disability (MMD) diagnosis while 13 percent (n=36) have been diagnosed with Specific Learning Disability (SLD). An additional thirty-nine students have a Program 504 Plan.
Figure 27: Day Treatment Enrollment 10-Year Trend
Figure 28: Educational Disabilities of SAC served by DJJ
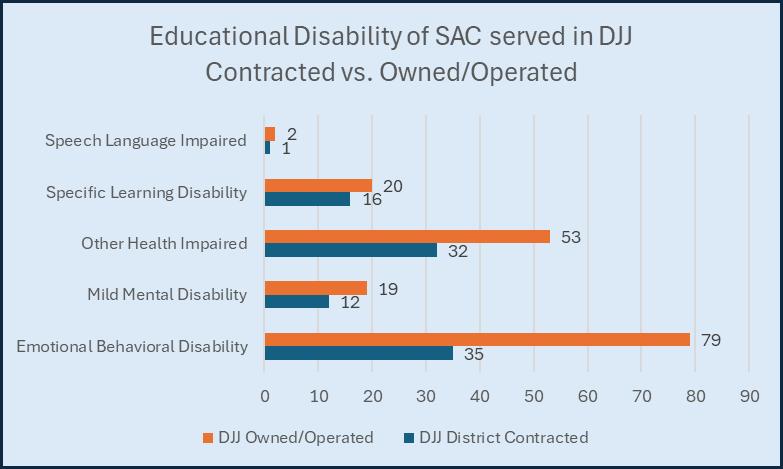
Figure 29 illustrates the distribution of youth with educational disabilities between the contracted programs and owned and operated programs. Finding most youth with Emotional Behavioral Disability and Mild Mental Disabilities in DJJ owned and operated programs clearly illustrates the importance of diagnosing and treating these educational disabilities early.
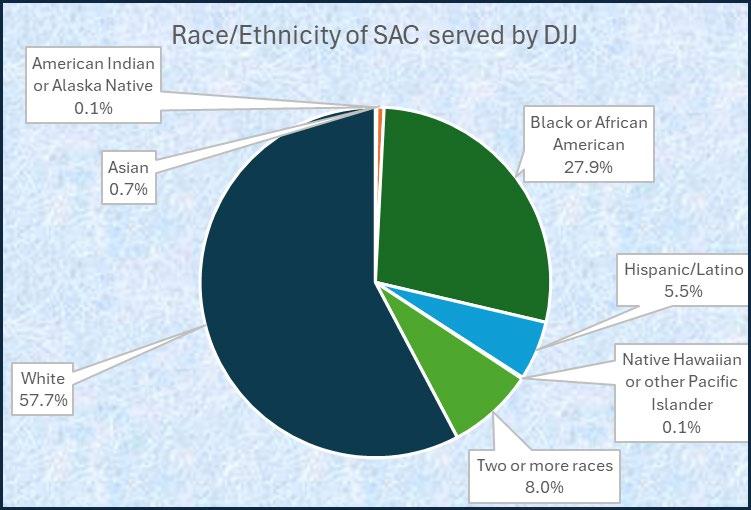
Figure 30 illustrates the race of students in DJJ programs. As shown, 57.7 percent (n=433) of all youth in DJJ programs are White, 27.9 percent (n=209) are Black or African American, 5.5 percent (n=41) are Hispanic/Latino and eight percent (n=60) are listed as Two or more races. American Indian or Alaska Native, Native Hawaiian or other Pacific Islander and Asian students account for 9 percent (n=7) of the DJJ population.
Figure 29: Educational Disability of SAC served in DJJ Contracted vs Owned/Operated
Figure 30: Race/Ethnicity of SAC served by DJJ
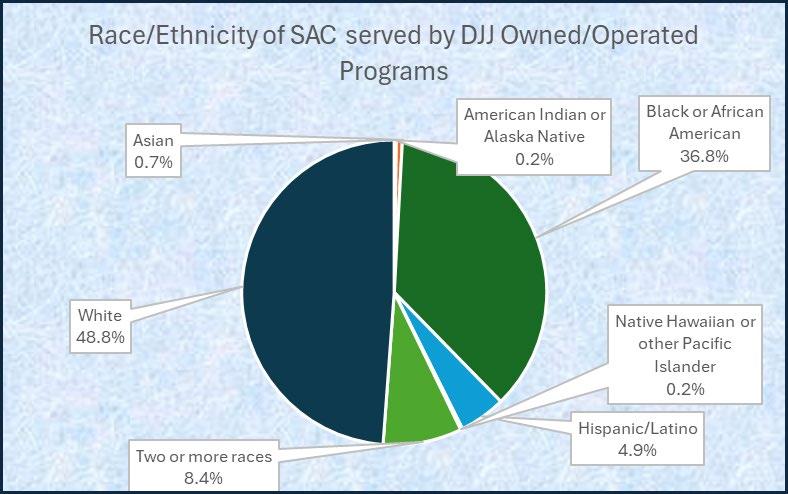
While 27.9 percent (n=209) of all youth in a DJJ educational program on census day were identified as Black or African American, representing a significantly disproportionate representation with the entire student population compared to statewide enrollments in traditional learning environments, the actual distribution within the type of facility is even more disproportionate. As noted in Figure 31, 36.8 percent (n=172) of the population in DJJ programs on December 2 who were receiving their educational services from a DJJ-owned or operated program were identified as Black or African American. While only 48.8 percent (n=228) of students in DJJ owned or operated programs were White DJJ-owned or operated programs are the most restrictive DJJ programs and include residential programs like detention centers, youth development centers, and non-residential day treatment programs with DJJ staff in the program.
In contrast as shown in figure 32, only 13.1 percent (n=37) of the population being served in a contracted program were identified as Black or African American and 72.4 percent (n=205) of all youth in a contracted DJJ program were White DJJ contracted programs are operated by the local education agency/school district. As mentioned previously in this report, Black or African American youth are disproportionally represented in the DJJ population, but even more so when considering the types of programs where students are receiving educational services. Black or African American youth represent 21.9 percent (n=352) of the entire population of state agency children in KECSAC-funded programs on December 2, 2024, and 27.9 percent (n=209) of the entire enrollments in DJJ programs, yet they represent 36.8 percent (n=172) of the population in DJJ’s owned and operated programs which have the most restrictive environments.
Figure 31: Race/Ethnicity of SAC served by DJJ Owned/Operated Programs
According to the census data illustrated in Figure 34, youth in the 9th grade represented 25.5 percent (n=191) of DJJ students while 10th grade students accounted for 26.5 percent (n=199). Almost nineteen percent (n=141) of all DJJ youth were in the 11th grade and 10.3 percent (n=77) were in 12th grade or graduates. Youth in grades 4 through 8 accounted for 18.9 percent (n=142) of DJJ youth.
The data provided in the census regarding the age and grade levels of students in DJJ programs clearly illustrates the extent that students are academically behind their public-school peers. While 26.7 percent (n=200) of all DJJ youth are 17 years old, only 18.8 percent (n=141) are in 11th grade, as would be expected of normally progressing students. We see this illustrated again with the 10th grade. While 26.5 percent (n=199) of the DJJ population are in the 10th grade, only 25.5 percent (n=191) of students are aged 16, as are most normally progressing students.
The gender distribution of the population in DJJ programs is 81 percent (n=604) male and 19 (n=146) female.
Throughout the state, school districts with DJJ programs employ 132 full-time equivalent certified teachers to meet the educational needs of youth in custody or under the supervision of DJJ. This equates with a student to teacher ratio of 6:1. Forty-one percent (n=38) of these teachers are certified in special education, meaning they have received training in adapting and modifying instruction to meet the individual needs of each student. According to the data, DJJ programs had seven teachers with an emergency certification in their programs on the day of the census. Thirty-three full-time administrators as well as forty-five teaching assistants and fifty-three support personnel to assist with educational services.
For the 12-month period between December 2023 and December 2024, administrators report that one hundred youth earned their high school diploma during their stay in a DJJ program, while twelve youth earned a general education equivalent diploma. With the implementation of House Bill 97 which raised the official dropout age from 16 to 18, youth in SAC programs did not have the option of earning a general education equivalent diploma rather than a diploma. Students must reach the official withdrawal age and be officially withdrawn from school for 90 days before being eligible to take the General Education Diploma (GED). However, House Bill 522 , signed in 2017 once again gave state agency children who are at least 17 years of age the option of attaining a high school equivalency diploma.
Figure 34: Grade of Youth in DJJ Programs
CONCLUSION
As the December census illustrates, SAC, those children committed to or in the custody of the state and placed in a program operated, contracted, or financed by one of Kentucky’s state agencies, continue to be a population of youth with intense educational, behavioral, and emotional needs. Often removed from homes because of neglect or abuse, these young people are Kentucky’s children, and as such deserve the best education, treatment, and care we can possibly provide. As legislators, policymakers, administrators, teachers, and caregivers we have an obligation to ensure these children have every opportunity needed to develop the life skills, learning skills, and social skills necessary to become successful, contributing members of our communities. Kentucky cannot afford to lose these children to neglect, indifference, or budgetary cuts. Providing the resources necessary to change the course of these children’s lives now is much more acceptable than providing the resources necessary to confine or support them for a lifetime. Policymakers and other stakeholders must continue to focus on meeting the needs of these children. Only through continued collaboration can these students achieve their full potential and become productive members of our Commonwealth.