

SPRING 2022 Pueo o Kū Journal of Science, Technology, Engineering, & Mathematics KAPI‘OLANI COMMUNITY COLLEGE Board of Student Publications
Submission All submissions for the 2022 Pueo o Kū were produced at KapCC Spring 2020 to Fall 2021.
About Pueo o Kū
Students in STEM and Health Sciences submitted their work at the biannual Student Undergraduate Research Fair (SURF), through faculty/staff recommendations, or by filling out an online submission form. Students are able to submit more than one work. Submitted work was reviewed by a student committee. Posters must be submitted digitally as a .pdf, .ppt, or .pptx (file size should not exceed 8 MB). High resolution images are recommended. Work other than posters are also accepted. The author’s content is printed as submit ted; however, the formatting style may be changed for consistency and/or the layout may have been rearranged or resized for printing purposes. ©Kapiʻolani Community College, The University of Hawaiʻi is an equal opportunity/affirmative action institution and is committed to a policy of nondiscrimination on the basis of race, sex, age, religion, color, national origin, ancestry, disability, marital status, arrest and court record, sexual orientation, or status as a covered veteren.
Publication Journal Advisors: Li-Anne Delavega & Kaleimaile Galarita Peer Review Committee: Serena Harris, Joselito Macabante, Jr., Meeya O’Dell, & Kiana Walters Cover Artist & Student Art Director: Tre Zamora MaukaRomynSupervisor:SabatchiandMakai Motifs: Andrew Publisher:Chang Board of Student Publications Kapiʻolani Community College
Established in 2005, the Kapiʻolani Community College STEM program aims to improve the quality of education in the fields of STEM through undergraduate research projects, internships, peer mentoring, and events. Through preparing students to transfer to four-year institutions in STEM and providing workforce skills development, the STEM Program fosters individual achievement and lifelong learning.
The Pueo o Kū Journal of Science, Technology, Engineering, and Mathematics (STEM) features the undergraduate research of the STEM and Health Sciences programs at Kapiʻolani Community College and is published by the Board of Student Publications every two years.
He ʻūlei kolo. [956] A creeping ‘ūlei. Mahalo ā nui for reading our STEM Journal, Pueo o Kū. The last two years have been full of uncertainty, fear, and challenges as the COVID-19 pandemic upended normalcy and dramatically altered the landscape of our lives. We recognize the losses and failures that many of our students and faculty have experienced, and know that there were many projects that were not conducted or completed, yet it is important to remember that failure also serves as a catalyst for growth and new knowledge.
program at our site, kccstem.com/research. We hope that the following pages fill you with renewed excitement for what our STEM students will accomplish in the future. Me ke UndergraduateLi-Annealoha,DelavegaResearch Coordinator Kaleimaile
The ‘ūlei, a hardy indigenous vine, was prized for its strong wood which was used to make fishing spears, and a tough, strong person was said to resemble this vine. This 2022 edition of Pueo o Kū acknowledges the continued work and tenacity of our students and their faculty advisors through the midst of constant transitions, challenges, and disruptions. As vines grow around, through, or over obstacles, the research projects in this edition highlight how faculty and students have pivoted and found new pathways. Faculty adapted labs and in-person research to at-home field work kits or shifted to virtual modeling and analysis work. Some students took the initiative to solve the problems caused by COVID-19 in our community, such as making hand sanitizer for the KapCC campus when stores were sold out. Like the ‘ūlei, our students have shown resilience and strength, and even when progress has not been easy or linear, they have continued to move forward. Pueo o Kū undergraduate research Galarita
and learn more about our STEM and
STEM Outreach Coordinator
You can read our past issues of
BIOLOGICAL SCIENCES Learning Coral Survey Methods Through the Polynesia Mana Project at the CRIOBE Keanu Rochette-Yu Tsuen Faculty Advisors: Yannick Chancerelle, M.S. & Serge Planes, Ph.D.
Table of Contents
Lei Kalaiwaʻa & Lia Takeshita Faculty Advisor: Mike Ross, M.S. Kapiʻolani Community College Botanical Signage & QR Inventory
Faculty Advisors: Li-Anne Delavega, M.A. & Hervé Collin, Ph.D. 2021 Fall Manu o Kū Project James Lee & Meeya O’Dell Faculty Advisor: Wendy Kuntz, Ph.D. The Variance of Mosquito Larvae in High and Low Elevations
Euoan Jei Anthony Raquel & Sheri Marzan Faculty Advisor: Wendy Kuntz, Ph.D. Shifting the Balance in a Lowland Mesic Forest: Maximizing the Native Seed Bank
Pueo o Kū: Journal of Science, Technology, Engineering, & Mathematics
David Clements, Rebecca Koeroessy, Kanoa Nakamura, Howard Thiele, Joey Williams-Solomon, Nicole Yarbrough, Anthony Zertuche, & Jason Misaki Faculty Advisors: Wendy Kuntz, Ph.D. & Mike Ross, M.S.
Emma Ho, Lei Kalaiwaʻa, & Kaua Kalaiwaʻa
Effects of Simulated Beetle Feed Damage on the Growth Rate of Scaevola taccada (Naupaka Kahakai)
Kaila Kaawaloa Faculty Advisor: Wendy Kuntz, Ph.D. 2724211917141210
Isaiah Stojack Faculty Advisor: Mackenzie Manning, M.S. Effect of Invasive Algae Removal on Percent Cover Changes of Native Algae (Spyridia) in Kuli‘ou‘ou Beach
How Tourists Have Been Able to Connect with the Ocean and Learn About Sustainability from Their Visit to the Waikīkī Aquarium
Xander Allen Faculty Advisor: Jacob Tyler, M.S. Super Tuesday 2008 Tornado Outbreak in Arkansas
Faculty Advisors: John Berestecky, Ph.D., Colleen Allen, Rebecca Kanenaka, M.S., Marci Amii, M.S., & Draven Aquino SCIENCES Change: What Is It and How Does It Affect Hawaiʻi?
Serena Harris Faculty Advisor: Jacob Tyler, M.S. Comparing Various Biodiesel Production Methods to Optimize Yield, Quality, and Efficiency Dimitrijevic
454340363129The Allure of Nitrogen on Expecting Mosquito Mothers
Anya
Bryan Suechting
Faculty Advisors: Wendy Kuntz, Ph.D. & Krista Hiser, Ph.D. Hand Sanitizer Production During a Pandemic via the Fermentation and Distillation of Ethanol
Faculty Advisor: Kathleen Ogata, Ph.D. Modeling and Solving the Sun-Earth-Moon System’s Differential Equations to Simulate Its Kinematic
Properties
Mackenzie Jahnke
PHYSICAL
Climate
Alden Fernandez Faculty Advisor: Hervé Collin, Ph.D.
Creating a Safer Campus by Developing a COVID-19 Tracking System
Creating an Arduino Based Sanitizing Robot to Reduce the Spread of Viruses in Grocery Stores
6865626056545048
Monitoring the Greenhouse Watering System for Native Plants
Designing a Vehicle to Collect Debris to Minimize Threats to Existing and Future Space Missions and Technology
Jenny Brown Faculty Advisor: Hervé Collin, Ph.D.
MATHEMATICS
Patrick Empleo Faculty Advisor: Aaron Hanai, Ph.D.
Black Hole Singularity Hypotheses Using Complex Manifolds and Dice Theory in EFE
Jeraldine Milla Faculty Advisor: Jacob Tyler, M.S.
Katlynn Vicuña Faculty Advisor: Aaron Hanai, Ph.D. CanSat 2021: Only Cans Cole Pelayo, Grayson Levy, Joselito Macabante, Jr., Kelly Hwang, Kiana Walters, & Matthew Paulino Faculty Advisor: Aaron Hanai, Ph.D.
Shek Hong Perseus Chan Faculty Advisor: Austin Anderson, Ph.D. Pathways
Phat Ca, Tyler Cho, Ariana Isaacs, Leon Lee, & Dasen Nakatani Faculty Advisor: John Rader, M.S.
ENGINEERING Hōʻaeʻae: Persisting Knowledge
Kiana Walters Faculty Advisor: Hervé Collin, Ph.D.
Improving the Understanding of Energy Conservation in Hawaiʻi’s Community Nikki Arakawa Faculty Advisor: Hervé Collin, Ph.D. INFORMATION & COMPUTER TECHNOLOGY Analyzing Energy Usage in Kapiʻolani Community College Campus Buildings Nina Pandya Faculty Advisor: Lisa Miller, M.S. Optimizing NP Complete Timetable Algorithm Using Parallelization and Cost Clean Up Jatin Pandya & Tianhui Zhou Faculty Advisor: Lisa Miller, M.S. HEALTH SCIENCES How COPD Contributes to Cognitive Impairment Kate Baoit Faculty Advisor: Jung Eun Kim, Ph.D., RRT, RPFT Differences in Asthma Prevalence and Risk Factor Exposure Among Asian and Native Hawaiian and Pacific Islander Populations Dylan U. Custodio Faculty Advisor: Jung Eun Kim, Ph.D., RRT, RPFT PUEO O KŪ STAFF 848280787572
Learning Coral Survey Methods Through the Polynesia Mana Project at the CRIOBE
Keanu Rochette-Yu Tsuen¹ Faculty Advisors: Yannick Chancerelle, M.S. ² ³ & Serge Planes, Ph.D. ² ³ ¹Kapiʻolani Community College, HI, USA ²Centre de Recherche Insulaire et Observatoire de l’Environnement, Moorea, PF ³École Pratique de Hautes Études, Paris, FR
• Process data from quadrat photo
• Acquire additional skills by helping fellow research ers on the research center
Figure 1: The project Polynesia Mana covers 3 archipelagoes of French Polynesia. During this internship, 5 islands were surveyed: Tahiti, Moorea and Tetiaroa (Society Islands), Nukutepipi (Tuamotu Islands) and Tubuai (Austral Islands).
• Learn coral taxonomy of coral app. occurring in French Polynesia
Introduction Due to global climate change and additional local anthro pogenic pressures, coral reefs around the world are sub ject to bleaching events making them more susceptible to collapse. They mustbe monitored to better understand the consequences of higher oceanic temperature and local environmental pressures on their health over time. The project Polynesia Mana encompasses a set of is lands in French Polynesia and its surroundings where corals are surveyed every two years to enable a close monitoring of those ecosystems throughout the years.
Objectives In order to conduct similar research and surveys while in college, the objectives were the following:
• Recognize coral genera on-site andon photographic media
Figure 2: Example of Pocillopora spp. Picture taken on the outter reef of Arue, Tahiti. (Credits: Keilan Rochette) About This project was conducted during a highly competitive summer research internship program sponsored by the Centre national de la recherche scientifique (CNRS) and took place in Tahiti. STEM students with undergraduate research experiences at KapCC are more likely to be eligible for internships and scholarships. of Science, Technology, Engineering, and Mathematics
10 | Pueo o Kū: Journal


Conclusion and Acknowledgements
25 of the most common species of scleratinian corals occuring in Moorea were studied this summer 2021. The learning experience started with a Coral Indentification book written by Bosserelle et al. (2014). Close observa tion on coral squeletons (naked eye and binocular micro scope) allows for a better understanding on the defining features of each coral genus. Specific traits to observe are : shape and size of corallites, separated, shared or no walls, shape of the colonies (branching, encrusting, massive…) etc.
Figure 5: Side by side comparison of a “raw” quadrat photo (unedited) and a squared quadrat photo, standardized to fit within the guidelines of the project.
A B C D BIOLOGICAL SCIENCES | 11
On-Site Studies
The objectives of the internship were successfully com pleted. I have gained a comprehensive knowledge re garding coral genera occurring in Moorea and French Polynesia and have more confidence in my coral iden tification skills Through the help of fellow students and researchers, I have learned more about the current state of coral reefs in French Polynesia and the complex inter species interactions occurring in our lagoons. I would like to thank specifically Yannick Chancerelle for mentoring me throughout this internship experience and help me grow as a student and future researcher. Thank you to Dr. Serge Planes for accepting my intership request, allowing me to work at the CRIOBE of Moorea.
Photo Processing and Image Analysis
On-site studies allowed for a closer observation on cor al species and genera in the wild. Indeed, certain coral species can present ambiguities when observed on dig ital media. Corals also have plastic capabilities allowing them to alter their shapes to adapt to the enviromental conditions they are exposed to. For a more comprehen sive learning of coral taxonomy, researchers must be able to identify corals regarless of the form they take. Raw photos of quadarts were taken on 5 different is lands and were processed using Adobe Photoshop. Col ors were adjusted to enhance their quality and make the photos more legible for futher analysis. Pictures were croped, resized and squared. Each quadrat is numbered and represents a particular area on a transect. That way, it is possible to compare the changes at a site over time with as much accuracy as possible. Coral cover is eva luted using the point intersept method. Coral cover is expressed as a percentage and can be broken down per genus.
Learning Coral Taxonomy
Figure 3: Sample of corallites observed with binocular microscope (unspecified magnification).
Left to Right : Porites spp., Leptoseris spp., Acropora spp., Acanthastera spp.
Figure 4: Coral species observed in Moorea and studied for the internship. (A) Porites rus, (B) Pavona spp. (left) & Montipora spp. (right), (C) Acropora hyacinthus, (D) Fungia spp.
Figure 6: CRIOBE Staff, Researchers and Students surrounding President Emmanuel Macron during his visit in Moorea for the inauguration of Te Fare Natura (museum).


How Tourists Have Been Able to Connect with the Ocean and Learn About Sustainability from Their Visit to the Waikīkī Aquarium
Survey Methods
• Assisting visitors with observation of hermit crabs and sea urchins.
From January-March 2020, a survey was conducted to examine visitor interest, learning, and changes in per ception with regard to marine life and preservation. The seven question survey was taken by 80 visitors as they exited the Aquarium. Most questions used Likert scales to assess perceptions. Data was analysed using Excel.
Introduction At the Waikīkī Aquarium, the mission is to inspire and promote understanding, appreciation, and conservation of Pacific marine life. In Pursuit of a Liberal Arts degree with a major in Hospitality and Tourism, I also have a passion for marine life. To educate the community and further my knowledge in the field of recreational Hospi tality Industry combined with marine Science, I intern as a Wildlife Attendant with the Waikiki Aquarium. Sharing knowledge and experience and fellowship seeking to pre serve the natural habitat of aquatic life gaining personal development in the showing of aquatic life. My Internship I have been interning at the Waikiki Aquarium in Honolulu since June of 2019 and have accumulated over 140 hours of volunteer experience. Duties include: • Understanding the history of the Aquarium and the daily operations.
• Providing an inventory of invertebrates.
Data and Results
• Learning hands on activities such as touch pool.
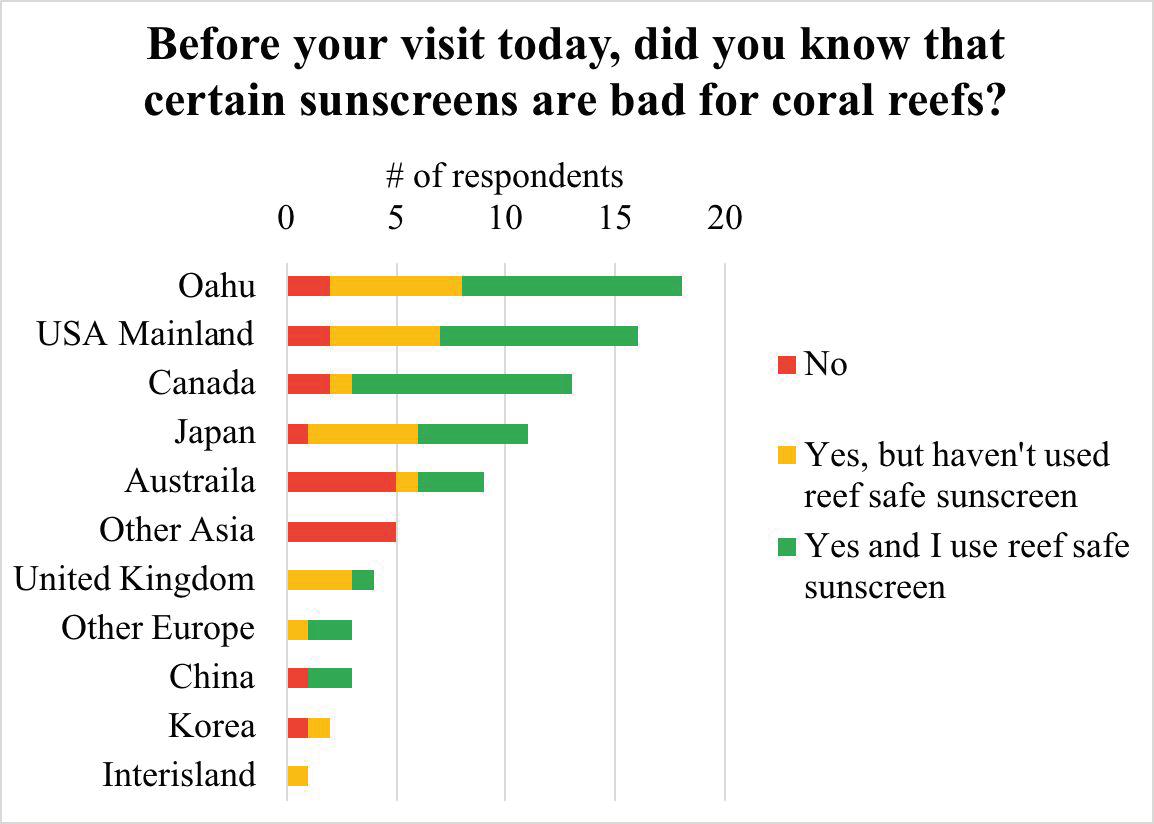
First-time visitors made up approx. 35% of respondents. 22% were from Hawai‘i, 19% from the Mainland, 13% from Canada, and 11% from Japan.
Image 2: Educating guests and sharing knowledge at the touch pool Image 1: Touch pool offers an educational experience. Image 3: Cuttlefish in the Nautilus exhibit Image 4: Golden Trevally in the coral reef research exhibit Journal of Science, Technology, Engineering, and Mathematics About The Marine Options Program (MOP) at Kapiʻolani Community College is open to students from any field of study interested in learning more about Hawaiʻi’s marine environment for their future careers. Students gain hands-on field research experiences, one-on-one mentorship, and a MOP Academic Subject Certificate.
12 | Pueo o Kū:
Isaiah Stojack Faculty Advisor: Mackenzie Manning, M.S. Kapiʻolani Community College


Figure 1: Respondents enjoyed the Coral reef research exhibit the most, followed by the Sea jellies exhibit.
Conclusions My whole aquarium journey started as a volunteer in the Summer Youth program. I then was able to return as a MOP student and also a Hospitality and tourism intern and have accumulated 342 hours of volunteer work. I started working with UH Marine Biology students, and transitioned to the front desk, greeting guests and assist ing with all front office tasks. Through this experience I developed invaluable communication skills, working with guests from all around the world. By analyzing survey data, I believe the Waikiki Aquarium provides a worthwhile educational experience to a wide range of international and local guests that they appreciate. The Coral reef research and Sea jellies exhibit seem to be the most valuable in terms of enjoyment and education.
Figure 2: Half the respondents indicated that the exhibit they enjoyed the most, was also the exhibit they learned from the most.
Figure 4: While most respondents have heard of reef safe sunscreen, some have not. Many who have do use it.
BIOLOGICAL SCIENCES | 13
Figure 3: 68% of all respondents felt their aquarium experience “definitely” increased their preservation knowledge and associated actions. Only a few responded that their experience might not have had an impact.
References www.waikiki.org Zachos, E., & Rosen, E. (2019, May 21). What Sunscreens are best for you and the Planet? National Geograpic.


Organizations like Mālama Maunalua are dedicated to preserving and restoring the once diverse ecosystem of Maunalua bay by community action and education. KCC’s Biology 124L course has continued to collaborate with the organization by removing invasive algae in the bay. For this project, we examined the percent cover for native species before and after removal at Kuli’ou’ou Beach Park and study whether invasive algae efforts help increase the presence of native algae species in Maunalua bay. Methods Before conducting the experiment and removal, plots were selected in a dense area of the reef with GPS. The appointed plot would be used to measure the overall bay. Percent cover was calculated using the quadrant meth od. To sample the bay, identically sized quadrants were used to gather information in the designated plot. Shown in figure 2, each quadrant had ten random points and at each intercept, the individuals of all algae species or objects were examined and recorded, seen in figure 3. Removal was done using manual pulling by the BIOL 124L students (Figure 4).
Effect of Invasive Algae Removal on Percent Cover Changes of Native Algae (Spyridia) in Kuli‘ou‘ou Beach
14 | Pueo o Kū: Journal of Science, Technology, Engineering, and
About Over the past 10 years, Kapiʻolani Community College students in BIOL124 have removed over 32,000 pounds of invasive algae and researched the algae composition to help restore Maunalua Bay with Mālama Maunalua.
Introduction Hawai’i is known to be the endangered species capital of the world. Native species are threatened due to factors such as pollution, urbanization and invasive species. As water flows from mauka to makai, it picks up debris and other pollutants (Figure 1). Sewage pipes take the irri gation water from civil infrastructures which eventually wash into the ocean, putting marine life at risk. Invasive algae that infect those waters also contribute to jeop ardizing the growth of healthy and native marine life.
Figure 1: Impervious cover of southeastern ahupua’a that flow into Maunalua bay (1) Urbanization and human activities threaten water quality and ecosystems; the green star is where we conduct our removal Mathematics
Euoan Jei Anthony Raquel & Sheri Marzan Faculty Advisor: Wendy Kuntz, Ph.D. Kapi‘olani Community College

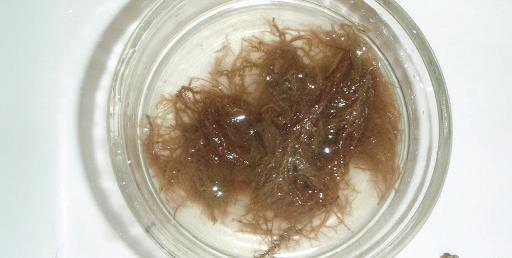
Figure 5: Spyridia (native) species in petri dish
BIOLOGICAL SCIENCES | 15 Results
Figure 7: Calculating percent change shows reduction of native algae. Notice that the difference in the removal plot is less than the difference in the control plot, suggesting that the “pulling” is not the main cause of Spyridia reduction, other factors could have affected decrease
Figure 2: Quadrant used to examine random points to be recorded
Figure 4: Removal of invasive algae in plot
Figure 6: Comparing percent cover for native algae before and after removal; Both plots show a decrease in percent cover for Spyridia
Other recorded data include the total biomass of algae eradicated each pull and the number of pounds each student pulled per hour. The focus of this experiment is the percent cover for the native algae species. Spyridia filamentosa, seen in figure 5, is the most abundant, other native species were seen, Spyridia was the only one above 1% percent cover. For our analysis, we examine the occurrence of Spyridia at Kuli’ou’ou Beach Park.
Figure 3: Examining algae to record percent age covered & Analysis
Review of the data collected exhibits decrease in percent cover for the native algae. This correlation is seen in both the removal and control plots, observed in figure 6. While the class may have pulled some of the local algae, specifically Sypridia, figures indicate that possible outside forces influence the diminish in the species. In the control plot, the pre to post data declined by 14.23% in the area covered (Figure 7). In the removal plot, the difference is roughly 9.25%. The class removal may had some contributions but the data implies that the drop could be naturally occuring or outside factors.


Acknowledgements Mahalo nui loa to Dr. Wendy Kuntz, Colleen Allen (KCC Lab Man ager), Mālama Maunalua, Ralph Dykes, Alex Awo, Mack Jahnke, Kimo Franklin, Richard Otsugi and Ed from Otsuji Farm Owner.
References 1. Conry, Paul J. Hawaii Statewide Assessment of Forest Conditions and Resource Strategy: An Assessment of the State of Our 'Āina. Edited by Ronald J. Cannarella, 2010 Assessment ed., Honolulu, Hawaii Department of Land and Natural Resources/Division of Forestry and Wildlife, 2010. Department of Land and Natural Resources: Division of Forestry and Wildlife, https://dlnr.hawaii.gov/forestry/ pdf.files/2013/09/SWARS-Entire-Assessment-and-Strategy.Accessed29November2020.
16 | Pueo o Kū: Journal of Science, Technology, Engineering, and Mathematics
Our investigation of invasive algae removal and its effect on the native species demonstrate that removal efforts can yield promising results and offer growth of the threat ened species. The exact impact is uncertain, but from our own influence, it is important we emphasize careful examination of native algae and meticulous removal efforts for the invasive species. Yet, there are various factors that deter native algae growth, distinguishing the specific factors will require further research and testing. Overall, gathering and analyzing data is necessary to monitoring the health of the ecosystems. Continuous evaluation of statistics generates the baseline and un derstanding of the bay’s wellness. Future work includes continual removal of the invasive algae. While removal of invasive algae makes a difference in increasing the abundance of native species, more action must be done to contribute to that effort. Collaboration and engaging in further discussion can offer new ideas and manage ment to help preserve the native population. Sustaining organizations like Mālama Maunalua play a major role in this discourse and community efforts, education and conversation is necessary to making significant change. Reviving the native population and reducing the rapid growth of native species is imperative to the health of Hawai’i’s marine ecosystems. This project is a seemingly small but fundamental step in the right direction to a flourishing environment.
Conclusion & Discussion

Faculty Advisors: Wendy Kuntz, Ph.D. & Mike Ross, M.S.
Shifting the Balance in a Lowland Mesic Forest: Maximizing the Native Seed Bank
¹Kapi‘olani Community College, ² HI Division of Forestry and Wildlife
SCIENCES
David Clements, Rebecca Koeroessy, Kanoa Nakamura, Howard Thiele, Joey Williams-Solomon, Nicole Yar brough, Anthony Zertuche, & Jason Misaki
Figure 1: Volunteer group clearing invasives (Before) Figure 2: Results of volunteer group clearing invasives (After) BIOLOGICAL | About Since 2014, students have partnered with the Department of Land and Natural Resources Division of Forestry and Wildlife to restore Wailupe Valley. The collected data is helping to inform community-based forest restoration prac tices and support endangered plants and wildlife.
17
Introduction In Fall 2013, in conjunction with the Hawai‘i Division of Forestry and Wildlife (DOFAW), students from Kapi‘olani Community College (KCC) began work with community members restoring a two hectare exclosure in Wailupe Valley. Our goals in previous semesters included estab lishing a transect grid, documenting forest composition as a baseline for comparison prior to invasive species removal, and establishing removal plots to determine the most efficient restoration techniques that require minimal intervention. This semester we focused on the removal of invasive species with the help of local part nerships, as well as the transplanting of understory flora to prevent erosion and determine potential out-planting sites. All of these efforts are centered on restoring native plant species that encompass the natural habitat of the endangered native bird, the ‘Elepaio (Chasiempis ibidis). Areas with potential native seed banks are targeted for restoration and invasive plant species in that area are removed using hand tools. We hypothesize that the re moval of invasive species in a plot adjacent to native flora will reveal a fertile seed bank with potential for maximiz ing restoration of the original habitat. Methods We look for adjacent plots with similar topography and species so that we can establish control plots. We then monitor and record everything within selected 10x10m plots (Figure 1). We monitor the plots by measuring the diameter at breast height (DBH) of everything above 1 meter and record the count of plants under 1 meter. We then calculate the basal area of the recorded flora and summed the total basal area for each species. Next, we remove invasive species that can be removed using hand-tools. Comparing the basal area of all species pre removal with post removal basal area helps us determine if hand pulling invasive species is an efficient reforesta tion technique for the exclosure.


Discussion This semester we switched gears and focused on engag ing with the community to open more large restoration sites around native seed banks. Over the past few se mesters we observed the most natural recruitment and growth when we found areas with a native understory and seedbank and removed the invasive canopy, increasing the hours of direct sunlight the understory receives.
Figure 6: Sunlight pierces the A. columnaris canopy Figure 7: A tunnel appears where there was once only P. cattleianum (Alternate angle fig. 4,5) Acknowledgements We thank the prior Wailupe Project students, the staff of DO FAW, the KCC STEM program, KCC Ecology Club, KCC Botany students, Ko’olau Farmers, and all the community members.
In Figure 3, there is a side by side comparison showing the removal efforts of invasive species. A. columnaris, P. cattleianum, S. terebinthifolia were the most common in vasive species observed. In our control plots, Basal Area [B.A.=π(DBH/2)²] of the three invasives A. columnaris increased by 14.5%, P. cattleianum increased by 56.6%, S. terebinthifolia increased by 34.5% while the most ob served native tree P. odorata, decreased by 14.3%. In our removal plots B.A. of the invasive trees decreased by 16.4%, 56.1%, 63.4% respectively while the one native species increased by 18.3%
Figure 4: Before invasive species removal
Figure 3: Side by side comparison of change in basal area of invasive and native trees in control and removal plots
18 | Pueo o Kū: Journal of Science, Technology, Engineering, and Mathematics
Figure 5: After invasive species removal
Results
In figure three, data shows that removing invasive trees by hand is making an impact. Our data from control plots shows steady growth of all invasive species but, the one native tree species shows loss of individuals, this sug gests that although the invasives have slow growth there is already a high competition for the natural resources for the native specie. On the other hand the native spe cie in plots where the invasive species were removed showed a substantial percent increase in B.A.of 18.3%. In figure 4, before any removal took place, it shows how dense invasive monoculture canopies are, resulting in a shaded understory. In figure 5, following a removal of the invasive canopy, more sunlight can enter the understory providing opportunities for natives to begin re-establish ing Movingthemselves.forward we plan on coordinating with D.O.F.A.W. and outplanting additional native communities in the areas we have cleared. The transition of invasive commu nities to native communities is a step in the right direction to restoring biodiversity. Continuing this project allows us to work with the community to form new ideas to combat these invasive species and allow the endemic/ native species to thrive again while educating the public on the hands on work being done.


Lei Kalaiwaʻa & Lia Takeshita Faculty Advisor: Mike Ross, M.S. Kapi‘olani Community College
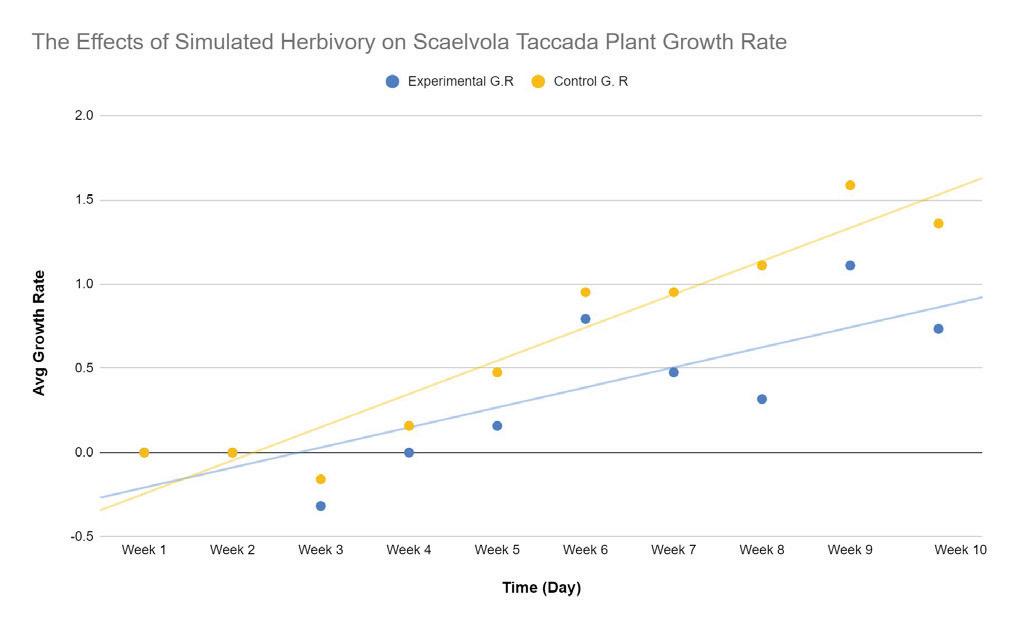
Research Question: How does simulated beetle feeding on leaves affect Scaevola taccada plant growth rate? Figure 1 (Images Top to Bottom): (A)Naupaka in September (B)Naupaka in BEG of October (C) Naupaka End of October (D)Naupaka in November A) September B) October - Beg C) October - End D) November BIOLOGICAL SCIENCES | About Students in the research-intensive BOT 101 lab investigate Native Hawaiian plant biology and conservation. Kokiʻo also has a dedicated greenhouse where students research these plants.
Introduction Plants and non-plant species share an ecological relationship in which organisms within an ecosystem rely on each other for the survival of their individual species. (Kitson et al. 2013). Our project focuses on the effects of insect herbivory (simulated beetle feeding) on Scaevola taccada also known as Naupaka kahakai, and the effect it has on Naupaka growth rate (Kitson et al. 2013). Naupa ka kahakai is a spreading shrub forming round mounds that stand 1 to 3.5 m tall and grow very close to the sea near the salt spray (Sutar et al. 2017). The leaves of this shrub are oval-shaped, covered with white hairs, slightly succulent and have a medium green color. Hawaiians observed the Naupaka flower and its white half-flower appearance and explains there were these ill-fated lovers who split the naupaka flower and took their respected halves to the mountain and to the sea to acknowledge their devotion to each other (Mcknow et al. 2016). Throughout the flora of O’ahu multiple native insect species and plant species rely on one another for food or defenses (Barton 2016). There are few research stud ies being done to determine how herbivory affects plant growth (Hendrix 1988). We hypothesize that simulated herbivory will produce plant growth on Scaevola taccada. Methods We observed 8 Scaevola taccada plants, four for control and four for experimental over a ten week period. We transplanted the naupaka from a small pot to a slightly bigger one to run our simulated herbivory experiment. To do this we punched holes in the leaves using a metal hole puncher. We measured the stem to the apical meristem using plastic rulers weekly. And noted any observations.
Effects of Simulated Beetle Feed Damage on the Growth Rate of Scaevola taccada (Naupaka Kahakai)
19

By end of experiment, plant growth of Naupaka kahakai was successful with simulated beetle feeding. The her bivory affected leaf loss faster on experimental plants than on the control plants.
Low tolerance to simulated herbivory in Hawaiian seedlings despite induced changes in photosynthesis and biomass allocation. Annals of botany. 117. 10.1093/aob/ Kitson,mcw021.James & Warren, Ben & Florens, Francois & Baider, Clau dia & Strasberg, Dominique & Emerson, Brent. (2013). Molecular characterization of trophic ecology within an island radiation of insect herbivores (Curculionidae: Entiminae: Cratopus). Mo lecular ecology. 22.10.1111/mec.12477. Lovett-Doust, Jon & Lovett-Doust, Lesley. (2021). Plant repro ductive ecology : patterns and strategies / Edited by Jon Lovett Doust and Lesley Lovett Doust. SERBIULA (sistema Librum 2.0). McKown, Athena & Akamine, Michelle & Sack, Lawren. (2016). Trait convergence and diversification arising from a complex evolutionary history in Hawaiian species of Scaevola. Oecolo gia. 181.10.1007/s00442-016-3640-3. n/a, n/a. (2009). Scaevola taccada. Native Plants Hawaii - View ing Plant : Scaevola taccada. Retrieved November 27, 2021, from http://nativeplants.hawaii.edu/plant/view/scaevola_ser icea. Acknowledgements Mike Ross for Lab, Greenhouse usage, and research material. The Lab technicians for there help behind the scenes. Thank you Nature for evolving into such diverse species. | Pueo o Kū: Journal of Science, Technology, Engineering, and Mathematics
Discussion Our hypothesis that herbivory on Scaevola taccada will produce plant growth was supported and can be seen in figure 1. The data shows that plant growth occurs but at a slower rate than when herbivory activity takes place on the plant. In Hawai’i insects like beetles rely on these native species for food for the survival of their species (Kitson et al 2013).
Figure 2: Graph of Growth Rate of Naupaka over 10 Weeks of Simulated Herbivory
21 3 References Barton, Kasey & Koricheva, Julia. (2010). The Ontogeny of Plant Defense and Herbivory: Characterizing General Patterns Using Meta‐Analysis. The American naturalist. 175. 481-93.
Barton,10.1086/650722.Kasey.(2016).
20
Figure 3 (Images Top to Bottom): (1)Simulated Beetle Feeding on Naupaka Leaves (2)Using ruler (in) to measure stem to apical meristem, top view (3)Using ruler (in) to measure stem to apical meristem, side view
Results

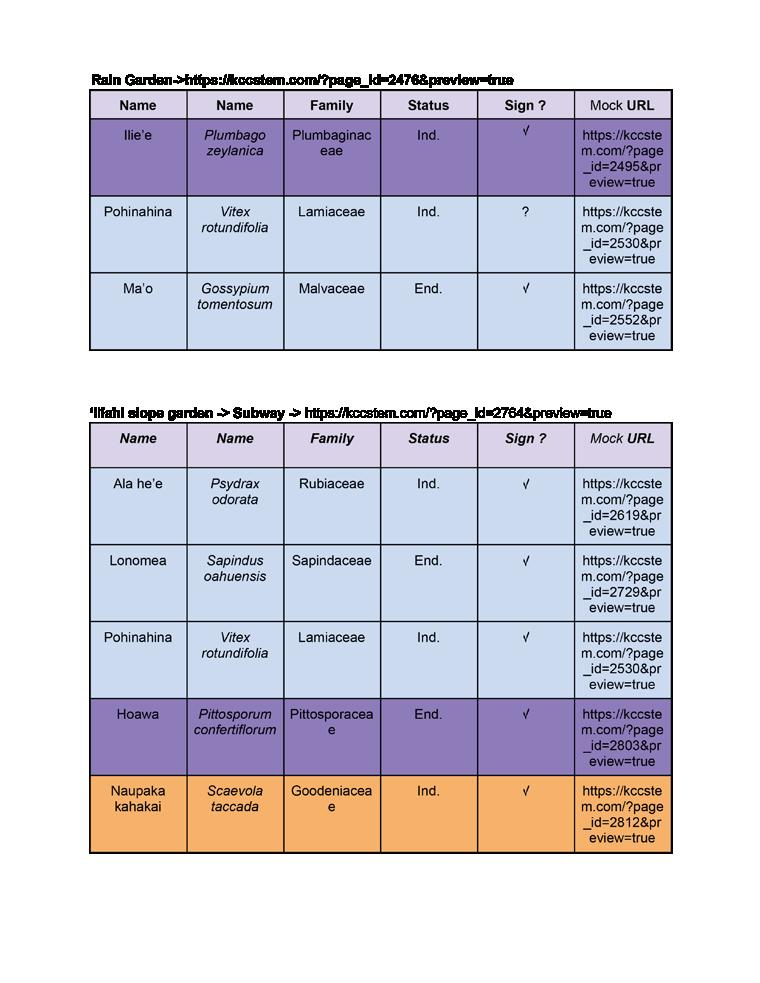
Introduction Our project contains two components, one virtual (web site) and the other a physical sign in the gardens. These signs are to match UH Mᾱnoa’s campus arboretum in their layout which the information is presented, and then additionally provide a QR code where the viewer who is physically in the garden can then scan and be transport ed to a website database where relevant cultural and scientific information is presented to them. Signage in formation includes: Identification in Latin and vernacular, family, origin, IUCN (International Union for Conservation of Nature) red list status, progeny, and an ascension num ber. Website information is to include all of the above and then additionally, any Lᾱ’au lapa’au (THM), mo’olelo (stories), kinolau (forms of gods/goddesses), and addi tional landscaping or cultural information.
Faculty Advisors: Li-Anne Delavega, M.A. & Hervé Collin, Ph.D. Kapi‘olani Community College
| 21
About Did you know that KapCC is home to nine Native Hawaiian gardens across campus including on the mauka side of Kokiʻo? These students wanted to make more people aware of the native plants on campus and learn more about them in this student-initiated program through the National Science Foundation funded Bridges-to-Baccalaureate grant.
Background The importance of native plants are interwoven through the namesakes of our buildings on campus -- each of the buildings are named after a native plant. Why is this important? Hawai’i is known as the extinction capital of the world. We need better representation and recogni tion of our endemic, indigenous, and endangered plants in order to raise awareness to our generation and the next; to ultimately live a sustainable life and assure that Hawaii’s precious plants and animals are able to survive. Our team’s vision is to provide systematic botanical sig nage with our sister campus: UH Mᾱnoa, and be able to branch off of their campus arboretum by providing Kapi’olani CC with streamlined cultural and scientific data to students, staff and faculty alike.
Emma Ho, Lei Kalaiwaʻa, Kaua Kalaiwaʻa
Figure 1.A: ‘Ōhi'a Lehua & example of signage
Kapiʻolani Community College Botanical Signage & QR Inventory
Figure 2.B: Alahe’e: example QR & website entry BIOLOGICAL SCIENCES


The team was able to get started with UH Mᾱnoa’s POC for the manufacturing of signs, Universal Manufacturers. This facility is located in Kalihi in a warehouse and does work like sheet metal cutting and fabrication. The quote was put in last semester, processed, paid and then picked up on 10/15/21. Finally, a work order was put in to uti lize UH Manoa Landscaping Services facility for printing with their “Brady Minimark printer”. We purchased our own materials necessary for printing using their facility, including weatherproof sticker roll sheets, and printing ribbon. For the virtual aspect of the project, it was difficult de ciding where we wanted to host the botanical database information. We had several options available; 1) The official KCC website hosted by CELTT (Center for Excel lence in Learning, Teaching, and Technology), 2) Hosting our own website using Weebly or Wix, or 3) on the KCC STEM site.
22 | Pueo o Kū: Journal of Science, Technology, Engineering, and Mathematics
Results In previous semesters, we produced the master list, a share drive to compile all researched data, relevant information, and photos. This semester, our products include the creation of the website database and physical production of the signs, cut and fabricated from Universal Manufacturers. Stickers are currently in the process of being printed. The signs are to be put out before the end of 2021. To finally be able to produce physical results was really exciting for us students, since the first two semesters of the project were strictly virtual products! Signs can be used for educational visits to the garden by visitors, service learning activities in the KCC Native and Sustainability Gardens, regular grounds maintenance by facilities and auxiliary, and possibly in lab tours and assignments or other educational experiences.
Methods & Materials
We first started with the idea of cataloguing each of the native plants by garden, and created a master list with information including: Hawaiian name, common name, scientific name, family, and end/ind status. 89 - 90 + plants later, we had our master catalogue of plants to research. Plants were then taken into consideration whether or not they would be receiving a sign, based on health and growth (whether or not they were upright growing, a groundcover, etc.) Then, we made contact to UH Manoa landscaping services; curator of the campus arboretum Noweo Kai.
-x24 4x6” rectangles cut 3003 aluminium sheet -x24 24” L x 1” W x 3/16” thick aluminium flat bars -Brady Minimark printer -x1 roll 4” green weatherproof sticker labels -x1 roll white label printer ribbon -x1 roll 3M industrial double sided sticky tape
Figure 2.A: Aluminum sheet & sticker roll, 2.B Koki’o Native Hawaiian Plant Garden, 2.C Universal Manufacturers (1711 Kalani St.), 2.D University of Hawai’i at Mānoa A B C D


Figure 3.A: Master list of native plants 3.B Signs & Stakes 3.C QR to NHPG website
The signs and website database are focused on gardens with predominantly native (indigenous, endemic, and polynesian introduced) plants, with an emphasis on the Koki’o Native Hawaiian Plant Garden. Moving forward, the next garden to receive signs will be the Māla Māunuunu, the Hawaiian garden behind Mᾱnele building. If there is a potential team of students to continue on the project we can expand this idea onto other gardens, trees, and plants. There is a possibility to collaborate with other organizations and partnerships. such as Citizen Forest er, state parks, and other Service Learning community partners. As for personal growth, the experience that this project provided for myself and my team offered an abundance of opportunities to grow and learn at ev ery level. We were able to network, research, learn and struggle with each other. I’m grateful and very proud of what our team was able to achieve!!
Acknowledgements Mahalo to everyone involved in this huge undertaking!! Lei and Kaua Kalaiwa’a for their hard work and dedication to seeing this project through completion for the NHPG, Li-Anne Delavega for your guidance and motivation, Dr. Herve Collin for all of the ideas, assistance, and coordination (and handling the pa perwork..!), Prof. Mike Ross for continued support, knowledge, and inspiration. Noweo Kai for providing insight and experience for creation of the signs. Kohlby Soong for previous work done on the project. Christine Nakahara for support & photos. Thank you to friends and family who have helped me keep on going despite obstacles and frustrations this year. Mahalo to everyone who attended the poster session! :-)
Discussion
BIOLOGICAL SCIENCES | 23


2021 Fall Manu o Kū Project
James Lee & Meeya O’Dell Faculty Advisor: Wendy Kuntz, Ph.D. Kapiʻolani Community College
Introduction Manu-o-ku, also known as the White Tern (Gygis alba) is a small sea bird (approximate wingspan 76-87 cm) with white feathers, black eyes, and a black pointy beak (HCWCS, 2005). The Honolulu area is the only location where they are found in the main Hawaiian Islands. Known for nesting on branches within trees, terns have also been reported to nest on man-made structures and rocky ledges (Niethammer et. al. 1998). Our objective was to continue monitoring nesting pat terns on campus. This included finding the mean incu bation time for Summer 2021. The mean on KCC was hypothesized to be 35 days, the same as what was found in a 1986 study conducted on Oʻahu. We also wanted to use the trail camera again to better understand how it works and the database naming sys tem we began in Spring 2021.
About Students on the Manu-o-Kū (White Tern) project monitor the breeding pairs of Manu-o-Kū on the Kapiʻolani Com munity College campus, recording nest fates and chick survival, and collecting data on breeding pair behavior and parent-offspring behavior.
24 | Pueo o Kū: Journal of Science, Technology, Engineering, and Mathematics
We collected data by observing the birds throughout KCC Campus with binoculars and the naked eye by looking for tracks such as white wash (white colored fecal mat ter from the birds). After using the whitewash to narrow down the area of search, we looked in the trees above the white wash to identify and document their activity. A trail camera was also used to monitor specific indi vidual’s daily activity. We later analyze the proportion of activities observed during surveys. This semester’s analysis included counting the number of days the eggs were incubated and finding the mean incubation time for nests from this summer. A chi-square test was then conducted by counting how many of those eggs were incubated less than 30 days, and 30 days or more for the observed. The total number of eggs in each category was divided by two to find the expected numbers.
Photo by James Lee Photos by Meeya O’Dell Photos by Meeya O’Dell Photos by Meeya O’Dell
Materials and Methods


Graph (3) Behavior documented during observation sessions on KCC Campus during Fall 2021
Graphsemester(2)Behavior documented during observation sessions on KCC Campus during Summer 2021 Results
Graph (1) Number of nests that failed and succeeded at KCC campus from 2015-2021.
Discussion There has been an increase in the number of nests on campus this year. Their nesting season also seem to be extending and they seem to be renesting quicker. We are not sure what is causing this change, but it could be because of several reasons, such as less people on campus. It could also be because of factors we haven’t looked at, such as increase in food.
COVID-19
BIOLOGICAL SCIENCES | 25
Our field research capabilities were greatly diminished between Spring 2020 and Fall 2021 semesters due to various restrictions placed to prevent the spread of COVID-19. As the restrictions on campus relaxed, we were able to collect data weekly during the summer and fall semester.
Monitoring Results Since 2015, we have documented 172 total nests and while 110 were successful, 48 failed, and 15 unknown. During the Summer and Fall semesters, the most docu mented behavior was “roosting” (graph 2 and 3). There was a total of 54 nests this year. During the summer, we observed 30 nests, 28 cases of fledge, and 4 cases of failure. During the fall, we observed 3 nests, 0 cases of fledge, and 1 cases of failure. Out of the 30 nests that were documented this summer, 8 were used to calculate the mean incubation time, which was 28.125 days. A chisquare test was used to then find the difference between 1986 study’s results and this result. The null hypothesis was accepted, as the p-value was 0.3017.
The naming system we started using last semester has allowed the team to track nest locations accu rately and cohesively. We have also been indicat ing nest locations on a map of KCC and placing a reusable name tag (with the nest’s name) with blue tapes as nests appear. These three have further im proved data collection and behavior documentation. We are glad it has been safe to survey once a week this summer and fall, and hope to continue monitoring nest ing patterns next semester.


6.Koa.A.1.A 7.Kauila.B.1.A 9.LotA.SW.A.1.A8.Kauila.C.1.A
15.LotA.SW.A.2.A14.Kauila.B.1.B13.Illima.A.1.A12.LotB.NE.A.1.A11.LotC.S.A.1.A10.LotC.NE.A.1.A
16.LotC.S.B.1.A 17.LotC.S.B.2.A 19.Kokio.C.1.A18.Kokio.B.1.A
25.Koa.B.1.A24.Illima.A.1.B23.Kauila.A.3.A22.Lama.C.1.A21.Kauila.A.1.B20.Lama.B.1.A
5.Lama.A.1.A4.Kalia.A.1.A3.Kauila.A.2.A2.Kauila.A.1.A1.Kokio.A.1.A
26.LotB.NE.A.2.A 27.LotC.NE.B.1.A 29.Illima.A.1.C28.Ohia.A.1.A 30.LotC.B.1.B References Hawaii’s Comprehensive Wildlife Conservation Strategy October 1, 2005. // Niethammer, Kenneth R. and Laura B. Pat rick. 1998. White Tern (Gygis alba), The Birds of North America Online (A. Poole, Ed.). Ithaca: Cornell Lab of Orni thology; Retrieved from the Birds of North America Online, Acknowledgements Special thanks for the input from Dr. Wendy Kuntz, contribu tion by Corban West, previous Man-o-ku project members and the Hui Manu-o-ku Photo by Laura Doucette Photos by Meeya O’Dell 26 | Pueo o Kū: Journal of Science, Technology, Engineering, and Mathematics Summer 2021 Manu o kū Nest Map


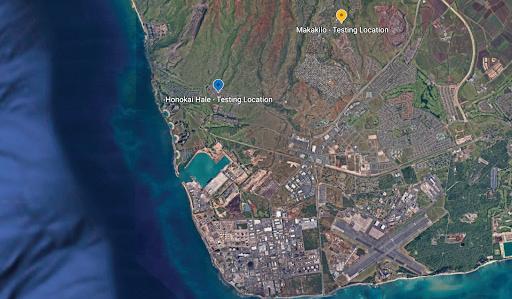
Methods Two testing locations were chosen in high and low eleva tions on the Leeward side of Oahu. I compared between experimental and control using a comparative test.
• All sample cups were left in the area for 7 days.
Kaila Kaawaloa Faculty Advisor: Wendy Kuntz, Ph.D. Kapi‘olani Community College
Introduction The mosquito species was introduced to the Hawaiian Islands possibly in the early 1800s (Ahumada et. al. 2004). Different species that were found in the islands is the Culex quinquefasciatus, Aedes taeniorhynchus, Aedes aegypti, and the Aedes albopictus (Asigau et. al. 2017). Some of these species carried diseases that affected some of Hawaii’s native animals such as the our native birds however, mosquitoes are also greatly affected by temperature that can influence the risk of some of the diseases (Liao et. al. 2017). Mosquitoes are poikilotherms and need to be in a room-temperature environment to survive. I hypothesized that due to mos quitoes being cold-blooded insects, there will be more mosquitoes in low elevation.
Figure 1: Larvae in 10x magnification Figure 3: Variety of Larvae
Figure 2: Sampling cup in Makakilo About When COVID-19 restrictions prevented in-person labs, Dr. Wendy Kuntz, or Dr. K, as she is known to her students, created an at-home lab for BIOL 265L where students could set up experiments on commonly found mosquitos in their own backyard.
The Variance of Mosquito Larvae in High and Low Elevations
• Honokai Hale (47m)
• I conducted a Mann-Whitney U Test.
BIOLOGICAL SCIENCES | 27
• Makakilo (245m)
• 15 black cups were placed in each locations with a cup sleeve, rocks from the area, 5-6 pellets, and then filled halfway with water.


Results After 7 days of data collection, the larvae was counted from each individual cup. A pipette was carefully used to remove the larvae from the water filled with the cup sleeve, rocks, water, and pellets. From the cups in the low elevation, there was a estimate total of 1,254 larvae living in the cups. From the cups in the high elevation, there was a total of 230 larvae present in the cups. After the data was collected, my hypothesis was correct. There was more larvae located in the low elevation rather than in higher elevation and the results were significant with a p-value of 0.05.
Discussion I hypothesized that greater numbers of mosquito popula tions would be found in low elevation rather than in high elevation. After sampling both locations and counting the larvae in each of the cups, my data has shown that there is definitely a lot more mosquitoes in lower eleva tion. I have identified that most of the larvae found were Asian tiger mosquitoes aka Aedes albopictus. Studies have shown that there are mosquitoes present through out the entire Hawaiian Islands and higher numbers are found during the summer in low elevation. Population growth depends on temperature and cavity availability. Mosquitoes species discovered in the Hawaiian Islands cannot survive at elevations above 1,475m (Ahumada et. al. 2004). That is why my data has shown lesser numbers of mosquitoes in high elevation. Some challenges that I experienced is some of the cups lost a good amount of water due to evaporation from the increase in temperature, pungent smell from the pellet water, time-consuming to count larvae, and time man agement while working full-time. An improvement for this research experiment is to add more water in the sampling cups. Future research could examine different quarters in the year and focus on high er elevation above 600m.
Figure 4: Testing Locations Literature Cited Ahumada, J., D, LaPointe., M, Samuel. 2004. Modeling the Popu lation Dynamics of Culex quinquefasciatus (Diptera: Culicidae), along an Elevational Gradient in Hawaii. Journal of Medical Entomology 41: 1157-1170 Asigau, S., Hartman, D. A., Higashiguchi, J. M., Parker, P. G. 2017. The distribution of mosquitoes across an altitudinal gradient in the Galapagos Islands. Journal of Vector Ecology 42: Liao,243-253.W.,Atkinson T. A., LaPointe, A. D., Samuel, D. M. 2017. Mitigating Future Avian Malaria Threats to Hawaiian Forest Birds from Climate Change. PLos One 12:1 Acknowledgements I would like to express my appreciation to both Dr. Wendy Kuntz and Dr. Krista Hiser for their assistance and coordina tion throughout this entire project. 28 | Pueo o Kū: Journal of Science, Technology, Engineering, and Mathematics

Mackenzie Jahnke Faculty Advisors: Wendy Kuntz, Ph.D. & Krista Hiser, Ph.D. Kapi‘olani Community College
Introduction Female mosquitos are particular when evaluating an appropriate oviposition site (Day 2016). In recent years, nitrogen concentration has been cited as a potential in fluence on where female mosquitoes choose to lay their eggs. Nitrogen is a primary energy source for bacteria in aquat ic systems (Sanford et. al 2005) and it also increases leaf decay rates, algae, and fungi biomass. These are all potential food sources for mosquito larvae (Kaufman and Walker 2006). I hypothesized that due to improved rearing conditions, female mosquito species in Hawaii have evolved to prefer oviposition sites with enhanced nitrogen concentrations.
Figure 1: Nitrogen used in experiment, easily purchased online. Figure 2: Cups pairs being pre pared for sites. FIgure 3: Larvae being counted under 2100 Lumens. Figure 4: Amount of Larvae found at each site.
The Allure of Nitrogen on Expecting Mosquito Mothers
Methods At fifteen sites, I placed pairs of cups. The control cup contained 12 ounces of tap water, while the experimental cup contained the same amount of tap water with the addition of ⅛ tsp of nitrogen.The cups were left for six days and at the end of six days the cups were placed in a refrigerator for 24 hours. The cups were removed from the refrigerator and their contents poured in a petri dish. The petri dish was observed under a 2100 Lumen LED light. I counted and recorded the mosquito larvae found in each petri dish. I then completed my analysis using the Wilcoxon Signed-Rank Test for Paired Data and the Z Score Test for Two Population Proportions.
Figure 5: Sites that contained more larvae in control vs. nitrogen About Students in BIOL 265L were able to set up experiments in their local areas and were able to monitor mosquito be havior across the island such as in ʻEwa Beach, Kalihi, and even on KapCC campus.
BIOLOGICAL SCIENCES | 29


30 | Pueo o Kū: Journal of Science, Technology, Engineering, and Mathematics
Thank you to Dr. Neil Reimer for providing the experimental space and equipment needed for my project. Thank you to Timothy Reimer for his help in acquiring materials. Thank you to Dr. Kuntz and Dr. Heiser for their guidance and support.
Conclusion The results of my experiment support my hypothesis that female mosquitoes evolved to prefer oviposition sites with high nitrogen concentration. The results are consistent with previous research that found greater quantities of both adult mosquitoes and larvae in areas containing nitrogen rich fertilizer (Bibuthu et. al. 2016). It is important to recognize that larvae count may not be representative of egg count as an oviposition site with a greater number of eggs will actually increase larvae mor tality as a result of crowding (Smith et. al. 2013). After the carrying capacity is reached the number of eggs laid is inversely proportional to the amount of surviving larvae. I would suggest the experiment be repeated counting the amount of adult female mosquitoes to lay eggs in each cup as opposed to the individual larvae. My study highlights that, in addition to other known ecological impacts, understanding that nitrogen may increase mosquito production is yet another reason why the use of synthetic nitrogen should be regulated and reduced.
Acknowledgements
Thirteen of the fifteen sites showed a greater abundance of larvae in the water containing higher concentrations of nitrogen, shown in figure 1 and figure 2. Statistical analysis found the results to be significant with a p-val ue of 0.04. I was unable to positively identify the larvae species as I was working from home. However, I am fairly confident that it was Aedes aegypti.
Results
Literature Cited Day, J. F. 2016. Mosquito Oviposition Behavior and Vector Con trol. Insects 7(4): 65. Kaufman, M.G., and E.D. Walker. 2006. Indirect Effects of Sol uble Nitrogen on Growth of Ochlerotatus triseriatus Larvae in Container Habitats. Journal of Medical Entomology 43: 677688. Sanford, M.R., K. Chan, and W.E. Walton. 2005. Effects of inor ganic nitrogen enrichment on mosquitoes (Diptera: Culicidae) and the associated aquatic community in constructed treat ment wetlands. J. Med. Entomol 42: 766– 776. Smith, D.L., T.A. Perkins, L.S. Tusting, T.W. Scott, S.W. Lind say. 2013. Mosquito Population Regulation and Larval Source Management in Heterogeneous Environments. PLOS ONE 8(8): e71247. Sunish, I.P., and R. Reuben. 2002. Factor influencing the abun dance of Japanese encephalitis vectors in ricefields in India. Medical and Veterinary Entomology 15: 381-392.
Introduction Early in the SARS-CoV-2 pandemic, panic buying resulted in a shortage of household sanitization. As these supplies dwindled, online prices surged, making it difficult to find affordable sanitizing agents. Due to the virus’ apparent ability to survive on surfaces for long periods, the depletion of these resources represented a public health hazard that prompted many companies and organizations to rapidly produce affordable hand sanitizer. It was later report ed that many of these efforts resulted in toxic products contaminated with methanol. This project represents our efforts to produce high-quality hand sanitizer according to World Health Organization (WHO) recommendations, while minimizing methanol content and ensuring antibiotic effectivity through quality control. About This project was initiated during the start of the pandemic when hand sanitizers were in short supply and this stu dent wanted to help keep the KapCC community safe by providing hand sanitizers to our campus. This poster won fourth place at the John A. Burns School of Medicine Biomedical Symposium. The Institutional Development Award (IDeA) Network for Biomedical Research Excellence (INBRE) program prepares students for biomedical careers.
Figure A: Summary of Growth and Fermentation Media Composition and Results BIOLOGICAL SCIENCES | 31
Bryan Suechting Faculty Advisors: John Berestecky, Ph.D., Colleen Allen, M.S., Rebecca Kanenaka, M.S., Marci Amii, M.S., & Draven Aquino
Kapi‘olani Community College
Hand Sanitizer Production During a Pandemic via the Fermentation and Distillation of Ethanol

Figure B: Column still employed a Liebig condenser stuffed with steel wool converting it into a fractionating column A secondary another Liebig condenser was used for condensation. Only the second condenser had cooling water running through it.
The yeast strain Premier Blanc by Red Star was rehy drated in pre-boiled, warm water and added to three different yeast starters using varying combinations of sucrose, glucose, diammonium phosphate (DAP), yeast extract, and yeast nitrogen base (Figure A). Manual cell counts were performed using hemocytometers with try pan blue at a 1:30 dilution. Cultured yeast from starter 4 was then used to propagate future yeast starters fol lowing the same recipe. Following yeast propagation, four batches of sucrose solution were fermented using varying concentrations of ingredients as summarized in Figure A. These conditions were determined according to two paradigms: personal homebrewing experience and the optimization work done by Mukhtar et al. with fermentations 1 and 2 (F1 & F2) representing the former and F3/F4 representing the latter. Refractometers were used to track the course of the fermentation and readings were adjusted using the Brewer’s Friend Refractometer Calculator.
32 | Pueo o Kū: Journal of Science, Technology, Engineering, and Mathematics Methods
The fermented liquid was then distilled using a makeshift column still (Figure B). Distillate fractions were divid ed into “heads” (first 10% of distillate), “hearts” (mid dle 80%), and “tails” (last 10%). These were either kept, disposed of, or redistilled (Figure F). The final distillate was then carbon filtered. Ten milliliters was extracted and weighed to determine density, which was used to estimate alcohol content (Figure G). The distillate was then tested for chemical composition using Infrared (IR) spectroscopy (Figures H-J). Finally, it was tested against Staphylococcus aureus for antibiotic effectivity at several concentrations over time (Figure K). This final product was then mixed with hydrogen peroxide, distilled water, and either glycerol or aloe vera extract. World Health Organization guidelines were followed for batches 2 and 3, while the first batch was mixed to a concentration of 70% with water making up the difference. Lavender oil was also added. Finally, the finished product was retested for antibiotic activity (Figure K). The aloe vera used in the second batch was extracted by hand using methods not covered herein.

Figure D: Fermentation Comparisons
• Ferm. 1 Ferm. 2 Ferm. 3 Ferm. Linear4(Ferm. 1) Linear (Ferm. 2) Linear (Ferm. 3) Linear (Ferm. 4) C: Yeast Starter Media Comparison
Figure G: Estimating Alcohol Content via Density Figure E: Gravity Change Over Time Figure F: Fraction Schedule
Results and Discussion Of the parameters tested, yeast starter quality was most acutely affected by nutrient type with yeast extract being the vastly superior nutrient (Figure C). Plans to test anoth er nutrient, Wyeast Nutrient Blend, were put on hold after the sanitizer shortage abated, but would be interesting to test in the future. A comparison of F3 and F4 shows a much larger loss of viability in F4 due to the lack of buffers (Figures A and D). While exact specifications regarding buffer molarity and volumes were not given in Mukhtar et al, the approxi mated buffers used in F3 significantly improved viability. It is believed that further optimization of these buffers would have amplified this effect. Simultaneously, we see that F4 had a significantly fast er fermentation rate than the other buffer-less solution, F2, suggesting that higher pitch rates and low osmolar ity have an impact as well (Figure E). Distillation of the fermented sucrose solution yielded a clear liquid with a pungent odor. This odor was slightly subdued in the “hearts” fractions and became further reduced with suc cessive distillations. Carbon filtration amplified these results further. The resulting product has a cleaner odor than other bi otic sanitizers recently introduced to market such as Riley’s Hand Sanitizer (available at Safeway). 10 mL of this liquid weighed between 8.1 and 8.5 grams, with the average “hearts” fraction falling between 8.1 and 8.3. This corresponds to an estimated ABV of 90-95% (Figure G).
BIOLOGICAL SCIENCES | 33 Figure


Figure I: IR of Ethanol vs 10% Methanol vs 2nd Distillation
Figure J: IR of Pure & 10% Methanol vs 2nd Distillation of Science, Technology, Engineering, Mathematics Figures H-J show IR spectrographs comparing the first and second distillates with commercial ethanol, pure methanol, and 10% methanol in an ethanol solution. Re sults show a marked change in purity between the first and second distillation with the latter more closely mir roring commercial ethanol than a 10% methanol solution, while not being quite as pure. The hearts of the third distillation were tested against S. aureus to determine its antibiotic properties. The results summarized in Figure K closely mirror those in Tortora, Funke, and Case strengthening the validity of the ABV estimate via density-measurement. Following the mix ing of the distillate according to WHO guidelines, the final product was again tested with great results, also summarized in Figure K. The addition of aloe vera in the second batch caused protein to coagulate necessitat ing filtration using a paper towel. A single filtration was enough to remove all particulates. This project resulted in just over 2.5L of hand sanitizer that was distributed to campus staff and students. For distribution, staff and students either brought their own containers or received a spray or squirt bottle with a custom label (Figure L).
and
Figure H: IR of Ethanol vs 1st & 2nd Distillation
34 | Pueo o Kū: Journal
Figure K: Antibiotic Activity


Figure L: Label of sanitizer
Conclusions Given the significant differences between the viability of F3 and F4, it is likely that pH has a significant impact on fermentation speed and quality due to its impact on yeast health. This represents an oversight regarding the homebrewing paradigm used initially: beer wort acts as a strong buffer (so strong, in fact, that brewers often add acids, hence the addition of HCl to F1). Removal of this powerful buffering system necessitated a replacement, the specifics of which still need to be worked out. The considerable difference between the fermentation rates of F2 and F4 is most easily explained due to increased pitch rates, though this would need to be confirmed by further testing with proper controls. While it cannot be said for certain how large of an impact nutrient type and osmolarity had on yeast health in comparison to pH, the marked impact nutrient type had on the yeast starters portends its import. Given current results, the optimized parameters of Mukhtar et al are a good place to start. IR results show a striking difference between successive distillations and an IR signature that closely mirrors that of 95% commercial-grade ethanol. However, subtle dif ferences signify the presence of some contaminants. While the methods used cannot quantify or identify these contaminants, these results are promising. Further anal ysis via liquid chromatography and mass spectrometry would provide these data. Additional purification efforts could include slower distillation with a more purpose-built still, extraction of dissolved organic compounds with a non-polar solvent, and further filtration using a higher quality, more tightly packed adsorbent. Despite the pres ence of trace contaminants, this product is intended for topical use in small quantities and as a surface disinfec tant. In the amounts generally used, the effects of any trace methanol would likely remain small, but caution is still warranted until the contaminants can be quantified. References Danahy, B., Minnick, D., & Shiflett, M. (2018). Computing the Composition of Ethanol-Water Mixtures Based on Experimental Density and Temperature Measurements. Fermentation, 4(3), 72. Funke,https://doi.org/10.3390/fermentation4030072B.R.,Case,C.L.,&Tortora,G.J.(1992).The Control of Microbial Growth. In Study guide for Microbiology, an intro duction: Tortora, Funke, Case (p. 192). chapter, Benjamin-Cum Mukhtar,mings. K., Asgher, M., Afghan, S., Hussain, K., & Zia-Ul-Hus snain, S. (2010). Comparative study on two commercial strains of Saccharomyces cerevisiae for optimum ethanol production on industrial scale. Journal of biomedicine & biotechnology. https://www.ncbi.nlm.nih.gov/pmc/articles/PMC2860142/. Steffen. (2017, November 1). Ethanol- Water- Mixtures. Steffen’s Chemistry Pages. try/chemistry/density-tables/https://wissen.science-and-fun.de/chemisethanol-water-mixtures/.
BIOLOGICAL SCIENCES | 35
Acknowledgements We thank C. Allen, L. DelaVega, and C. Tamayo for their on going laboratory and administrative support. We also thank IDeA Networks of Biomedical research Excellence (INBRE) IV organization for continued support of undergraduate research at Kapi’olani Community College. This project was supported by grants from INBRE, Award number: Z10230094 and National Science Foundation Bridges to Baccalaure ate: Strategic Alliance for Minority Participation (NSF B2B STAMP) Award. Further thanks to laboratory staff, K.A.R.M and students for assistance and guidance.


Xander Allen Faculty Advisor: Jacob Tyler, M.S. Kapi‘olani Community College
What is climate change? Unlike weather, which is short-term atmospheric effects to any given region, climate is those effects over a lon ger period of time in that region. Climate change is a long-term change in global climate, also known as global warming. These changes are brought about by an in crease in greenhouse gas emissions (especially CO2) caused by human activities, such as burning of fossil fuels, which amplify the greenhouse effect that keeps our planet warm. As a result, effects like rising global temperatures, loss of ice cover on land and sea, rising sea levels and extreme weather events occur. Recently, 2020 was the second-warmest year on record, with average temperature of 1.2 C.
How does climate change affect Hawaii?
36 | Pueo o Kū: Journal
To date, 2019 was the warmest year recorded in Hawaii, and there is an increase of 0.3 F every decade. That’s 4 times the rate it was half century ago. Some of the major effects of climate change in Hawaii include coral bleach ing and infrequent rainfall patterns, as well as coastal erosion caused in part by rising sea levels.
Climate Change: What Is It and How Does It Affect Hawaiʻi?
Figure 1: Increase in Hawaii’s temperature from 1950-2010. of Science, Technology, Engineering, and Mathematics About OEST 101 is a new course that started in Fall 2021 as part of a National Science Foundation Geopaths-Impact (GP-IMPACT) grant, which builds pathways for community college students to pursue a degree in earth sciences at the University of Hawaiʻi at Mānoa.

Infrequent Rainfall
There are two seasons in Hawaii’s climate: summer (kau wela) from May to October, and winter (ho’oilo) from Oc tober to April. Rising global temperatures have caused an increase in water evaporation, resulting in more water vapor in the atmosphere. This both dries out soil and causes infrequent, heavy storms. In summer, the heat causes less rain and dries out the soil. In winter, the heavier rainfall from the storms fails to be absorbed by the dried soil, thus causing flash flooding and soil ero sion. This has greatest effects on local communities, with many who live on the dry Leeward side of Oahu having to deal with extreme flooding come winter and local farmers on the Windward side getting less water for their crops every year. Flash flooding, or sudden flooding due to storms, have become a significant problem in Hawaii, causing extensive water damage to homes and roads. This past year, a state of emergency was declared in March 2021as Oahu experienced extensive flooding due to heavy rainfall. As the infrequent rain patterns con tinue, events like this are becoming common place, due to climate change.
Coral Bleaching
Figure 2: Bleached coral in Kane’ohe Bay (2014).
Figure 3: Flash flooding in Haleiwa, Oahu in March 2021.
Coral bleaching is an occurrence where coral loses its pigmentation, and therefore becomes “bleached”. Oahu’s coral reefs were bleached by rising sea temperatures and acidity, both of which caused the algae the coral feeds on to die off and the fluctuating temperatures stressing the coral. In 2014 to 2016, there were two bleaching events in Kane’ohe Bay, something that hadn’t occurred since 1996. 67% of the coral was bleached, and since then only a small percentage has been able to recover. This directly affects Oahu’s economy, as Hawaii coral reefs bring in an estimated $385 billion a year via tourism, and at this rate, 40% of reefs are projected to be lost by 2100, threatening major part of Hawaii’s economy.
PHYSICAL SCIENCES | 37


38 |
Figure 4: Beach erosion at Lanikai Beach; coastline in 1968 vs. in 2020. Pueo o Kū: Journal of Science, Technology, Engineering, and Mathematics
Hawaii is taking steps toward climate adaptation with the council behind the Climate Action Plan meeting every few years to identify and find better solutions to effects brought on by climate change. Moving forward, efforts to combat climate change in Hawaii could best be improved by helping to support this community, as well as support ing research and projects that seek to solve effects like coral bleaching and flash flooding. Cooperation is the most important tool here, if we are to protect our islands for future generations to come.
Hawaii has developed strategies to reduce its carbon footprint, most prominently the Climate Action Plan (CAP). The Climate Action Plan (CAP) is a list of pro grams, lists and policies that are all designed with the aim of reducing greenhouse gas (GHG) emissions by 45% over the course of the next five years, with the goal of carbon neutrality by 2045. This includes actions like encouraging methods of transportation with a small er/nonexistent carbon footprint (better walking/biking paths, encouraging carpooling, etc.), finding new ways of generating electricity that aren’t fossil fuel based, and reducing GHG from waste disposal. This, combined with smaller efforts like improving Hawaii’s urban layout to handle heavy rain months, and researching ways to im prove Hawaii coral’s tolerance and recovery rate to warm periods by using heat-tolerant strains of algae and coral species, combine to adapt against climate change.
Coastal
Figure 5: Alternative electricity production via solar panels.
Conclusion / Future Research
Rising sea levels caused by global warming have con tributed to an already established issue in Hawaii, and especially Oahu. As sea levels get higher, beaches start disappearing as the sand erodes away due to larger waves being able to reach the shore. This erosion is worsened by beach homeowners building sea walls to keep the rising tide out of their property. Though laws are in place to regulate sea walls being built, often times homeowners will have exceptions granted for them or find ways around rules. Already, 13 miles of beaches around the state (including 10% of Oahu’s beaches) are gone, with 70% currently threatened. A major portion of Hawaii’s tourism relies on its beaches; Waikīkī Beach alone brings in $2 billion per year, and 60% of jobs are tourism related. Erosion
Mitigation Efforts


PHYSICAL SCIENCES | 39 References “Climate Action Plan.” Resilience Office - City and County of Ho nolulu Office of Climate Change, Sustainability and Resiliency, Office of Climate Change, Sustainability and Resiliency 2020, https://resilientoahu.org/climate-action-plan. “The Causes of Climate Change.” NASA, NASA, 30 Aug. 2021, https://climate.nasa.gov/causes/. “Chapter 6: Stream Flooding and Mass Wasting.” SOEST Ha waii, University of Hawai‘i at Manoa, 2021,http://www.soest. “Climateb=f6h&AN=149939635&site=ehost-live&scope=site.host-com.kapproxy.lib.hawaii.edu/login.aspx?direct=true&dno.“Climatefalls_FLETCHER-final.pdf.hawaii.edu/coasts/publications/shores/6Streams_and_rockChange:AStatusReport.”NewScientist,vol.250,3331,Apr.2021,pp.38–41.EBSCOhost,search-ebscoChangeinHI.”ClimateChangeinHI,https://climate. hawaii.gov/hi-facts/climate-change-hi/. Genz, Ayesha S., et al. “The Predictive Accuracy of Shore line Change Rate Methods and Alongshore Beach Varia tion on Maui, Hawaii.” Journal of Coastal Research, vol. 23, no. 1, Jan. 2007, pp. 87–105. b=h&AN=24051975&site=ehost-live&scope=site.host-com.kapproxy.lib.hawaii.edu/login.aspx?direct=true&dEBSCOhost,search-ebsco Hafner, Jan, and Shang-Ping Xie. “Far-Field Simulation of the Hawaiian Wake: Sea Surface Temperature and Orographic Ef fects.” Journal of the Atmospheric Sciences, vol. 60, no. 24, Dec. 2003, pp. 3021–3032. EBSCOhost, doi:10.1175/1520-04 “How69(2003)060<3021:FSOTHW>2.0.CO;2.DoesClimateChangeAffectPrecipitation?”
NASA, NASA, https://gpm.nasa.gov/resources/faq/how-does-cli Ngu,mate-change-affect-precipitation.Ash,andSophieCocke.“Hawaii’s
Beaches Are Disap pearing.” Hawaii’s Beaches Are Disappearing, ProPublica, 29 Dec. 2020, https://projects.propublica.org/hawaii-beach-loss/. Ritson-Williams, Raphael, and Ruth D. Gates. “Coral Community Resilience to Successive Years of Bleaching in Kāne’ohe Bay, Hawai’i.” Coral Reefs, vol. 39, no. 3, June 2020, pp. 757–769. EBSCOhost, doi:10.1007/s00338-020-01944-4.
Acknowledgements Prof. Jacob Tyler, Serena Harris Rosenberg, Lizzy. “Hawaii Floods March 2021: Causes, Relief Efforts, and More.” Green Matters, Green Matters, 11 Mar. https://www.greenmatters.com/p/hawaii-floods-march-2021.2021, What Climate Change Means for Hawaii - US EPA. Intergov ernmental Panel on Climate Change, Aug. 2016, uary2017snapshot.epa.gov/sites/production/files/2016-09https://19jan documents/climate-change-hi.pdf.

Serena Harris Faculty Advisor: Jacob Tyler, M.S. Kapi‘olani Community College
What is a tornado outbreak? Historically, there was no consensus on definition, but technological advances in the ‘90s led to frequent investi gations into environmental conditions favoring outbreaks in the 2000s. In 2004, Edwards et al. proposed outbreak criteria (O-Index) based on eight weighted variables: num ber of tornadoes, number of violent (EF4-EF5), number of significant tornadoes (>EF2), Destruction Potential In dex (DPI), total path length, number of fatalities, number of killer tornadoes, and number of tornadoes with path length >80 km. Based on the variables outlined above, especially the number of significant tornadoes, number of fatalities, total tornado path, and DPI, the storm sys tem and tornadoes produced on Feb 5-6, 2008 can be categorized as a tornado outbreak that affected a large geographic area and resulted in many fatalities and wide spread destruction of property.
Figure 1: Idealized supercell storm cloud (NWS)
About Students in OEST 101 investigate natural hazards, such as hurricanes or earthquakes, that they have a personal con nection with and find out how we can mitigate them to make communities more resilient against natural disasters.
Figure 2: Collision of air mass boundaries on Feb. 5, 2008 (NWS) | Pueo o Kū: Journal of Science, Technology, Engineering, and Mathematics
How are tornadoes formed? Tornadoes generally require a supercell to form. Super cells are single cell thunderstorms with updrafts reaching speeds >160 km/h, able to produce strong winds and hail or violent tornadoes. They need winds blowing at different speeds in different levels of the atmosphere (wind shear), which creates horizontal rotation. As the rotating air rises into the atmosphere, it generates cu mulonimbus clouds, and a telltale “anvil” in the storm cell (Fig. 1). These storm cells have areas of updraft countered by areas of downdraft. Tornadoes form in the updraft or downdraft. In AR, these storms form when the warm, moist subtropical jet from the Gulf of Mexico meets the cool, dry Polar Jet, forming supercells capable of tornadogenesis.
Figure 3: Tornado in Clinton, AR 2008 Josh Smith Figure 4: NWS storm track map
40
Super Tuesday 2008 Tornado Outbreak in Arkansas


This storm system produced multiple tornadic supercells and moved at roughly 55 mph. A series of 87 tornadoes touched down in Arkansas (AR) and 8 nearby states on February 5-6, 2008 causing fatalities in AR, TN, KY, and AL. The largest magnitude tornado in AR was an EF4 with a 122-mile continuous damage path with 13 fatalities. This was the longest storm track of any tornadoes in this event, and the longest in AR since 1950 (when the tornado database began). There were 57 fatalities in this outbreak, with 14 occurring in AR. Of the fatalities, 63% occurred in manufactured homes, at night, and in heavily forested areas. All 57 fatalities were due to EF2 or greater tornadoes, with a total of five EF4 tornadoes produced by the storm. The most deadly tornado in this event, with 22 fatalities, was an EF3 that touched down near Nashville, TN and traveled 51 miles. Early damage estimates for the event were $520 million. There were reports of homes being demolished to their foundations, a boat factory completely destroyed in Clinton, AR, vehicles carried in tornadic winds and deposited hundreds of meters from their original location (see left), and total destruction of mobile homes in the path of the tornadoes.
Figure 5: AR Tornado fatalities (NWS) Figure 6: Storm damage outside Clinton, AR (NWS) Figure 8: Helicity (rotation) readings captured Feb. 6, 2008 (NWS)
Was the public warned?
What happened in this outbreak?
PHYSICAL SCIENCES | 41
Were the warnings successful? After the storm system had passed, National Weather Service (NWS) sent a team to evaluate their storm pre diction accuracy as well as assess damage and identify tornado tracks and intensities. They determined lead time for all warnings issued by NWS offices was 17 minutes. Warnings were issued by local NWS offices in affected states. The coordination of the Little Rock office to disseminate real-time warning information to first responders, use of outdoor warning sirens in some counties potentially helped reduce fatalities. The surveys of individuals in the storm path showed that a significant proportion of manufactured housing residents did not seek shelter or did not have a preparedness plan in the event of a severe weather outbreak
The National Weather Service (NWS) Storm Prediction Center and Weather Forecast Offices (WFO) monitored the system in advance using radar images, convective outlooks, helicity (rotation) readings, CAPE models, and other tools to give warning of potential storms days be fore the outbreak. During the storm, NWS offices issued 16 severe-weather watches, 13 tornado watches, and 3 severe thunderstorm watches for this event. These were issued to the public through radio and TV broadcasts as part of the Emergency Alert System. In AR, the WFO communicated warnings to a state police radio system so that first responders were also monitoring real-time events. All 54 radio stations and the local TV stations in AR had continual coverage on-air during the event to give the public notice of storm location updates, tornado warnings, and tornado watches.
Figure 7: Radar image of supercell that gener ated EF4 in AR (NWS)


Can we improve mitigation efforts?
42
viceUnitedlogicaldefpaper.pdf.Https://www.spc.noaa.gov/publications/edwards/CooperativeInstituteforMesoscaleMeteoroStudies,NormanOK.Web.17Apr.2021.States.NationalWeatherService.SilverSpring,Md.SerAssessment:SuperTuesdayTornadoOutbreakofFebruary
This was the first tornado event to be analyzed using the VIEWS (Visualizing Impacts of Earthquakes with Satel lites) system to survey the damage over a large area - building and vegetation destruction and materials that survived that were all recorded. Survivors were surveyed for their preparedness and shelter-seeking habits. NWS completed service assessments. There were marked ar eas for improvement recommended. Though only 7-12% of the population occupied mobile homes, mobile homes accounted for a disproportionate number of fatalities. Those surveyed reported they did not seek shelter in a permanent structure. Though the entire state of AR is in the Southeast Tornado Alley, residents are unlikely to have access to a basement or other storm shelter during tornadic events. Building codes can be improved, outdoor warning systems can be installed to provide warnings for those who may have lost power during a storm or do not have access to cellphone-disseminated emergency alerts. Warning statements from NWS and WFO offices can include stronger wording (i.e. “particularly danger ous,” “potentially deadly,” “tornado spotted on the ground moving toward …”) to express severity of storm warn ings to the public. Tornado “drills” are required in public schools in AR, but some of those surveyed reported lack of preparedness plans.
Conclusion and Future Research: Future forecasting of tornado outbreaks will no doubt improve with advanced technology. Tornado education beyond elementary school drills might be an effective way to reduce fatalities and improve public comprehen sion of threats when warnings are issued. Policy changes to provide public warning sirens and/or public tornado shelters might also reduce fatalities in these events.
References Edwards et al. Proposals for Modernizing the Definitions of Tornado and Severe Thunderstorm Outbreaks. Ed. Charles A. Doswell.
5-6, 2008. Mar. 2009. Web. 1 Apr. 2021. US Department of Commerce, NOAA. “What Is a Supercell?” National Weather Service. NOAA’s National Weather Service, 17 Sept. 2016. Web. 17 Apr. 2021 McMillan, Anneley, Beverley J. Adams, Amber Reynolds, Tanya Brown, Daan Liang, and J. Arn Womble. “Advanced Technology for Rapid Tornado Damage Assessment Following the ‘Super Tuesday’ Tornado Outbreak of February 2008.” MCEER Re sponse. University at Buffalo, State Univeristy of New York, 18 Apr. 2008. Web. 14 Apr. 2021. mceer-reports/08/08-SP01.pdf><https://www.eng.buffalo.edu/
Acknowledgements Prof. Jacob Tyler, Suzanne Ritchie
Figure 9: Doppler-indicated tornado near Clinton, AR (NWS Figure 10: Southeast Tornado Alley & frequen cy of killer tornado events (NWS)(NWS information to first responders, use of outdoor warning sirens in some counties potentially helped reduce fatali ties. The surveys of individuals in the storm path showed that a significant proportion of manufacturedhousing res idents did not seek shelter or did not have a preparedness plan in the event of a severe weather outbreak. | Pueo o Kū: Journal of Science, Technology, Engineering, and Mathematics


BiodieselMethodsProduction
The main difference between P1 and P2: • P1-Shaking: The oil, methanol, and catalyst were mixed by shaking aggressively for 5 minutes.
• P2-Stirring: The oil, methanol, and catalyst were stirred on the hot plate for 60 minutes at a constant temperature. Assays The glycerin test6, washing method7, and soap test8 were modeled after Utah Biodiesel’s methodology.
Anya Dimitrijevic Faculty Advisor: Kathleen Ogata, Ph.D. Kapi‘olani Community College
Comparing Various Biodiesel Production Methods to Optimize Yield, Quality, and Efficiency
Figure 2: Transesterification reaction About Every semester, CHEM 161L students investigate different methods to turn cooking oil from our culinary department into usable biodiesel. This effort was awarded the 2018 UH President’s Green Project Award and featured on the news. See the full article: http://bit.ly/kapccbiodiesel.
Figure 1: Sustainability of Biodiesel Production¹
Objective The purpose of this project is to determine which of the two different procedures chosen produces the highest quality of biodiesel and glycerol (a byproduct of the trans esterification reaction) with a variety of tests to meet the ASTM standards.
Methods
Introduction The world’s fossil fuel supply is depleting at an alarming rate¹. Biodiesel (BD) is a possible alternative fuel source for future energy demand. It is derived from organic and easily renewable materials thus promoting sustainable development². In addition, combustion of BD drastical ly reduces carbon emissions and ultimately saves the environment (Fig. 1). To promote KCC’s sustainability mission, waste cooking oil (WCO) from the culinary de partment was used as feedstock. BD is produced through a chemical reaction called trans esterification (Fig. 2). Transesterification is the process of exchanging an ester (WCO in this case) with the methyl group in methyl alcohol. These reactions are often cata lyzed by the addition of a base catalyst³
PHYSICAL SCIENCES | 43
The two procedures of BD production were the same except for the methods of mixing the WCO, methanol, and catalyst (KOH). The first procedure (P1) involved shak ing and was adapted from Utah Biodiesel Supply4. The second procedure (P2) was based on a modification of Biodiesel Education’s procedure5 which involved stirring.


5.
• Both procedures. successfully produced biodiesel.
• According to the bound glycerin test, the triglycerides in the waste oil were completely converted to BD. The levels of residual triglycerides were well below the ASTM limits.
4.
For Conversion - 3/27 Methanol Test. (2013, June 22). Retrieved April 29, 2020, from 7. Misthttps://www.youtube.com/watch?v=DNT4e3WqEyQWashingBiodiesel.(n.d.).RetrievedApril29,2020, from mist-washing-biodiesel.htmlhttps://www.make-biodiesel.org/Water-Washing/ 8. How To Test Biodiesel For Soap Content. (2017, September 13). Retrieved April 29, 2020, from https://www.youtube. com/watch?v=WjEL_BGY43A Figure 4: (a) Before titration (b) mid titration (c) completion of titration Table 1: BD Quality Tests The results for the two tests are summarized in Table I BDResultsProduction for Both Procedures Biodiesel was produced (Fig 3a) and washed with water (Fig. 3b). Figure 3: (a) biodiesel and glycerol layer post transesterification reaction (b) biodiesel after 5 spray washes 44 | Pueo o Kū: Journal of Science, Technology, Engineering, and Mathematics
Conclusions and Discussion
• Due to COVID-19 circumstances, completion of the other quality tests: water, residual catalyst, and FFA will be researched in the future along with a definite conclusion as to which procedure produces the high est quality biodiesel.
• A procedure to purify residual glycerol will be re searched to further sustainability efforts. BD Quality Tests
• Soap content test: After spray-washing P1 three times, the BD was tested for soap content (Fig. 4). References 1. Shafiee, S., & Topal, E. (2008, September 27). When will fossil fuel reserves be diminished? Retrieved April 29, 2020, from https://www.sciencedirect.com/science/article/abs/ pii/S0301421508004126
2. Yaşar, Fevzi. “Comparision of Fuel Properties of Bio diesel Fuels Produced from Different Oils to Determine the Most Suitable Feedstock Type.” Fuel, Elsevier, 20 Dec. S0016236119321714.2019,www.sciencedirect.com/science/article/pii
• According to the bound-glycerin test, both proce dures required two transesterification reactions to pass the test.
3. Transesterification. (n.d.). Retrieved from esterificationsciencedirect.com/topics/chemical-engineering/transhttps://www. Making Biodiesel From Waste Vegetable Oil . (2009, March 25). Retrieved from https://www.youtube.com/ watch?v=ramY_M_z4pk Transesterification of Vegetable Oil and Alcohol to Produce Ethyl Esters. (2017, May 18). Retrieved April 29, 2020, from https://www.youtube.com/watch?v=sSLulgJ-E00 How To Test Biodiesel
6.


Figure 1: Generic Three-Body Diagram Note. Diagram of the three-body system in Cartesian coordinates used in this analysis (1) About This student wanted to further develop a problem he worked on in PHYS 170L as part of a National Science Foun dation grant Bridges-to-Baccalaureate (B2B). He was able to present this work at the 2020 Emerging Researchers National (ERN) Conference in Washington D.C.
Alden Fernandez Faculty Advisor: Hervé Collin, Ph.D. Kapi‘olani Community College
Modeling and Solving the Sun-Earth-Moon System’s Differential Equations to Simulate Its Kinematic Properties
To model the Sun-Earth-Moon three-body system subject ed to the gravitational force, Newton’s 2nd law of motion is applied in a Cartesian coordinate system shown in Figure 1.
PHYSICAL SCIENCES | 45
Methods For any generic three-body system (Figure 1), where m is the mass of a body and r is the distance between one body to a other, the Euler formulation [2] of a three body system is obtained by applying Newton’s 2nd law to one of the three bodies subjected to the gravitational interactions of the other two. The equation describing the acceleration vector is written as: Except for special cases such as the Euler’s solution that assumes that the three masses are collinear at each instant, or the Lagrangian solution that assumes that the three masses form an equilateral triangle at all times [3], there is no general analytical solution to this day unless specific conditions are chosen.
Introduction Kepler’s first law of planetary motion states that planets have elliptical orbits with the Sun at one focus [1]. This law also governs the orbit of moons. Applying this law on a two-body system is a straightforward treatment to obtain its dynamical properties. However, when adding a third body such as the Sun, the equations of motion become highly susceptible to initial conditions, and a general analyticalsolution has not been found yet. To solve an n-body system, either specific conditions must be assumed, or computational methods are necessary to model and predict the motion of each body. As new missions to other planets are essential goals of NASA, solving a three-body system problem is a fundamental stepping stone that will facilitate plans for future expe ditions to other planets and celestial bodies.
Purpose The purpose of this project is to solve the Sun-EarthMoon system’s differential equations with computational methods in order to predict the motion of the three afore mentioned celestial bodies.

(2)(3) (4)
46 | Pueo o Kū: Journal of Science, Technology, Engineering, and Mathematics
For the purpose of this project, the variables were as signed such that m1 is the mass of the Moon, m2 is the mass of Earth, m3 is the mass of the Sun, r12 is the distance between the Moon and Earth, r23 is the distance between Earth and the Sun, and m3 is the distance be tween the Moon and the Sun. To achieve the numeral solution for this problem, the acceleration vectors for each body are first obtained from Newton’s 2nd law in the x-, y-, and z- directions. A total of nine second-order differential equations are ob tained (three for each body), one for each body and per direction. Examples of the equations for one system are: Six additional equations are needed for the two other bodies. In order to obtain a numerical solution, using GNU Octave’s ode45 function, these nine second-order differential equations need to be transformed into a set of first-order differential equations. Using the following variable substitutions, A set of eighteen first-order differential equations were obtained by means of substitution: The initial conditions for each body’s position and veloc ity are required for the differential equations could be solved by the ode45 function.They were chosen such that the Sun is located at the center of the reference frame and assumed to be stationary. At initial time, Earth was positioned at the perihelion while the Moon was assumed to be at perigee, and the average orbital velocities for the Moon and Earth were used. The 5.15-degree tilt of the Moon’s orbit with respect to Earth’s plane of orbit around the Sun was also considered. Once all the equa tions and initial values were inputted, GNU Octave was programmed to solve the differential equations and plot the trajectories of the three-body system.
Discussion The initial condition values that were used were chosen to simplify the process of modeling the Sun-Earth-Moon system. In addition, all the other massive objects in the solar system were ignored. A more accurate prediction of the trajectories would be obtained if astronomical values were utilized, and if our model would include a higher number of bodies to include all planets in the solar system.
Acknowledgements Mahalo nui loa to Dr. Herv Collin (advisor), the Pre-Engineering Education Collaborative II (PEEC II: NSF Award HRD-1642042)) grant, Carin Tamayo (Bridges to Baccalaureate Coordinator), Li-Anne Delavega (Undergraduate Research Coordinator), the Society of Advancement for Chicanos/Hispanics and Native Americans in Science (SACNAS), and the Tribal Colleges and Universities Program (TCUP) from the National Science Foun dation (NSF).
PHYSICAL SCIENCES | 47
3. Victor Szebehely; C. Frederick Peters (1967). "Complete Solution of a General Problem of Three Bodies". Astronom ical Journal. 72: 876.
2. Vallado, David. A (2013). Fundamentals of Astrodynamics and Applications. Space Technology Library.
Note. Graph of Earth and the Moon’s motion generated with GNU Octave using the x- and y-axis for Earth’s plane of orbit and with the z-axis pointing in the direction of Earth’s North Pole.
Conclusion and Further Research Using computational methods, the Sun-Earth-Moon system under assumed initial conditions was solved, and a set of trajectory predictions was obtained. Using the skills acquired through this research project, I am planning to further pursue such method and extend it to model a Hohmann transfer orbit. This would imply updating my current model with an additional set of three additional second-order differential equation (to include the Moon, Earth, Mars, and a payload), which will produce twenty-four first-order equations for Octave to solve.
References 1. Freedman, R., Kauffman, W. Universe, 7th ed. New York, NY: W.H. Freeman and Company 2005, p.71, p.212.
Figure 2: Modeled Trajectories of the Sun-Earth-Moon System
Results Two elliptical-like curves that model the Moon (in purple) and Earth’s (in blue) trajectories within the timespan of a year were obtained and are shown in Figure 2.


• Hypothesis of “Dark Zone”
• Exploring math models on manifolds that eliminate singularities by involving higher dimensions
Black Hole Singularity Hypotheses Using Complex Manifolds and Dice Theory in EFE
• Exploring discrete math models such as sets of dice, and relations on the sets. For example, non-transi tive dice demonstrate a counterintuitive relation. The standard model of physics also involves discrete relations on subatomic particles like quarks. Concepts
About This SCI 295 MA project is the first math project published in our journal that features student-driven, applied math research to investigate a physical phenomenon such as black holes. We hope to feature more math projects in future issues! Figure 1
• Mathematical modelling of non-transitive interations, as in the non-transitive dice
Discussion: • Describing manifolds such as space-time or S2, and coordinate patches from Euclidean space to the manifolds.
"Dark Zone" Hypothesis “Dark Zone” Hypothesis(Theory) was a hypothesis I sug gested last semester for solving the the problems of Evolution of Supermassive black holes and the funda mental existence of Dark Matter and Dark Energy. The main two idea of the hypothesis are Mass Variant and Identical properties of black holes through the study of the inside singularity that I called “Dark Zone”.
Introduction Black Holes are the most extreme objects in the uni verse, and an unsolved problem in physics is to resolve a mathematical singularity in Einstein’s Theory of General Relativity that predicts the behavior of Black Holes. One way to avoid singularities is to increase the dimension of the manifold, such as replacing a real coordinate with a complex one. We also formulate a hypothesis about black holes sharing mass with each other through a prob abilistic “dice theory” mechanism. These hypotheses combine toward a “Dark Zone” theory to describe the unknowable interior of black holes.
• Scalar functions on a manifold such as gravitational pull, or vector functions such as gravitational force
• Einstein Field Equations (EFE), Tensors, specifically matrices for metric tensors, Riemann curvature and Stress-energy tensors Journal of Science, Technology, Engineering, and Mathematics
Shek Hong Perseus Chan Faculty Advisor: Austin Anderson, Ph.D. Kapi‘olani Community College
Key
• Manifolds, singularities, patches, geodesics in math ematics
48 | Pueo o Kū:


Figure 3
MATHEMATICS | 49
• Prove the scenario is wrong, using real data and deve op a mathematical model.
• Learning General Relativity and Quantum mechanics
Mathematical model for Dice Theory
• Figure the equations of constant k in the Dark Zone Mass Equation
Dice Theory Dark Zone Model
• Talk with a research team at UH Manoa and demon strate a way to test the hypothesis.
For a Dice Theory Dark Zone model, the Dark Zone set could be a finite set of singularities {S_1,S_2, ... , S_n} (in EFE, singularities are points (t,x,y,z) where gravity is infinite) and we can define a function that assigns a mass value to each S_j. Dark Zone Mass Equation is Mass = kP(a,b), k is a constant dependent variable probably related to ΛCDM (Lambda cold dark matter) model in cosmology and the Einstein Field Equation(EFE).
1.ReferencesGrime, J. (n.d.-b). Non-transitive Dice. http://www.singingbanana.com/dice/article.htm#DWSingingbanana.
Figure 2
• Develop the physics of the “Dark Zone”
Conclusion and Future works:
Any math model starts with a set, the abstract mathemat ical foundation of all applications. A set is a collection of elements. For example, traditional space-time is the set {(t,x,y,z)} of all 4 coordinate real-valued points, where each point (t,x,y,z) is an element. For one example of non-transitive dice, the underlying set is {B,G,Y,Bl}, a set of 4 dice elements , each of which represents another set of faces. Eg., B = {6,6,6,6,2,2}. The structure on top of the dice set is a probability function that assigns numbers between 0 and 1 to ordered pairs of dice by which is likely to roll higher. For example, P(B,Y) = 2/3, meaning the probability Black rolls higher than Yellow is 2/3. The macroscopic phenomenon of Black “winning” over Yel low is caused by the underlying mechanism of the faces of each die. A Dice Theory Model of black holes treats mass values as macroscopic manifestation of underlying phenomena like particle interactions.
2. Hawking, S. (1996). The illustrated a brief history of time. Bantam.
Figure 4: http://www.singingbanana.com/dice/article.htm


Figure 1 (above): a sample of grids and the path orientation from point A to point B. | o
Pueo
Kū: Journal of Science, Technology, Engineering, and Mathematics
Purpose The goal of this math project was to interpret the total possible paths through any rectangular grid by means of formulas of our own creation. Our group members focused on using mathematical induction methods to identify common patterns. To replace counting the total number of paths personally, we sought to compile the patterns and combinations of routes into a single entity. In doing so, we achieved the ultimate goal of sharing this knowledge with others by explaining in simple enough terms. As a group, we found the shortest pathways our selves, rather than relying frequently on research results and textbooks. Based on the results, we established for mulas that make it possible to find all possibilities of the efficient pathways.
Pathways Phat Ca, Tyler Cho, Ariana Isaacs, Leon Lee, & Dasen Nakatani Faculty Advisor: John Rader Kapi‘olani Community College About Math Immersion Model (MIM) program prepares students for success in calculus and STEM through an accelerated 16-week sequence of MATH 103, 135, and 140. Students are placed in a cohort with peer mentors and complete a math-based research project.
The solutions found were affirmed by employing Pascal’s Triangle: an increasing set of numbers arranged in a trian gle consisting of algebraic patterns. When studying two grids, we saw that if their dimensions add to the same value, the number of paths will also be equivalent. And so is the case when increasing one dimension at a time by a value of one. [2][5][6]
Approach Our first position: establish the number of unique path ways through a closed grid. To avoid an infinite amount of pathways from the top left corner to the lower right cor ner, we restricted movement to the directions down and right. Utilizing the combinations formula, we were able to determined the number of routes in a single closed grid. The total of the perimeter is ‘n!’ and the direction of right is ‘r!’. [3][4a][7]
50
Figure 3Figure 2Figure 1 Figure 4 A A A A B B B B
Introduction In 2011, Bob Stoffel, a Senior VP of UPS claimed that their company found an efficient way to deliver faster and lower the cost of gas by only having a right turn. By using this method, UPS saved about 10 millions gallon of fuel that year. In our project, we did something similar to this idea called “pathways”. We investigated rectangular grids to determine the number of possible ways to get from point A to point B but without overlapping or going backward.


Two rectangles connect at a single “waypoint” (corner): For two rectangular grids that share one waypoint, we utilized the combination formula.. See the top grid with its equation; we solved by multiplying the total pathway from two small rectangular shape that made up the orig inal. From point A to point B, there are 6 paths and from point B to point C, we have another 6 paths. Multiplying these values together equals 36- the total from point A to point B.
During algebra class, we connected the rising values in the descent of Pascal’s Triangle to the ensuing powers on the coefficients of binomials; this progression is la beled the Binomial Theorem. As we compared the two, we realized the values of the triangle are identical to the coefficients on the variables in the Binomial Theorem.
Method 1: Combining rectangular paths
MATHEMATICS | 51
Shape with multiple waypoints: See Figure to the right. We broke down the grid into three smaller shapes. To find the total paths from point from A B, we needed to figure out the total paths of the broken off components using these routes: A C B, A D B, and from A E B. Beginning with point A C D there is one waypoint (purple). From point A to D to B, there are 16 paths (red). From point A E B, there are 36 paths (green). Finally, we can add all three (1+16+36) which will give us 53 total paths from A B.
Two rectangles overlap at a single 1x1 box (a “way-rectangle”, or 2 “waypoints): See Figures to the left. From point A B there are a total of 18 pathway. To solve this problem we need to break this grid into two (A C B, & A D B). The two rectangular grids share one waypoint. From this way point, we need to figure out how many paths are from A D B and A C B, which will give us a total of 9 each with their sum being 18 unique routes from A B. Secondly, we wanted to find all possible paths with open grids.


Our first victory, establishing the total number of path ways through a single grid via the combination formula. This first step was most important as it set the founda tion for our standpoint. Grasping this basic concept, we quickly found more keys to the puzzle such as Pascal’s Triangle and the Binomial Theorem.
Aftervia:understanding single waypoints, we were able to find the total number of pathways of two rectangles over lapping one another in a 1x1 box or “way-rectangle”, but unfortunately not in a closed form.
Future Research We believe to further this research, we need to better understand “way-rectangles” and understand the multiple waypoints it creates and how these are tied to the total number of unique possible pathways. Additionally, we need to understand the removal of rectangular grid(s) from anywhere within the figure, except the top left cor ner/starting point and bottom right corner/endpoint. This research could be utilized not just in mathematics but also in real life scenarios, for example, mapping streets and delivery routes, by analyzing the total possible paths and analyzing those to determine the most efficient and shortest paths.
52 | Pueo o Kū: Journal of Science, Technology, Engineering, and Mathematics Results
With this new information, we could compute the path ways, never having to count them out again, and move forward to our next question. From there, we connected two separate rectangles via one waypoint, also finding the total number of pathways through this modified grid by multiplying the pathways through each rectangular grid
Method 2: Total encompassing grid with missing rectangular grids See Figure to the left. We saw an irregular rectangular grid as a large encompassing rectangular grid, only missing rectangle(s) corners. We need to calculate the total paths of the encompassing rectangular grid before removing the missing grids (in red) from the total. We calculate the missing paths by decomposing into smaller grids. The number of paths through the encompassing grid, a 4x4 rectangle, yields 70 total paths. Decomposing the missing rectangles into two small grids from the left then calculating the number of paths from point A P B and point A L P, which is 16 paths and 1 path, respectively. Adding these yields the total missing paths from the encompassing grid, which is 17. Subtracting the missing paths from the total paths of the encompassing grid yields 70-17=53 total unique paths.


5. Math, Dr. “Pascals Triangle.” Mathforum.org, mathforum. org/dr.math/faq/faq.pascal.triangle.html. 6. Roberts, Donna, and Frederick Roberts. “Binomial Theo rem.” Binomial Theorem - MathBitsNotebook(A2 - CCSS Math), MathBits Notebook, 2012, Algebra2/Polynomials/POBinomialTheorem.html.mathbitsnotebook.com/ 7. Yerian, Lew. “Understanding Permutations and Combi nations.” ISixSigma, 22 Oct. 2016, www.isixsigma.com/ binations/.community/blogs/understanding-permutaions-and-com Acknowledgements Special thanks to: Kapi‘olani Community College KCC STEM Center Professor John Rader, for his guidance and assistance with this project MATHEMATICS | 53
3. Cormen, Thomas, and Devin Balkcom. “The Factorial Func tion (Article).” The Factorial Function, Khan Academy, 2014, algorithms/recursive-algorithms/a/the-factorial-function.www.khanacademy.org/computing/computer-science/
References 1. Bilodeau, A. “History of Pascal's Triangle.” Background of Pascal's Triangle, 2014, htmlABilodeau/Background%20of%20Pascal's%20Triangle.5010.mathed.usu.eduFall2014/
2. Coolman, Robert. “Properties of Pascal's Triangle.” LiveScience, Purch, 17 Nov. 2015, www.livescience. com/51238-properties-of-pascals-triangle.html.
4. Pierce, Rod. "Binomial Theorem" Math Is Fun. Ed. Rod Pierce. 7 Sep 2018. 27 Jan 2020 com/algebra/binomial-theorem.html><http://www.mathsisfun.a.Pierce,Rod."FactorialFunction!"MathIsFun.Ed.RodPierce.29Nov2019.26Jan2020<http://www.mathsisfun.com/numbers/factorial.html>b.Pierce,Rod."Sequences"MathIsFun.Ed.RodPierce.21Sep2017.28Jan2020<http://www.mathsisfun.com/algebra/sequences-series.html>
Patrick Empleo Faculty Advisor: Aaron Hanai, Ph.D. Kapi‘olani Community College
Nāmakaokapāoʻo’s parents Ka‘uluakāha‘i and Pōka‘ī met in Hōʻaeʻae. While Pōka‘ī was pregnant, Ka‘uluakāha‘i went back home to Kahiki. She gave birth to Nāmaka okapāoʻo and lived in poverty until a man named Puāli‘i arrived. He fell in love with Pōka‘ī upon seeing her and asked her to be his wife.She agreed to do so and she and Nāmakaokapāoʻo went to live with Puāli‘i at Keahumoa. Puāli‘i tilled two sweet potato fields there and vowed no crops be eaten until an ulua offering was made and he eat the crop first. Nāmakaokapāoʻo and his friends uprooted and cooked all the potatoes while Puāli‘i fished. This angered Puāli‘i and sought to kill him. Puāli‘i swung his axe but it deflected back to him as Nāmakaokapāoʻo finished a prayer to his ancestors, killing himself instead of the boy. O‘ahu king Amau learned what happened and proceeded to Keahumoa to challenge Nāmakaokapāoʻo. Nāmaka okapāoʻo hid Pōka‘ī in a cave in Waipoūli and returned to Keahumoa to defeat Amau and his men.He then brought his mother out of hiding and placed her as the new ruler over O‘ahu. Materials and Methods Adobe Photoshop - used to layer multiple images and maps together, creating a more cognitive map of Hōʻaeʻae and its boundaries. Fusion 360 - used as a tool to help with calculating the centroid of Hōʻaeʻae. Google Maps - used to pinpoint the centroid in the real world and visu alize the area around it
Results Area: 4.87mi2 (Fig. 1) Centroid: (21.414, -158.039) (Fig. 1, 2)
Figure 1: Hōʻaeʻae broken down into simple shapes to calculate the centroid - a combination of four triangles and one rectangle. The area of the combined shapes is 4.87mi2
Figure 2: Hōʻaeʻae with centroid, approximately (21.414, -158.039) 54 | Pueo o Kū: Journal of Science, Technology, Engineering, and Mathematics About Every semester, engineering students in CE 270 find the center of the ahupuaʻa they live in through a variety of meth ods, connecting engineering to a sense of place and culture.
Legend of Nāmakaokapāoʻo
Hōʻaeʻae: Persisting Knowledge
Introduction Hōʻaeʻae is an Ahupuaʻa in the Moku of ʻEwa on the Mok upuni of Oʻahu. Since not much is known about Hōʻaeʻae, the work conducted in this project is to compile data and information of Hōʻaeʻae and to present the research to further educate people on the history of an area less commonly researched.


Figure 3: Just below Hōʻaeʻae’s centroid is the residential area Royal Kunia
The other section that is within the already developed residential area was proposed as a golf course area called Meadows at Royal Kunia. The area was divided into 13 lots, ranging from 7 to 16 acres and sold at around $70,000 per acre. The Meadows was promised to the residents of the area, but instead obtained unauthorized land clearing, illegal farming, and Higher association fees instead. There are even a few goats that are being raised in a fenced-off section literally behind a home. There are large concrete blocks at the corner of Anonui and Halepua streets to discourage vehicles from entering the undeveloped area. There have been no recent updates in regards to the development.
References AVA Konohiki Website Team. “Maps 'Ewa.” AVAKonohiki.org, www.avakonohiki.org/maps-ewa.html. Accessed 27 Nov. 2021. Fornander, Abraham. Fornander Collection of Hawaiian Antiq uities and Folk-Lore. Internet Archive, Bishop Museum Press, 1918, archive.org/details/FornanderCollection5/page/n323/ mode/2up. Accessed 27 Nov. 2021. “IslandBreath: Hawaiian Ahupuaa.” Islandbreath.org, island breath.org/mokupuni/mokupuni.html. Accessed 27 Nov. 2021. “Royal Kunia Community Association - Home.” Royalkuniacom munityassociation.org, 2010, royalkuniacommunityassociation. org/. Accessed 27 Nov. 2021. “Royal Kunia Community Association | Royal Kunia Community | Association | Royal Kunia | Royal Kunia Community Association | Royal Kunia Community | Association | Royal Kunia.” Royal Kunia Community, rkunia.com/. Accessed 27 Nov. 2021. “Tradition of Nāmakaokapāo‘o (Eyes of the Goby Fish) | Hoakalei Cultural Foundation.” Hoakaleifoundation.org, okap%C4%81o%E2%80%98o-eyes-goby-fish.hoakaleifoundation.org/documents/tradition-n%C4%81maka2014,Accessed27Nov. 2021. Acknowledgements Professor Aaron Hanai, for creating a curriculum that integrates the class material with real world application by exploring the history of where we reside. The University of Hawaiʻi System for allowing me more opportunities for furthering my education.
ENGINEERING | 55 Royal Kunia Just below Hōʻaeʻae's centroid is the residential area of Royal Kunia (Fig. 3). The blue section is a 211-acre parcel of land recently acquired by the development company Haseko in 2020 and is planned to become Royal Kunia Phase 2. Haseko has been surveying the area, testing the soil, inspection, and checking property line survey markings, as well as bringing in archaeological consul tants, to prepare for development.
Conclusion The Ahupuaʻa of Hōʻaeʻae has an area of 4.87mi2 with the centroid at (21.414, -158.039). Nāmakaokapāoʻo was born of Ka‘uluakāha‘i and Pōka‘ī, who met in Hōʻaeʻae, and was raised there by Pōka‘ī until relocating with Puāli‘i to Keahumoa. The centroid of Hōʻaeʻae sits just above Royal Kunia, but sections of the land have been victim to illegal land use. Future research of Hōʻaeʻae can delve deeper into the land usage of Royal Kunia II and possibly turn that area into agricultural land instead of residential, as most of Hōʻaeʻae is used for farming.


56 | Pueo o Kū: Journal
About When this student found out that the botany students had to manually check on the native plants in the Kokiʻo green house during the height of the COVID-19 pandemic, she created a system to decrease their risk of exposure. This project was funded by a National Science Foundation Geopaths-Impact (GP-IMPACT) grant.
Data measurement and visualization After connecting the DHT22 sensor and setting up the Raspberry Pi operating system, Python and Perl languag es are used to create scripts that will carry out instruc tions. The following diagram (Figure 1) describes the data acquisition and publication process.
setup In this project, the hardware used to build the monitoring system are: 1) Raspberry Pi (RPI) 3 model B [1], and 2) The temperature and humidity sensor [2]. Raspberry Pi 3 is used as a micro-controller which contains one CPUs (processor cores), memory, and programmable input/ output peripherals capabilities. The DHT22 sensor is able to measure temperature from −40 to 80 degree Celsius with an accuracy of: 0.5°C, and humidity from 0−100 relative humidity percentage with an accuracy of 2%. The DHT22 sensor is connected directly on the GPIO pins of the RPI. Three pins are used for this sensor: the power (5V) connects to GPIO pin #2, the ground to GPIO pin #6 and the data was chosen to be connected to GPIO pin #4, which is referred to by GPIO4 in the code controlling it.
Purpose The purpose of this project is to monitor and detect the plant watering system of the Koki‘o greenhouse at Ka pi‘olani Community College.
Jenny Brown Faculty Advisor: Hervé Collin, Ph.D. Kapi‘olani Community College
Monitoring the Greenhouse Watering System for Native Plants
Figure 1: Method Sequence of Science, Technology, Engineering, and Mathematics
ExperimentalMethods
Introduction A monitoring system is a software tool that can observe system equipment, traffic, and applications. Monitoring systems, specifically greenhouse monitors, detect en vironmental changes that directly impact the quality of plants. The Koki‘o greenhouse at Kapi‘olani Community College propagated and grow plants, with a majority of its inventory containing endemic plants to be used primar ily in botany and biology labs as an educational tool. A monitoring system applied to the Koki‘o would be highly beneficial for maintenance and practical purposes but would also promote sustainability, cultural understand ing, appreciation and respect for Hawaiian history and culture as botany is a significant aspect of Hawaiian cul ture due to its medicinal, practical, and ceremonial uses.

The algorithm detection was performed in several steps. Each day, the humidity data was downloaded and smoothed using a moving average treatment. Every time the watering system is triggered in the greenhouse, the humidity increases sharply for several seconds. To preserve the sudden increase of relative humidity, the exponential moving average was used in order to give the latest data point the most weight, which in turns pre serves the peaks in the humidity data. When employing the moving average, the periodicity has to be chosen. If selected too low, the smoothing process is not very effective; if chosen too high, information is lost and the peaks and smoothed too much to be detected.
Clearly, if the periodicity p is chosen too high, signifi cant information in the signal is lost: the original peaks reflecting the watering events tend to disappear. The second step is to choose a window of N data points, calculate the slope, move the window by one increment, recalculate the slope, and repeat this process throughout the entire time series. When the slope values reaches a maximum for a short period of time, it is expected that the watering system is on. The slope formula used to calculate the slope m is:
Figure 2: Moving Average where N is the number of data point chosen in the win dow, x is the time, and y is the humidity data.
ENGINEERING | 57 Algorithm detection
Example of a periodicity 10 and periodicity 200 is shown below compared to the raw humidity data.


Results
Each time, the four events were detected successful ly, a weight value was assigned to the combination of p, N, and f, and incremented by 1 every time the four event were detected on subsequent days with the same values. After running our algorithm for thirty-two days, the three parameters p, N and f were plotted on a three dimensional graph. Based on the colors provided by the above three-dimen sional graph, the optimum values for the periodicity p, number of data points used to calculate the slope values N and the value of the low pass filter f were: 27.5, 0.23, 27. These values can now be deployed to the RPI on a daily basis. In addition, daily visualisation of the data is now available and mirrored every day at midnight on a
Basedgoogleon the colors provided by the above three-dimen sional graph, the optimum values for the periodicity p, number of data points used to calculate the slope values N and the value of the low pass filter f were: 27.5, 0.23, 27. These values can now be deployed to the RPI on a daily basis. In addition, daily visualisation of the data is now available and mirrored every day at midnight on a google 58 | Pueo o Kū: Journal of Science, Technology, Engineering, and Mathematics
The final step of the detection algorithm is to figure out the optimum value for the periodicity p, the number of data points N to be selected when calculating the slope values, and the value of the low pass filter f to detect the four events taking place each day at known times. Ranges for p, N, and f were chosen to be [4 : 50], [5 : 30], and [0.06 : 0.4] respectively. Hence, 47 * 26 * 18 (21996) possibilities were calculated every day with a new data set. Daily calculations on an Intel CORE i3 took about two hours (vs 9+ hours on a RPI).
Figure 4: Optimization of parameters site
Figure 3: Low Pass Filter
Once this process is completed, a new time series is obtained for further analysis that consist of applying a low pass filter. The value of the low pass filter must be chosen such that exactly four events are detected at the known scheduled time (Figure 3). If the value f of the filter is set too low, false positive will be detected (too many detected events that did not actually occurred)’; if the value of the filter is set too high, the true positives are lost (not all four event are detected).

Moving forward, several issues arose that could improved in the second iteration of this project: user notification: a notification system could be employed preferably either through e-mail or text to send an alert directly to the intended recipient.
References 1. “Raspberry pie.” (), [Online]. Available: https://www.raspberrypi.org/. 2. “Dht22.” (), [Online]. Available: https://www.amazon.com/DaFuRui-Digital-Temperature-Humidity-Compatible/dp/B089N2X HTL/ref=asc_df_B089N2XHT. Acknowledgements Thank you to the National Science Foundation for funding this project, and the following faculty and staff at Kapi‘olani Commu nity College that made this project possible: CELTT, the Center for Excellence in Learning, Teaching and Tec nology at Kapi‘olani Community College; Mr. Mike Ross, Assistant Professor, Botany, Math and Science Department; and Mr. Jacob Tyler, Assistant Professor, Engineering, Math and Science Department Figure 5: Website displaying humidity and temperature of the greenhouse ENGINEERING | 59 Further Research and Conclusion
be


60 | Pueo o Kū: Journal of Science, Technology, Engineering, and Mathematics
Kiana Walters Faculty Advisor: Hervé Collin, Ph.D. Kapi‘olani Community College
Purpose The purpose of this project is to tracks the occupancy of the STEM Center through a login and logout system with a microcontroller. Method The system was developed to be used on a small touch screen tablet and programmed on a Raspberry Pi (RPI) microcontroller [1] to reduce the cost of having two full computers located at the entrance and exit of the STEM Center. The overall method used in this project is shown in Figure 1.
Operating System: The next step was to learn the basics of the Linux Operating System (OS) running on the RPI to be able to operate it [3]. Learning to navigate the shell is important because it provides an easier and more power ful way to navigate throughout the system and configure it through command line [4].
Client/Server: In order to process the information from the user, a web server was required: Apache. To process POST requests from the client (touchscreen) to the serv er software, the Common Gateway Interface (CGI)module was also installed using cpan.
⁊ ⁊⁊⁊
Hardware: The Microcontroller was first connected to the touchscreen tablet in order to be able to configure it internet connection. For development purposes, the VNC protocol was used [2], which provides a connection to the RPI from a personal computer, and the use of a larger screen than the RPI touchscreen.
Creating a Safer Campus by Developing a COVID-19 Tracking System
Figure 1: Sequence of the method About This student created a COVID-19 tracking system to help protect students, faculty, and staff in the STEM Center and was funded by a National Science Foundation Bridges-to-Baccalaureate grant aimed to help Native Hawaiian and other underrepresented minority students obtain degrees in STEM.
Introduction Today, many people are taking different measures to protect themselves and others from COVID-19. Kapiʻolani Community College’s Science Technology Engineering and Mathematics (STEM) Center is one of many that prioritizes students and staff's health. If contact tracing needs to be done at the STEM Center, a tracking system of students entering and exiting the Center needs to be in place. This system could help protect students, staff and the school by providing easier access to Kapiʻolani mem bers who may need to be contacted for any COVID-19 related reason.


The Kapi’olani Community College Login and Logout system was created for the Science, Technology, En gineering and Mathematics (STEM) Center. It is Rasp berry PI based, stand alone, and operated by a simple touchscreen interface as shown in Figure 2 and 3. The system currently provides a clear and simple interface for students to use when entering and leaving the Center as shown in Figure 4.
Client: A frontend page students would interact with to send their information was required. The Hypertext Markup Language (HTML) and Cascading Style Sheets (CSS) had to be learned and were employed to create the client interface.
Server: To program the backend, CGI Perl was the chosen programming language to process and save the informa tion entered by the students. Each HTML field value (first name, last name, and email) was stored into variables using CGI.pm, loaded into memory using a string, and saved on the server in a comma-separated values (csv) formatted file with the server timestamp information attached to it. Once the information is saved, an auto matic HTML response/thank you page was automatically generated and sent back to the user.
Figure 2 & 3: Physical system (RPI and touch screen, front and back) Figure 4: Graphical User Interface
The purpose of this Sign-in website is to assist with any contact tracing needing to be done and to protect mem bers of the Kapi’olani Community College. Students will be able to login and logout to the STEM Center and can be contacted if they contract the virus. Other students being present at the same time will also be identified and contacted with such system.
To improve this project, future ideas include polishing up the website display, improving the security of the stu dent's information and creating a notification system.
References 1. Raspberry Pi. http://www.raspberrypi.org/ 2. RealVNC. http://www.realvnc.com/ 3. M. Stonebank, 19 October 2001. “UNIX Tutorial for Begin ners.” UNIX / Linux Tutorial for Beginners, faculty.smu. edu/reynolds/unixtut/. 4. “UNIX / Linux Tutorial for Beginners: Learn Online in 7 Days.” Guru99, www.guru99.com/unix-linux-tutorial.html.
To complete the project both a client HTML page and a server CGI script needed to be written.
Acknowledgements We would like to acknowledge and thank the National Science Foundation, and specifically the Louise Strokes Alliance for Minority Participation (LSAMP) for funding this research and Dr. Hervé Collin as the mentor.
The website can be more user friendly and inviting when campus members sign in and out. The web server is secured now, but as technology advances the security of the server can be improved alongside it. Another idea to add would be to include a notification system. A stu dent can receive a notification that their email was used to sign-in at the school. That can help protect students and the school from any misuse of student information.
ENGINEERING | 61
Conclusion and Further Research
Contract tracing can also take advantage of a notification system by flagging a student who may need to be traced.
Results


Introduction Severe acute respiratory syndrome coronavirus 2 (SARSCoV-2) or COVID-19 can potentially stay on plastic and stainless steel for 2-3 days (Figure 1) and can infect people by touching objects who then touch their face [1]. This pandemic provided an opportunity for robotic technology to enable industries, educational institutions, and individuals to follow mandatory social distancing and quarantining guidelines [2]. Although the risk of infection is lower than other kinds of transmissions, spaces still need to sanitized [4]. Hos pitals already utilize ultraviolet disinfection (UVD) robots to disinfect rooms, but they can cost between $80,000 to $90,000, making them too expensive for most busi nesses [5]. Retail and grocery stores instead rely on staff to constantly clean and disinfect, which increases the number of people that can potentially be exposed as well as labor costs.
62 | Pueo o Kū: Journal of Science, Technology, Engineering, and Mathematics
Creating an Arduino Based Sanitizing Robot To Reduce the Spread of Viruses in Grocery Stores
Materials The SparkFun RedBoard (Programmed with Arduino) was used to run two servos to pull an aerosol spray bottle trigger and to maneuver the bottle to different directions.
Jeraldine Milla Faculty Advisor: Jacob Tyler, M.S. Kapi‘olani Community College
Two TowerPro MG995 servos were used with the servo brackets, several screws and lock washers to secure the parts (Figure 2). A breadboard and several jumper wires used to connect the servos to the Arduino board. There were several cardboards and wood scraps that were used to create a stable foundation for the prototype.
Figure 1: List of how long Coronaviruses live on surfaces [3]. About This student wanted to help to mitigate the number of COVID-19 cases in Hawaiʻi at a time when scientists were not sure how it was spread through this self-initiated, grant-funded project. This research was presented at the national virtual 2020 Society for Advancing Chicanos/Hispanic & Native Americans in Science (SACNAS) Conference.
The overall objective of this research is to create a lowcost and easily replicable robot that uses an Arduino microcontroller to automatically spray a disinfectant onto nearby objects to help reduce the spread of viruses in small establishes, such as grocery stores. Seventy-per cent isopropyl alcohol (2-propanol), also known as iso propanol or IPA, will be used since this is most commonly used as disinfectant [6].
Figure 5: Algorithm of the program from it code to the arduino board to its respective servos.
Phase Two: For the maneuvering mechanism of this machine, an other servo was used with 3 round servo horns/arms attached to the output spine. The gear was attached to the bottom part of the spraying mechanism (Figure 4). Since the bottle spray was meant to be detachable, the servo for maneuvering was attached to the container/ base of the spray bottle. Since the bottle will be heavier for the servo at the bottom, another base was created to stabilize the rotation of the spray bottle (Figure 4.3).
Phase One: The spraying mechanism was created by attaching the servo with a bracket at the back of the (Figure 3.1b) aero sol spray bottle. The servo bracket was connected to the trigger of the spray using twist wires (Figure 3.1a) to wrap other items. A spare servo arm/horn was used as a grip and was attached to the trigger of the spray bottle since the servo bracket is too smooth to attach with twist wires (Figure 3.2). A cardboard base was created to hold the spray bottle(Figure 3c).
Figure 2: Materials for the prototype SANIBOT. [In the picture: Aerosol Spray bottle, owerPro MG995, cord connector for arduino board, Arduino board, jumper wires, servo bracket, servo gears, and some screws.]
Figure 4.3: The servo inside the base was attached underneath the bottle's base, balancing the bottle on top the servo.
Figure 4.2: The servo was placed inside the base and will be attached to the bottle's base.
Figure 4.1: The servo for the rotation of the whole bottle with 3 gear arms for better coverage.
ENGINEERING | 63
Algorithm: The program was created with Arduino IDE to simultane ously control both servos. A sample code from Inventor’s Kit, called “Sweep”, was used as a base for this project’s code [7]. The algorithm was meant to loop the actions of the servo by letting the spraying servo rotate from 0 to 180 degrees with a 20 ms delay and 180 to 0 degrees with a 30 ms delay (Figure 5). There is an interval delay of 30 ms between the two actions. This allows the spray to have a better chance to spray a mist of the solution longer. The second servo, on the other hand, maneuvers the spray bottle with the same parameters and rotates as it sprays.
Figure 3: Finished product for Phase One (spraying mecha nism) with the servo(a) con nected to the spray's trigger(b) placed in a prototype bottle holder(c). Figure 3.1: The servo(a) at tached at the back of the spray bottle connect to the trigger using a twist wire(b). Figure 3.2: An extra arm/horn gear from servo kit was screwed to the spray's trigger.
Methods


• Strengthen the structure
2. Murphy, R. R., Gandudi, V. B. M., & Adams, J. (2019). Appli cations Of Robots For COVID-19 Response. https://arxiv. org/abs/2008.06976.
5. Ackerman, E. (2020). Autonomous Robots Are Helping Kill Coronavirus in Hospitals. IEEE Spectrum: Technolo gy,Engineering, and Science bots-are-helping-kill-coronavirus-in-hoorg/automaton/robotics/medical-robots/autonomous-roNews.https://spectrum.ieee.spitals.
6. Walleser, M. (2017). Why Is 70% Isopropyl Alcohol (IPA)a Better Disinfectant than 99% Isopropanol, and What Is IPA Used For? [web log]. https://blog.gotopac com/2017/05/15/why-is-70-isopropyl-alcohol-ipa-a-bet terdisinfectant-than-99-isopropanol-and -what-is-ipa-usedfor/.
4. Centers for Disease Control and Prevention. (2020). How Coronavirus Spreads. Centers for Disease Control and Prevention. https://www.cdc.gov/coronavirus/2019-ncov/ prevent-getting-sick/how-covid-spreads.html.
Results The goal was met as the prototype SANIBOT was able to maneuver and spray in different angles (Figure 6). In spite of that fact, due to the pandemic and COVID-19 shipping issues, the supplies needed for this project did not come in time and most materials were improvised. The base was unstable (Figure 6.2a) and did not turn properly. The cardboards were cut unevenly, which re sulted to instability when used since the spray bottle and its servo for the spraying mechanism weighs more than this base (Figures 6.1 and 6.2a). The spraying part also had several issues as there were only few long twist wires founded that could pull the trigger properly. Thus the servo slants as it pulls the trigger and can sometimes not pull the trigger properly (Figure 6.2). White duct tape was used to secure the servo at the back of the spray instead, rather than fastening it into the bottle because the screw fastened inside might rust (Figure 6.2).
References 1. Centers for Disease Control and Prevention. (2020). About COVID-19. Centers for Disease Control and sponse/about-COVID-19.html.https://www.cdc.gov/coronavirus/2019-ncov/cdcrePrevention.
Conclusion This research can be used in other settings to help pro tect essential workers. Major clusters such as schools can use it in face-to-face or hybrid classes and spaces to help slow the spread of the virus. The next goals and phases for future work are as follows:
• Analyze the effectiveness of the 70% isopropyl al cohol in preventing the spread of viruses on areas
3. Nazario, B. (2020). How Long Do Coronaviruses on Sur faces? WebMD. https://www.webmd.com/lung/printables/ graphic-coronavirus-live-surfaces.
Professor Aaron Hanai, for creating a curriculum that integrates the class material with real world application by exploring the history of where we reside. The University of Hawaiʻi System for allowing me more opportunities for furthering my education.
7. Arduino. (2018). Sweep. Libraries Examples Tutorial. Sweep.https://www.arduino.cc/en/Tutorial/LibraryExamples/ Acknowledgements
Figure 6.3: Finished prototype at 180 degrees. Side view that shows the spray and the servo in action.
• Make the SANIBOT move into certain ranges as it sprays out the solution in its area of scope Figure 6.1: Finished prototype at 0 degrees. The circle shows the rotation section. Figure 6.2: Finished prototype at 180 degrees. The circle shows the rotation section. | Pueo o Kū: Journal of Science, Technology, Engineering, and Mathematics
64
• Test out the range scope of the spray


• This allows to utilize what is already a known working system into having an easy to add on shell to poten tially reduce the space junk dilemma.
Katlynn Vicuña Faculty Advisor: Aaron Hanai, Ph.D. Kapi‘olani Community College
• Everything that is needed to power, control and de tect the location of the cubesat is confined into this apparatus.
Designing a Vehicle to Collect Debris to Minimize Threats to Existing and Future Space Missions and Technology
Background • A CubeSat is a small scientific instrument already being utilized for a variety of different types of sci entific experiments.
Introduction In 2020, a piece of uncataloged space debris impacted the glass on the International Space Station (ISS) and ox ygen escaped.1 Space debris can range from large rocket boosters to interplanetary dust 1 mm in size, making it a difficult track. Currently, only 22,300 pieces of space debris are cataloged—a total mass of 8800 tons—but the National Aeronautics and Space Administration (NASA) and European Space Agency (ESA) statistical models show there could be 129 million unknown and uncatego rized pieces of debris in orbit.2 Its damage to spacecraft can impact important tasks such as communications and weather systems and scientific experiments, causing billions of dollars in damage. Existing strategies are fo cused on deorbiting plans and restricting usage of certain materials, but collection has not yet been designed. The overall objective of this project is to design a prototype to efficiently decrease the number of space debris by gathering it and disposing based on size and material. Then the debris will be assessed and categorized by its combustibility and reentry threat to get a better under standing of the design challenges.
• They come in many sizes but generally a “1U” CubeSat is 10 cm or 4 in on all sides. Then they increase geneally in 10 cm increments.
• The idea behind what is called “the muscle” will be a customizable shell for these preexisting spacecraft to turn this single scientific purpose mission into a dual purpose clean up mission.
Figure 1: CubeSat Breakdown 3 and Block Diagram.4 ENGINEERING | 65 About This project was funded by NASA’s Hawaiʻi Space Grant Consortium, which offers KapCC STEM students stipends to pursue research that aligns with NASA’s objectives. This research was also presented at the virtual 2021 National Council on Undergraduate Research Conference.


• Found that smooth surface is not optimal for flat or round pieces of debris.
• PLA was chosen for this print based on its recyclabil ty, toxicity, heat resistance, strength, cost, weight, and access to the material Design
• In Figure 3, you can see the initial CAD design based on the finalized recycled cardboard design with chamfered edges
Figure 4: PLA 3D PrintShell | of Science, Technology, Engineering, and Mathematics
Figure 2: Basic Cardboard Prototype of Shell
• Revisions made were to add chamfered edges to top to allow for more shell to debris contact.
• Equipment used for testing: Swimming fins Swimming goggles Weighted belt Various size and shape debris Prototype of “The Muscle”
Pueo o Kū: Journal
• Figure 5 is NASA's Neutral Buoyancy Laboratory in Houston Texas.
• Slight textured design changes for top will need to be made of the shell will need to be made
• PLA, ABS, carbon fiber, Kevlar composite, fiberglass and aluminum were some of the more common ma terials used in 3D printing.
• In Figure 4, is the 3D printed shell in bright pink for high visibility during testing. This is 1U size (10 cm or 4 in on all sides) Decision Matrix on Materials for Prototype Shell
Figure 3: Shell CAD in Fusion 360Shell
• All of these materials would be able to burn up upon reentry.
• Tested by allowing debris to slightly drop onto “the muscle” and make a variety of maneuvers while un derwater
• It was found that sharp edges allow for less surface area contact.
• Once a design is made an open source file would be released and depending on whatever material was optimal for the user they could print accordingly.
• Very basic design to be able to accommodate dif ferent types of cubesats.
66
• Figure 6 is Ko Olina Lagoon on Oahu, Hawaii
Testing and Analysis
Table 1:
• Both are used to simulate zero gravity without actu ally going into space.
• initial design made from recycled cardboard to save on materials and waste.


References 1. NASA (2013). NASA debris impact. Retrieved November 5, news/orbital_debris.html2020,https://www.nasa.gov/mission_pages/station/
ENGINEERING | 67
• Designs
allow for
3. Hawaii Space Flight Laboratory. (n.d.). [CAD CubeSat De sign]. Retrieved January 12, 2021, from organization.
Figure 5: NASA Neutral Buoyancy Laboratory in Houston, TX5 Figure 7: Testing Shell Figure 8: Equipment Used Figure 9: Testing Shell
Acknowledgements Thank you
will also be started. •
to be successful Figure 6:
Future Work •
4. Hawaii Space Flight Laboratory. (n.d.). [Block Design]. Re trieved January 12, 2021, from organization.
5. NASA. (2017). Neutral Buoyancy Laboratory [Photograph]. cy-laboratoryhttps://www.nasa.gov/image-feature/neutral-buoyan to advisor Dr. Aaron Hanai, the National Confer ence on Undergraduate Research (NCUR), LSAMP Bridges to Baccalaureate grant (LSAMP: NSF award HRD-1619702), the National Science Foundation, Hawaii Space Flight Laboratory (HSFL), Hawaii Space Grant Consortium (HSGC), and Kapi‘olani Community College STEM (KCC STEM) program. Next will be to CAD design variety of different top sides that have varying heights to optimise to secure debris and perform more testing. for apparatuses for the smaller and larger debris Reducing debris one piece at a time to of world exploration and Earth orbiting missions Testing Location was Ko Olina Lagoon on Oahu, HI.
2. European Space Agency (January 2019). Space debris by the numbers. Retrieved November 5, 2020, debris_by_the_numbersesa.int/Our_Activities/Operations/Space_Debris/Space_https://www.


Introduction CanSat is an annual student design-build-launch compe tition organized by the American Astronautical Society (AAS). The competition is for space-related topics that fulfills a complex end-to-end life cycle engineering proj ect. Forty teams from universities from around the world compete. This year's competition consist of a container and two auto rotating maple seed science payloads. The container will be placed inside of a rocket and launched to aheight of 675 meters to 725 meters where the con tainer will be released from the rocket. During descent, the container shall release the twopayloads, at heights of 500 and 400 meters, as wellas collect data and send it to the ground station. Thepayloads will be spinning once released and also collect data, sending it to the container.
Methods The container is a cylinder with a height of 400 millime ters and a diameter of 123 millimeters, with the walls being 2.46 millimeters thick. The container is made out of carbon fiber (Figure 2). The container will be split into two levels; a top and bottom compartment. The top com partment will hold the electronics for the container and the payloads in the bottom compartment. The internal structure is a 3D printed structure (Figure 3) and trussed for a reduced mass.
68 | Pueo o Kū: Journal of Science, Technology, Engineering, and Mathematics
Purpose The purpose of this competition is to design, build, and launch an autonomous Can Satellite (CanSat) that will release two payloads and collect data while descending.
CanSat 2021: OnlyCans Cole Pelayo, Grayson Levy, Joselito Macabante, Jr., Kelly Hwang, Kiana Walters, & Matthew Paulino Faculty Advisor: Aaron Hanai, Ph.D. Kapi‘olani Community College
About Since 2009, KapCC has participated in CanSat, an international space competition sponsored by the American Astronautical Society (AAS), and even won 1st place in 2013. This team was formed through the National Science Foundation funded Pre-Engineering Education Collaborative II (PEEC II) grant summer bridge program, which seeks to get more Native Hawaiians and women into engineering. You can find out more about the competition at cansat competition.com.
Figure 2: Container Figure 3: Container Internal Skeleton
Figure 1: Launch Overview


Figure 4: Round Parachute
The descent velocity of the container is calculated before and after release of the payloads to ensure velocity is within standard. The payloads are 347 millimeters long with a width of 100 millimeters at the widest point of the wing designed to resemble a maple seed, and 3D printed with PLA filament (Figure 5). The payload consists of three main components; the wing, the spine and seed-shaped base. The wing is made out of polyethylene terephthalate glycol, PETG. The electrical components of the payload will be housed on the seed-shaped base and along the spine. The pay loads’ descent will be controlled through design intent. The payload will rotate autonomously creating upwards lift, slowing the descent velocity. The payloads will be released from the bottom of the container through the servo-controlled rotating half-door system (Figure 6). The servo motor will rotate the half-door 90 degrees counterclockwise to release the first payload at 500 me ters above ground, then rotate 180 degrees clockwise to release the second payload 400 meters above the ground. The payloads will begin rotating immediately after release. The container’s descent will be controlled by a round parachute made out of nylon fabric which deploys upon release from the rocket (Figure 4).
The electrical components for the CanSat are in two loca tions, the container and the payloads. The objectives for the CanSat competition is to release the payloads from the container and transmit the payload and container te lemetry to the ground station. The telemetry being trans mitted includes: altitude, air temperature, battery voltage, GPS location, mission time and rotation rate. There is a microcontroller on the container and each payload; the Arduino Micro for the container (Figure 8) and Arduino Nano 33 BLE Sense (Figure 9) on payloads. The Arduinos will control the sensors and communicate via XBee radio, sending the data collected to ground con trol. Ground control will be made up of a laptop and it’s own XBee radio and antenna (Figure 7).
Figure 6: Servo-controlled rotating half-doorFigure 5: 3D Printed Payload
ENGINEERING | 69

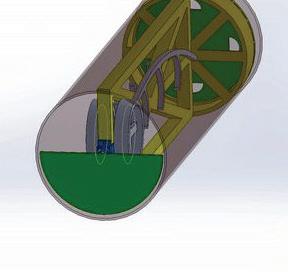


Figure 9: Payload Electrical Block Diagram
False altitude data will be given on a .csv file to use to simulate actual altitude during mission time.
The file sent through MQTT to the judges will be in .csv format. This year’s competition will be held virtually, therefore the judges will be viewing the CanSat launch online in real time. Because the launch day is virtual, sim ulated data will be sent to the containers and payloads.
During flight, the data will be sent from the payloads to the container and from the container to ground station.
The GUI will show all the sensor data being received from the container and payloads. For competition judging, all data received will be sent to the judges using a online broker called MQTT.
The payloads will be sending temperature, altitude and rotation rate to the container via XBee and the container will be sending temperature, GPS location, altitude and battery voltage to ground station. As the data is being transmitted it will also be saved to a SD card as back up.
Figure 7: Ground Control Station set up 70 | Pueo o Kū: Journal of Science, Technology, Engineering, and Mathematics
A Graphical User Interface (GUI) will also be created to provide a user friendly experience for the ground station.
Figure 8: Container Electrical Block Diagram


Results Although assembly of the container and payload are not complete, some of the tests conducted were substantial to the development of the CanSat. The preliminary design review (PDR) has been completed. It is a draft of the considered materials, components, and structures for our CanSat. The descent control and majority of the elec trical components have been tested and have returned desired results. The descent of the payload and container has been calculated and tested. The microcontrollers, temperature sensor, GPS, pressure sensor, rotation rate sensor, and XBee radio have all been tested. The contain er and payload structures have been finalized.
Figure 10: Parachute Diameter Figure 11: Container Overview
Conclusion All design and component decision making processes have been completed (Figure 10). The next phase is to combine all components into a physical model and begin environmental testing. A majority of the physical struc tures have been completed (Figure 11). The main remain ing components are the electrical sensors and release mechanism testing. After the electrical and mechanical components are mated there will be a zoom call with the judges to do a live demonstration of the CANSAT in operation. This zoom call will include a simulated release, a simulated payload descent, and a simulated container descent. If the competition had been in person, teams would have traveled to Virginia to do an actual rocket launch and recovery. After the zoom demonstrations there will be a post flight review. This will compare the theoretical operation of systems and the actual operation of systems. The applications of this research competition stretch to many fields, including but not limited to me chanical engineering, computer science, and aeronautics. Many other engineering competitions follow a similar overall Applyingapproach.theconcepts learned in school to a more real world scenario is helpful in the retention and understand ing of those concepts. Once the final demonstration is over the 2021 CANSAT competition will be over. The experience of CANSAT has been invaluable for future research projects and has laid the foundations for ev ery group member to be successful in future research groups.
Acknowledgements Dr. Aaron Hanai, Jacob Tyler, Joshua Faumuina, Li-Anne Delavega, Kalei Galarita, Bridge to the Baccalaureate: Strategic Transfer Alliance for Minority Participation (B2B), Pre-Engineering Education Collaborative II Grant (PEEC II), American Astronomical Society (AAS), The National Aero nautics and Space Administration (NASA) Container 27.37 cm
ENGINEERING | 71
PAYLOADPost-SeparationPre-separation


Improving the Understanding of Energy Conservation in Hawai‘i’s Community
Methods Participants will employ two 100W solar panels connect ed to a battery charge controller (20A Binen) and a 12V lead-acid battery (Battery Max ML15-12). As shown in Figure 2, a 15A battery monitoring device will also be used to measure the power produced, and an invert er (Bestek 300W) will convert the DC (direct current) electricity to AC (alternating current) electricity that the student’s electronics may use for power and charging.
A Raspberry Pi with attached camera takes pictures of the battery monitor once per hour. These pictures taken by the Pi camera will then be used to record all of the voltage and amperage readings for solar system power production data table.
Figure 1: Current utility projects on the Island of Oahu where solar and other types of alter native energy is being used to produce electricity with the purpose of meeting Hawai’i 2045 Clean Energy Goals. [3] About This research started out in the National Science Foundation funded Pre-Engineering Education Collaborative where Native Hawaiian and underserved students worked on solar energy projects in a summer bridge program. Developing her project further, she presented this project at the virtual national 2020 Society for Advancing Chicanos/Hispanic & Native Americans in Science (SACNAS) Conference.
Purpose The purpose of this research is to engage college student participants in a renewable energy-based project in order to enhance knowledge of energy conservation through greater understanding of solar energy production. Under standing energy usage and energy production through sustainable means will be a significant part of supporting Hawai‘i’s Clean Energy initiative.
72 | Pueo o Kū: Journal of Science, Technology, Engineering, and Mathematics
Introduction Hawai‘i is setting the pace for renewable energy and sustainability in the US. Renewable energy generation in Hawai‘i stood at only 27.6% in 2017 according to the Hawai‘i State Energy office [1]. By 2045 however, the state of Hawai‘i plans to generate 100% of its electricity solely using renewable sources [2] under the Hawai’i Clean Energy Initiative. To make this goal a reality, the state of Hawaii has started to deploy energy farms across the islands using different alternative energy technologies. Figure 1 [3] shows the current status of alternative energy production on the island of Oahu. For Hawaii residents to be a part of meeting Hawai’i’s clean energy goals, it is important to first understand energy generation and usage, so they can reduce their personal energy consumption and be better equipped to support the state’s goals.
Nikki Arakawa Faculty Advisor: Hervé Collin, Ph.D. Kapi‘olani Community College
Objectives To design a solar battery system that students can use to gather real production data and to help them understand how solar energy is generated, converted and stored.
• Monitor the amount of time it takes to charge their
• Estimate how much time and solar panels it would take to power their own house A list of basic household appliance and their average energy consumption will be used to represent the power needs of the student in a normal day. Student will then take what they are given and will be asked to design their own solar power system to support their home. Follow up questions about reasoning and feasibility will also be a part of this final portion.
Figure 4: Battery monitoring system Note. Battery monitoring system providing current, voltage and power readings. Cell (iPhonePhoneX) 24 hours Powered DeviceHow many hours used a day? 5W per 4 hours Requirements 0.379 0.255 Will it
ENGINEERING | 73
Students will priritize their electrical needs on a small scale by creating a list of priority electronics that the student uses daily. As an example, Table 1 shows the energy needs of an iPhone X [4] including how long the device is used everyday. This information will be used to estimate how much solar energy their system will need to produce.
Power
Table 1: Electrical need and prediction of power charge
*Will
• Learn about basic electricity concepts through power measurements and generating energy budgets
Participants will acquire physics knowledge of basic electrical concepts such as current, voltage, and power as well as their relationship (Figure 4).
Figure 2: Model Diagram of the system
12 perWatts2hours
Figure 3: physics laws and relationships Note. Current, voltage and power relationships
12.112.112.112.1(Volt)Voltage14:3013:3012:3011:30(24TimeHours)
Through the process of building and using the solar gen eration system, students will:
Usingdevicethemeasurements taken from their system, stu dents will be able to apply a linear prediction model to estimate the time it will takes to save enough energy to power their device as shown in Table 2.
**
(Full (Watt)PowerCharge) 3.08554.58593.29122.67410.2720.221(Amps)Current
• Learn about their own energy needs and usage habits
• Understand how solar generating power systems work Students will learn about the different com ponents of a solar powered battery system and the functions of each of its components: PV panel, con verter, battery, and inverter. Specifically, they will gain understanding of the function of an inverter and how it is selected based on the type of solar panel used, which in turn dictates the type of battery used.
notpossible**notnotcharge?*sufficientsufficientsufficient
Students will collect and record these electrical readings from the solar system battery monitor using the Rasp berry Pi equipped with a camera that will take a picture every 60 minutes (Figure 4). Students will extract the information to obtain a time-series of their data.
Table 2: Data used to estimate charging time the power produced by the system charge the device Will charge but very slowly (fast charge is 12W for 2 hrs Table 1)


Hawai’i’s clean energy initiative is ambitious but with education and community support this goal is possible. To understand our energy habits and work on changing these habits slowly would be a possible step to reducing energy usage and conserve energy in the future. Once students complete this project, they will be able to under stand how alternative energy production works, its depen dencies, and their electricity needs. For future iterations, as an extension of this project, I plan to add an auxiliary sensor system (Sense Hat) connected to the Raspberry Pi (Figure 1 Auxiliary Monitoring). This additional system will have environmental sensors that can further help students understand how environmental factors may affect solar energy production. Students will be able to observe how temperature, humidity and pressure may affect the overall performance of the system and in turn, observe how this affects their ability to produce energy.
Figure Visualization of power generation | Pueo o Kū: Journal of Science, Technology, Engineering, and Mathematics
3. “Hawaiian Electric.” 2019-2020 Sustainability Report - Page 2-3, 2019.
74
Reference 1. “Hawaii Energy Fact & Figures.” Hawaii State Energy Office, Hawaii State Energy Office, June 2018.
Figure 5 & 6: Full System & DC Energy System Note. Actual system to be built by participants
7:
Acknowledgements
Results
A prototype of the system has been built and tested as shown in Figure 5 and 6. An example of data visualiza tion students will be able to reproduce with their own system is shown in Figure 7. They will create a simple graph using a spreadsheet to monitor the power gener ated. Historical and current data will be used to make comparisons between daily energy production and daily energy needs.When measuring energy flowing in and out of the system using the battery monitor, the measure ments fluctuate day by day. The charge controller limits charging from the solar panels once the battery is full. In the case of figure 7, the battery was not used until it was completely discharged the night before, therefore once the system started charging the battery, charging from solar started to taper off early in the daytime once the battery became fully charged. Students could use the results of their measurements to further fine tune their understanding of their personal energy needs and further maximize on the energy available to them.
4. About Apple USB power adapters. (2020, September 17). Retrieved September 28, 2020, from https://support.apple.com/ en-us/HT210133
Mahalo nui loa to Herv Collin Ph.D. (Advisor), Li-Anne Delavega (Undergraduate Research Coordinator), Bridges to Baccalaureate Grant (LSAMP: NSF award HRD-1619702), Pre-Engineering Education Collaborative II (PEEC II: NSF Award HRD-1642042)) grant, The Society of Advancement for Chicanos/Hispanics and Native Americans in Science (SACNAS), and the Tribal Colleges and Universities Program (TCUP)
Conclusion and Future Research
2. “2019 Hawaii State Energy Office Annual Report.” Hawaii State Energy Office, Hawaii State Energy Office,December 2019.


Want to view the dashboard? Just scan the QR code on the left, or go to the follow https://public.tableau.link: com/profile/nina.pandya#! vizhome/KCCEnergy UsageProjectDashboards/Poster
INFORMATION & COMPUTER TECHNOLOGY | 75
Currently, Kapi‘olani Community College is provided with energy usage data in 5-minute increments for each build ing on campus. This data is presented to the college in .csv files which are not intuitive to students, faculty, and administration. This project explores how we can use the data provided to us to create an easier way of interpreting the data.
Solution Data visualization is a way of representing information graphically in an easy-tounderstand way. Charts and graphs are used to create a visual representation of a spreadsheet of raw data. By creating charts and graphs, we can easily find patterns and trends in the data and use it to compare it with another set of data. In this project, Tableau, a data visualization tool, was used to create multiple charts and graphs with the energy usage data provided to the college. These charts and graphs allow us to compare different buildings across campus over the different months. These graphs are then compiled into a dashboard which can be shared with the community.
Analyzing Energy Usage in Kapi‘olani Community College Campus Buildings Nina Pandya Faculty Advisor: Lisa Miller, M.S. Kapi‘olani Community College
BuildingLamaKopikoKokioKoaKauilaKaliaIlimaIliahiAlani Name 10/1/20 0:00 10/1/20 0:05 10/1/20 0:10 10/1/20 0:15 10/1/20 0:20 10/1/20 0:25 10/1/20 0:30 10/1/20 0:35 10/1/20 0:40 10/1/20 0:45 Time December97.646402927.516241914.83592399.5255543135.848174719.8453642127.45126532.48808513.062495772019 Alani0.40.30.30.30.30.30.30.30.30.3 20.720.220.3 20.8 21.2 23.824.6 Iliahi2423.524.2 9396.193 110.5112.1 108.99892.279.7 Ilima110 3.93.83.8 4.34.14.2 3.83.9 Kalia4.14 21.4 23.619.1 2021.1 1922.820.6 21.4 19.7 Kauila 5.1 4.94.9 Koa555.155.15.15 Spreadsheets This is an example of part of a spreadsheet provided to us by Johnson Controls each month. From the spread sheet, averages and totals are calculated for each building. These calculations are imported into a second spreadsheet (either average or total) which is then im ported into Tableau. About How can KapCC reduce its energy consumption? This SCI 295 CS student created an interactive map where you can see how much energy is used in each building and track trends over time so administrators can make informed energy decisions. Student Eva Morales built on Nina’s project to create an updated dashboard, which you can see at https://kcc-energy-usage.herokuapp.com/. You can check out her poster here: http://go.hawaii.edu/xin.
Introduction In the past decade, the topic of climate change and ener gy saving has become so important in how we move for ward as a nation and as a world. In efforts to help reduce the environmental footprints of our community colleges, four community colleges (Honolulu CC, Kapi‘olani CC, Leeward CC, and Windward CC) entered a contract with Johnson Controls, Inc. (JCI) beginning in January 2011. This project aims to save 20.8% of electric energy and 29.6% of water/sewer energy for Kapi‘olani CC.

Importing to Tableau and Creating Visualizations
Based on the data, different visualizations can be created, which is shown in Tableau Desktop when in a worksheet. Creating a map in Tableau requires you to import a geocoding which matches the locations with a specific Latitude and Longitude if the locations are not known cities. The worksheets can then be put into dashboards and uploaded to Tableau Public for public viewing.
76 | Pueo o Kū: Journal of Science, Technology, Engineering, and Mathematics
After the spreadsheets are created and imported into Tableau, they are used to create visualizations of any type.


INFORMATION & COMPUTER TECHNOLOGY | 77
Acknowledgements I would like to acknowledge Professor Lisa Miller for her ded ication and support during this project. It is with her expertise that this project was possible. I met weekly with her and she was able to provide me with advice and suggestions for my project and communicate with Johnson Controls for the data.
Conclusion Through creating the KCC Map and charts for average and total energy, we were able to see which building uses the most energy or the least energy, as well as the month with the highest energy usage. As a result of COVID-19, many of our buildings were not being used for classes from March 2020 to the end of the Spring 2020 semester. This is shown clearly by a dip in the data between April 2020 and May 2020. The data seen in the middle of the two charts is taken from the total kWh energy consump tion between December 2019 and October 2020. Note: July 2020 is missing in all graphs due to a malfunction in the data received from Johnson Controls. Through looking at the visualizations, it is noticeable that the energy usage in Lama, our library has decreased significantly from December 2019. It may be interesting to look at why Ilima’s energy usage has increased and is higher than before the first lockdown occurred. Currently, there is no data for Manono as it is being renovated. Therefore, it appears as if no energy is being used. This project can be continued with further exploration into how we can reduce the energy usage in the buildings using the most energy. Other visualizations can be cre ated to analyze the data differently. We can also explore a way to connect real-time data so that the dashboard is always upto-date.

Figure 1
Jatin Pandya & Tianhui Zhou Faculty Advisor: Lisa Miller, M.S. Kapi‘olani Community College
Optimizing NP Complete Timetable Algorithm Using Parallelization and Cost Clean Up
Introduction The problem that we are trying to solve in this project is to take the automated Timetable Algorithm project we worked on last semester then apply different methods to optimize the cost. The Timetable algorithm being an NP Complete as the solution requires an ex ponential solution rather than a polynomial solution[5]. and then add parallelization to optimize the time the Al gorithm would run for from there then running it on a Beowulf Raspberry PI cluster[4].
The solution for optimizing the cost was to implement the Simulated Annealing algorithm with our Cost func tion. Our solution for parallelizing the algorithm was to use a package in C++ called MPI (Message Passing In terface) to allow for multiprocessor programming. (See Figure 1) Methods For Optimizing cost: We implement Simulated Annealing algorithm to simulate the process of how we arrange a schedule. The significant idea is adding probability to handle “Bad move” that being able to accept bad moves is important because sometimes we need to sacrifice partial benefit to reach the best solution in the big picture. For parallelization we read [3] to get the method for the parallelization of the algorithm. In [3] they wrote in the conclusion for the algorithm that doing synchronization locks may not have been necessary on the time. So our plan was to implement the algorithm by selecting the course, rows, columns, time, and location of the class and moving it around in the timetable on several nodes. And instead of locking it we would let it be and work it out with a duplicate checker. (See Figure 2) About These students set out to help automate how KapCC schedules our courses in order to efficiently use the limited number of classrooms on campus in this SCI 295 CS project. They used low cost and easily accessible parts to create this system.
78 | Pueo o Kū: Journal of Science, Technology, Engineering, and Mathematics


Conclusion Overall we automated the process of a single processor of creating a timetable for classrooms by using Simulat ed Annealing Algorithm and was able to parallelize the software using MPI. In the future what could be done is to create a user friendly GUI so when users use the algorithm it looks cleaner to run. Additionally, improving the way MPI transfers data between nodes could be op timized to help exit MPI gracefully.
Acknowledgements Lisa Miller KCC Maths and Sciences Department Kapiolani Community College References (IEEE) 1. SIMD Computers. 2020. 2. The fork-join nature of the TBB parallel algorithms. 2019.
4. J.Keipert, “Creating a Raspberry Pi-Based Beowulf Clus ter”, 2013 5. S. Abdullah and H. Turabieh, “Generating University Course Timetable Using Genetic Algorithms and Local Search,” 2008 Third International Conference on Convergence and Hybrid Information Technology, 2008. Figure 2 Results We randomly pick up 100 courses from actual KCC data for our testing data set, which contains 100 individual courses and 44 professors. We assume we have 7 avail able time periods and 16 valid rooms for the sample space. We successfully make the schedule for testing data set by implementing our program. For parallelization we are still adapting the code to run efficiently.
Sequential
3. D. Abramson, “Constructing School Timetables Using Simulated Annealing: Sequential and Parallel Algorithms,” Management Science, vol. 37, no. 1, pp. 98–113, 1991.
Parallelized INFORMATION & COMPUTER TECHNOLOGY | 79


Objectives
Table 1: Smoking History of COPD Participants Between Articles and My Survey About
This research is aimed to see how COPD contributes to cognitive impairment. In addition, this research was done by testing a working memory on COPD vs Healthy Individuals. By doing this, I was able to compare the re sults of a COPD and a healthy individual and see how these results could help link the cognitive impairment of a COPD person.
Kate Baoit Faculty Advisor: Jung Eun Kim, Ph.D., RRT, RPFT Kapi‘olani Community College
Introduction Chronic Obstructive Disease or COPD, is a chronic in flammatory lung disease that causes obstructed airflow in the lungs. COPD is the 4th leading cause of death and 3rd most common cause of disability. COPD can affect you by lowering oxygen supply in the brain. Decreased levels of oxygen cause brain which contributes to cogni tive impairment. Therefore, it is necessary to understand the pathophysiology of COPD that plays a role as a risk factor for cognitive impairment and other cognitive dis orders. In these studies, COPD and cognitive impairment: the role of hypoxemia and oxygen therapy and Cognitive performance in patients with COPD, indicates that the contribution of COPD to cognitive impairment comes with other risk factors and consequences.
How COPD Contributes to Cognitive Impairment
80 | Pueo o Kū: Journal of Science, Technology, Engineering, and Mathematics
This poster was completed in RESP 201, which asks health science students to present every Fall at the bi-annual Student Undergraduate Research Fair on topics ranging from asthma, vaping, air pollution, diet, and more.
Methods A comprehensive literature search was performed in on line databases, using google scholar and typing “COPD” and ”cognitive impairment.” Then, a survey and a test was introduced and asked to different individuals with a mixture of COPD and healthy individuals to see a glimpse of their cognitive function. Tables and graphs were cre ated to note and to be able to compare the results from different literature articles and my own survey of when I compared the working memory of a COPD and healthy individual. Survey Results

Table
HEALTH SCIENCES | 81
Results Smoking, as shown in Table 1, is one of the biggest factors of COPD. When an individual is diagnosed with COPD, it increases cognitive impairment which hinders them from doing daily activities which could result into poor oxygenation. Age, as shown in Figure 1, plays an important role in COPD and cognitive impairment as one’s cognitive declines as they age. Use of oxygen, shown in Figure 2, plays an important role for an individual with COPD as it is harder for their lung to recoil, which makes it more difficult to exhale. This causes the heart to work harder, whilst the use of oxygenation could prolong life and prevent poor oxygenation or hypoxia. COPD and cog nitive impairment individuals, shown in Table 2, shows significant relation as testing working memory was ex ercised to test the cognitive function of one. Therefore, as compared to healthy individuals, cognitive impairment in persons with COPD is increased.
Significance
Conclusion COPD and Dementia are both progressive. The correla tion is connected as COPD increases an individual’s cog nitive impairment, like Dementia, Alzheimer's. Therefore, decrease in pulmonary function along with lifestyle choic es impacting respiratory status affects the metabolic processes of the brain causing secondary dementia or vascular dementia.
Figure 1. Average Age of COPD participants Between Articles and My Survey Figure 2.
Cigarette smoking is a choice that can be avoided to prevent various diseases like COPD. With the contribution that COPD delivers to the brain it is important to keep in mind how it affects our body and our future. These results could be helpful for anyone to prevent COPD it self and to help an individual’s choices of health be finer and wiser. Amount of people using Oxygen 2. Testing Working Memory on COPD vs Healthy Individuals.


Introduction Asian and Pacific Islander (API) populations tend to be categorized together in statistic data in the United States despite vast differences between the two groups regard ing health-related issues. Due to the small size of the Native Hawaiian and Pacific Islander (NHOPI) popula tion in the US, the API grouping dilutes data, thus issues unique to NHOPI populations can be overlooked if the larger Asian population is less affected by them. Asthma is among the diseases which disproportionately affects NHOPI populations. The prevalence of asthma is tied to certain risk factors, among those noted are exposure to tobacco smoke and body weight. In addition to risk factor exposure there is a correlation between socioeconomic status, healthcare access, and asthma prevalence as well. Methods The Center for Disease Control and Prevention’s Behav ioral Risk Factor Surveillance System (BRFSS) conducts yearly surveys which provide uniquely separate data for Asian and NHOPI populations. Data sourced from the 2019 BRFSS surveys were filtered based on asthma occurrence, smoking status, body mass index, and so cioeconomic status on SAS Studio and compiled. Addi tional research was conducted through comprehensive literature searches of online databases.
Dylan U. Custodio Faculty Advisor: Jung Eun Kim, Ph.D., RRT, RPFT Kapi‘olani Community College
Differences in Asthma Prevalence and Risk Factor Exposure Among Asian and Native Hawaiian and Pacific Islander Populations
Objectives This study is aimed to display the differences between Asian and NHOPI populations regarding asthma and asthma risk factor prevalence based on recently gathered data (BRFSS 2019). The results may serve to provoke further investigations in the relationships between asth ma and demographics such as race and socioeconomic status and furthermore, the separation of Asians and Pacific Islanders in health statistic data. About The Respiratory Care Program teaches and trains students to care for patients with cardiovascular and pulmonary system disorders through an extensive 95-credits of coursework and laboratory training followed by hands-on ex perience in hospitals, labs, and home care sites.
82 | Pueo o Kū: Journal of Science, Technology, Engineering, and Mathematics
Significance
Figure 2: Lifetime smoking (having smoked at least 100 cigarettes within their life) and current smoking (smoking daily) prevalence of surveyed individuals by race
Data (Behavioral Risk Factor Surveillance System 2019)
The significant differences in the statistics displayed by the 2019 BRFSS surveys alone show that public health between Asians and Pacific Islanders must be approached differently and that the aggregation of the two groups into the API mixture can be harmful to the NHOP community. As both ethnic groups have a high number of immigrants among them, this is an interest ing dynamic and calls for further investigation in the social-public health of these two different communities within the United States.
Figure 3: Overweightness (BMI >25.00) and Obesity (BMI >30.00) prevalence of surveyed individuals by race
HEALTH SCIENCES | 83
Average annual income levels for surveyed NHOPI indi viduals was lower than that of Asian individuals. 28% of NHOPI making more than $75k and 19% of NHOPI mak ing less than $20k annually. In contrast, 35% of Asians made more than $75k and 11% made less than $20k annually. (Fig. 4) Conclusion The data collected from the 2019 BRFSS surveys show clearly that the surveyed NHOPI population suffers from asthma and asthma risk factors in greater prevalence than the general US average on all considered accounts. In contrast, the surveyed Asian population suffers less than the US average from asthma and its risk factors.
Figure 4: Annual income of surveyed individuals by race
Results On average, surveyed NHOPI individuals had greater prev alence of lifetime (19%) and current asthma (12%) (Fig. 1), propensity for smoking (14% smoking daily) (Fig. 2), and occurrence of body mass indexes of 25.00 or higher (74%) (Fig. 3) than the average of all surveyed individuals in the United States. In contrast, surveyed Asian individuals averaged below the total US average in prevalence of lifetime (11%) and current asthma (6%) (Fig. 1), propensity for smoking (5% smoking daily) (Fig. 2), and occurrence of overweight ness and obesity (45%) (Fig. 3).
Figure 1: Lifetime asthma (having ever been diagnosed with asthma in their life) and current asthma (current diagnosis) prevalence of surveyed individuals by race


Meeya O’Dell Biology University of Hawaiʻi at Mānoa Walters Computer Science University of Hawaiʻi at Mānoa
My name is Kiana Walters and I’m in my third year studying computer science. I hope to become a software engineer specializing in augment ed and virtual reality and hope to work in the medical field. As a minority student, KapCC STEM has made me feel welcomed and included. KapCC STEM has opened many doors of opportunities for me. Not only did I participate in different programs such as a National Science Foundation (NSF) funded Pre-Engineering Education Collaborative II (PEEC II) and the NASA CanSat 2021 competition, I also gained experience working with other students and faculty. Working with KapCC STEM and participating in the opportunities offered has separated me from other students in my field. The STEM Center has better prepared me for my future and allowed me to figure out what I want to do in my professional career. Hi, my name is Meeya O’Dell and I recently completed my Associate of Science in Natural Science (ASNS) in Biology from KapCC and transferred to University of Hawaiʻi Mānoa to complete my bachelor's degree in biolo gy. After graduating, I plan to enter a master’s program and a profession centered around my interests in conservation and animals, studying their behavior and their relationship to their environments. Many of my expe riences at KapCC have also been centered around these interests, such as participating in the Manu-o-Kū Project for the past three years with the guidance of Dr. Wendy Kuntz. I have also been working at the STEM Center for the past four years. I provided assistance on administrative tasks and worked at the front desk position before, but currently work as a Biology Peer Mentor with the guidance of Kalei Galarita. My experiences at KapCC were and are possible because of the support and guidance by professors, staff, and other STEM students. These experiences led to being a part of the student panel to peer review research posters for Pueo o Kū I am grateful for the opportunity to be a part of something that shows the research other students at KapCC have completed.
Peer Reviewer Kiana
Peer Reviewer 84 | Pueo o Kū: Journal of Science, Technology, Engineering, and Mathematics Pueo o Kū Staff


Joselito Macabante, Jr. Engineering University of Hawaiʻi at Mānoa Peer Reviewer
Serena Harris Biology Kapiʻolani Community College Peer Reviewer
Hello everyone! My name is Joselito Macabante and I am a junior at Uni versity of Hawaiʻi Mānoa pursuing a bachelor’s degree in mechanical engineering. I am deeply fascinated by the science that goes along with rockets and submarines, so I hope to one day pursue my work in either of those fields. My parents moved here before I was born, so I became the first of my family to go to college, and truthfully, I had no idea what I was doing. All I knew was that you had to go to college to get a degree. I was lost. Then, I came to KapCC. I began being an active member in the STEM department with summer projects, competitions, and eventually peer mentoring. I quickly fell in love with what I was doing, and I have all the thanks in the world to give to the professors and staff at KapCC STEM. I have learned many invaluable skills and lessons that I will take with me wherever I go. Since becoming a peer reviewer for Pueo o Kū, I have come to realize that I am not alone in this realization. Many of my peers have been introduced to so many wonderful opportunities, and I was amazed at the posters documenting the journey they went through. From these posters, I take away the knowledge that we can all do something amazing!
PUEO O KŪ STAFF | 85
Aloha! My name is Serena and I’m a second year biology student in the ASNS program at KapCC. I am also pursuing the Sustainability and Marine Options Program Certificates. I have been a peer mentor for STEM students in the Natural Hazards course for two semesters. I previously completed a bachelor’s degree in Spanish and master’s courses in Second Language Acquisition, but after realizing teaching languages wasn’t my dream career, I returned to school to eventually pursue a master’s degree in ecology and environmental policy. I have always wanted to study tropical reef systems and finally got the nerve to do so. I feel that by conserving and preserving resources and habitats and implementing community-driven policy, we can make the world more sustainable for people and our plant and animal neighbors. My experience at KapCC has provided research, internship, and volunteer opportunities that enrich my educational experience. I’m grateful to be a part of the KapCC STEM community and for the support it shows for students in their academic goals. Mackenzie Manning, Jacob Tyler, and Kalei Galarita have been instrumental in supporting my pursuits. The ex perience presenting at SURF has prepared me to share future scientific knowledge with peers and the community at large. I’m honored to have been a part of Pueo o Kū and enjoyed learning about current research happening in the varied STEM disciplines at KCC.


Tre Zamora New Media Arts Kapiʻolani Community College
Salutations! My name is Tre and I’m a New Media Arts major here at Ka piʻolani Community College. I come from an interesting background being that I have an associate's degree in Culinary Arts with a concentration in Pastry Arts, but I later discovered my true passion was a different form of art. This semester marks the end of my first year in the New Media Arts program. My future plan is to be well-versed in design so I can serve my community through the power of design. I currently help serve the community by being an active peer mentor for the Kapoʻoloku Program for Native Hawaiian Student Success. I love interacting with students. The gift of growing and learning together inspires me to be a better ver sion of myself. My first interaction with STEM came to me in the form of research; I participated in the very first Pāoa Research Program cohort back in Spring 2021. Later I found myself designing assets for the STEM program with Li-Anne Delavega and Kalei Galarita, and in that moment a new outlet for design and STEM was unlocked. My experience working on the cover art and journal layout has helped hone my skills in typography and illustration. It has also brought me closer to my Native Hawaiian culture through the utilization of Hawaiian design. Although my experience in STEM is limited, I have found a way to incor porate my experiences, culture, and major in design into STEM.
Cover Artist & Art Director 86 | Pueo o Kū: Journal of Science, Technology, Engineering, and Mathematics

