Economic impact analysis
DISTRICT 50 1
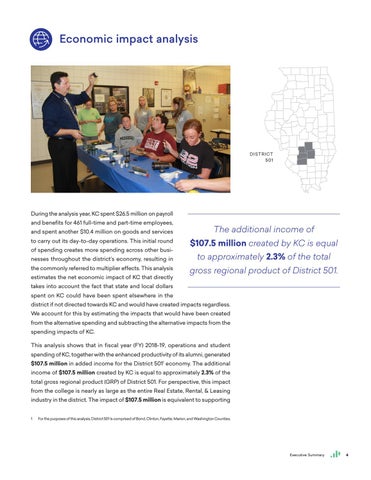
During the analysis year, KC spent $26.5 million on payroll and benefits for 461 full-time and part-time employees, and spent another $10.4 million on goods and services
The additional income of
to carry out its day-to-day operations. This initial round
$107.5 million created by KC is equal
of spending creates more spending across other businesses throughout the district’s economy, resulting in
to approximately 2.3% of the total
the commonly referred to multiplier effects. This analysis
gross regional product of District 501.
estimates the net economic impact of KC that directly takes into account the fact that state and local dollars spent on KC could have been spent elsewhere in the
district if not directed towards KC and would have created impacts regardless. We account for this by estimating the impacts that would have been created from the alternative spending and subtracting the alternative impacts from the spending impacts of KC. This analysis shows that in fiscal year (FY) 2018-19, operations and student spending of KC, together with the enhanced productivity of its alumni, generated $107.5 million in added income for the District 5011 economy. The additional income of $107.5 million created by KC is equal to approximately 2.3% of the total gross regional product (GRP) of District 501. For perspective, this impact from the college is nearly as large as the entire Real Estate, Rental, & Leasing industry in the district. The impact of $107.5 million is equivalent to supporting 1
For the purposes of this analysis, District 501 is comprised of Bond, Clinton, Fayette, Marion, and Washington Counties.
Executive Summary
4