PORTFOLIO
1
Kalei Valentine
2021-2023
Architecture Urban planning
2 3 SELECTED WORK SAMPLES 2022 2022 2022 2022 2022 2023 2022 2023 2023 2021 Against The Horizon WiFi Hotspots in Manhattan, NYC Rethinking Bim Computational urbanism Amal Consortium projects Architecture (Academic) Urban Planning (Academic) Architecture (Professional) 18 60 06 54 46 30 62 64 66 68 Redevelopment of Mkunguni Square Residential development in Queens, NYC Heat Vulnerability, NYC Land use: Parking spaces NYC Multi-criterion decision, Queens NYC
ACADEMIC ARCHITECTURE
Schematic Design Development Programming
Year : 2021-2023
Project : UON & GSAPP Academic projects
Applications : Revit, Rhino, Rhino inside, Grasshopper, Archicad, Lumion, Enscape, Adobe Illustrator, Adobe Photoshop, Adobe Indesign, Light room, AI
The projects displayed represent my academic projects during my time at the University of Nairobi where I completed a sixyear Bachelor of Architecture program and currently in my final year at Columbia University, Graduate School of Architecture, Planning and Preservation Pursuing a Master’s degree in Urban Planning.
4 5
01 RETHINKING BIM
BIM Workflow Parametric Zoning Programming Performance Real Estate Sustainability
Year : 2023
Project : Academic Project, GSAPP
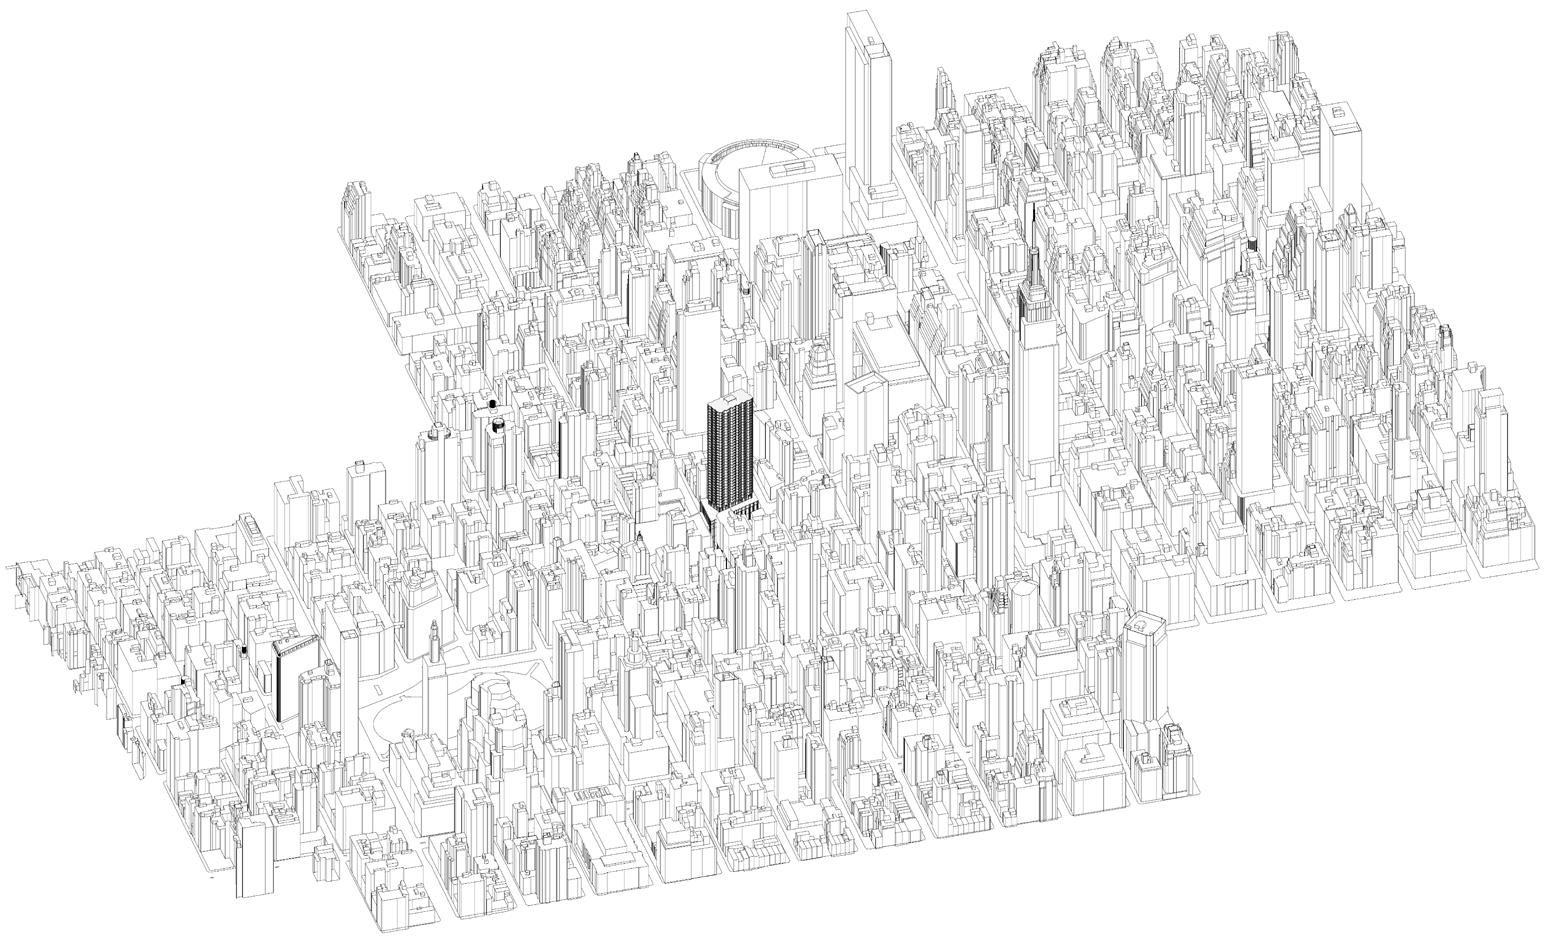
Site Location : New York City
Credit : Collaboration with Hudson Matz, Adam Lawrence and Yueyue Su
Role : 70%_ Design and Grasshopper scripting, Performance analysis, Revit drawings, Presentation Applications : Revit, BIM360, Rhino.inside. Revit, Grasshopper, Climate studio, Ladybug, Adobe Illustrator, photoshop, Indesign, Enscape
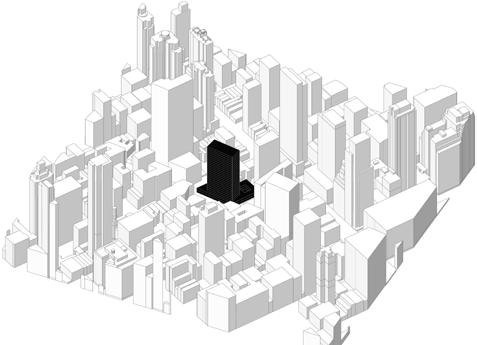
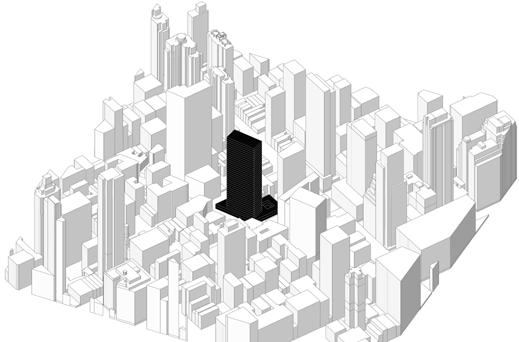
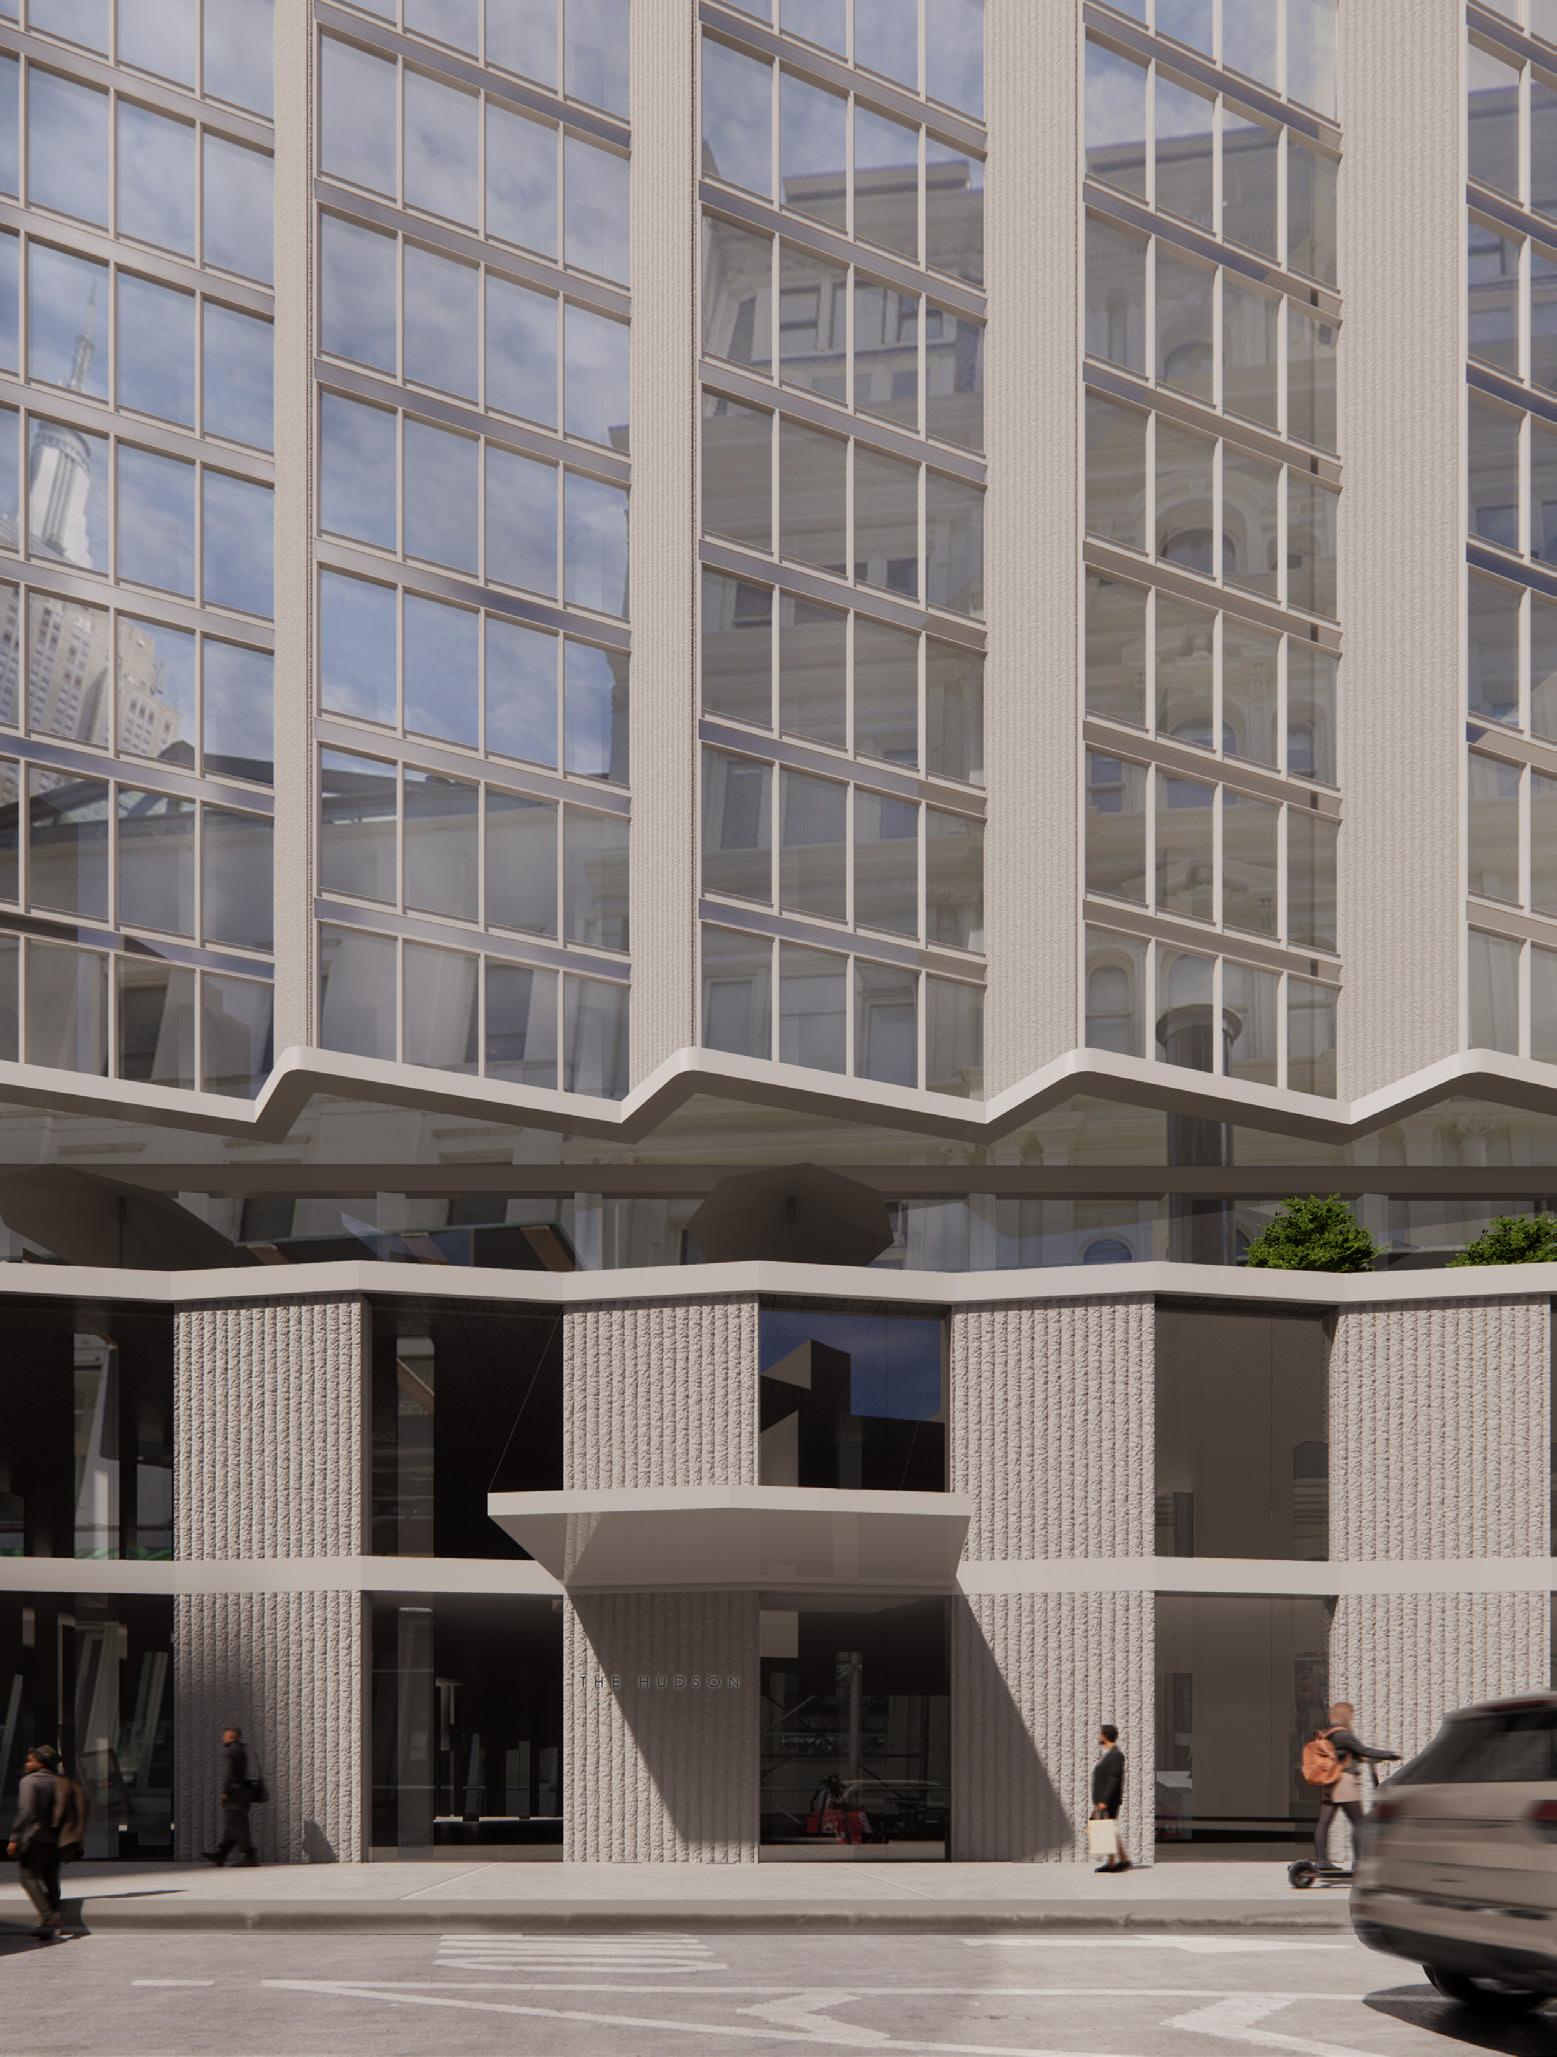
There are different interpretations of the term BIM, which stands for Building Information Modeling. Most people will tell you it equates to Revit. Others correlate it more closely with parametric design. Rethinking BIM challenges its participants to explore different methods of leveraging BIM to enhance all processes within our industry. One of the critical drivers of success is our ability to collaborate with other members of the development, architecture, engineering, and construction (DAEC) industry. Therefore,this project examines how these related disciplines function. Concurrently, the project will develop processes to understand different priorities better and exchange information more seamlessly. It will also take inspiration from outside the industry from tech and manufacturing. Finally, It will leverage drawing and diagramming to visualize and explain these collaborative processes. The goal of the class is to leverage new BIM processes to drive better-informed design, so all projects must develop a process that leads to a concrete design idea.
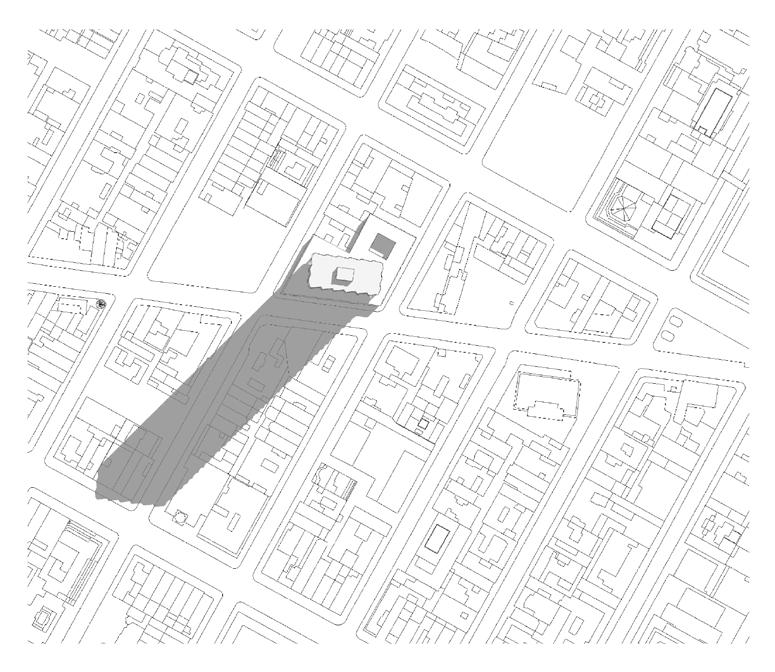
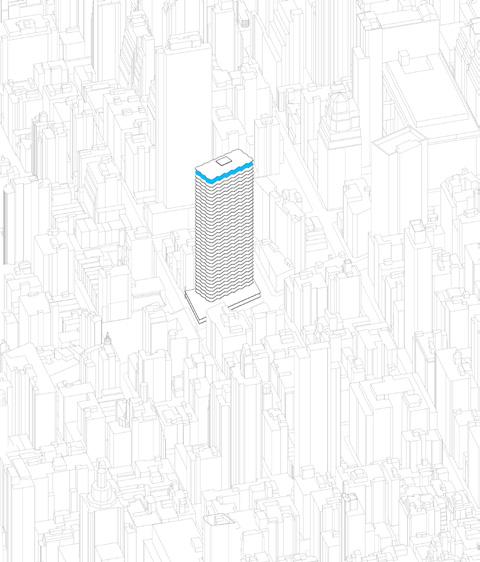
TAX LOT I BBL 1008310068
1227 Broadway, 10001
MANHATTAN
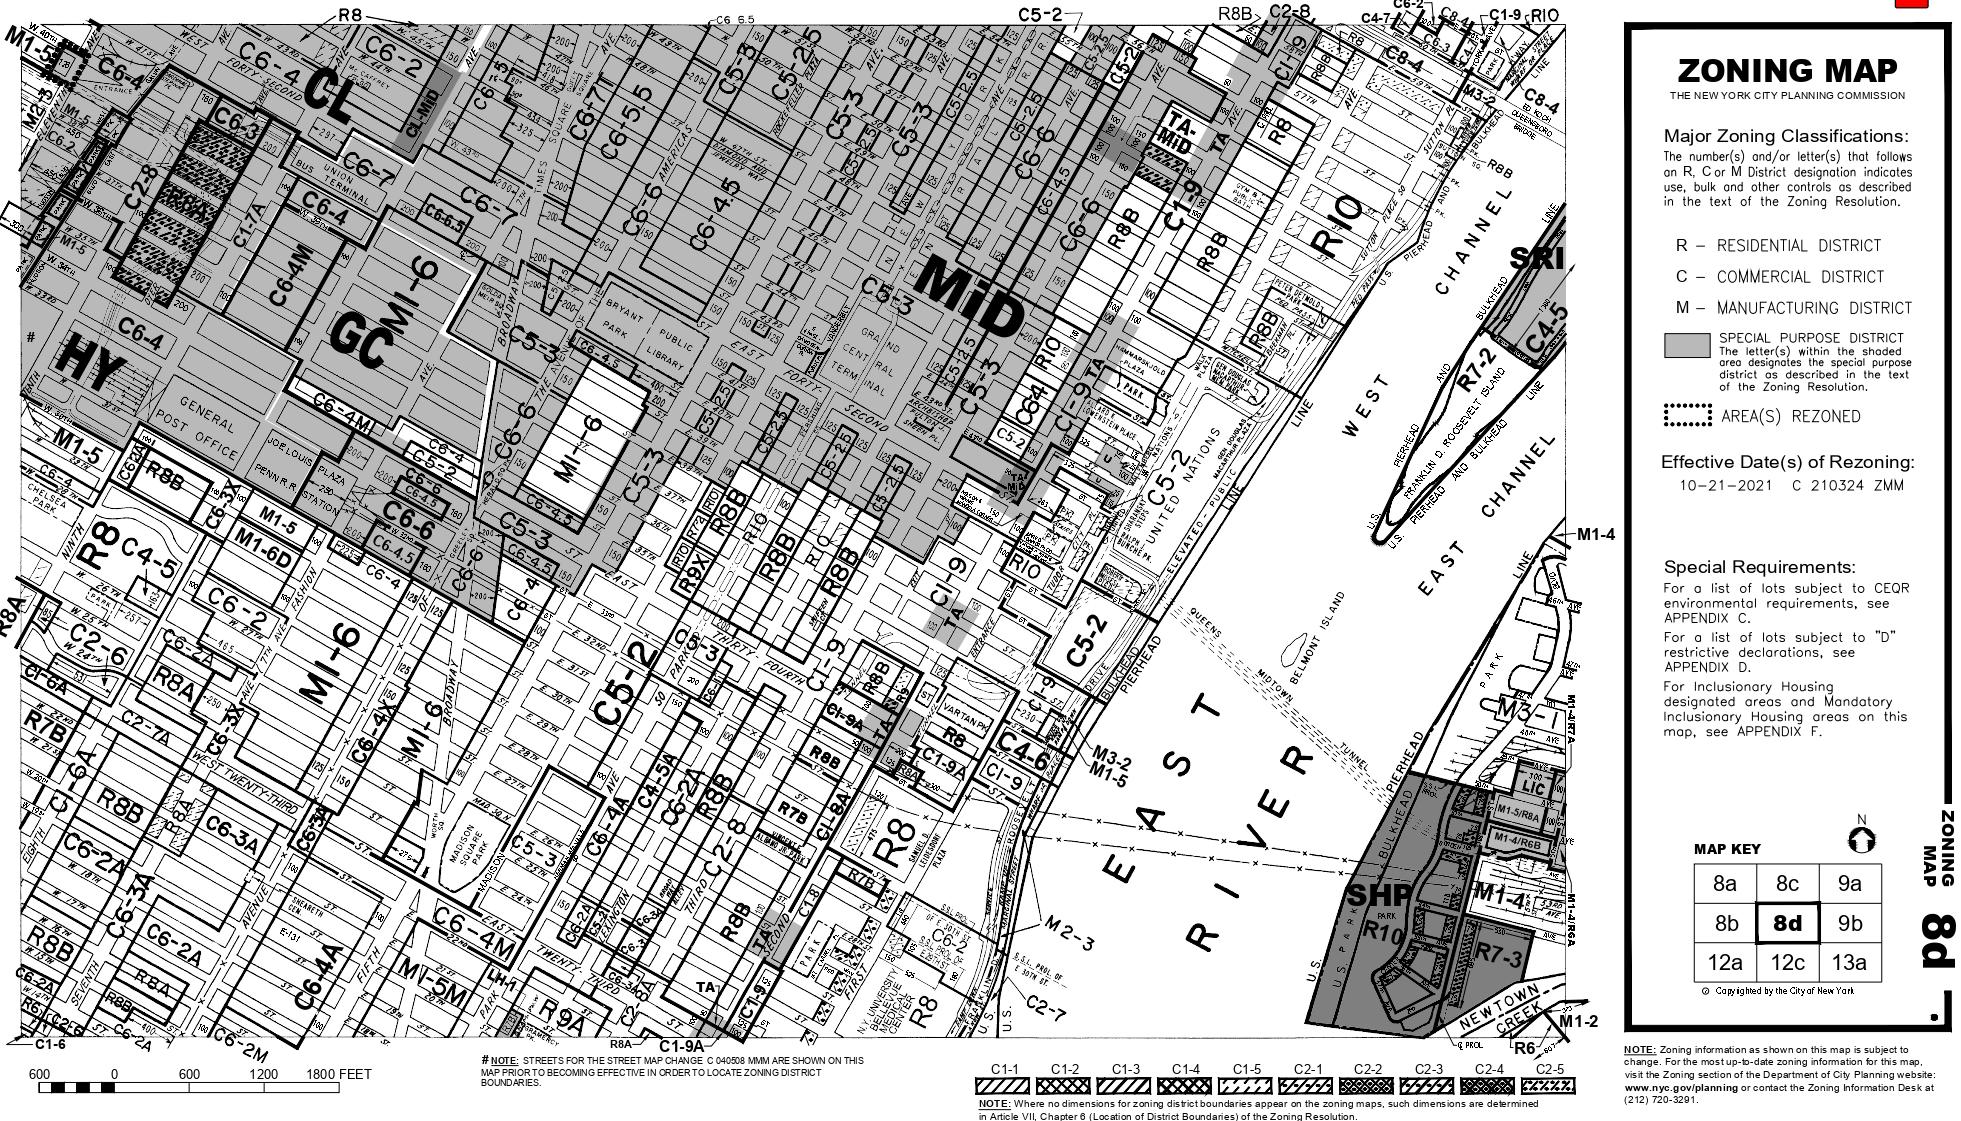
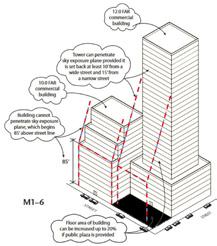
(BOROUGH 1) I BLOCK 831 I LOT 68 ZONING DISTRICT : M1 - 6
NOMAD is a neighborhood in transition. Situated to the north of Madison Square Park and to the east of Penn Station, it contains a mixture of retail and aging office spaces, but also some historic residences and hotels. There is an ongoing inititive to make the area more pedestrian friendly and encourage the growth of retail.
Assume your architecture firm has been hired by a developer who owns the lot listed in the site section. The developer has a vision for a mixed use project that caters to workers,tourists, and local residents through creative office/light manufacturing, retail, and a hotel component. However, they are relying on you to develop creative ways to work within this new revitalized district. Consider post-COVID patterns of work and travel.
Your task is to design an overall concept (program and massing) strategy that conforms to zoning. You must then develop your building further to schematic level, which includes facade design, floor plates, core location, basic structural framing/grids, staircases/circulation, and basic floor layouts. You must also present diagrams and data that prove you are conforming to all requirements, as well as a workflow diagrm that shows your parametric strategy.
Assume the developer is looking for assurance that your design meets all of their criteria and you can execute on the complex nature of the design. Your design must conform to all zoning and program requirements, unless a viable alternative is proposed and presented with a clear argument and backup data. Consider all existing pedestrian walkways and vehicular circulation. Pay special attention to the existing public plaza.
6 7
BRIEF
8 9
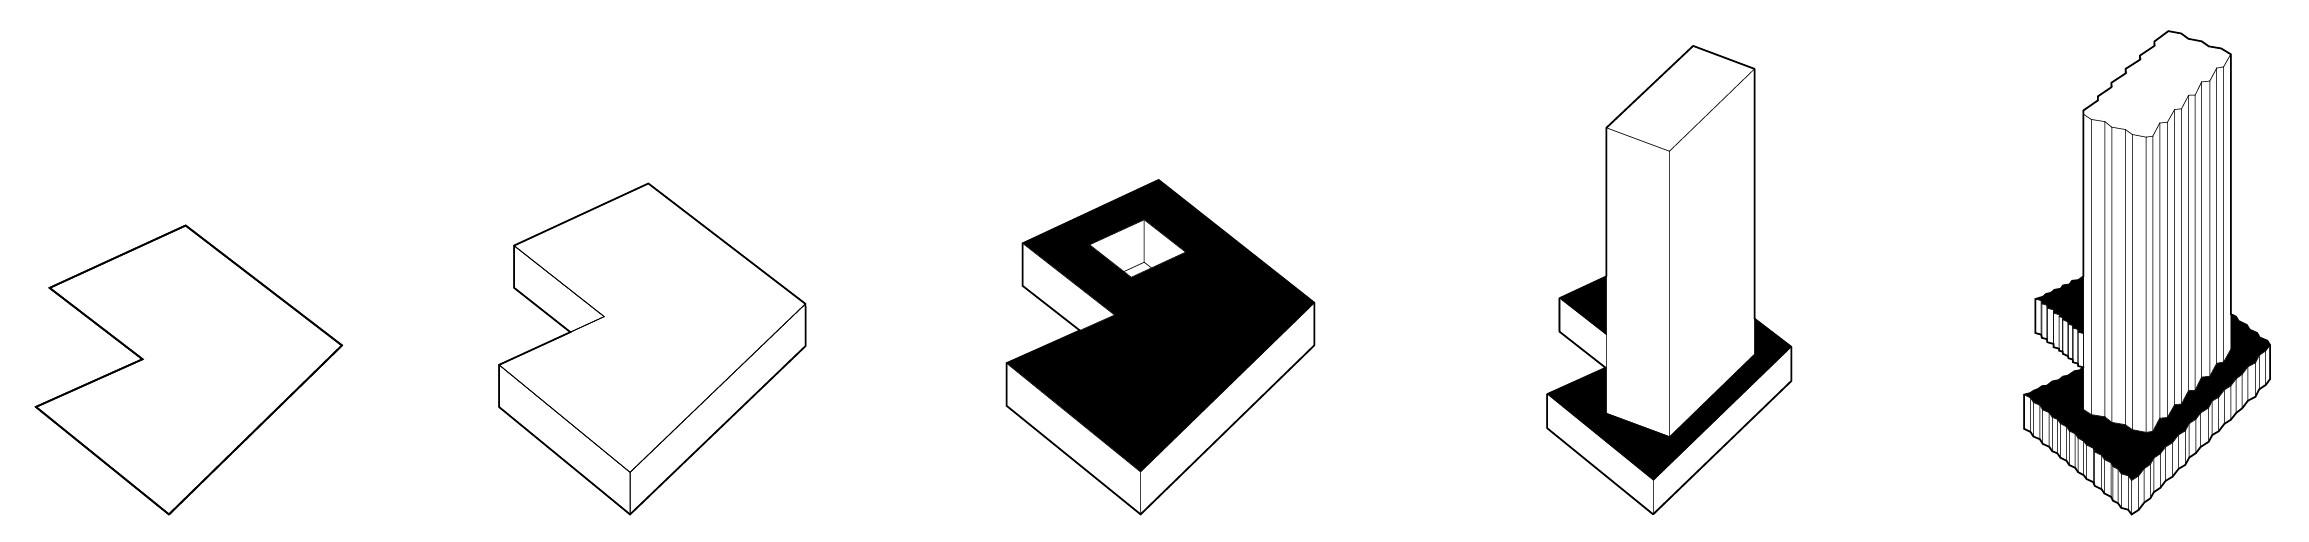
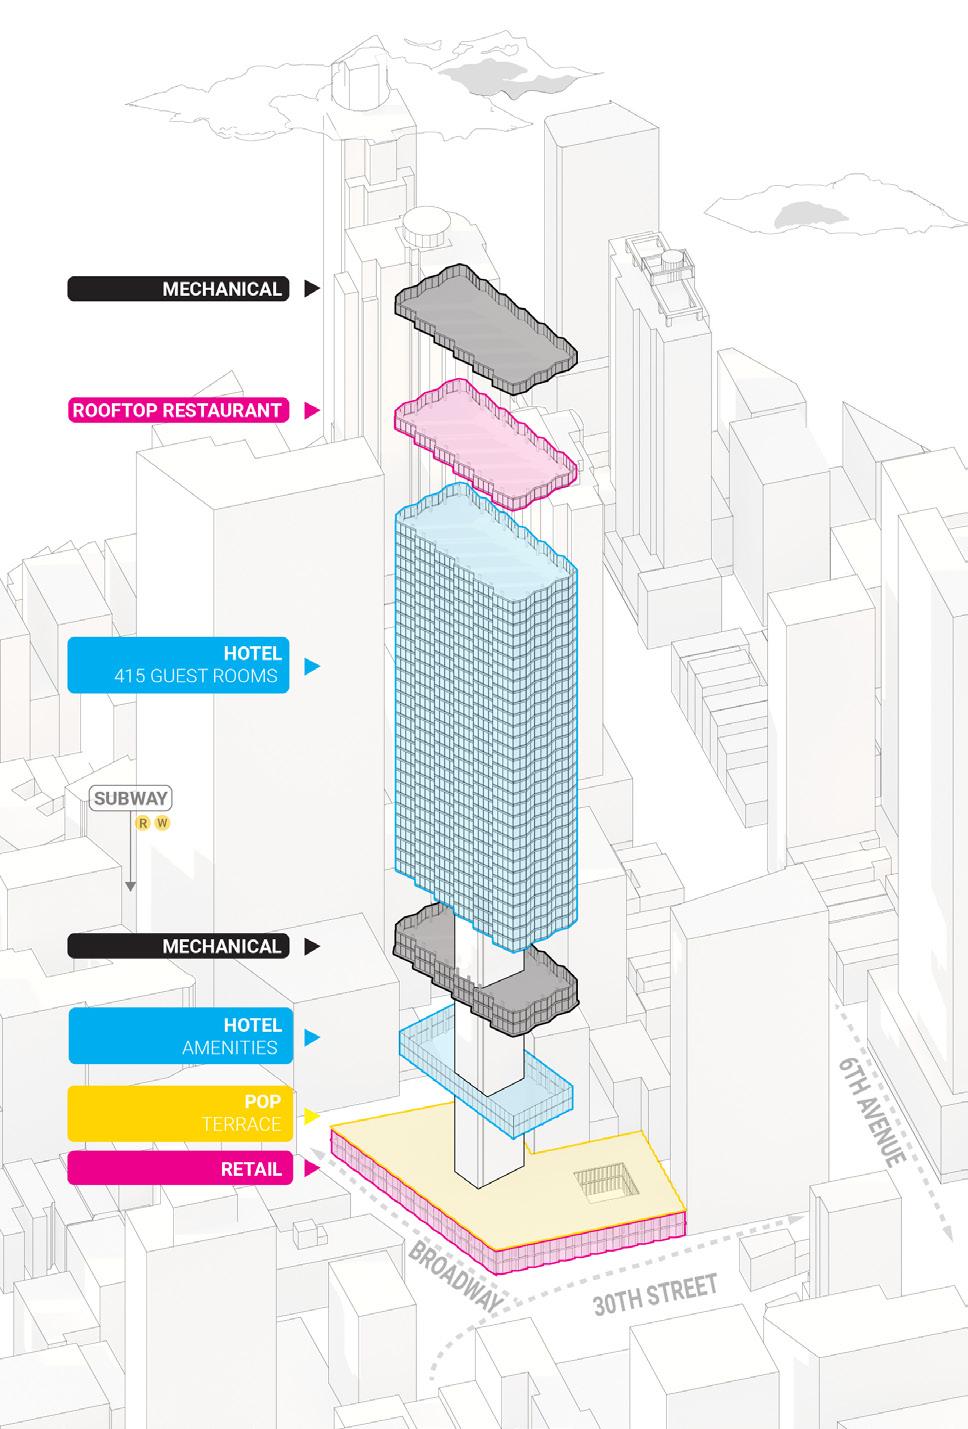
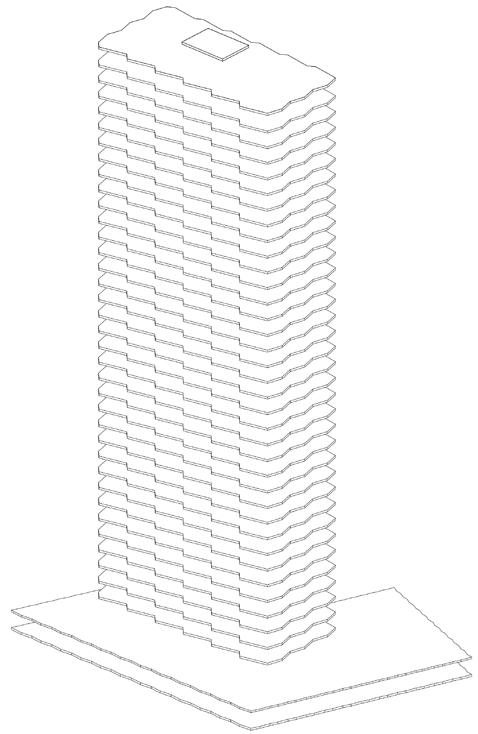
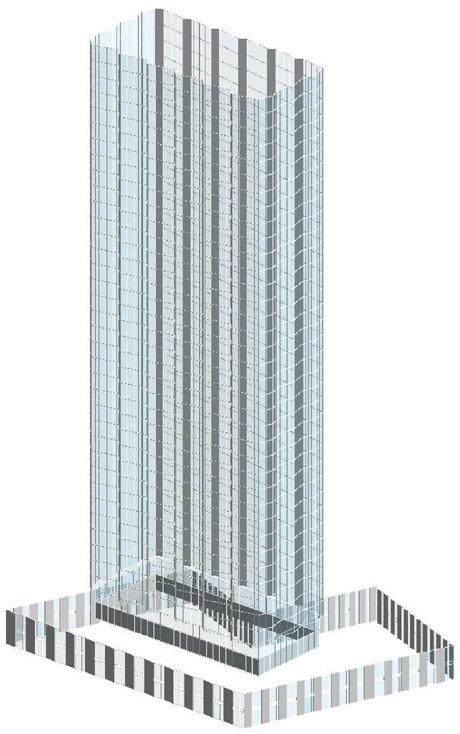
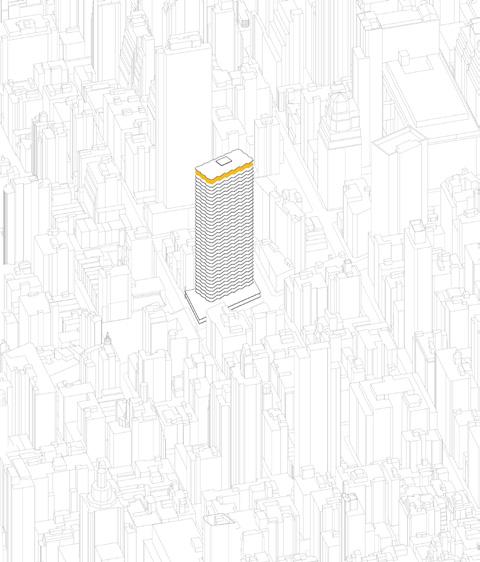
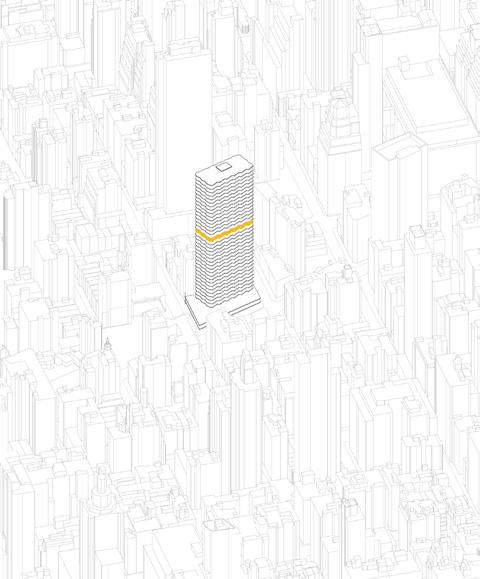
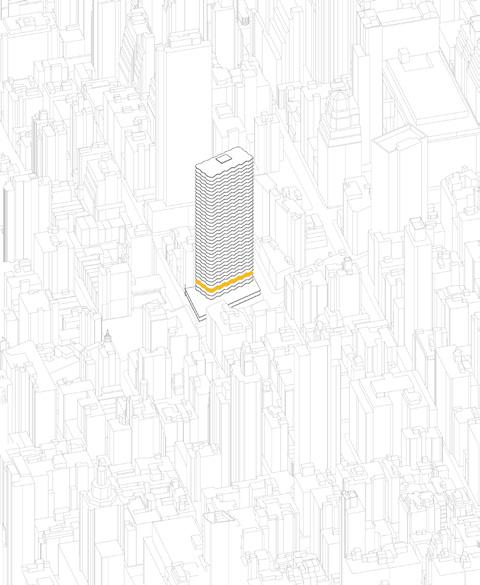
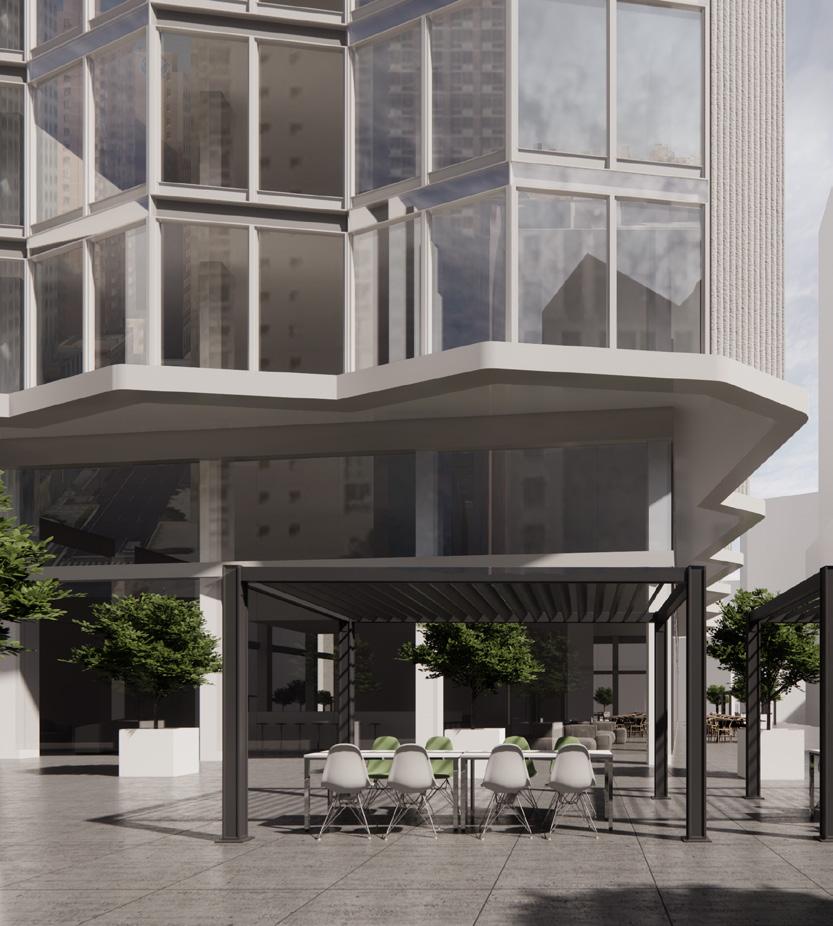
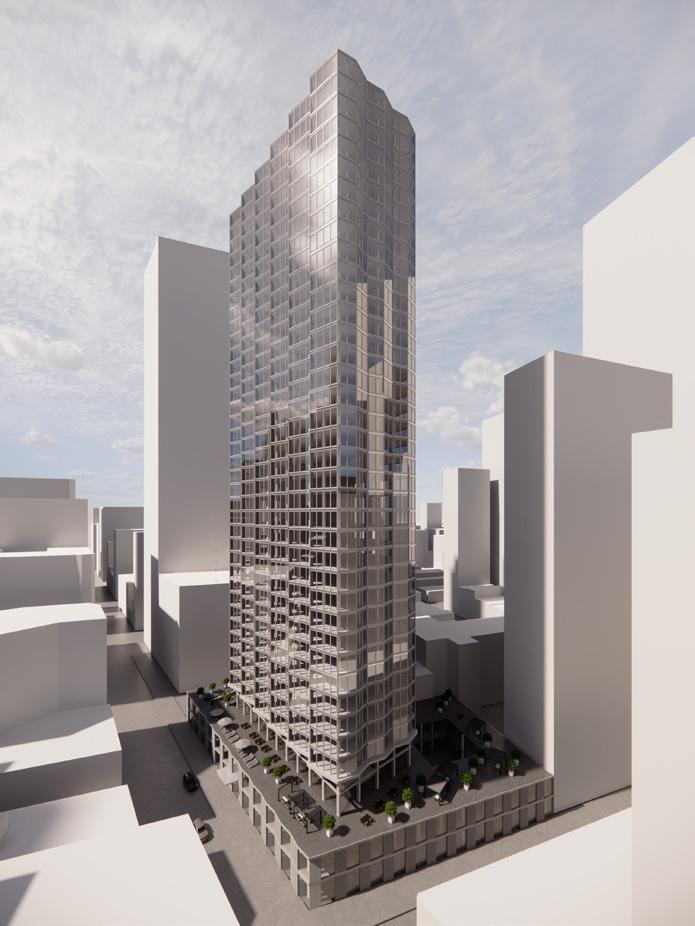
Permitted zoning Podium - Retail Podium - Retail Tower - Amenities Tower - Hotel Tower - Restaurant Tower - Hotel Lot Area Lot Area Permitted FAR Permitted ZFA POP Area Courtyard Pop bonus ratio 6 Total potential ZFA Ground floor level 1st floor level Gross floor area Typical floor height Gross floor area Typical Floor Height Gross floor area Typical floor height Gross floor area 29,990 sqft 29,990 sqft 10 299,900 sqft 18,340 sqft 1900 sqft 121,440 sqft 421,340 sqft 14ft 14ft 58,080 sqft 12ft 19,500sqft 12ft 321,750sqft 12ft 19,500sqft 29,990 sqft 59,990 sqft 234,000 sqft 10 14 ft 9750 sqft 12 ft 14 ft 299,900 sqft 2 Levels 2 Levels 2 Levels 33 Levels 2 Levels 24 Levels Permitted far Permitted Zfa Floor area Ground Floor Level 1st Floor Level Gross Floor Area Gross Floor Area Floor area Typical floor Height Proposed zoning 2023 Achitecture RETHINKING BIM Concept development Program Existing Site Lot Extrusion to create a two level podium Courtyard within the podium and green public space above the podium Extrusion to create the hotel and amenities tower Repetitive serrated facade on both the podium and tower for privacy and aesthetics
M1-6 District
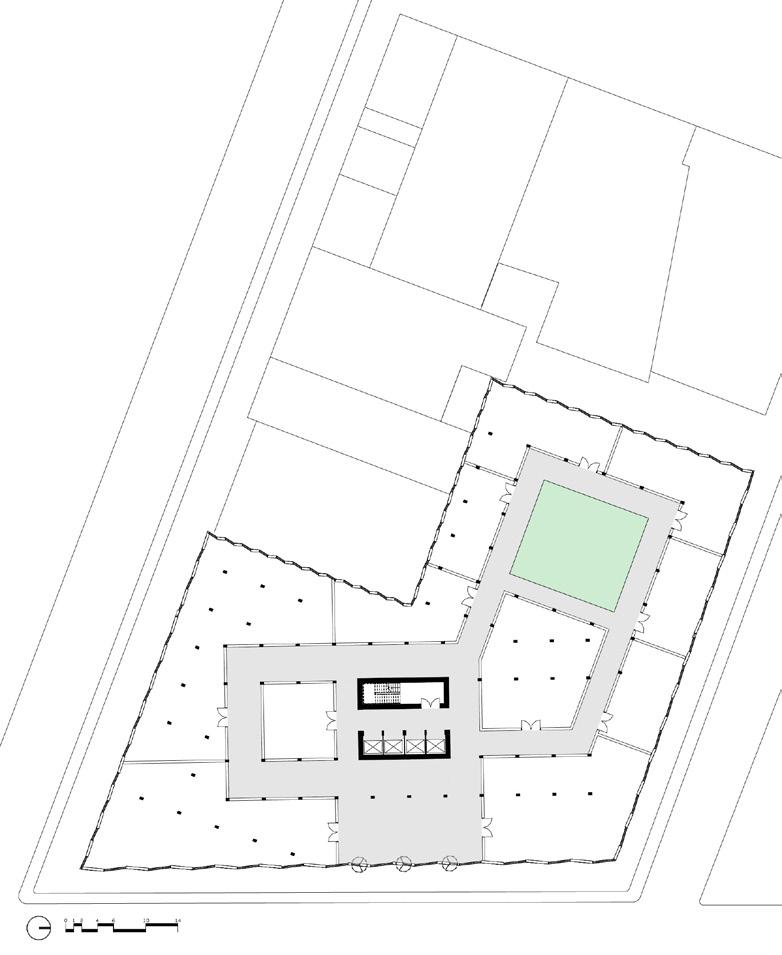
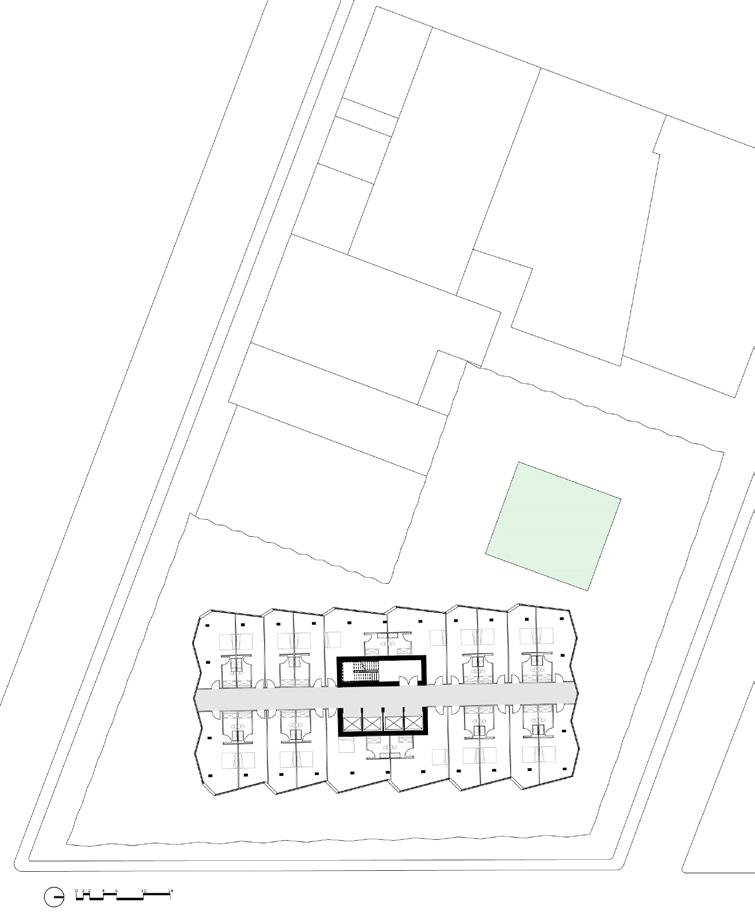
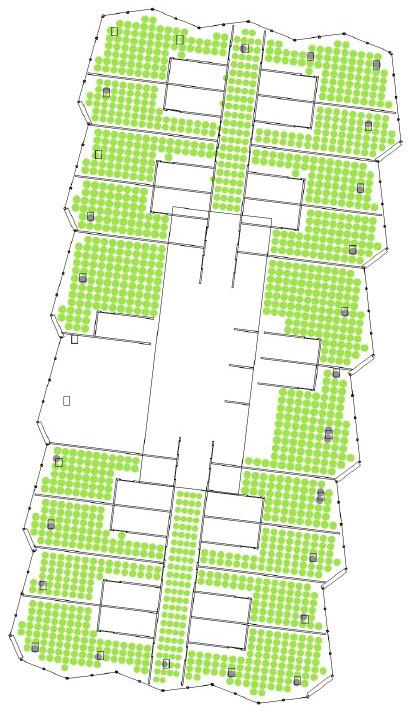
10 11 2023 Achitecture RETHINKING BIM Ground Floor plan Typical Hotel floor plan
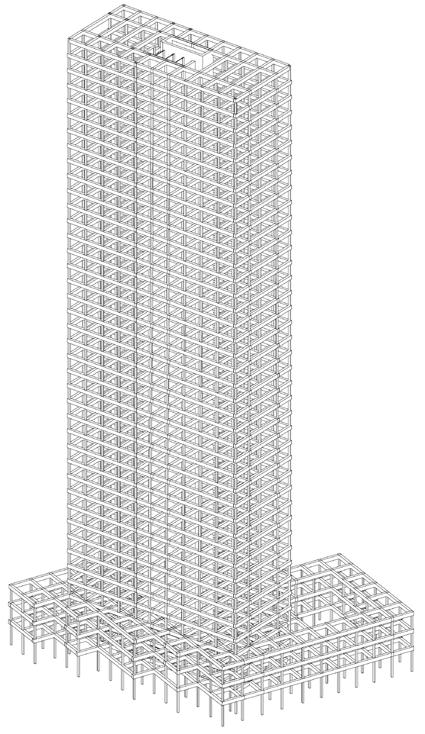
Slabs
Pre-cast concrete slabs
Structure Framed tube system
Facade Pleated facade design
Facade
12 13 2023 Achitecture RETHINKING BIM
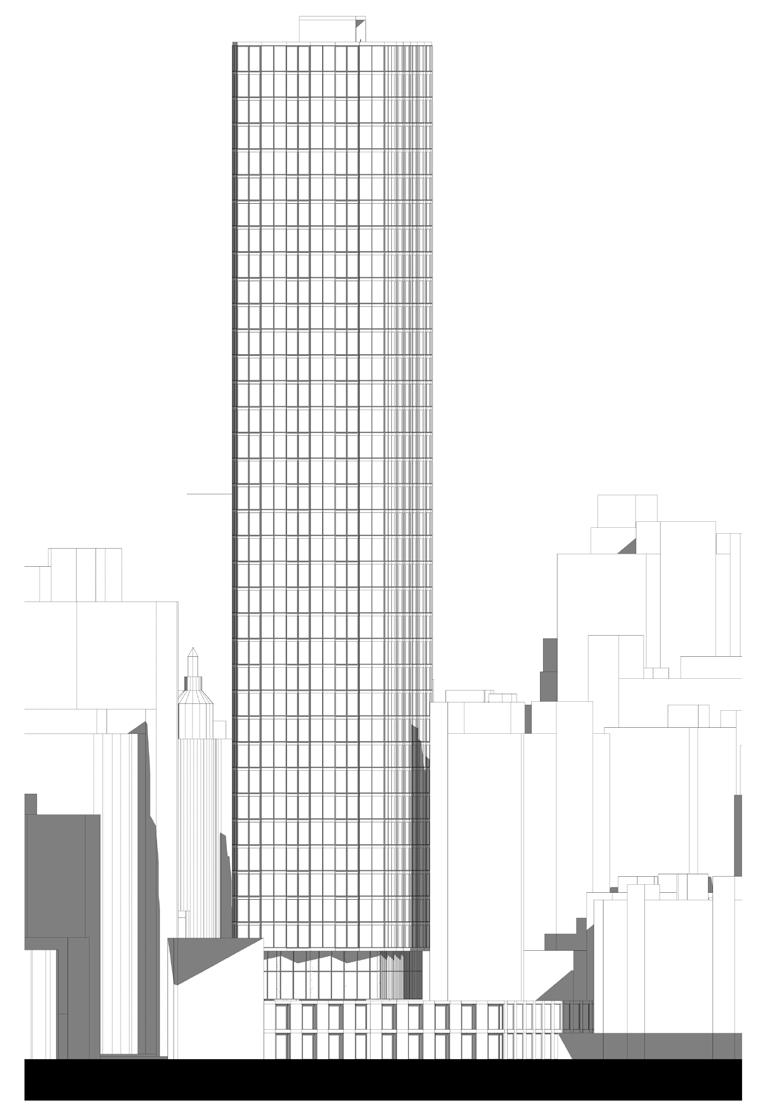
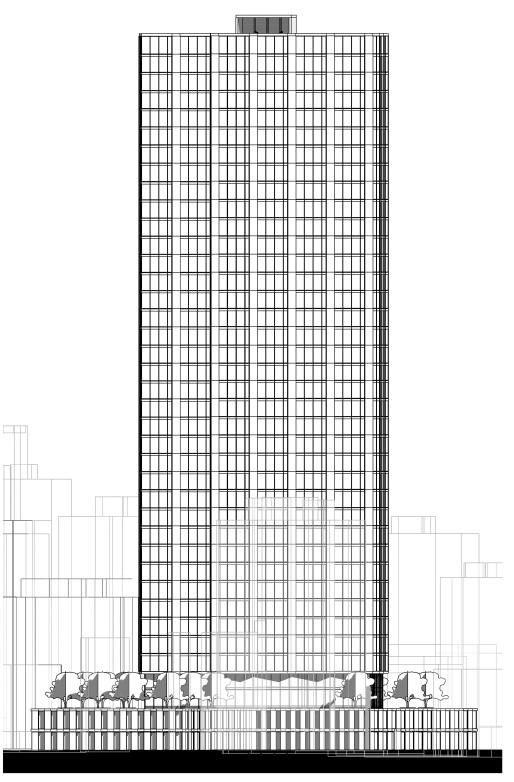
West elevation
North elevation
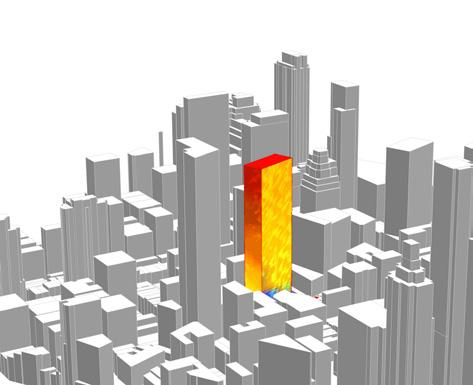
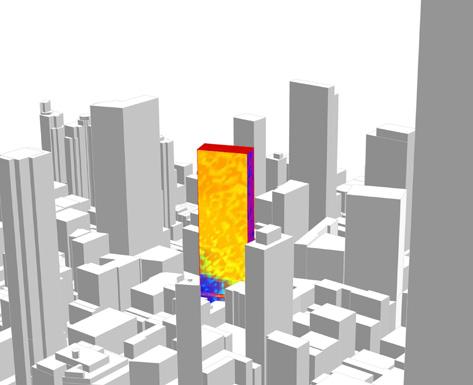
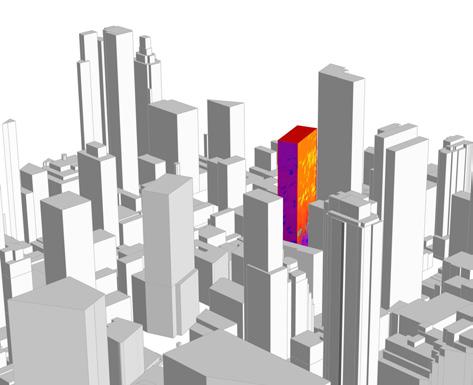
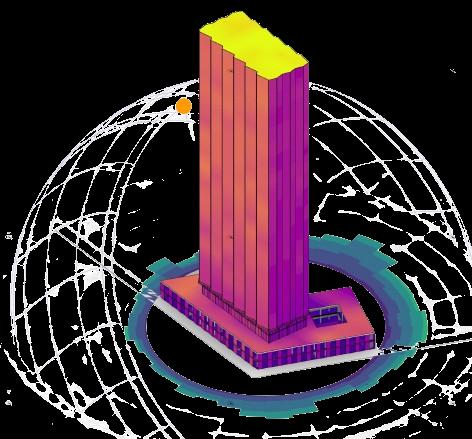
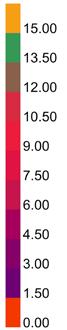
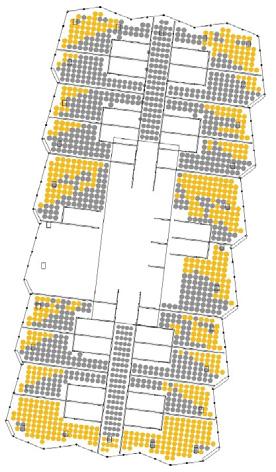
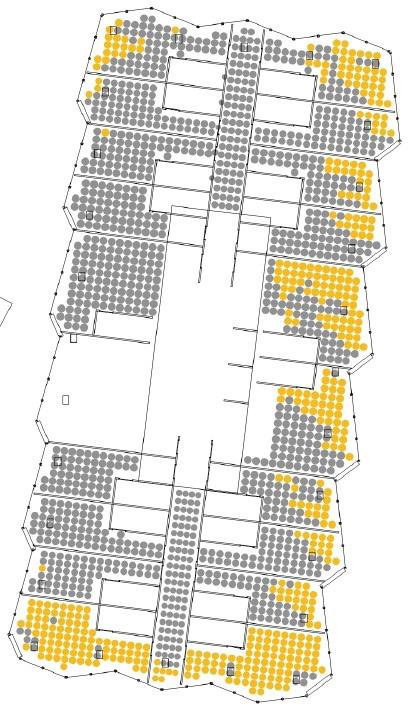
Performance analysis Sun exposure Analysis [Hours] Incident solar radiation [kW/m2] Wind analysis [Degrees]
Pre
Building performance Post Building performance
Performance analysis
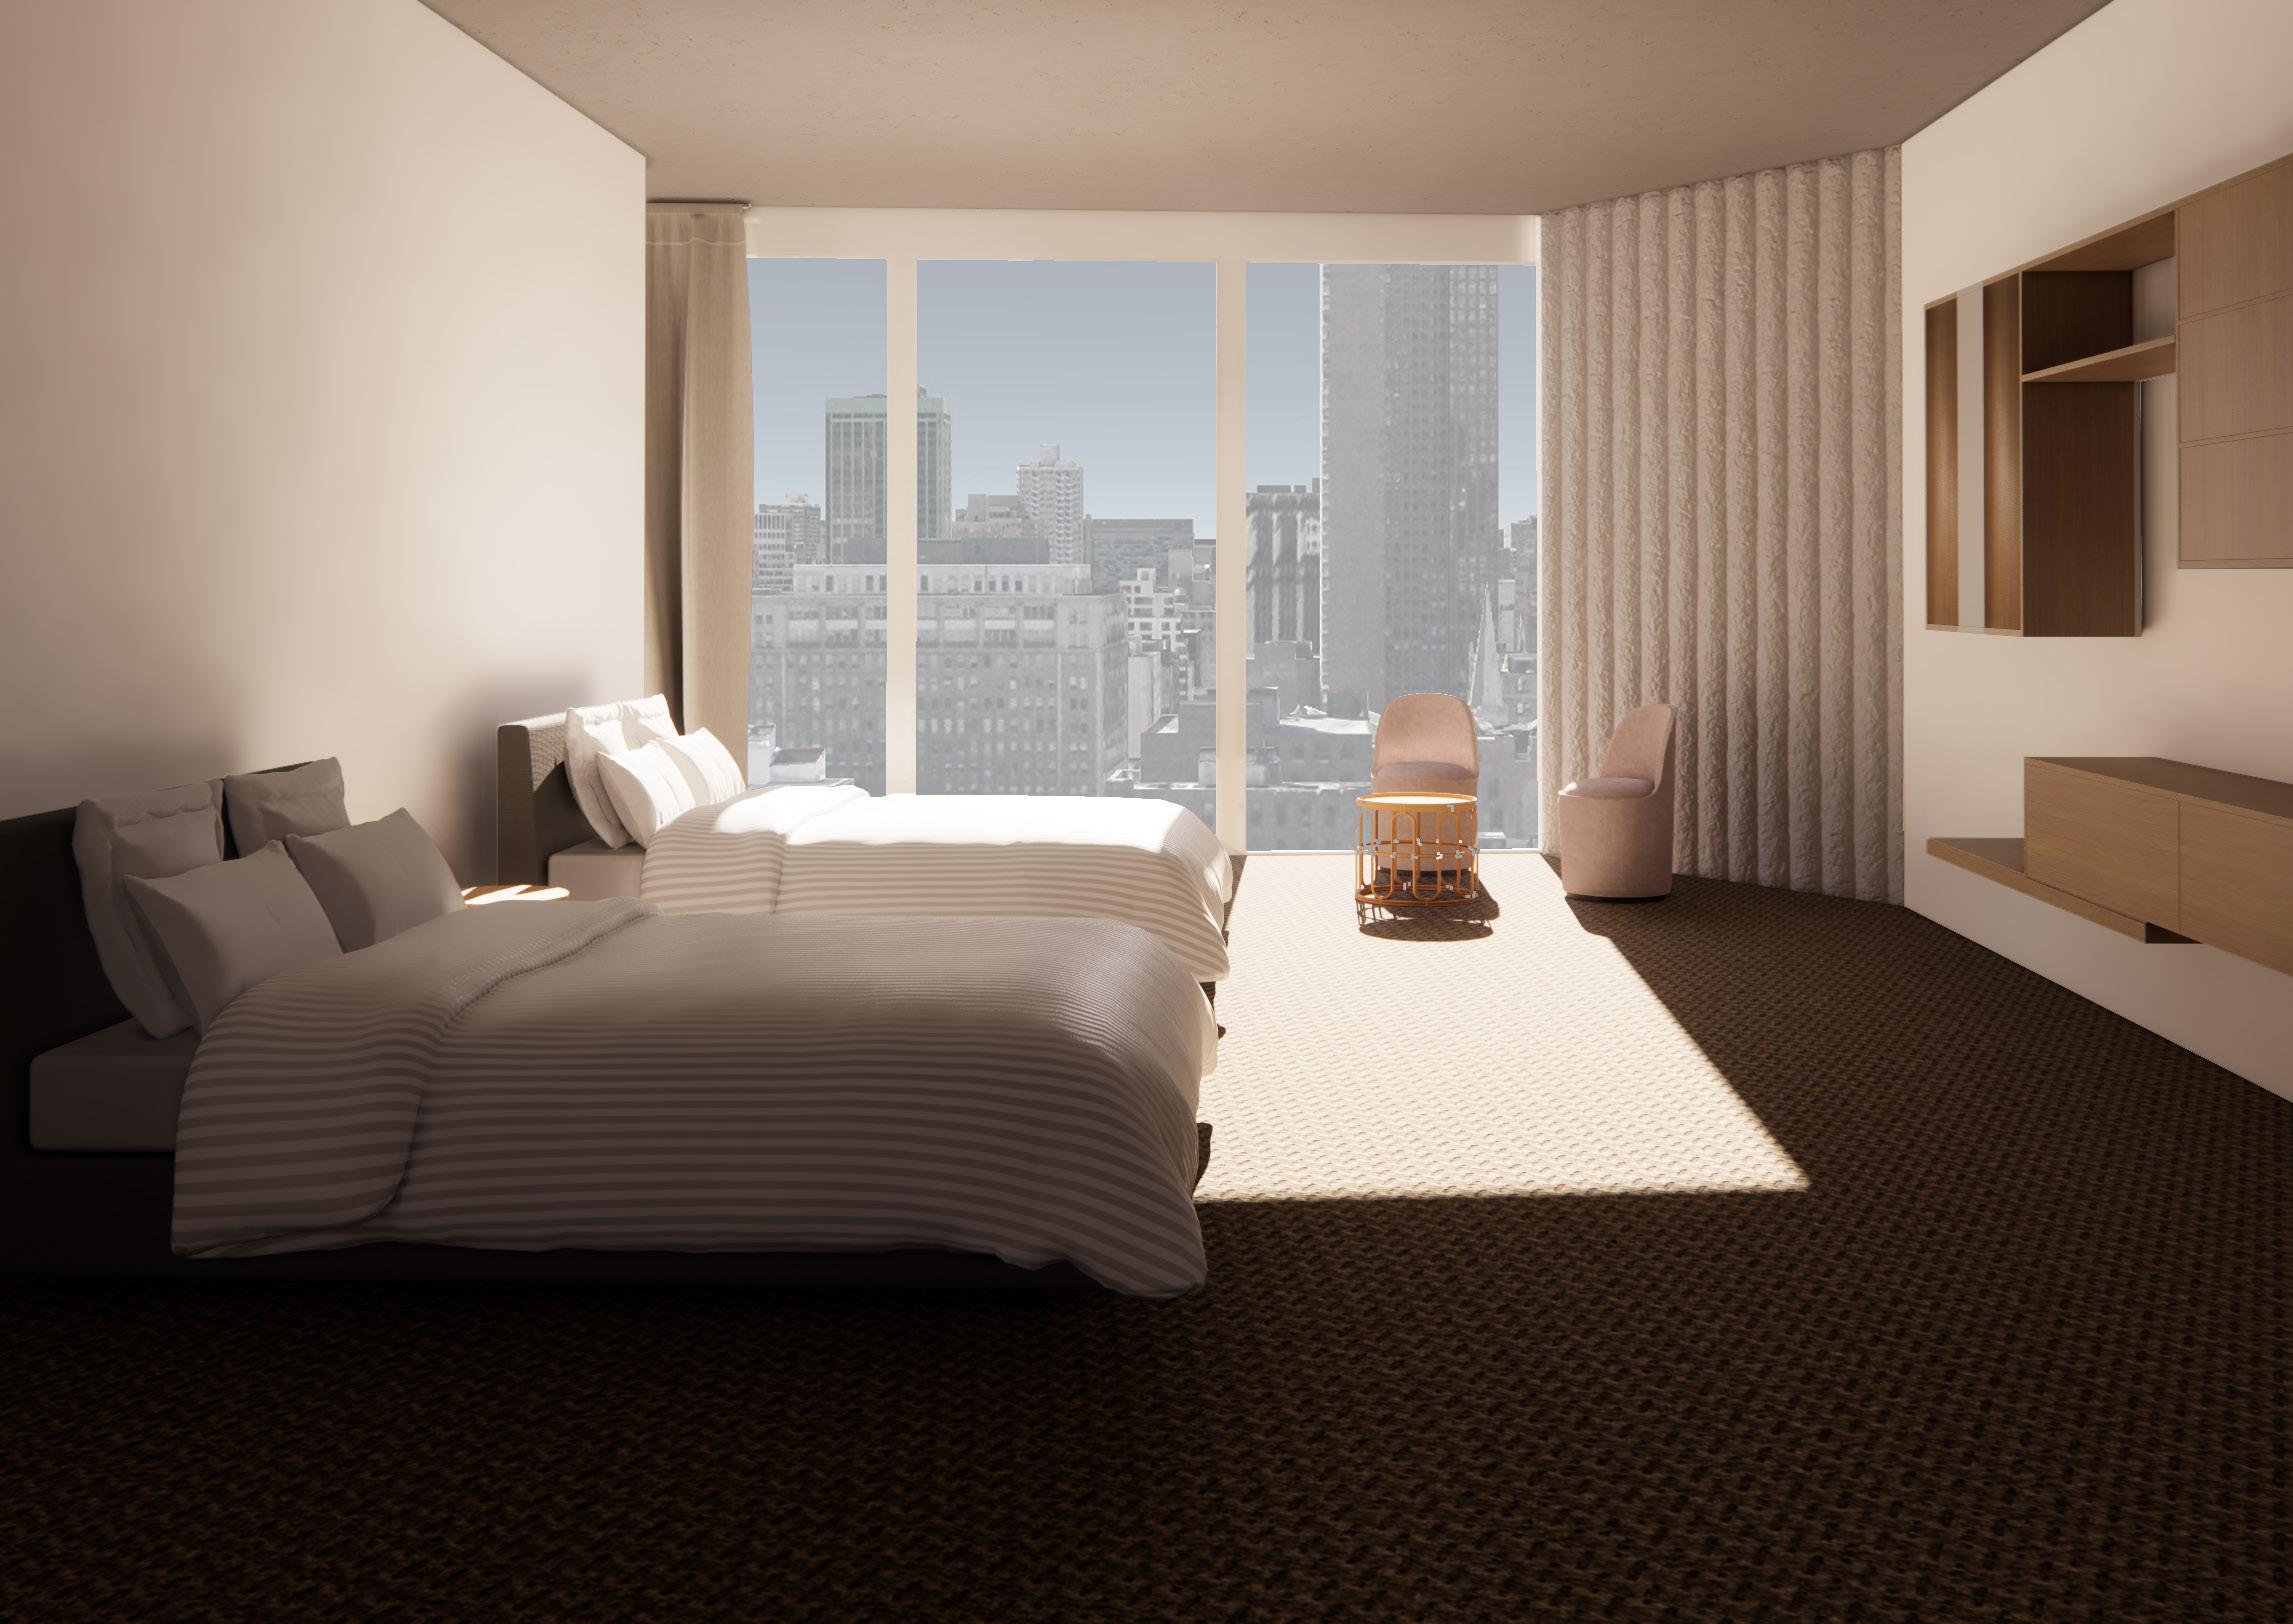
Hotel Interiors

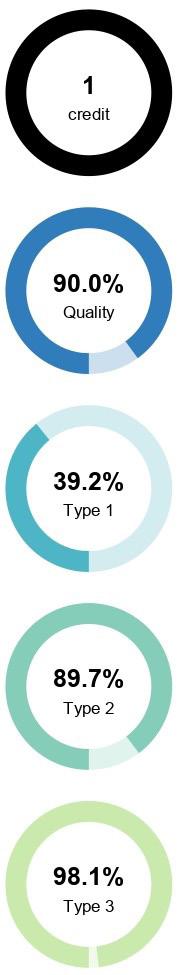
Quality view analysis
Views : 97.79%

Quality view analysis
Views : 92.71%
Quality views analysis
Views : 79.58%

14 15 2023 Achitecture RETHINKING BIM
Daylight Autonomy (300 lux) Daylight Autonomy (300 lux) Daylight Autonomy (300 lux) sDA 97.10% sDA 98.37% sDA 98.44%
Level 5
Level 22
Sunlight exposure (1000 lux direct) Sunlight exposure (1000 lux direct) Sunlight exposure (1000 lux direct) ASE 27.53% ASE 39.96% ASE 40.30% Quality View Analysis Report Daylight Availability Report
Level 38
Level 5 Level 22 Level 38
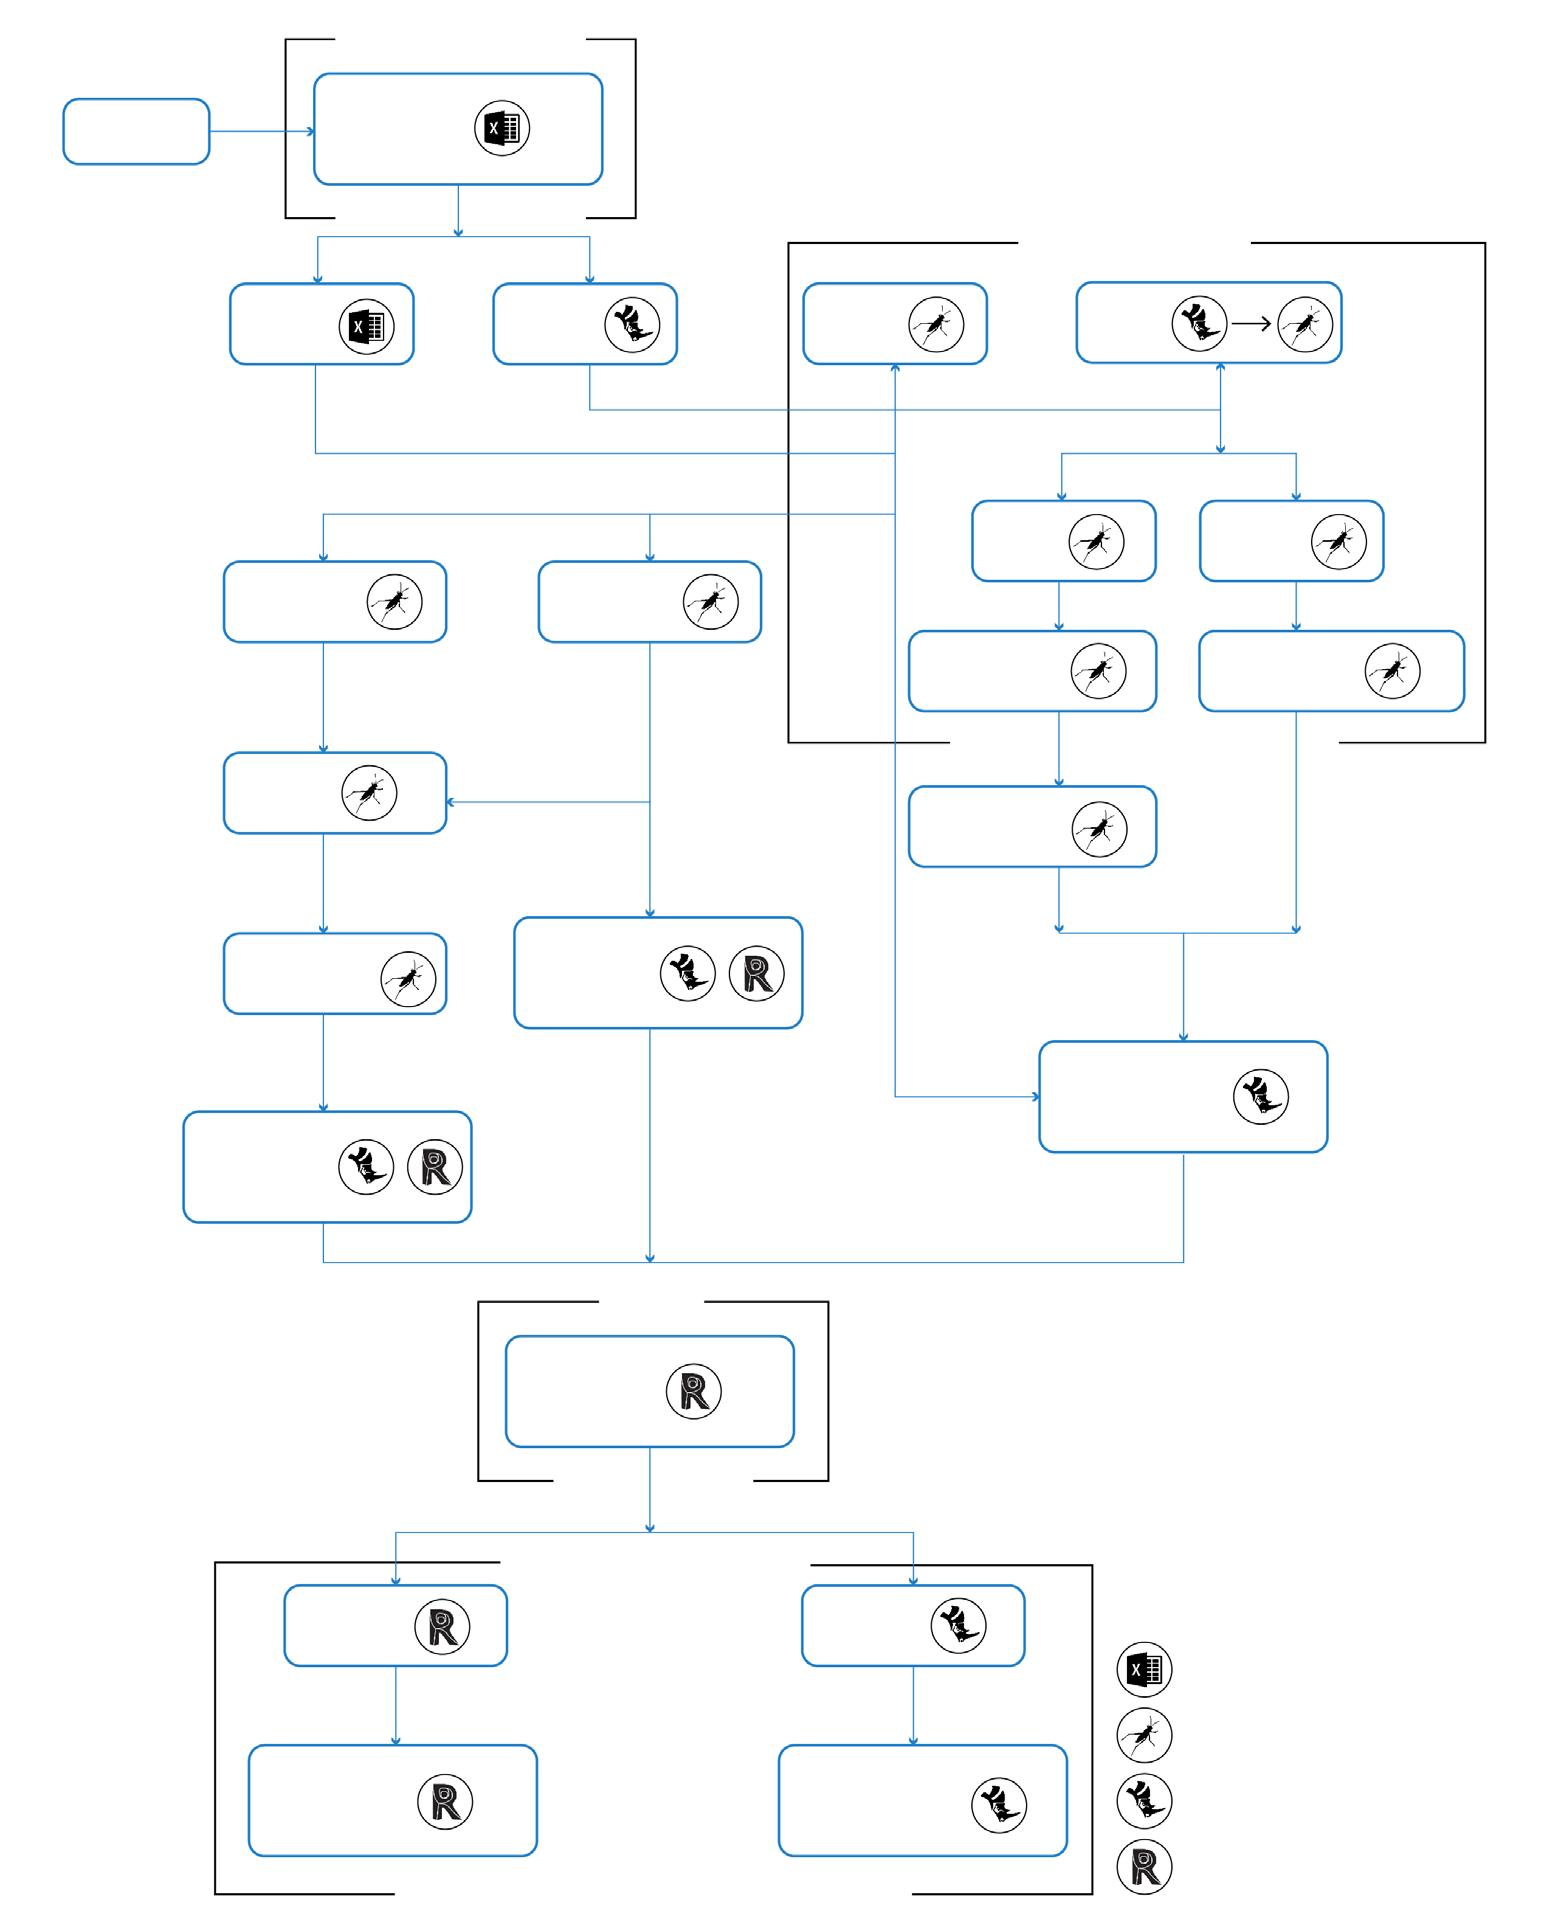
16 17 2023 Achitecture RETHINKING BIM Workflow diagram Zoning Analysis Workflow Floor Heights Cull Levels for facade 5-39 Divide curve Cull Levels for facade 1-2 Move dispatch line to get pleats Curtain wall family component Define column type Pleated profile for floor plate Revit model SD VISUALIZATION CONCEPT FEASIBILITY Revit detailing Final Revit drawings Performance analysis and visualization Excel
inside Revit Rhino model Exterior grid points for structure Define structural grid Define structural grid Define Podium Define Tower Building Massing Assigned Levels Create Slabs
Grasshopper Rhino-Rhino
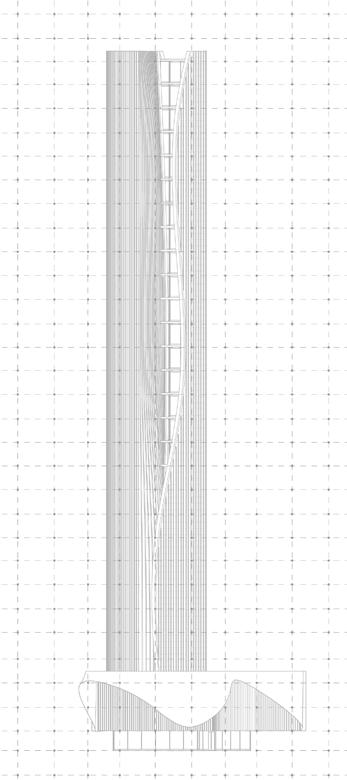
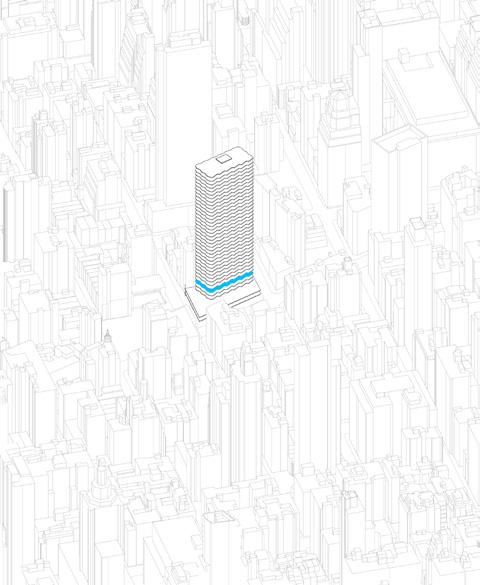
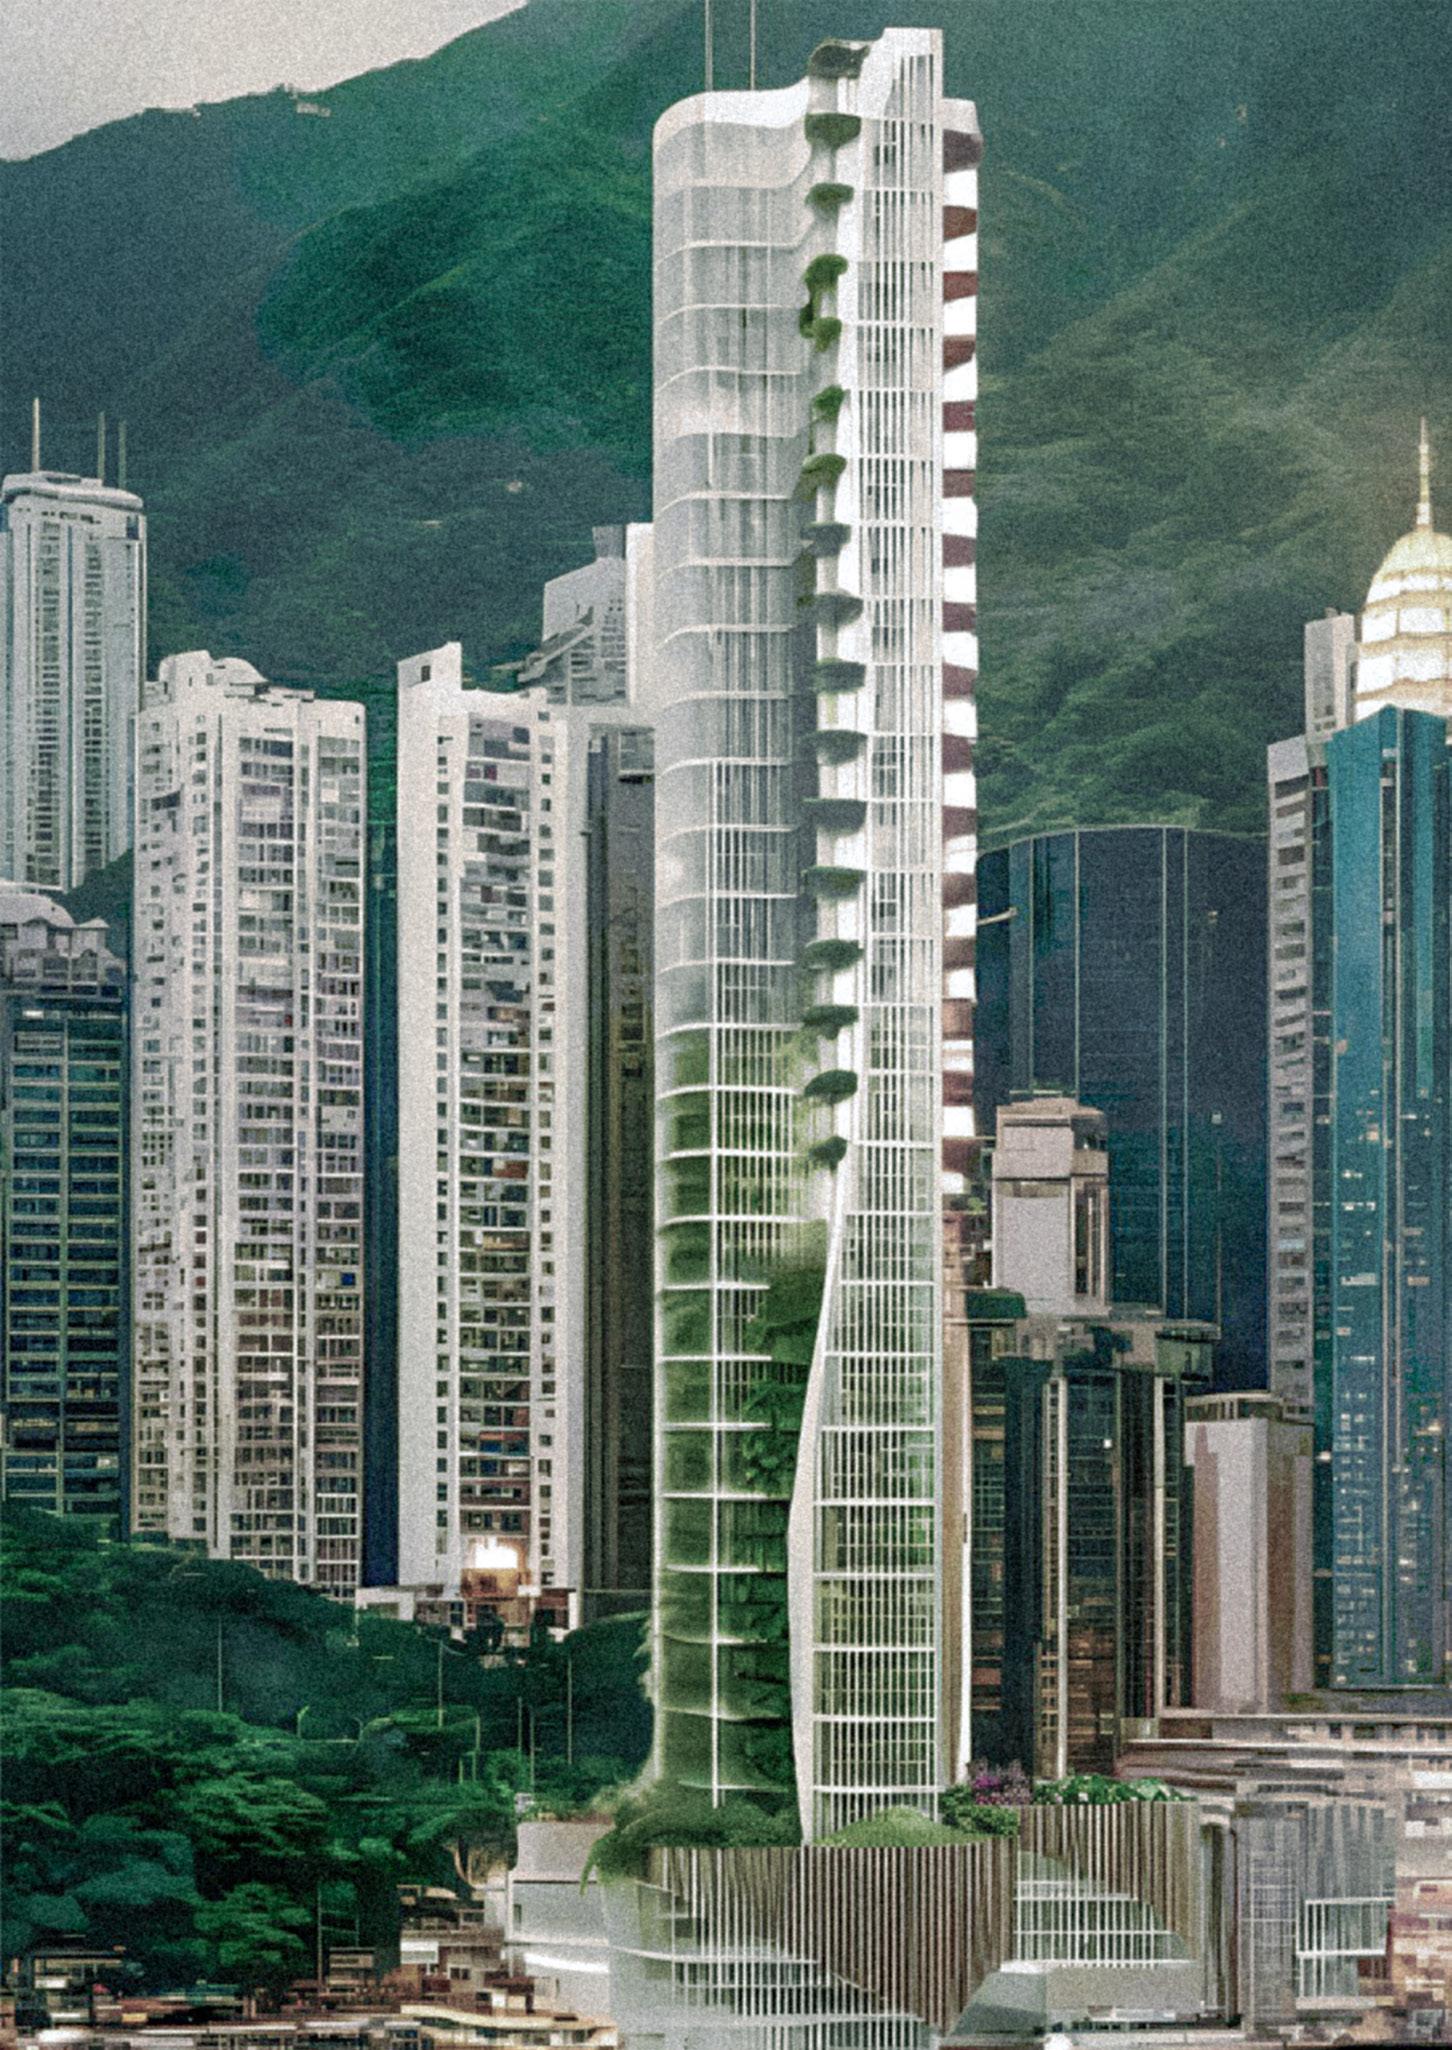
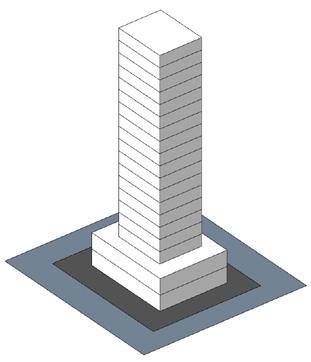
02 AGAINST THE HORIZON
Urban Vertical Farming Skyscaper Affordable Housing
Year : 2023
Project : Architectural Competition
Site Location : HongKong, China
Credit : Individual project
Role : 100%_ Research, Design, Presentation
Applications : Revit, Rhino, Adobe Illustrator, photoshop, Indesign, Light room, Lumion, AI
For many years people have perceived the world in a linear manner. They wondered what’s behind the horizon and followed their desires of land conquering until they clashed with someone else’s idea to do the same. As the borders fluctuated some areas appeared to be more desirable than others and the architecture had to maneuver its way to stack up growing masses. And while our imagination started to shoot up towards the sky, we sometimes seemed to have lost our way creating crammed, confined spaces that were more similar to coffins than areas where one would like to live. Thankfully, there is a better solution on the horizon as skillful, innovative and clever designs are navigating towards sustainable urban spaces that combine the best of compact, practical planning with agri-tecture. This competitions seeks to design a pioneering, self-sufficient residential skyscraper that utilizes the idea of vertical farming and addresses the challenges that Hong Kong faces nowadays. The designed building should provide a unique and cutting-edge living experience for its residents, fulfilling all the needs of modern societies and include innovative solutions to the challenges of urban agriculture and sustainable living.
18
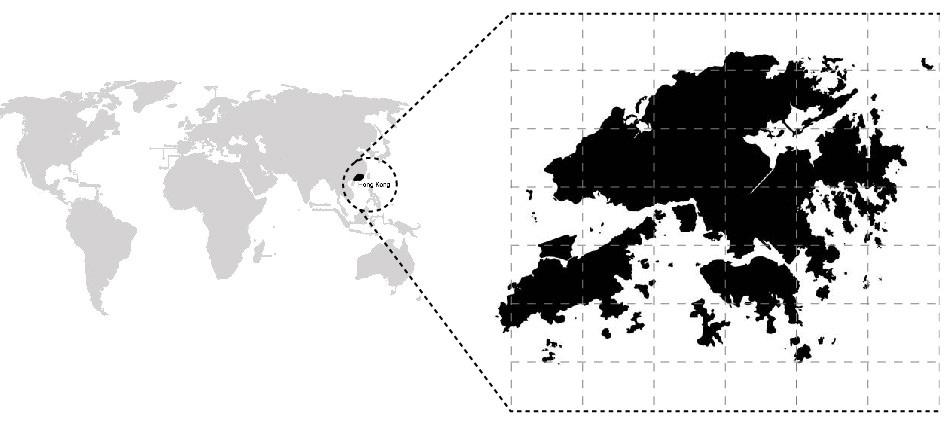
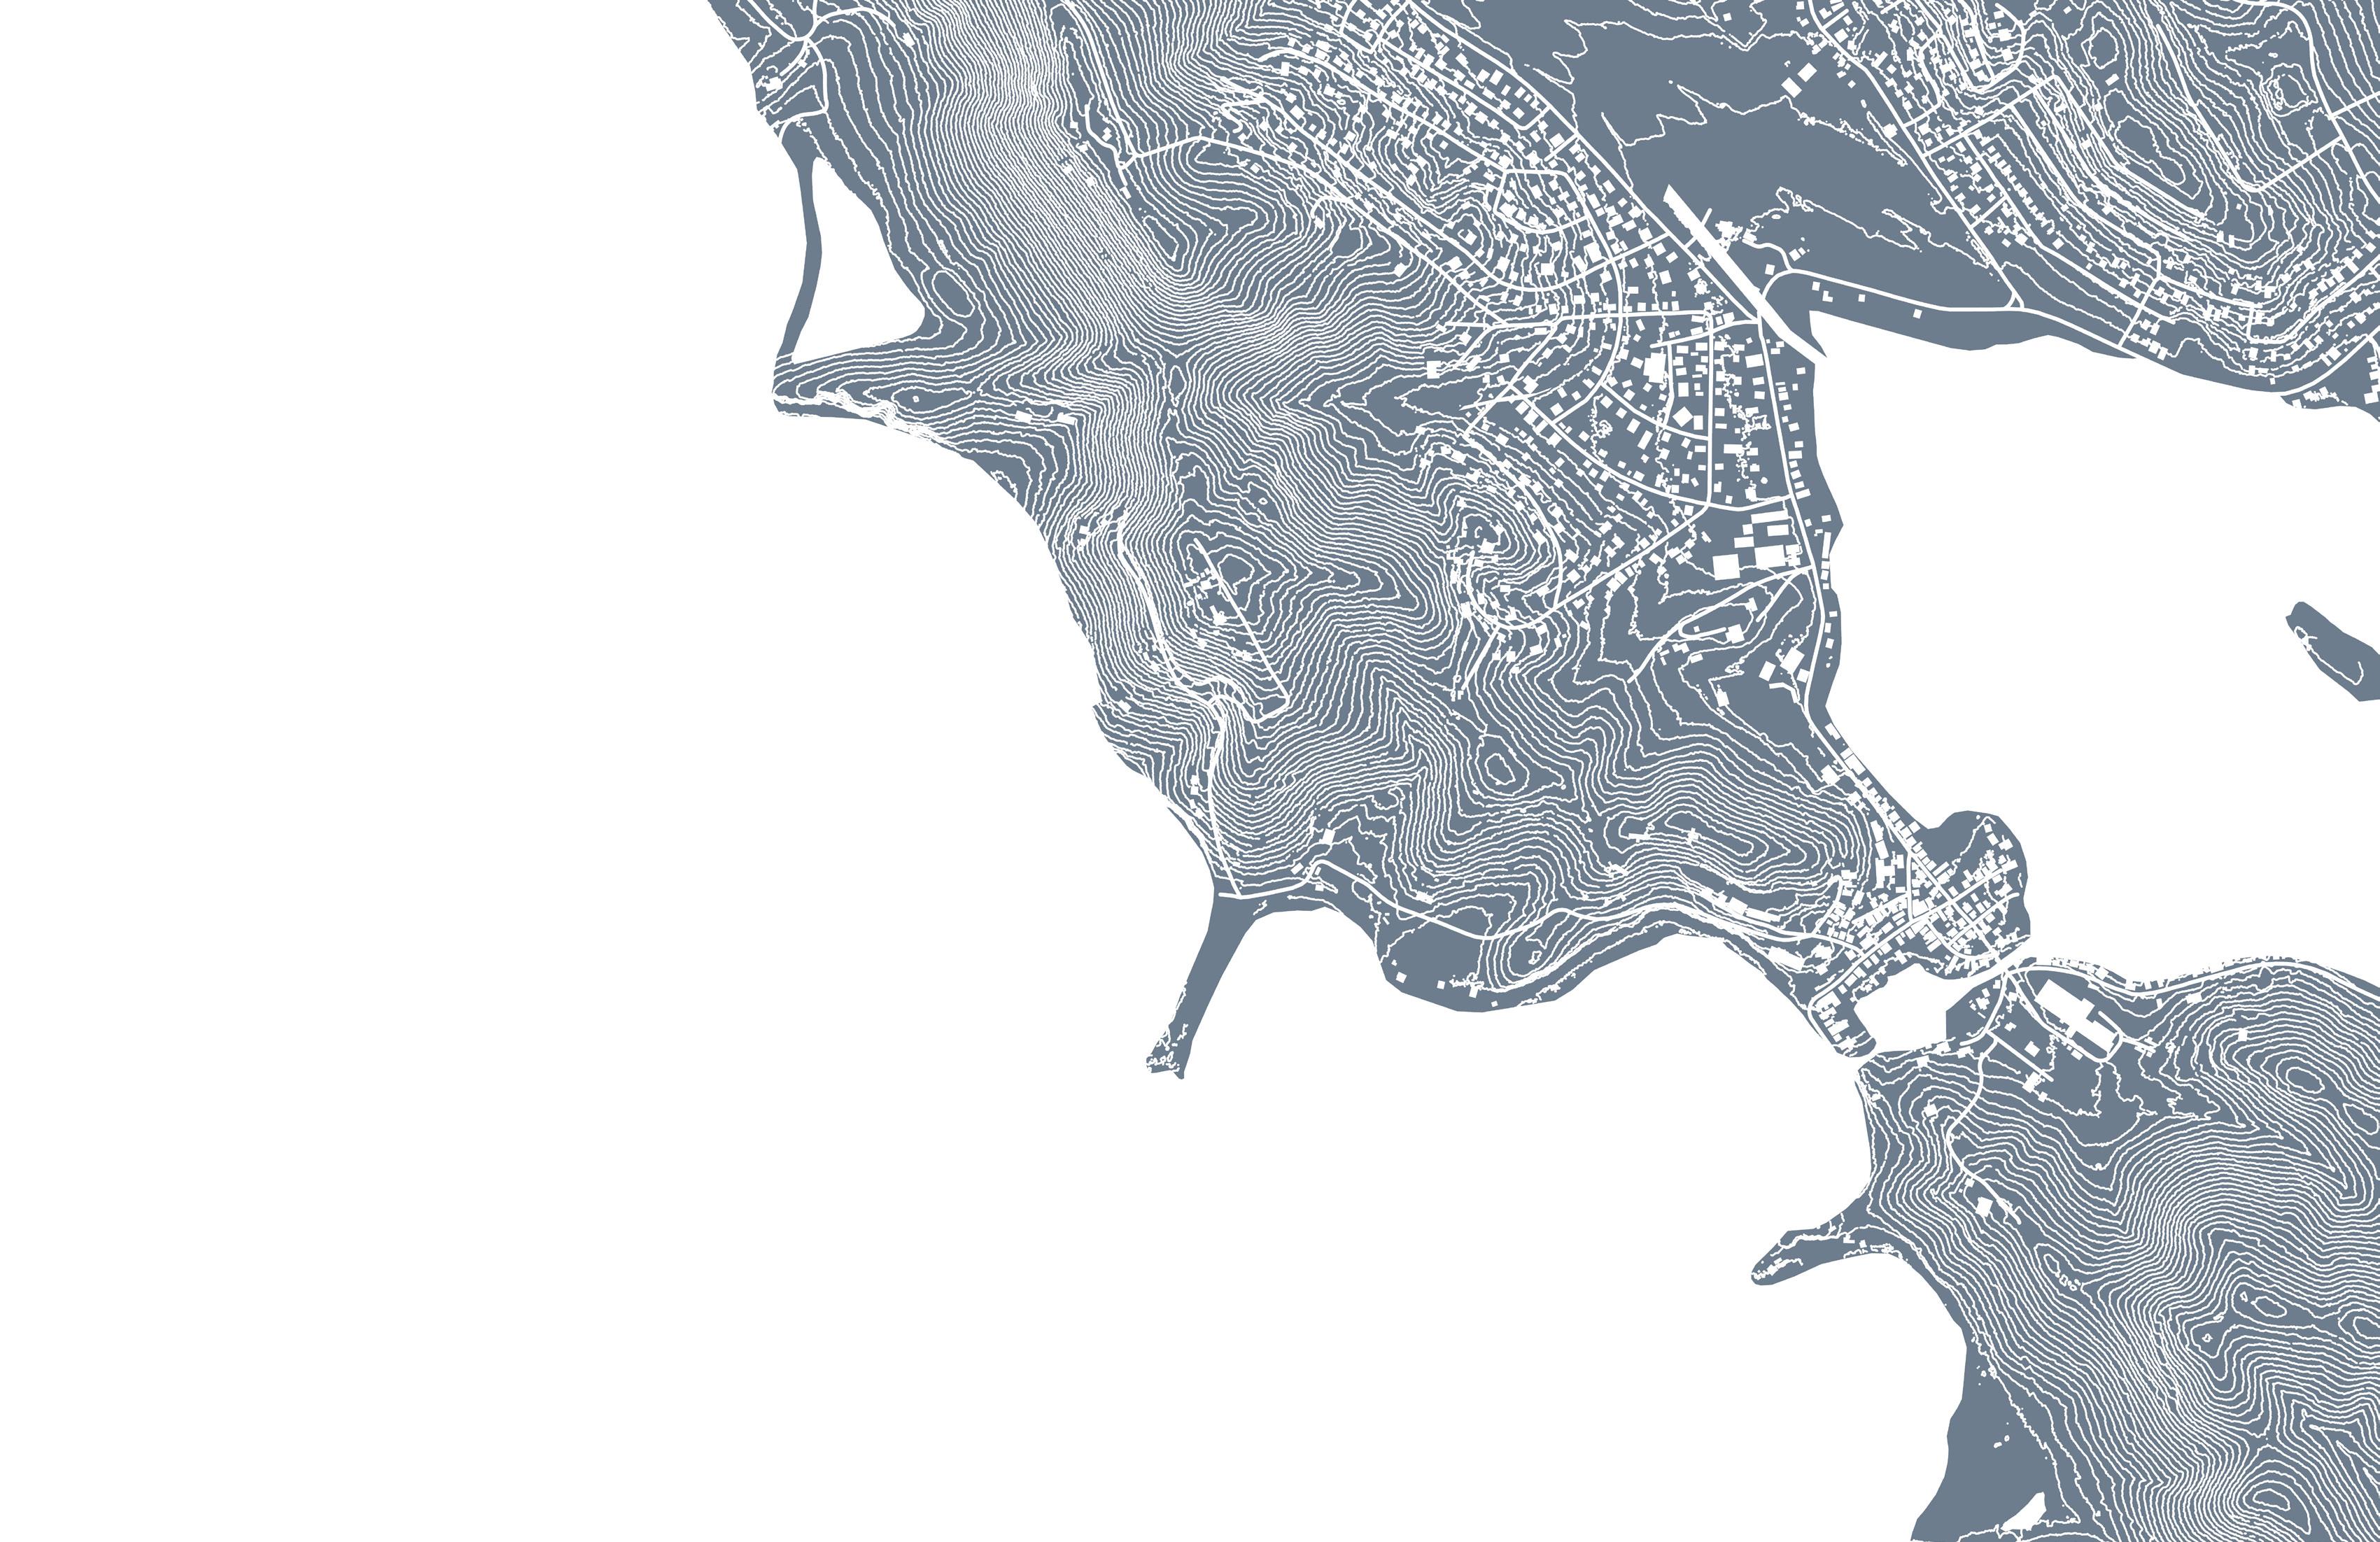
Hong Kong, China
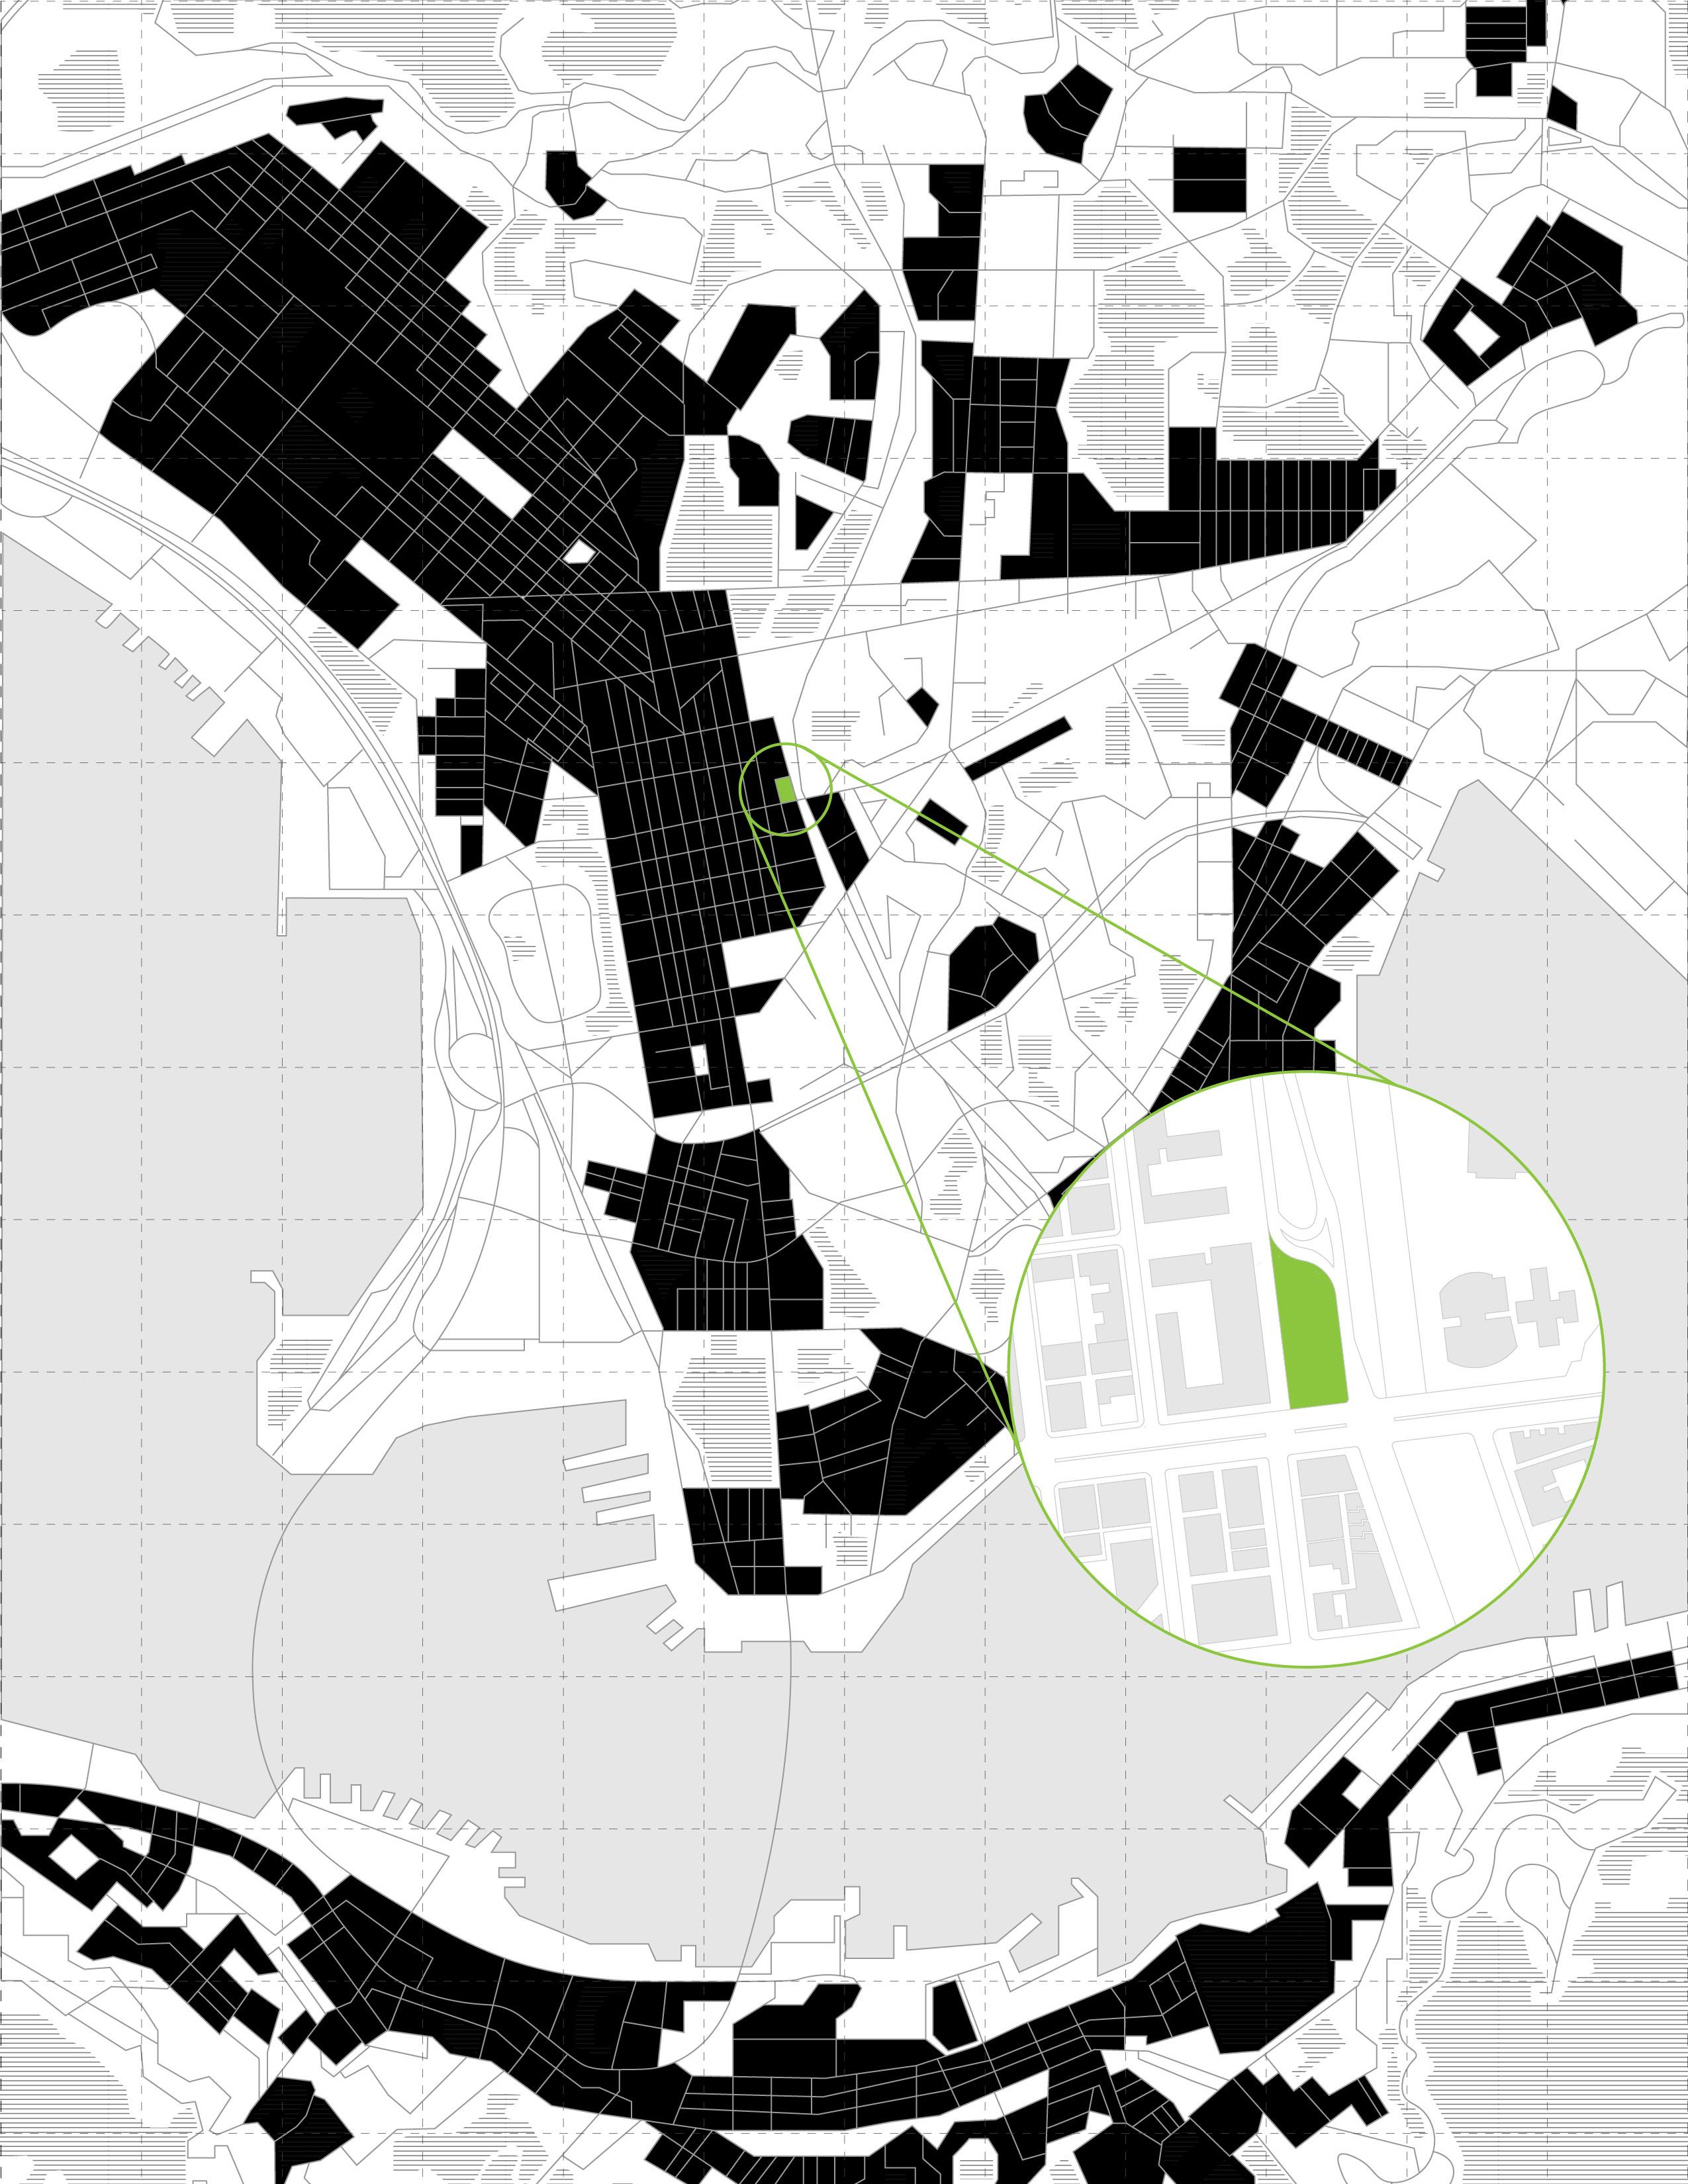
Site Contextual Location
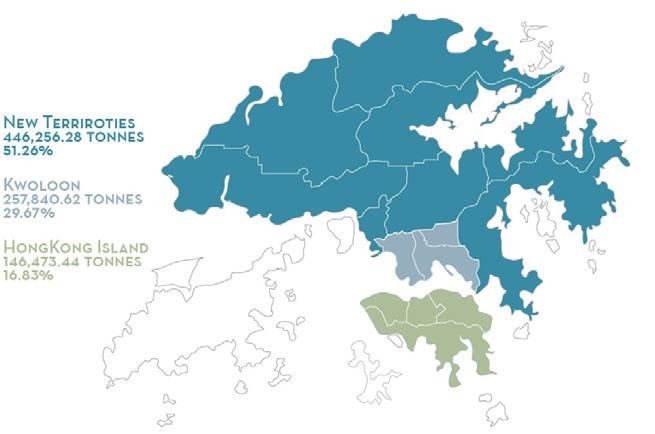
Hong Kong is one of the most vibrant and dynamic cities in the world. However, it faces a number of challenges. Hong Kong’s most pressing issues are overpopulation, housing crisis, air and water population, and a lack of sufficient food and energy supply, especially due to the fact that its economy was severely damaged by the pandemic. Geographically, Hong Kong consists largely of steep hillsides. Since traditional farming requires a large amount of land the local production is only able to complement the imported foods to meet the consumption needs. And because import intensifies the existing issues (cost of living and pollution) there is a growing demand for innovative and sustainable solutions that can help the city meet the needs of its residents.
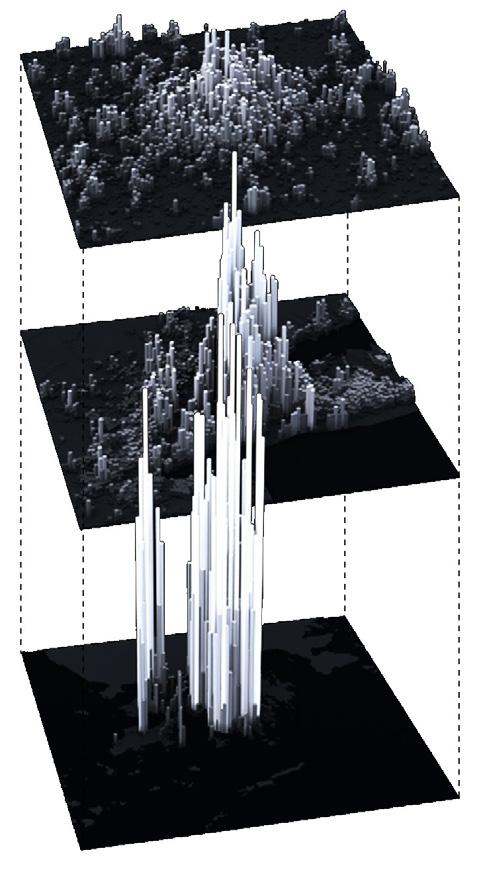
London
New York
Hong Kong
Mapping the number of residents in each square kilometre of a 100 by 100 kilometre region for London, New York and Hong Kong. The city that stands out in the mapping is Hong Kong, with its extremely high residential densities exceeding 110,000 people per km2. Here planners have responded to scarce land availability with very tall (over 30 storeys) high-density development. Scarce land has also influenced the development of New York City, where Manhattan densities peak at 59,000 people per km2. London in comparison is much lower density.
20
Residential Density
Peak 27,100 pp/KM2
Residential Density
Peak 59,150 pp/KM2
Residential Density
Peak 111,100 pp/KM2
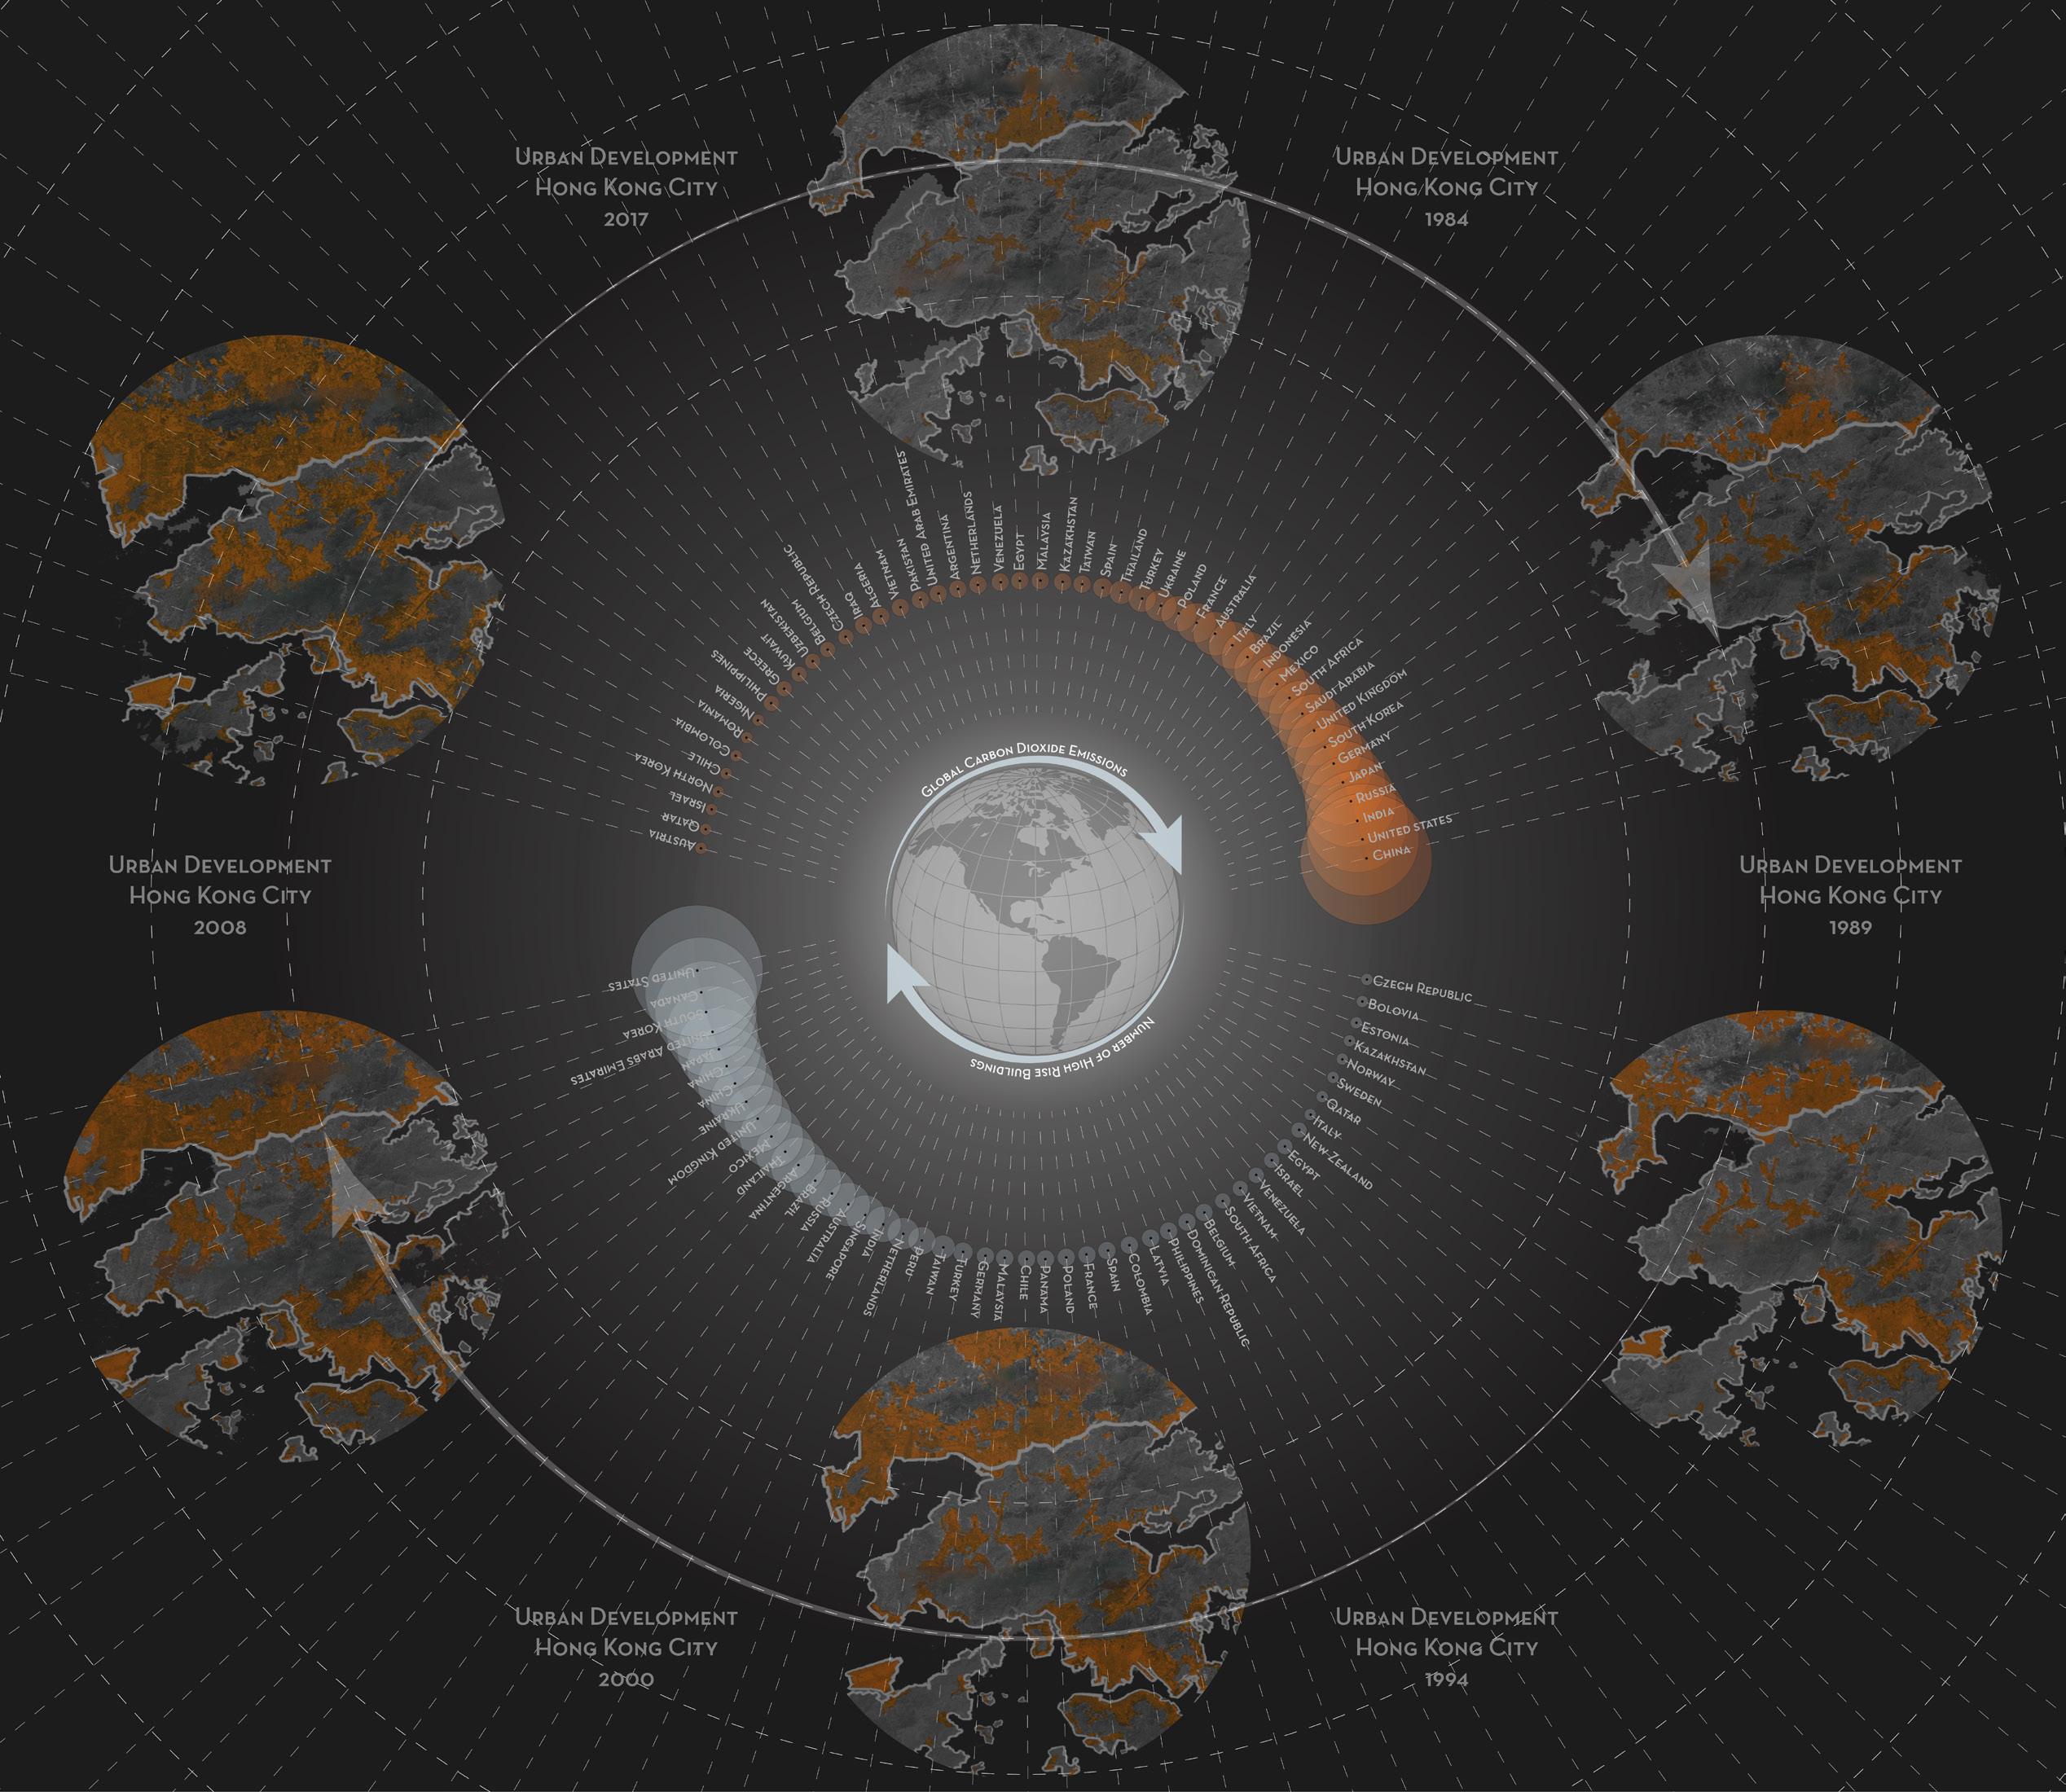
2023 Achitecture VERTICAL URBAN FARMING
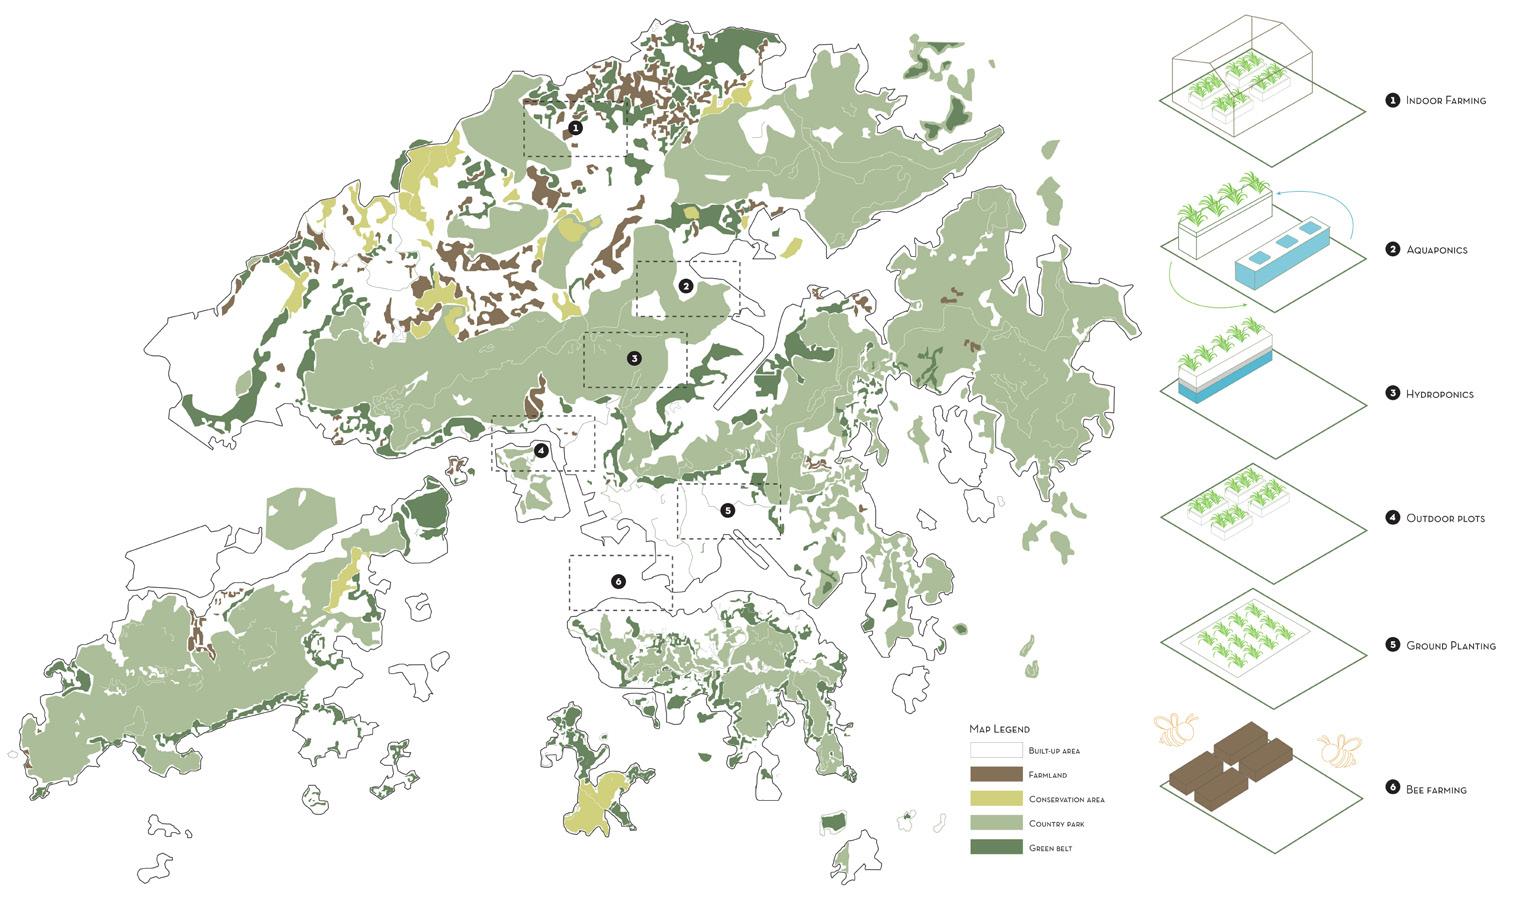
Mapping Urban Farming Typologies, Hong Kong city (Rethinking the Potential of Urban Farming / Valuing social benefits in Hong Kong. (n.d.). Ting WANG.)
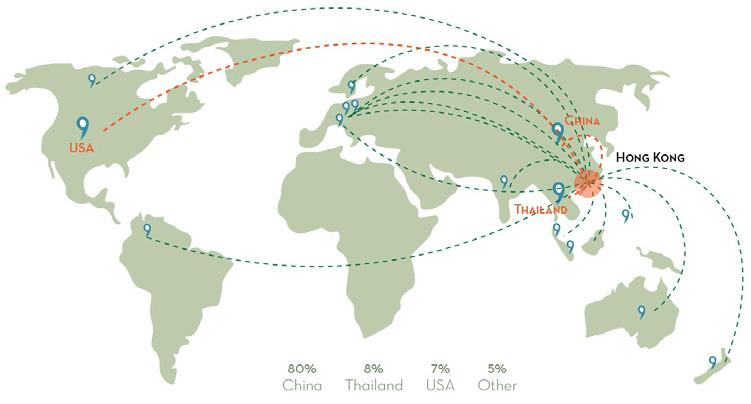
Mapping Food Imports into Hong Kong, China (Staple Scarcities - Food Production Territorialisation of Hong Kong. IAAC Blog.)
Food Needs Hong Kong, China
(Staple Scarcities - Food Production Territorialisation of Hong Kong. IAAC Blog.)
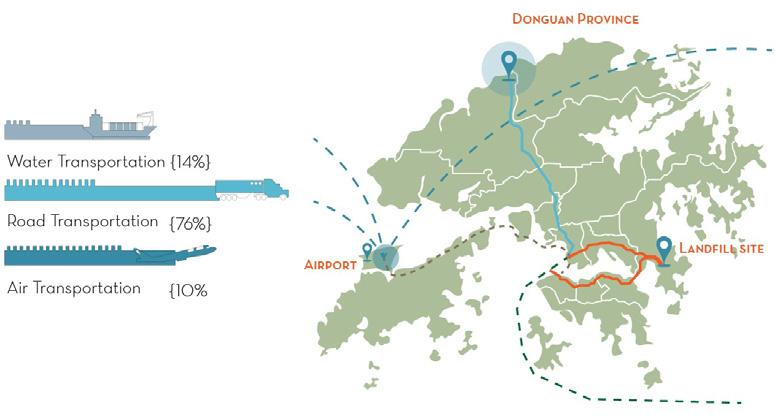
Food Miles into Hong Kong, China (Staple Scarcities - Food Production Territorialisation of Hong Kong. IAAC Blog.)
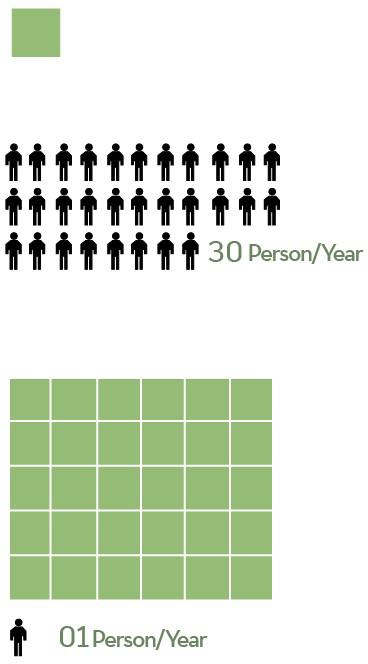
Vertical Farming
Utilisation
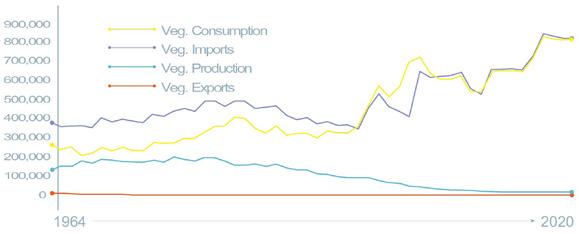
Hong Kong vegetable production, export,import and consumption
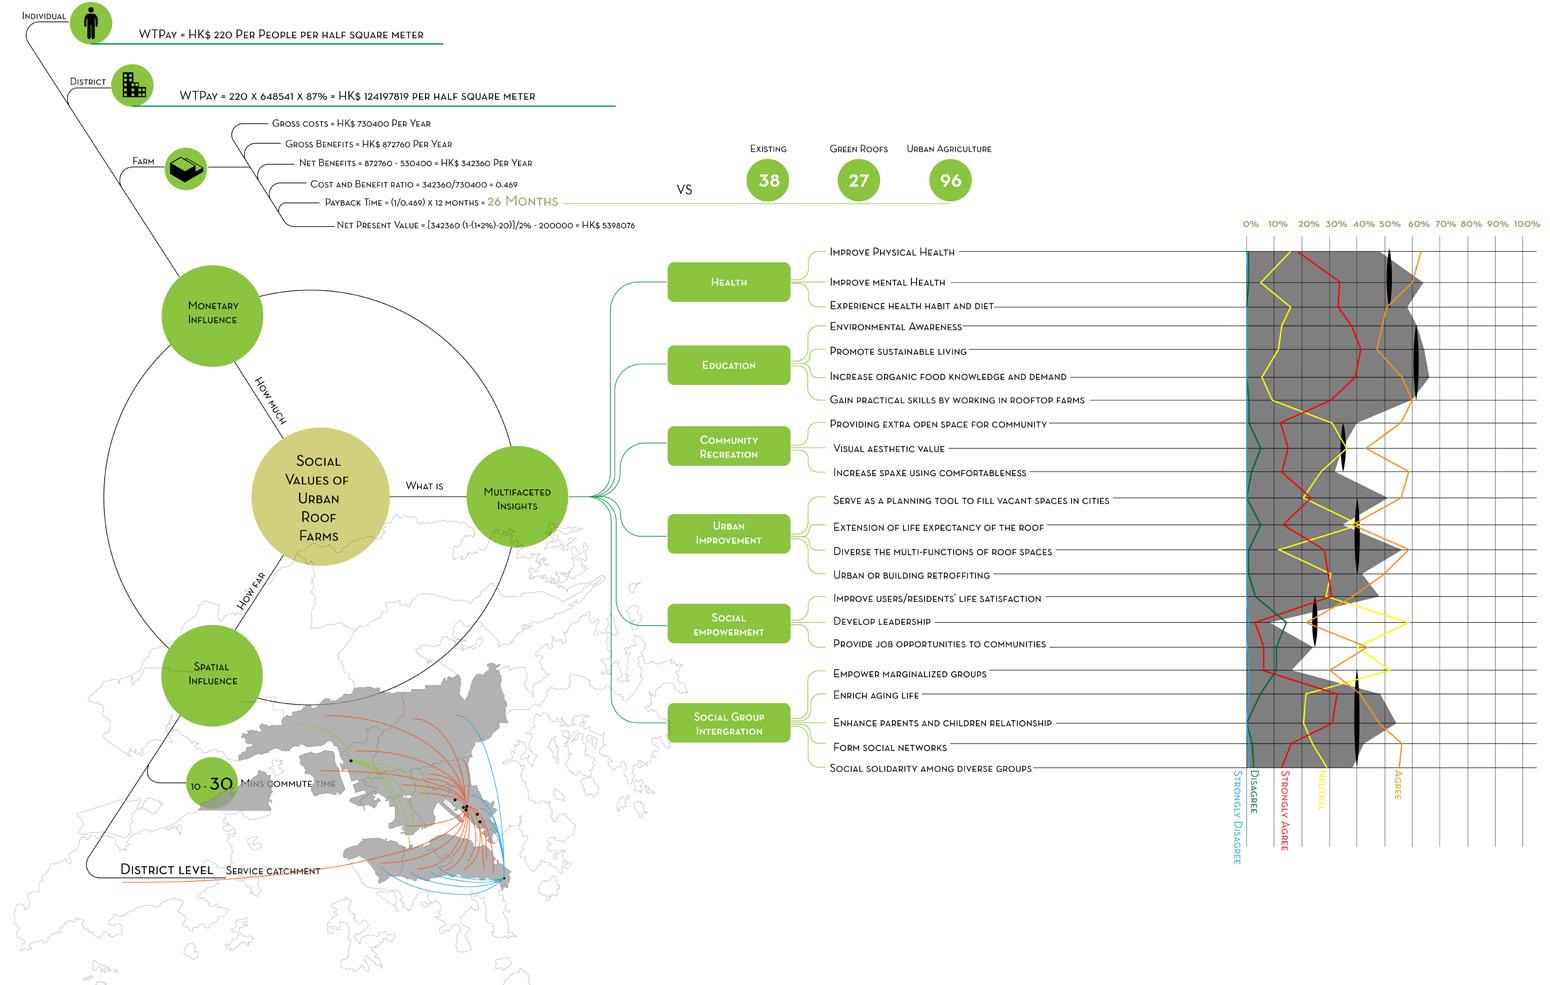
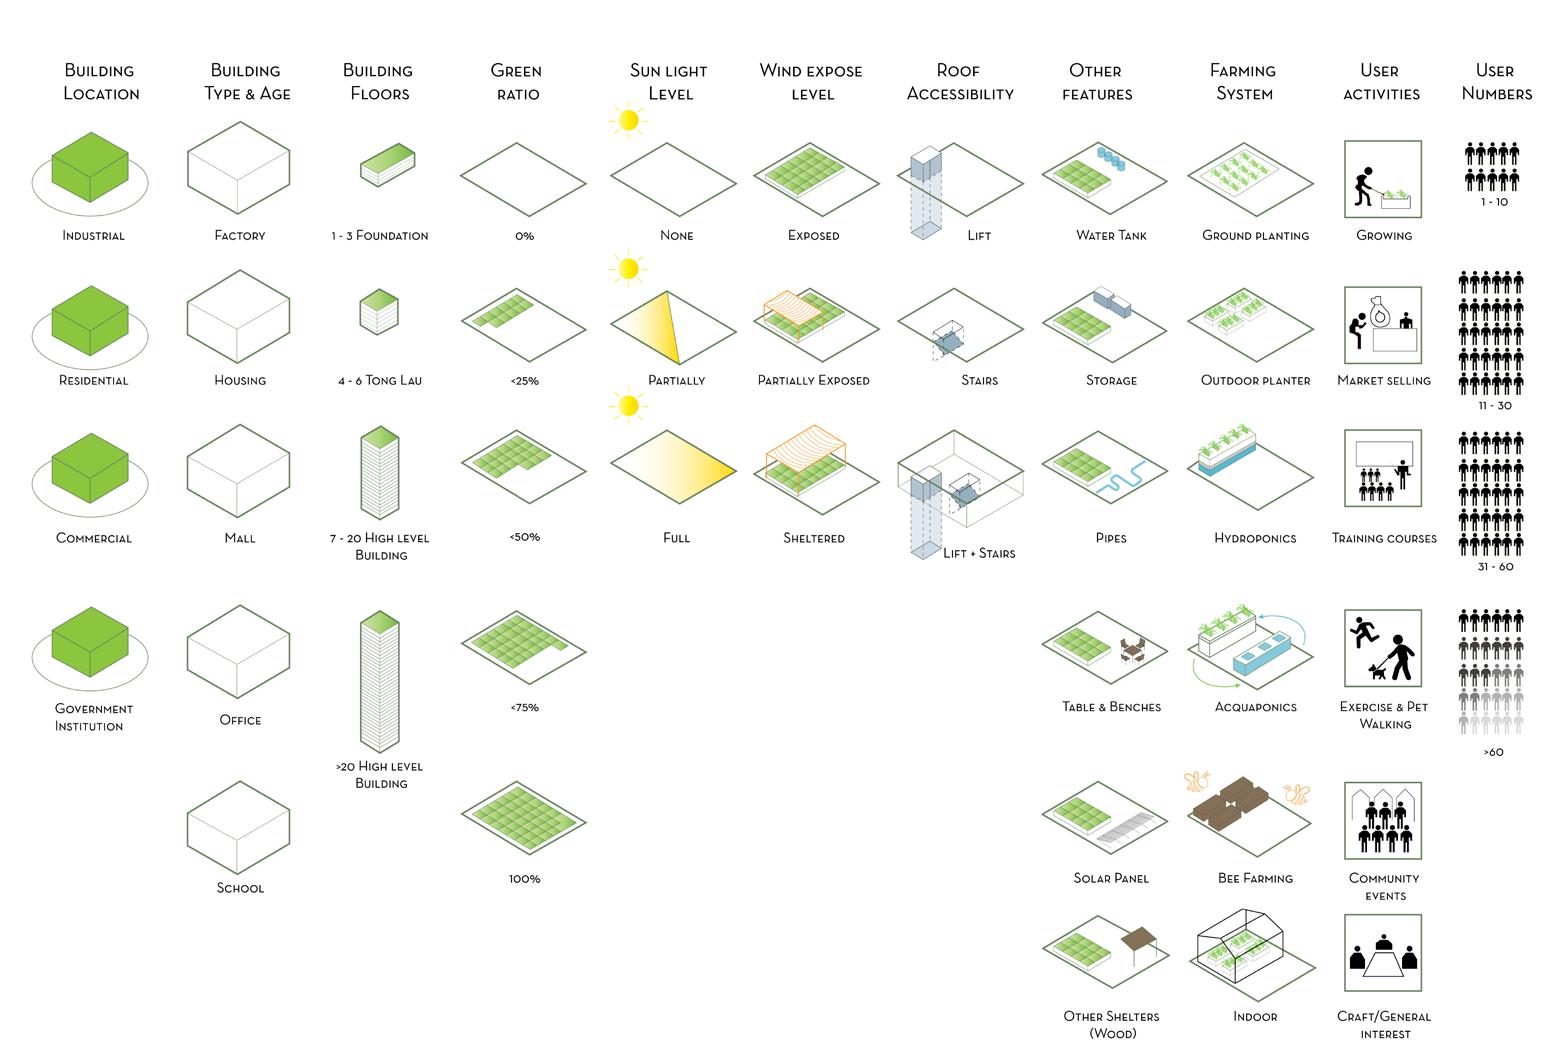
Urban Roof Top Typology Catalogue, Hong Kong City (Rethinking the Potential of Urban Farming / Valuing social benefits in Hong Kong. (n.d.). Ting WANG.)
Reinvented Valuation System or Urban farming Social Values (Rethinking the Potential of Urban Farming / Valuing social benefits in Hong Kong. (n.d.). Ting WANG.)
22 23
Achitecture VERTICAL URBAN FARMING
Space
Production in 1 Acre Land Traditional Farming 2023
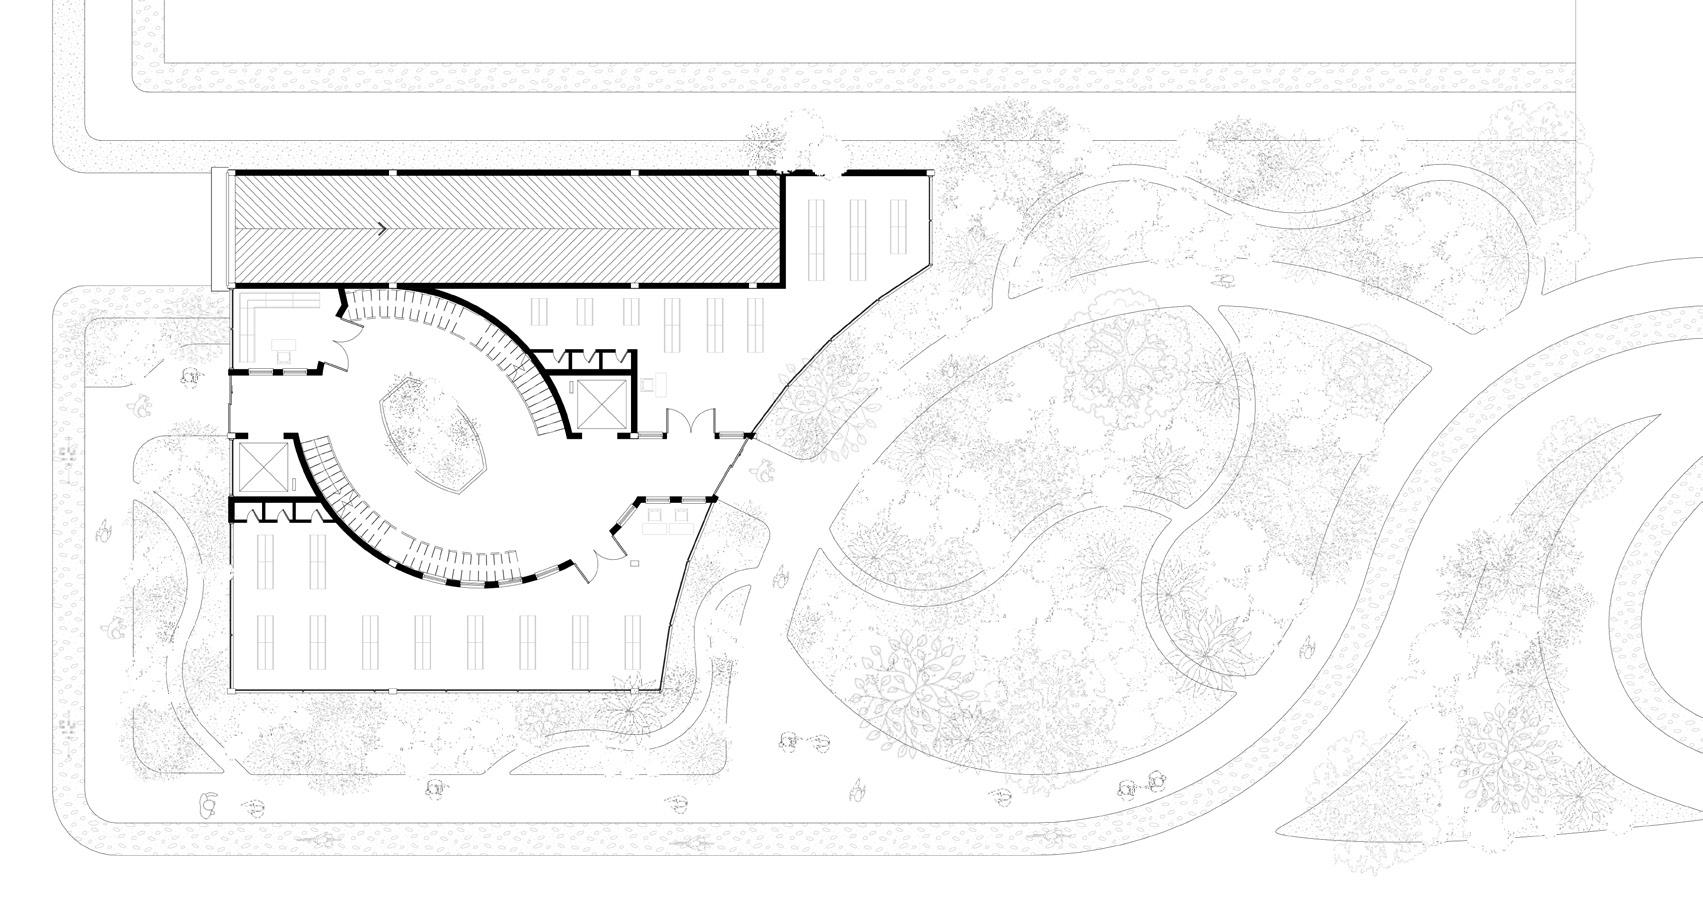
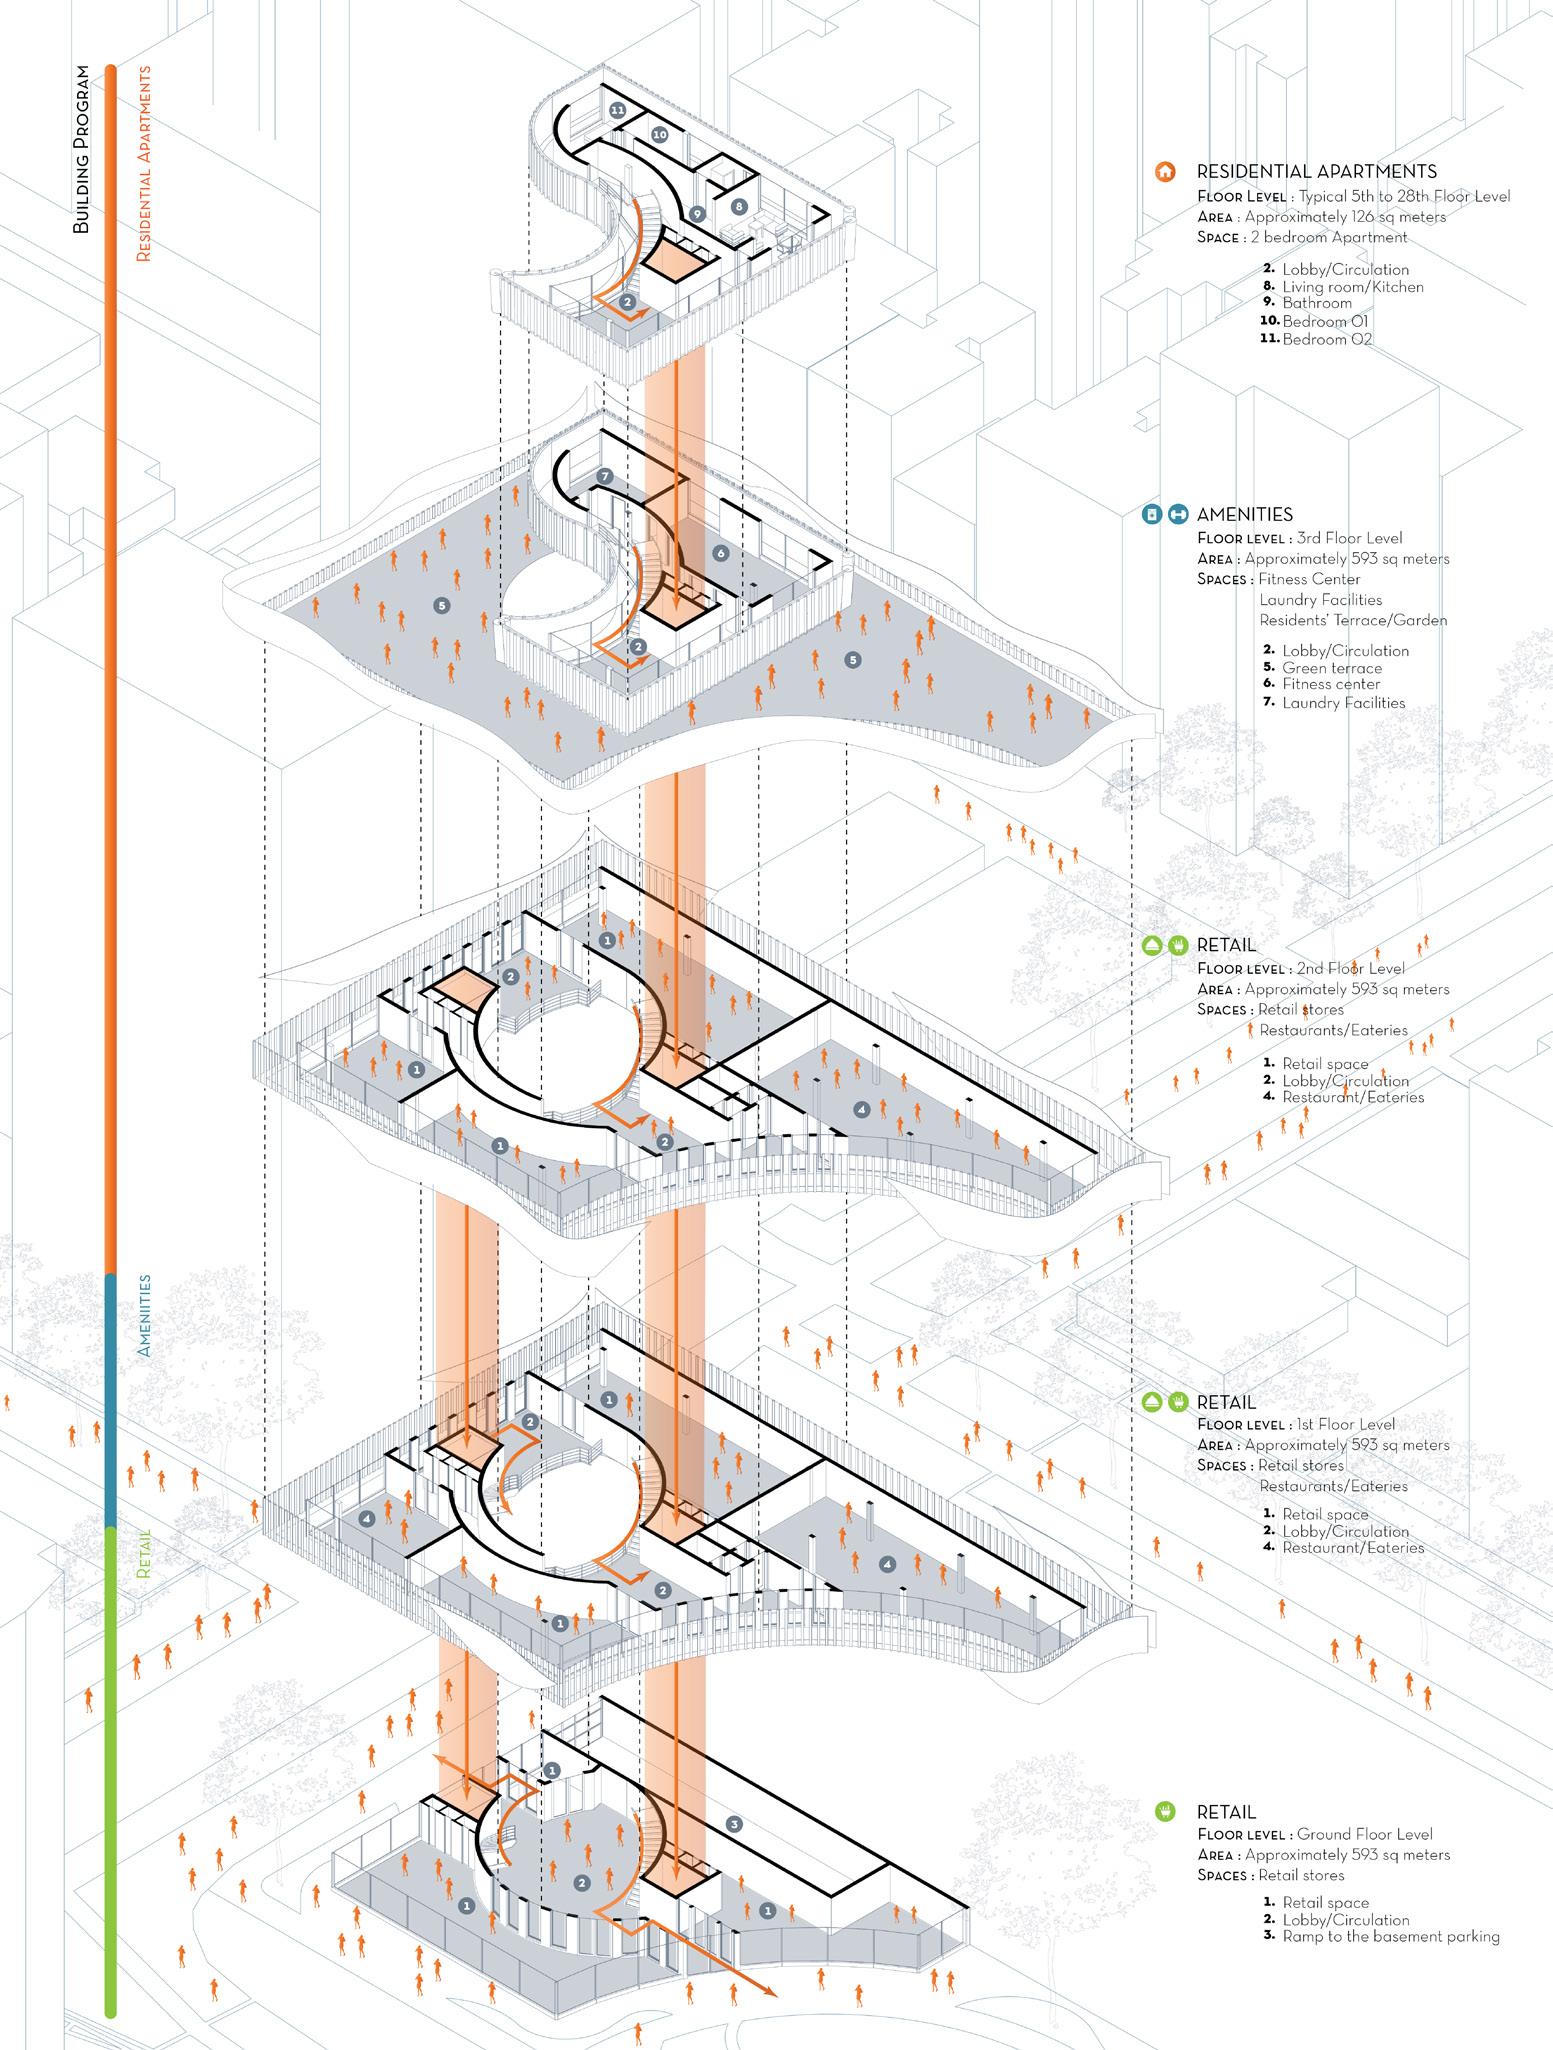
Ground Floor Plan
Scale 1 : 100
1. Retail stores
2. Circulation/Lobby

First Floor plan
1. Retail stores
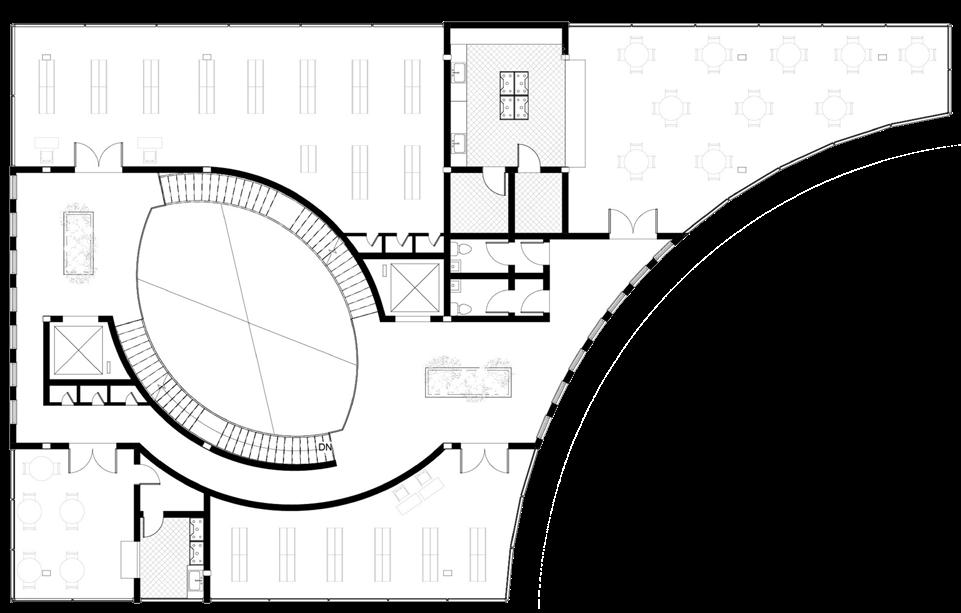
2. Circulation/Lobby
3. Restaurants/Eateries
Scale 1 : 100 N
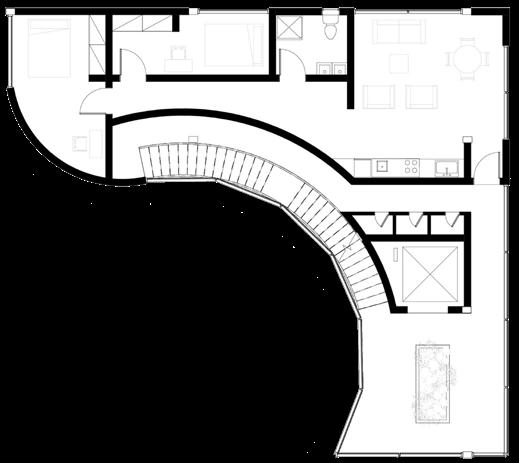
Typical 4th to 28th Floor Plan
Scale 1 : 100
4. Lounge
5. Kitchen
6. Bathroom
7.Bedroom 01
8. Bedroom 02
N N
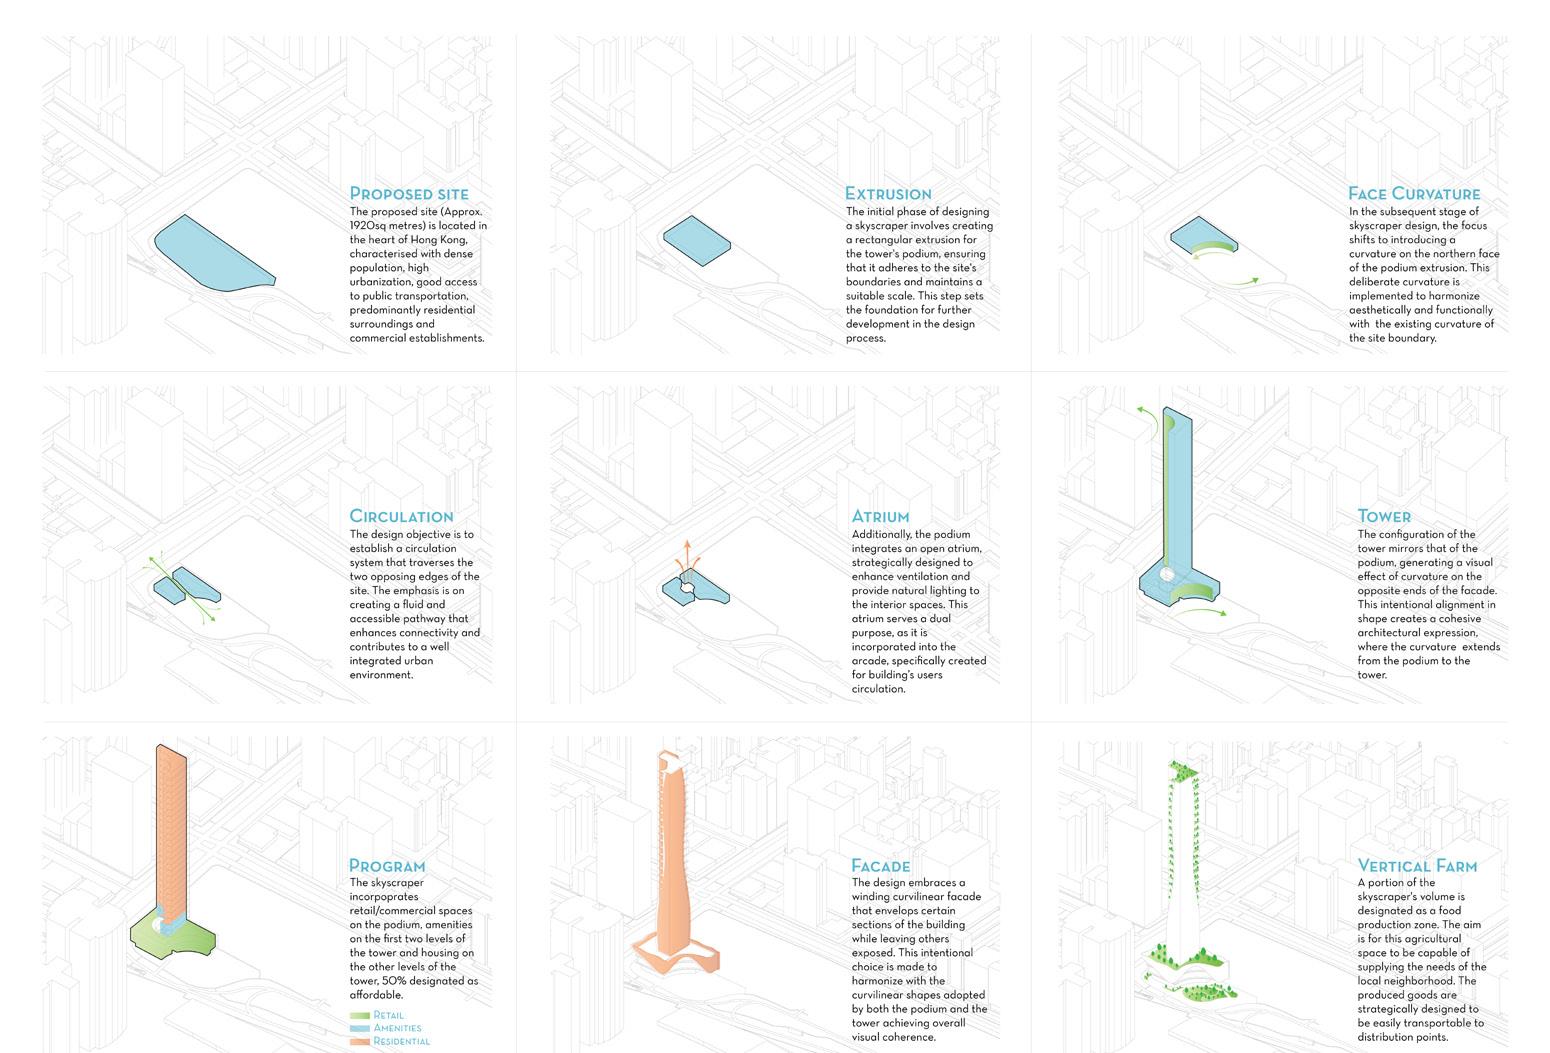
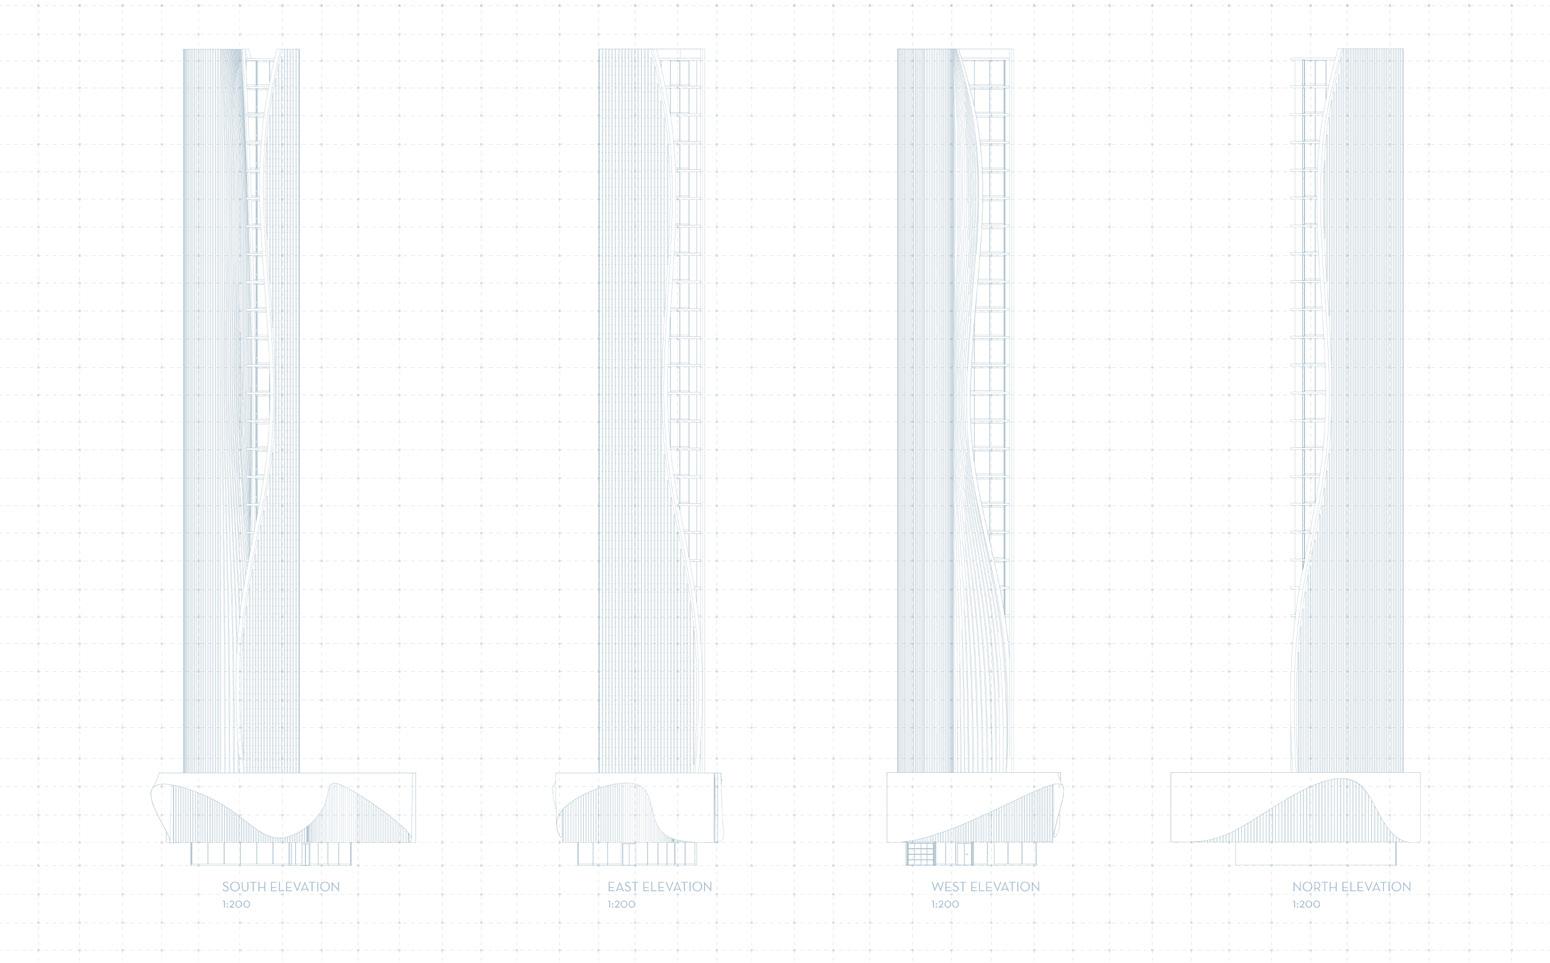
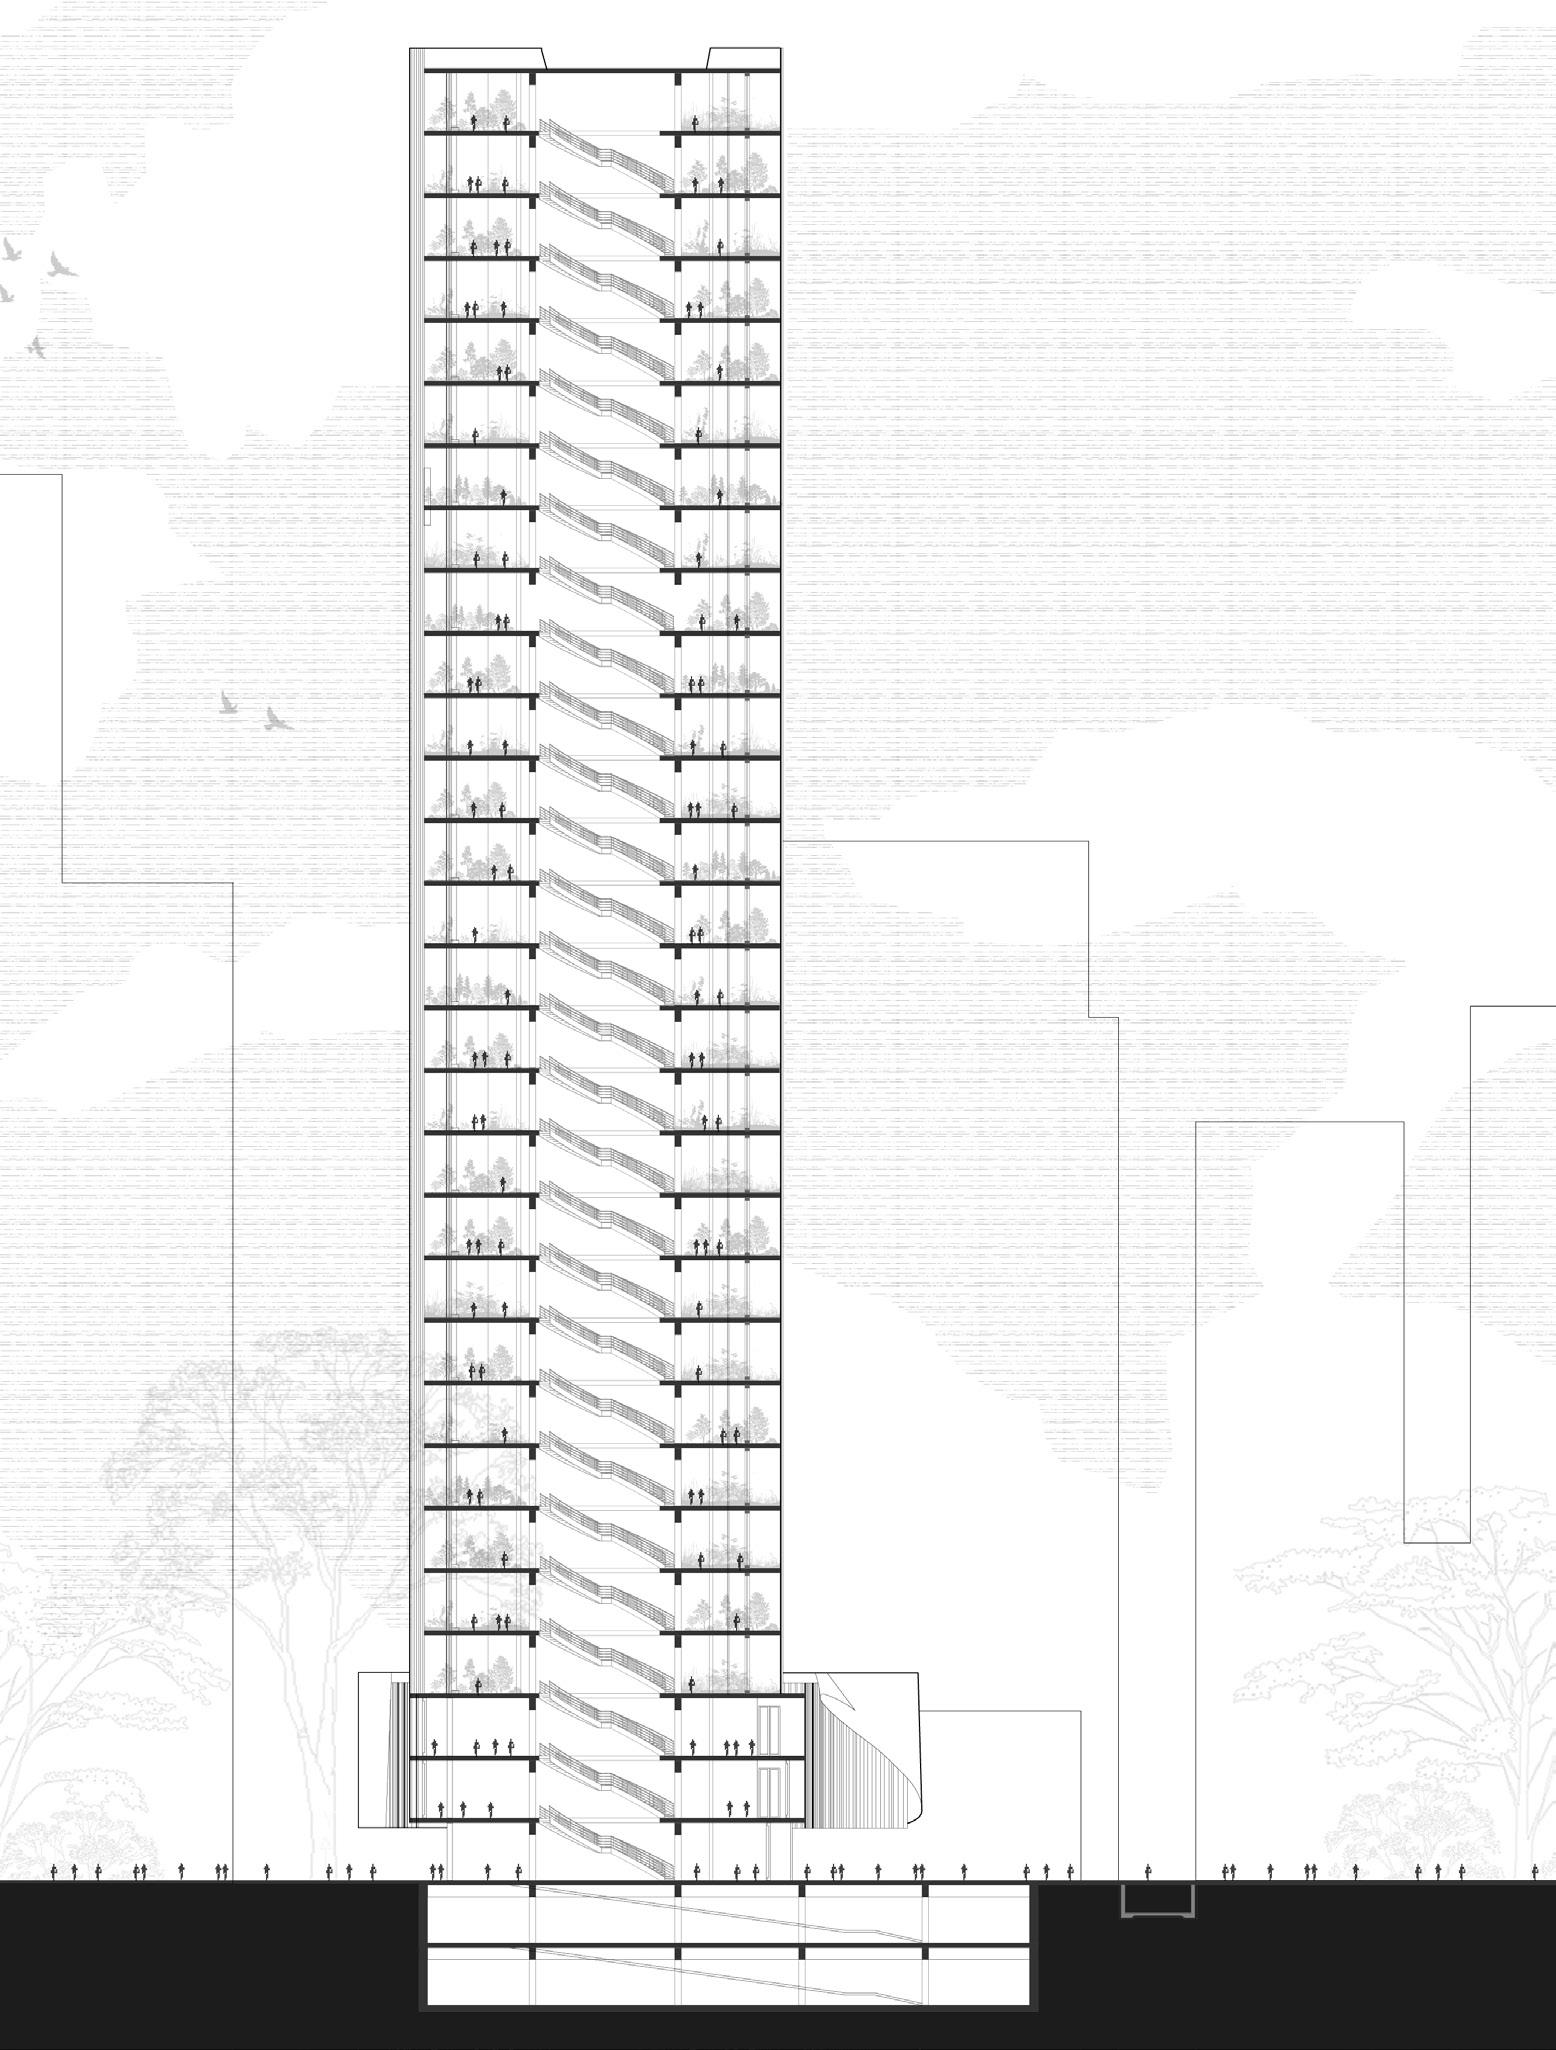
24 25 2023 Architecture VERTICAL URBAN FARMING Elevations Concept Development 1 2 3 1 3 2 4 5 6 7 8 1 1 2
2
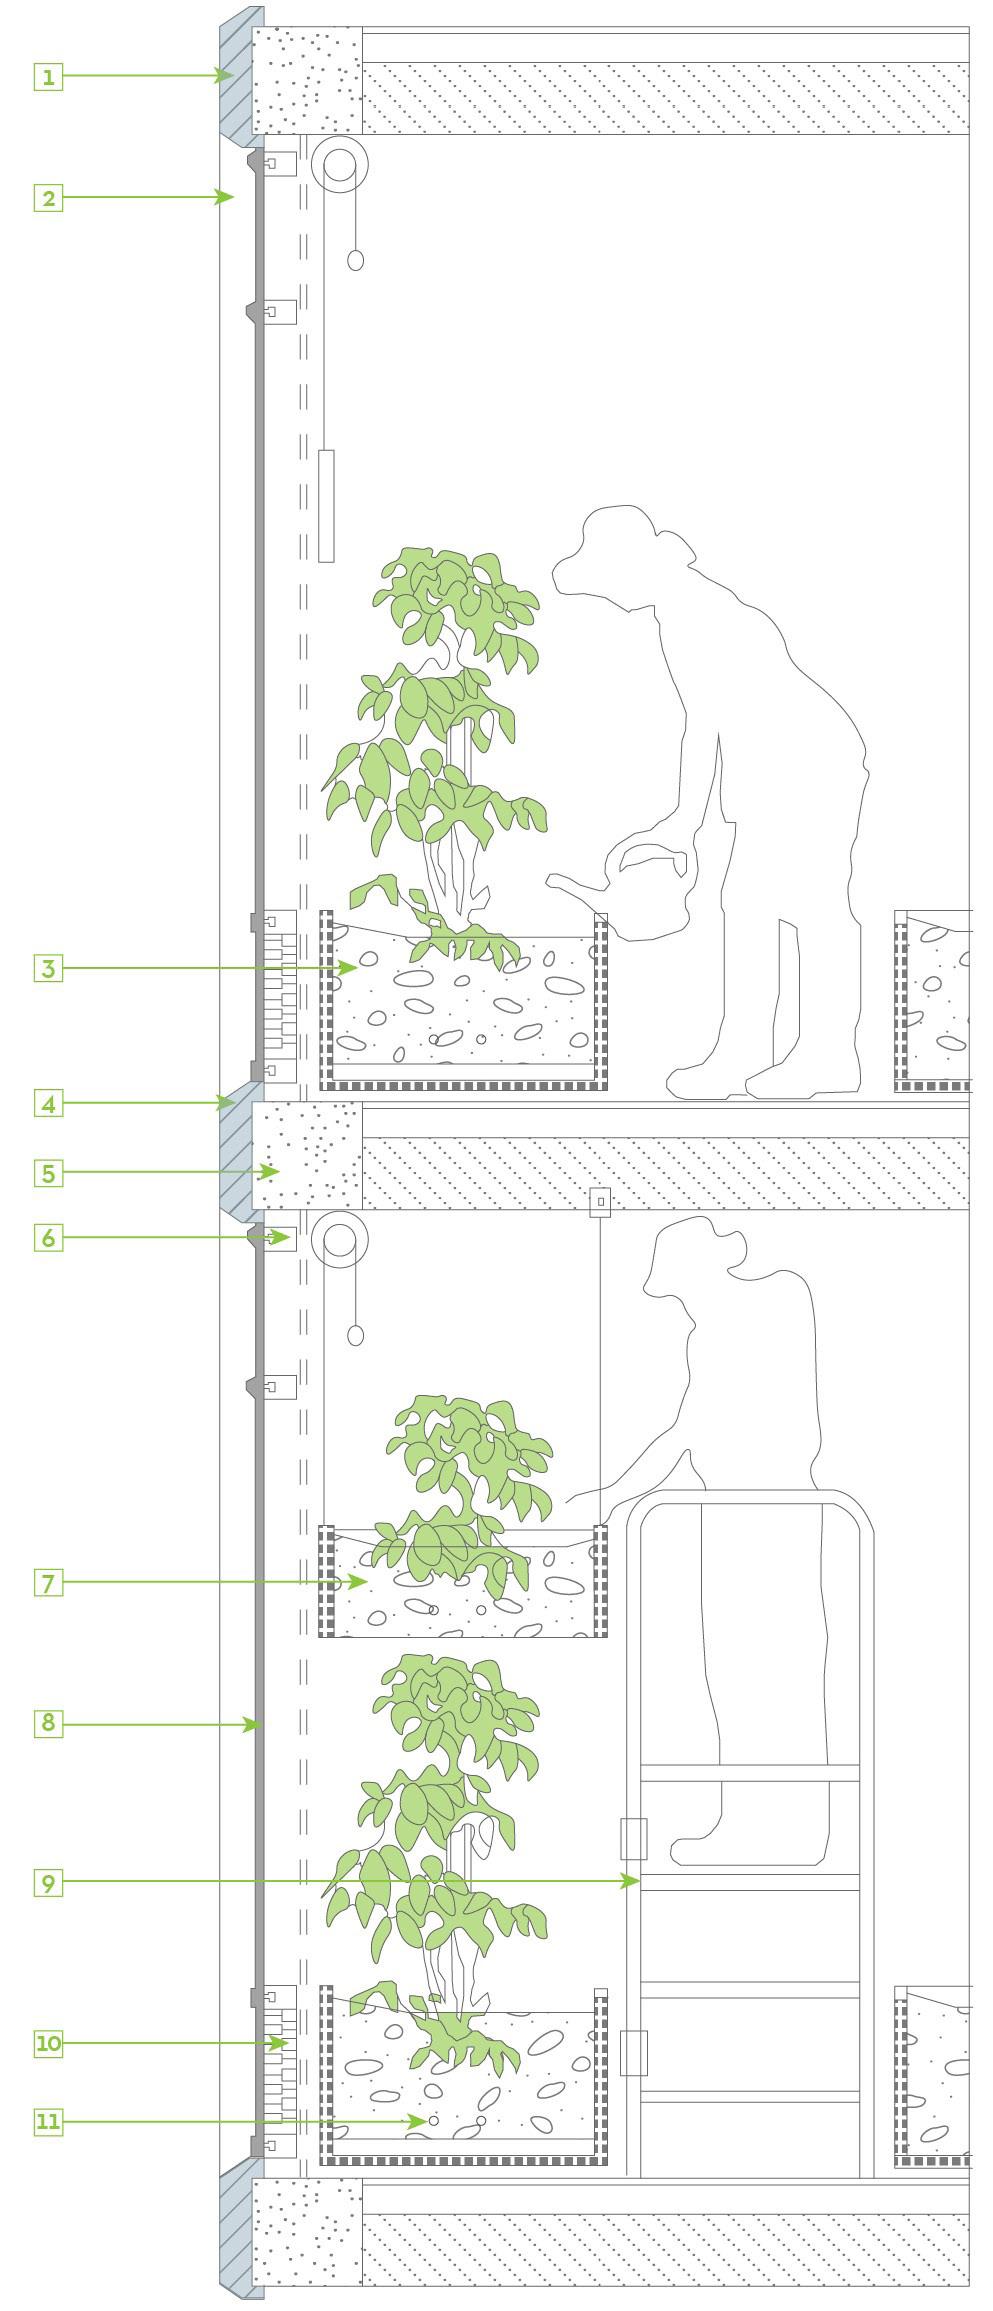
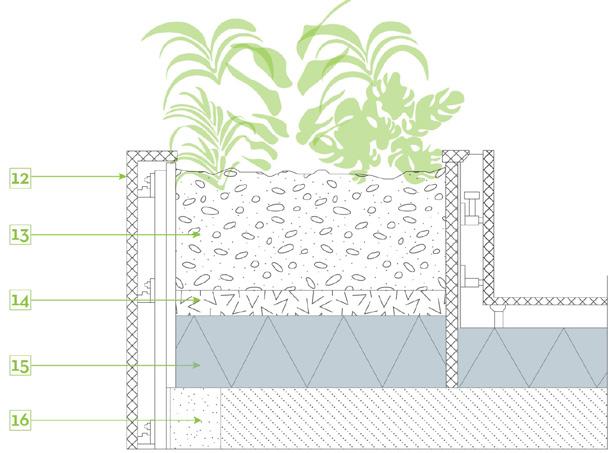
75mm rainwater downpipe
Fixed Container ( 500 x 800mm)
Oxidized Concrete Coating
Concrete structure (300 x 300mm)
Ventilation
Hanging Container (300 x 300mm)
Light Facade Double glazing grid panel
Mobile Platform
Poly-carbonate wall + wood wool
Lower temperature heating system
18-20mm Tk. Vertical Granite Stone Cladding
Planting Soil AS/SPECs
200 GSM non woven Geo+Fabric as Filter
PCC Screed to lay sub grade slope to drainage
Precast concrete curb AS/Approved sample set 900 x 900mm Cast Iron Cover
300mm thick cement/sand grout
12mm thick plaster on R/C
200mm thick vertical mastic asphalt
100mm thick masonry protective walling
200mm thick R/C tank wall
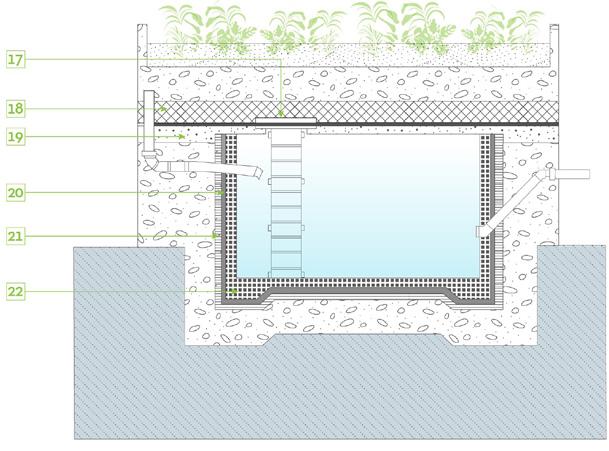
Section Scale 1:100
26 27 01. 02. 03. 04. 05. 06. 07. 08. 09. 10. 11. External Thermal Insulation
12. 13. 14. 15. 16. 17. 18. 19. 20. 21. 22.
Rainwater Harvesting
2023 Achitecture VERTICAL URBAN FARMING
Vertical Famring
28 29 2023 Achitecture VERTICAL URBAN FARMING

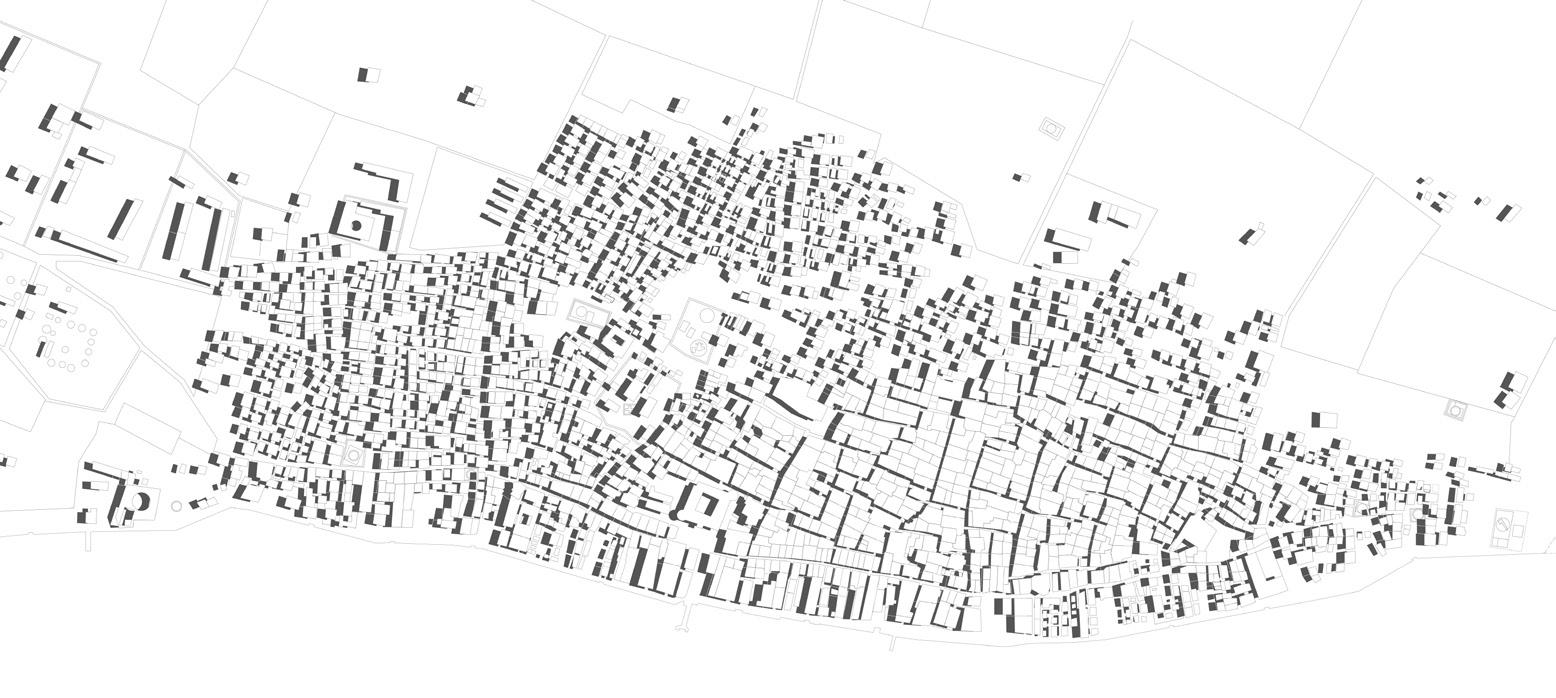
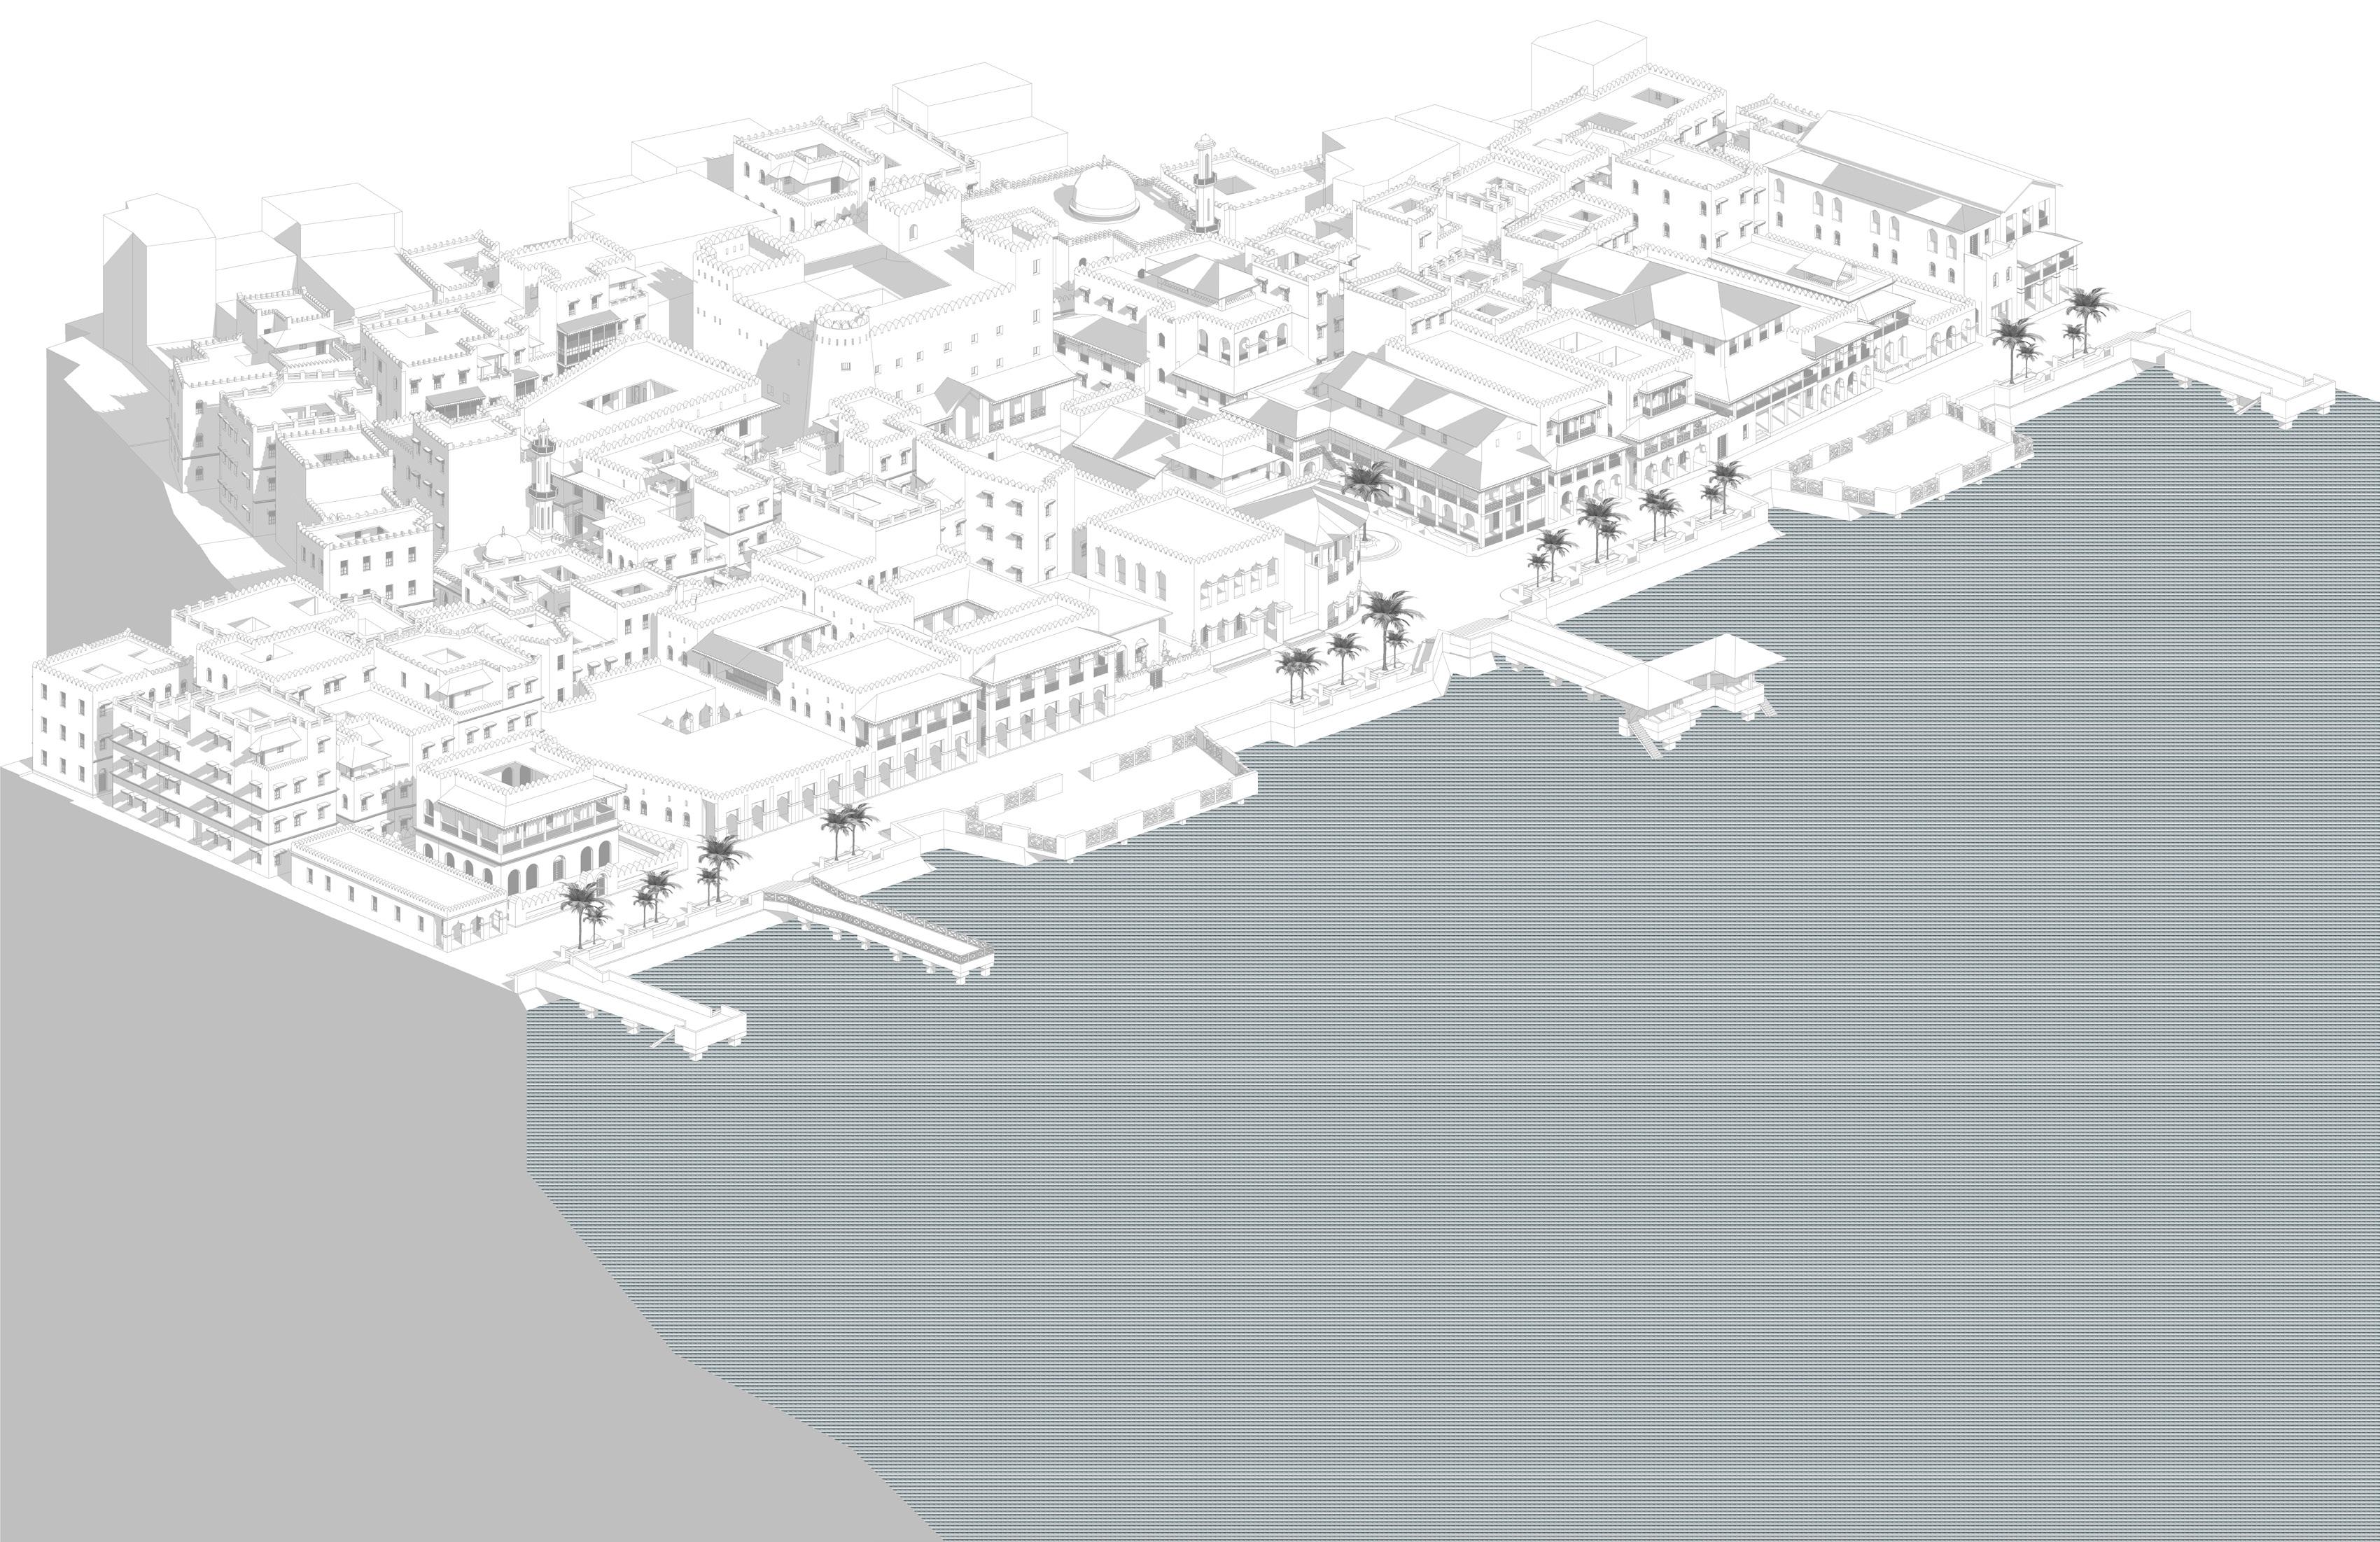
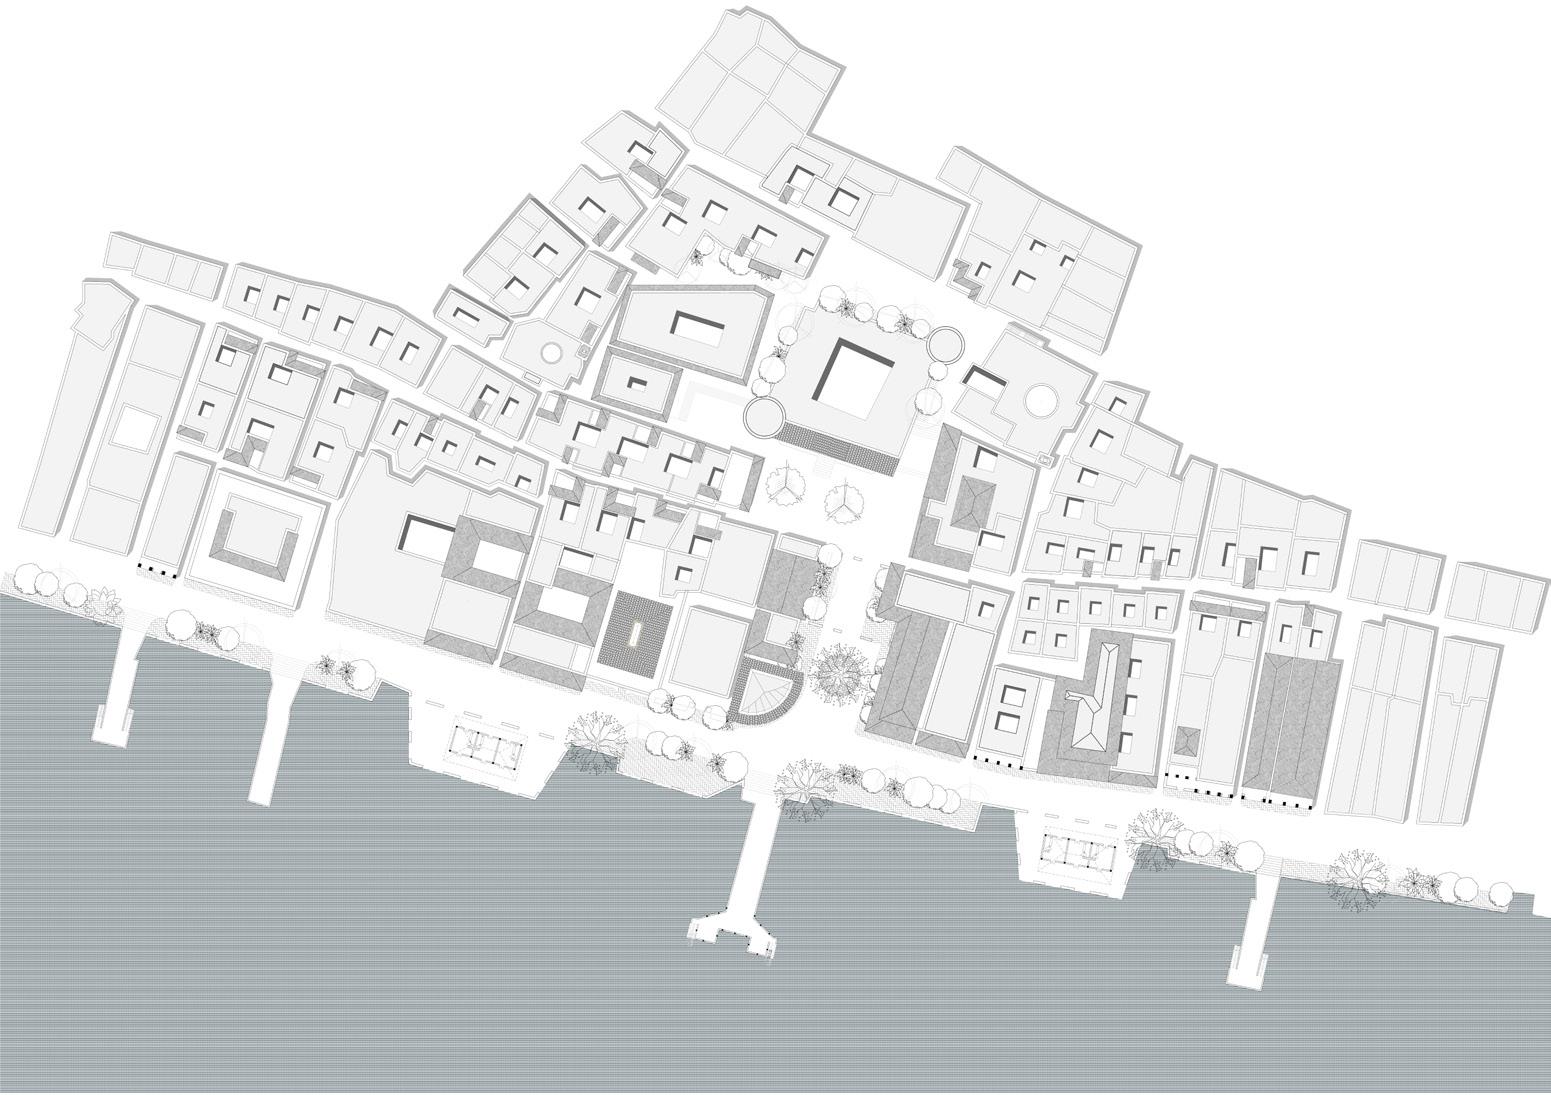
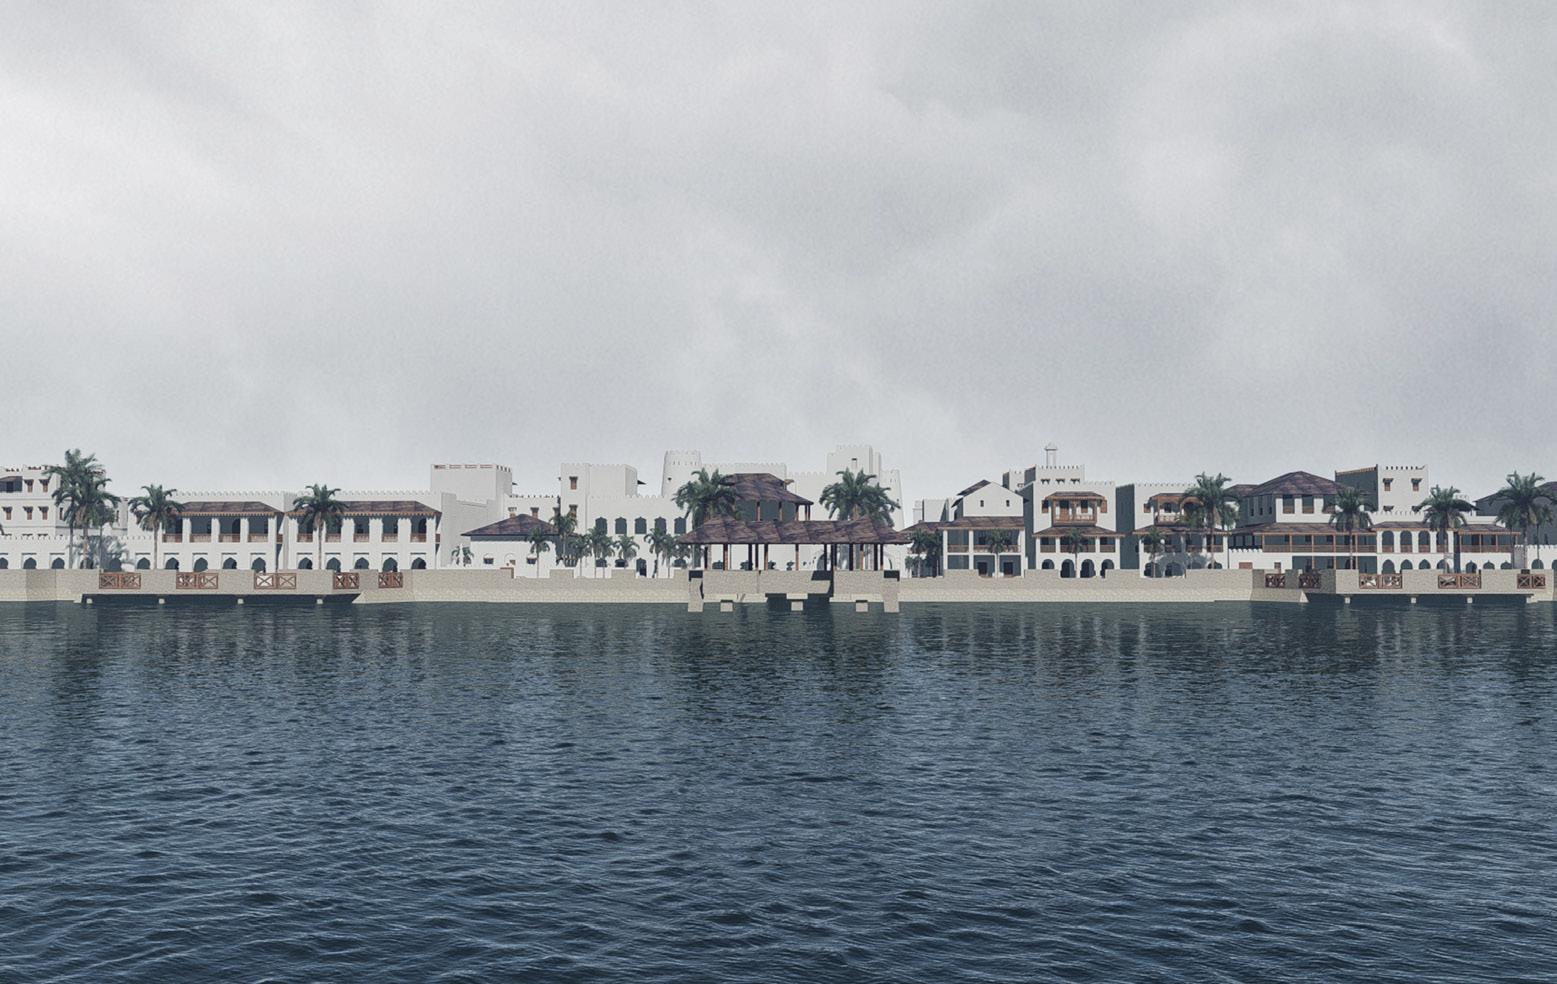
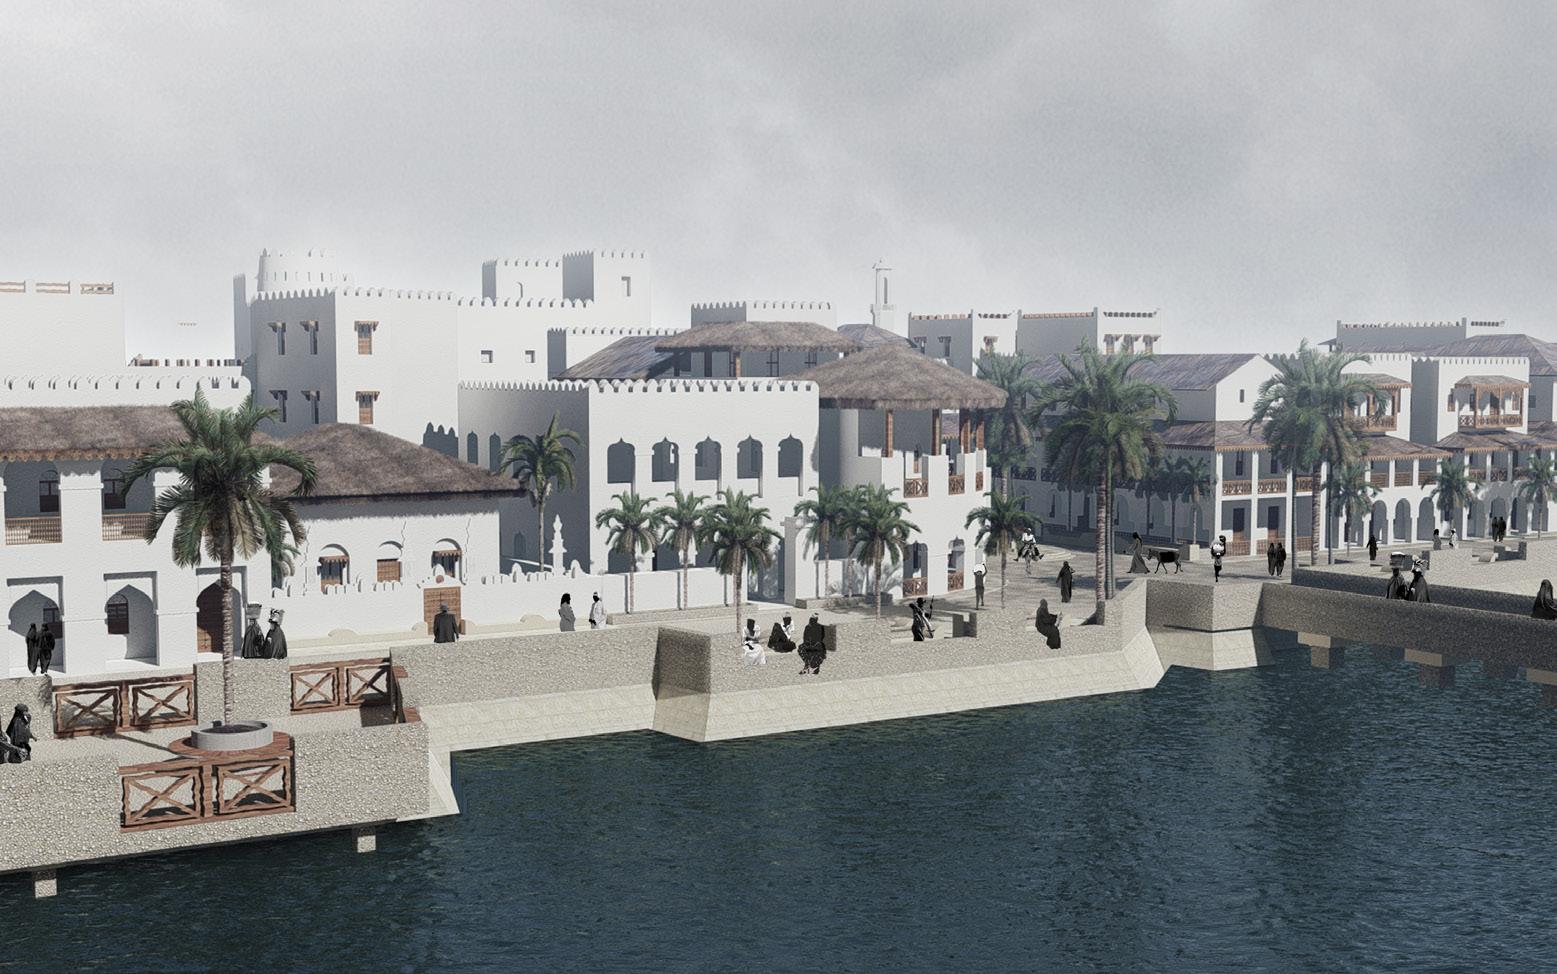
03 REDEVELOPMENT OF MKUNGUNI SQUARE
Urban Waterfront Conservation Redevelopment
Year : 2022
Project : B.Arch Thesis Project
Site Location : Lamu, Kenya
Credit : Individual project
Role : 100%_ Research, Design, Presentation
Applications : Revit, Adobe Illustrator, photoshop, Indesign, Light room, Lumion
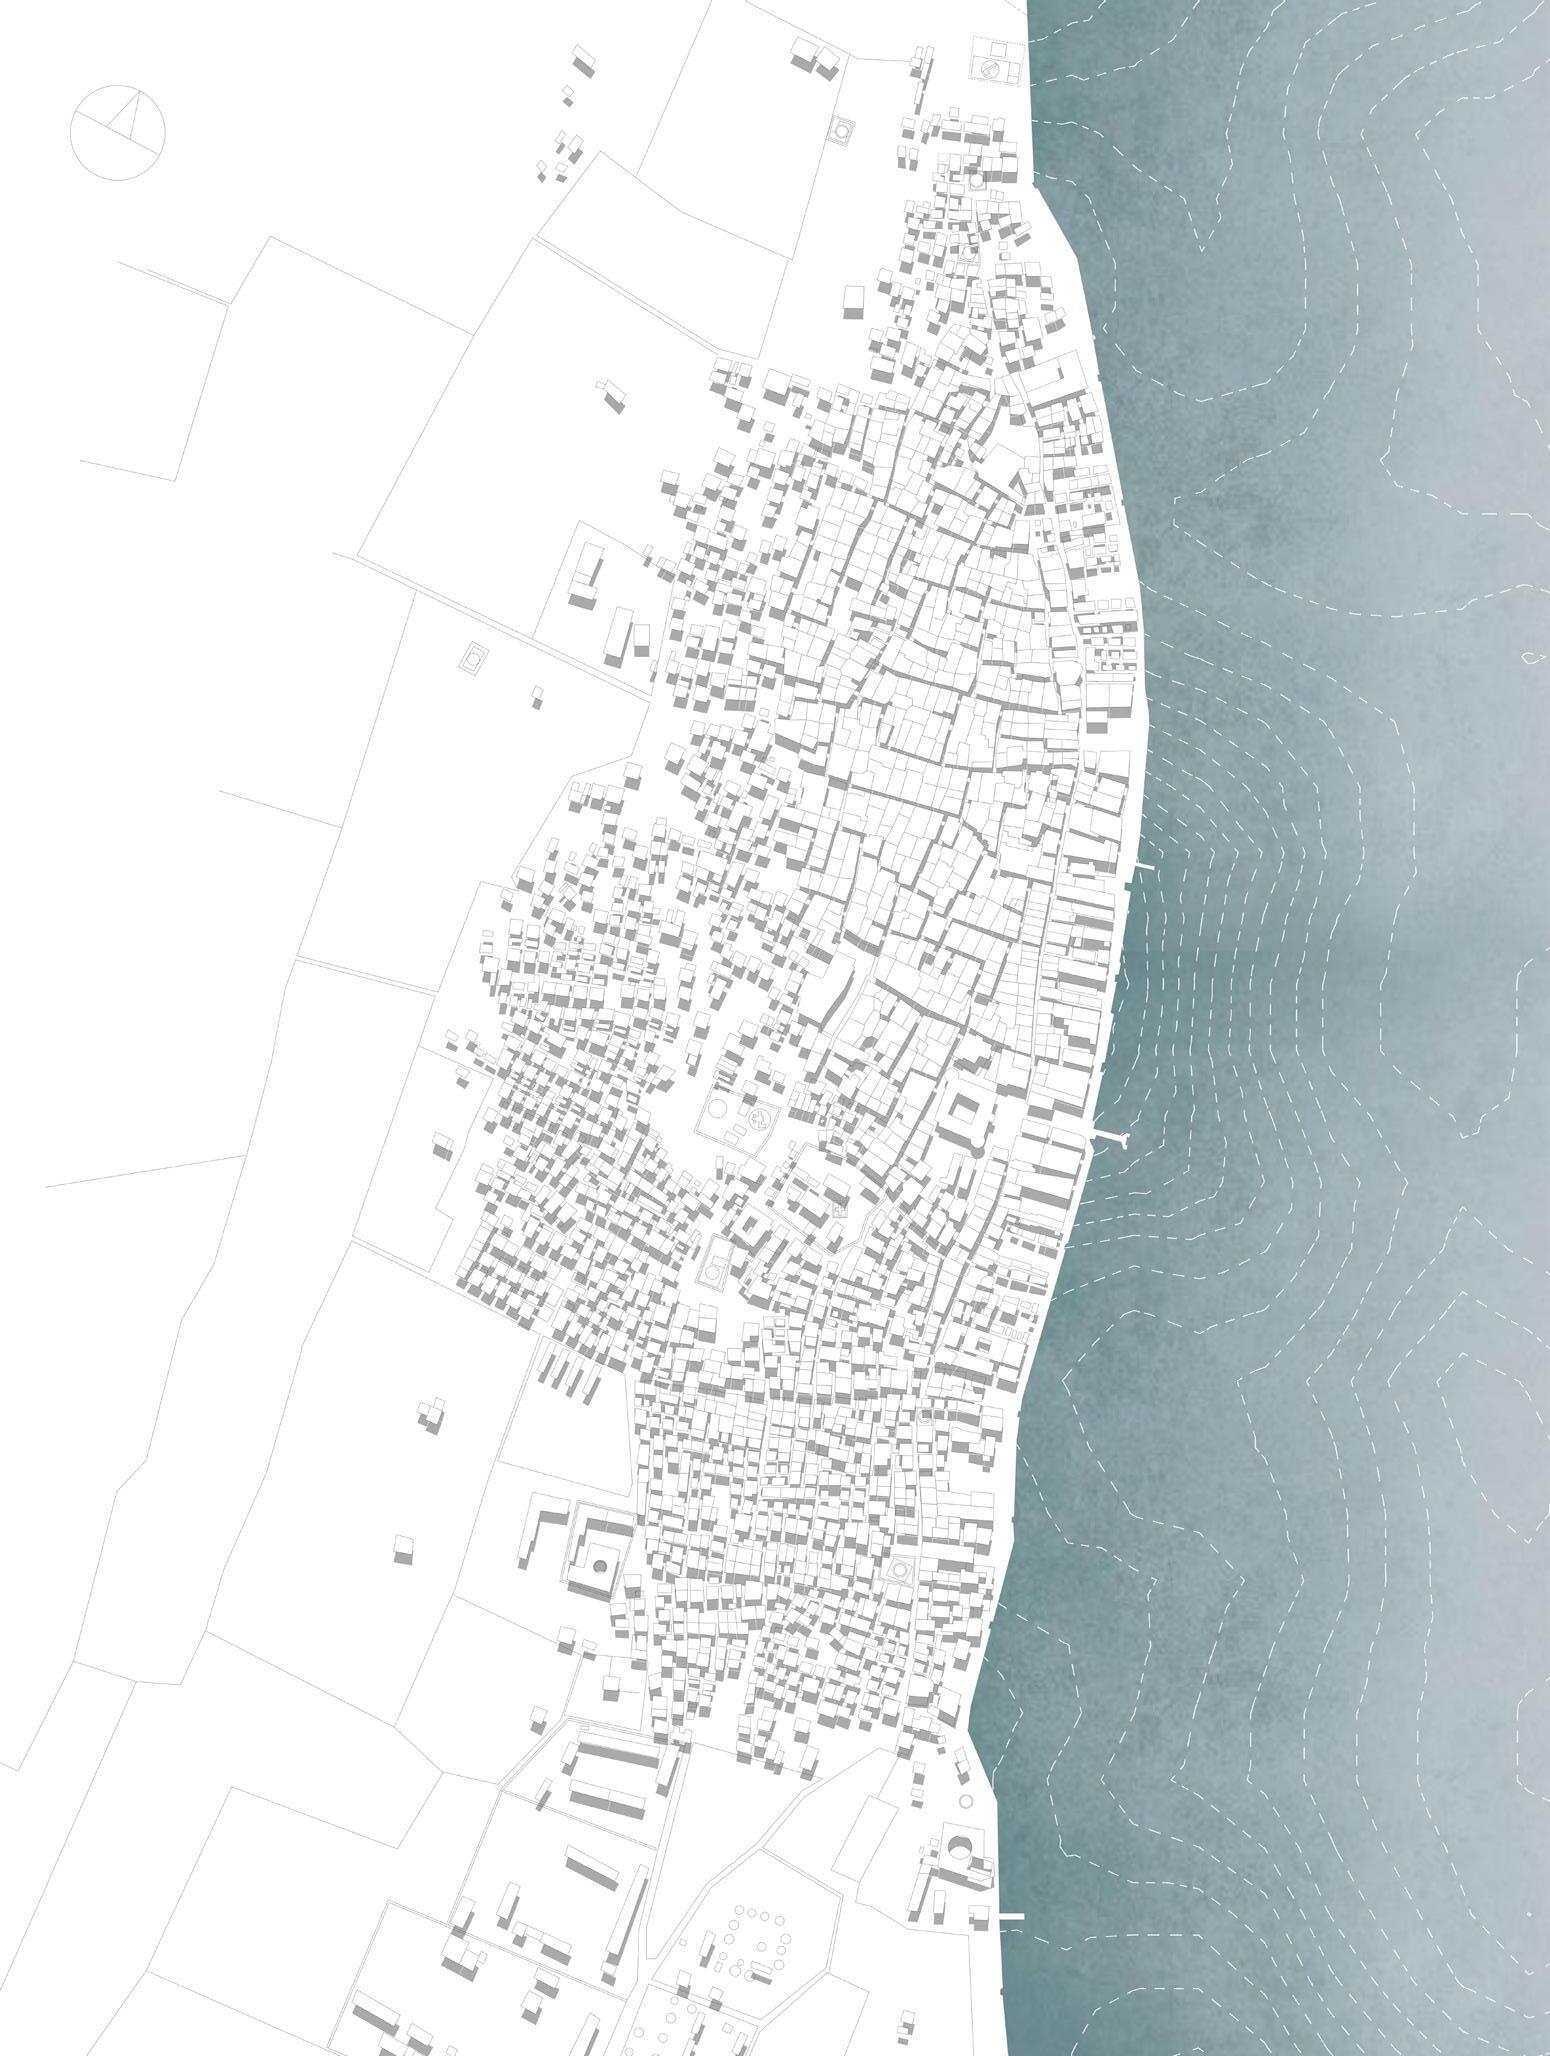
Old townLamu has survived into the twentieth century due to several fortunate circumstances, the remoteness of the area and the abesnce of roads and vehicles on the island have prevented many irreversible changes associated with modernization. At the same time, Lamu’s position as a regional centre and its active seaport have ensured the continued economic well-being of the town. Lamu has thus been spared the fate of so many other historical towns around the world which have either been transformed by uncontrolled development or abandoned as a result of economic decline. However, a combination of limited resources and rapid population growth is putting enormous pressure on the Old town, its buildings and its infrastructure.These pressures and changes will undermine and eventually destroy the historical structure and character of the Old town. Both Lamu’s natural and man-made resources will need to be carefully planned in the future if the town is to remain a liveable urban centre and a cultural asset for all of Kenya. The only means of achieving this objective is with a policy of conservation which fosters careful management of resources and promotes balanced growth and development.
30 31
Old Town Lamu Architectural Constants
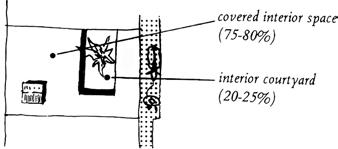
Plot coverage Street Frontage Access to the house Coral walled streets
The average size of plot is between 160 and 180sq metres. For a new house, an average plot coverage of 75-80% is recommended.
The remaining 20-25% is used as open space, as a garden or a traditional interior courtyard to guarantee sufficient lighting and air for the house.
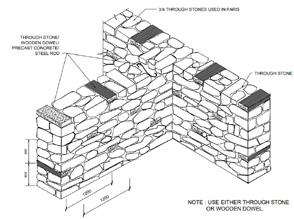
Building materials
Coral limestone is the traditional material in Old town Lamu. Walls built with coral blocks are finished with either with thick lime mortar reinforced with small coral chips or a smooth render of coral lime plaster.
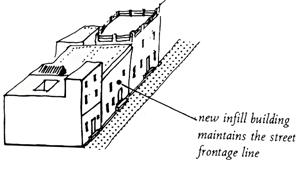
To guarantee visual continuity with the exteriors of the adjoining historical structures, the new building is built to line up with the adjacent buildings, never set back from the street.
In this way the frontage line which shapes
Lamu’s streets and the street to building ratio is maintained.
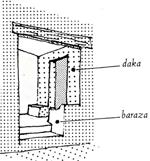
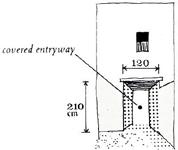
House access is the either direct of indirect. Direct access in Old town Lamu have an entrance porch or daka facing directly onto the street. There may be instances where an entrance is removed from the street and public access will have to be created. A covered entryway, wikio, is the solution.
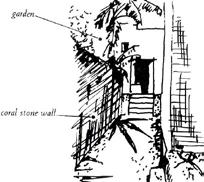
Gardens are/should be walled with coral stone to maintain visual continuity with the adjoining houses, not fenced with sticks or other temporary material. In order to maintain the street frontage line and guarantee sufficient privacy walls should reach a minimum height of 160cm [1600m].
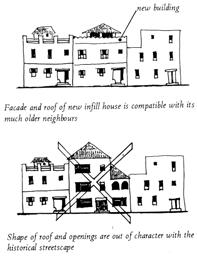
Height of Floors Building scale and massing Roof shape
Matching the overall height of the new building to the adjacent structures is important but not enough.Each floor of the new building should line up with the floor levels of the neighbouring structures which measure between 3.5 and 5 metres each.
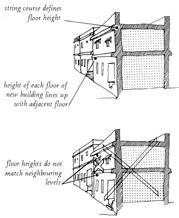
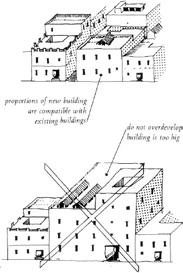
The overall volume and bulk of anew infill building must also conform to the scale and massing of the existing historical buildings around it.
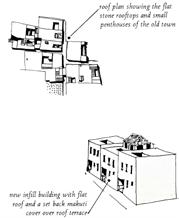
In Old town Lamu, this generally calls for a flat roof. The traditional shallow-pitched makuti roof placed at one corner of the flat roof is an excellent form to follow when covering service installations or part of the rooftop.
Seafront roof shape Openings configuration New windows Balconies
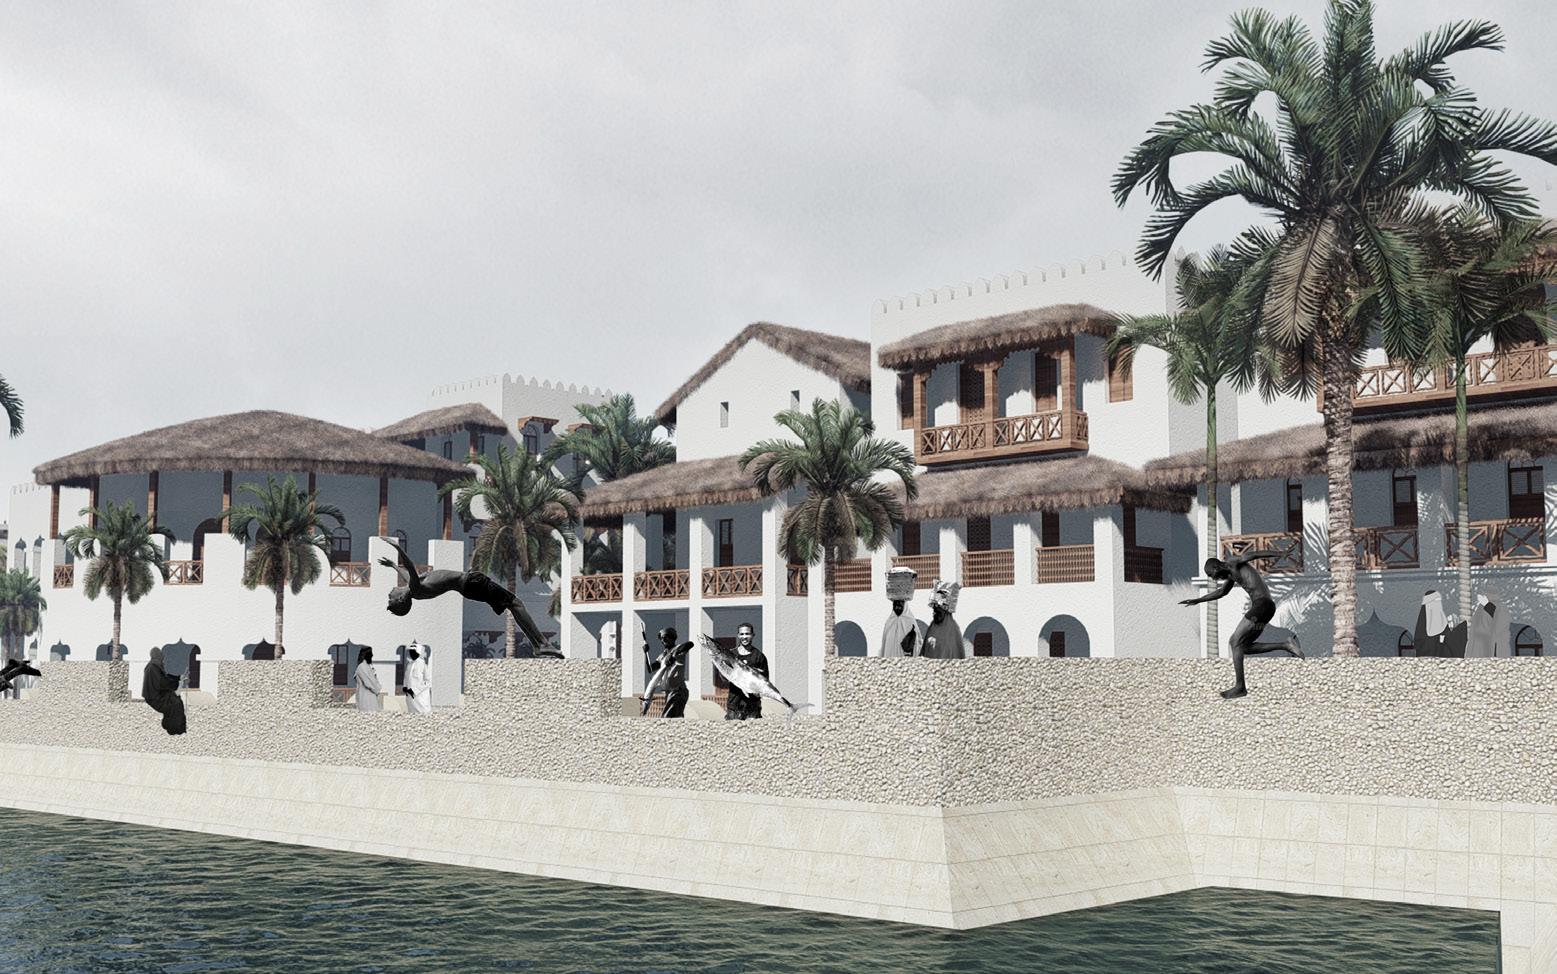
The verandah houses were built with flat stone roofs often with a crenellated parapet. Pitched makuti roofs are a recent addition. Again attention to the size and slope of the roof is important in order not to overwhelm the other seafront houses.

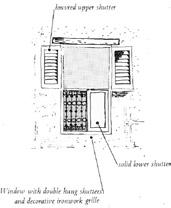
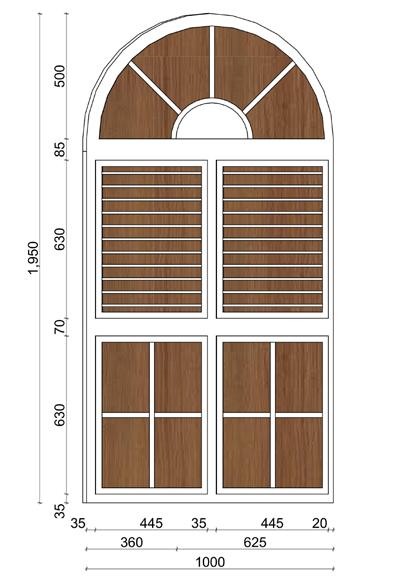
The size of openings must relate with the overall size of the facade. To ensure the structural stability of traditional buildings and to maintain the historical patterns of openings, proportions of windows and doors must be vertical, not horizontal.
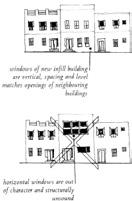
Conventional windows should be detailed with wooden frames with pabed glazing and souble shutters louvred at the top for ventilation and solid at the bottom for privacy. Decorative iron works grilles provide additional security when the bottom shutter is opened.
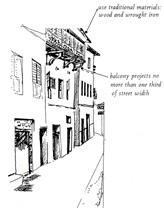
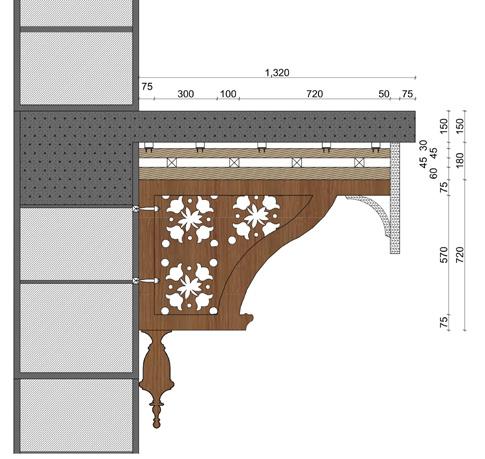
New balconies should not extend beyond one third of the street width and not exceeding 1.5metres, to avoid restricting light and air into the interior. They should be detailed with traditional materials such as wood and wrought iron.
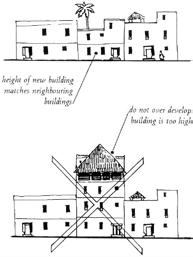
Sea Front character Bazaar street character Stone town character Building Height
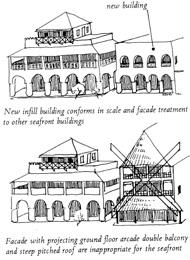
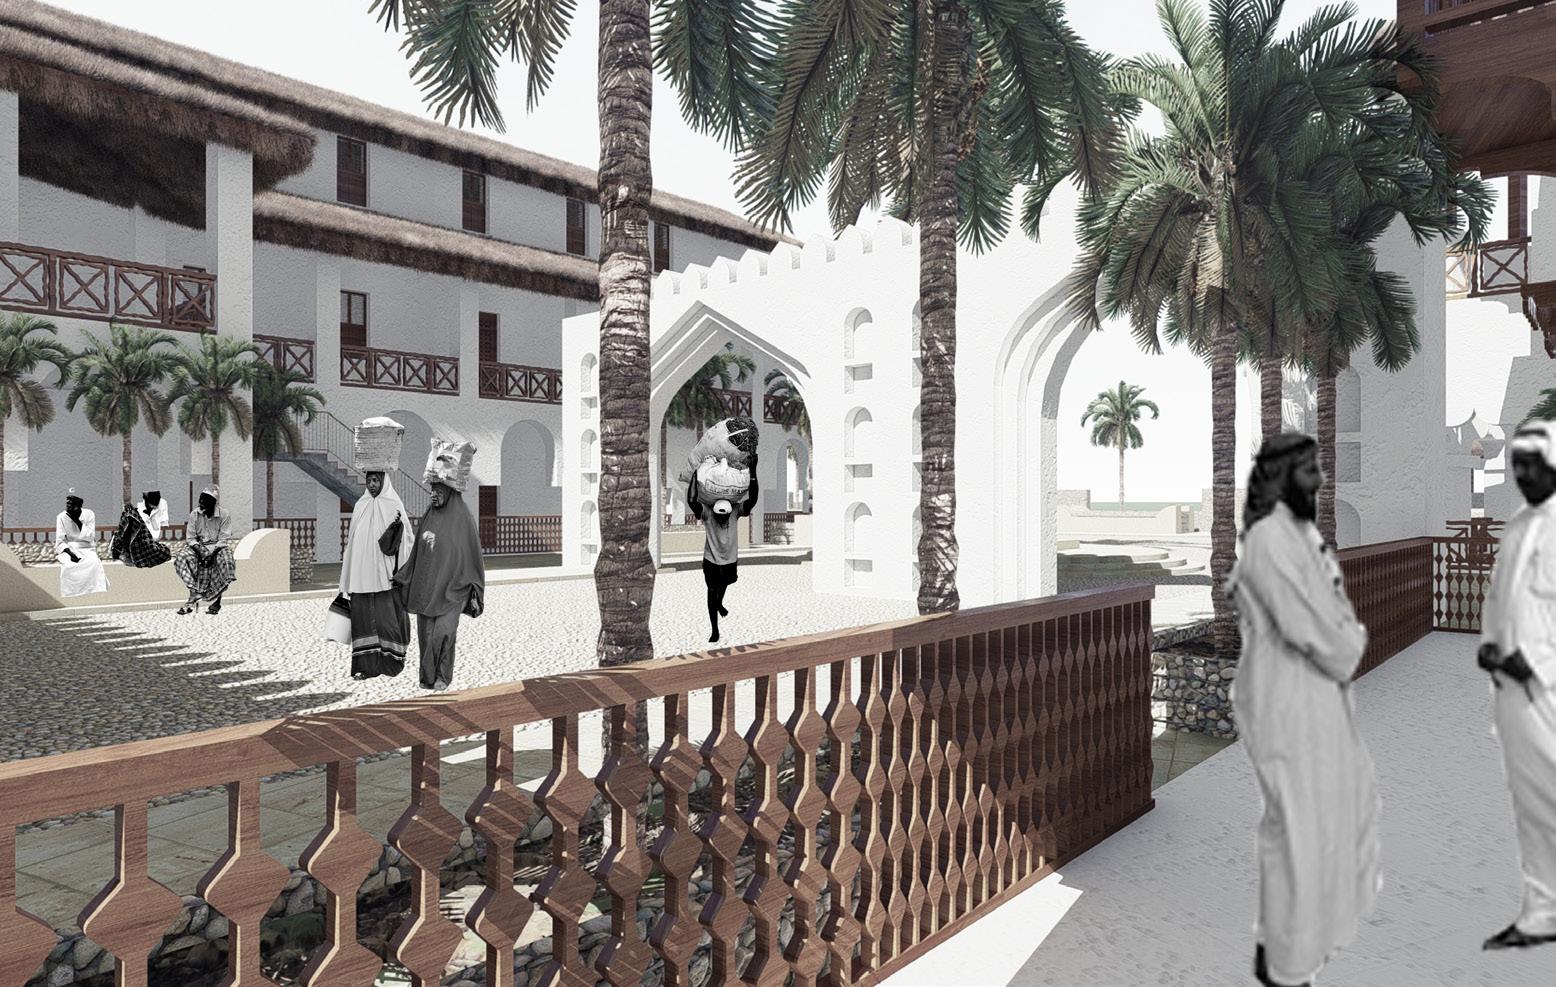
Verandah houses define Lamu’s seafront. A new building should have a solid arcade at ground level topped by a light wooden balcony with a sloping roof. The size and slope of the balcony roof to should not be too large or steep.
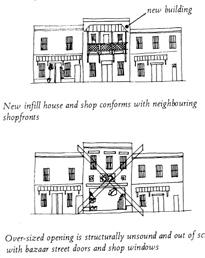
Windows and the doors should conform in size. A projecting balcony should be detailed with traditional material. All windows shoud be fitted with double shutters. Shop signs should be in proportion with the narrow scale of the street.
New buildings should avoid decorative elements which would make the new building appear out of place and wall thickness should average 225250mm, which will keep buildings cool and dry. Windows should be detailed in wood.
The height for buildings in the historical area of Lamu is 2 storeys, which is constistent with the height of traditional buildings. New conventional buildings can go upto 4 storeys as long as they maintain the character.
Historically Significant Buildings
Significant Grade 1
Significant Grade 2
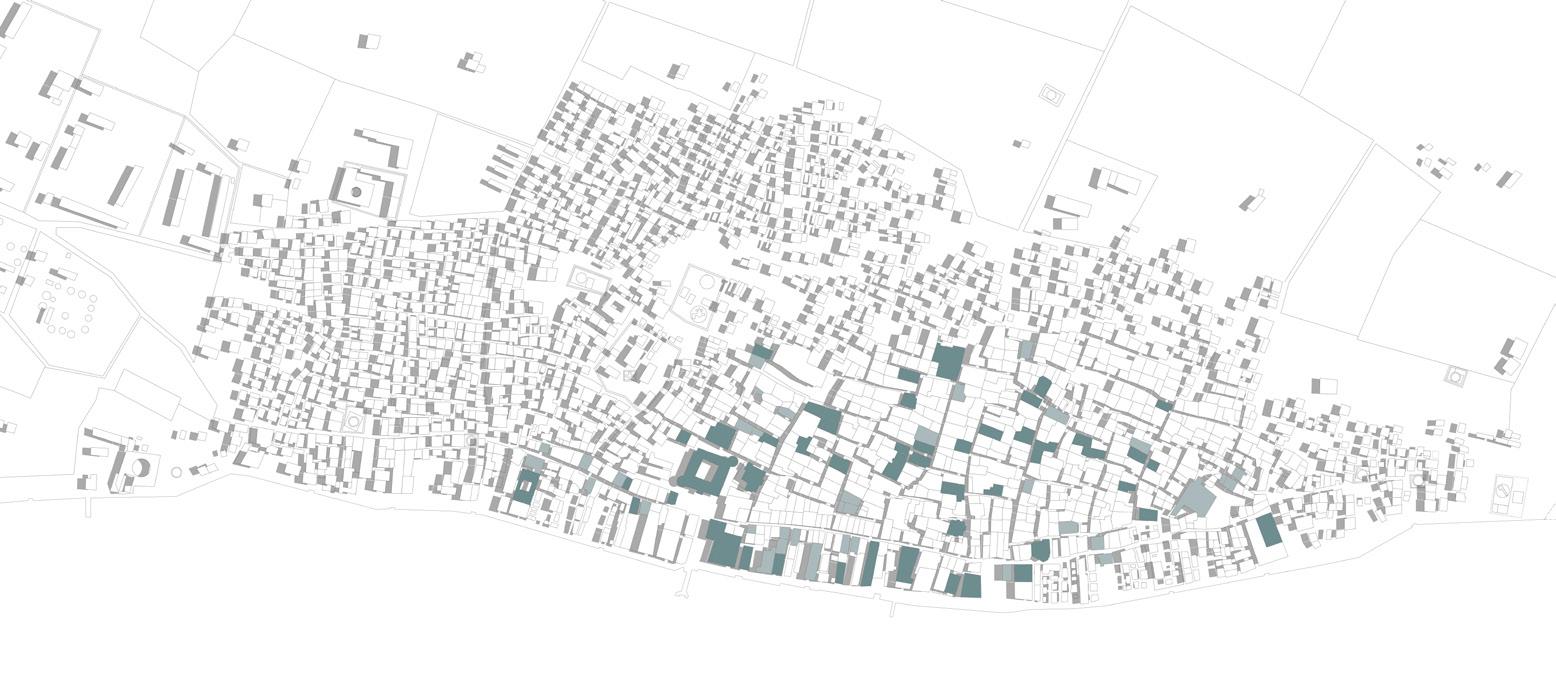
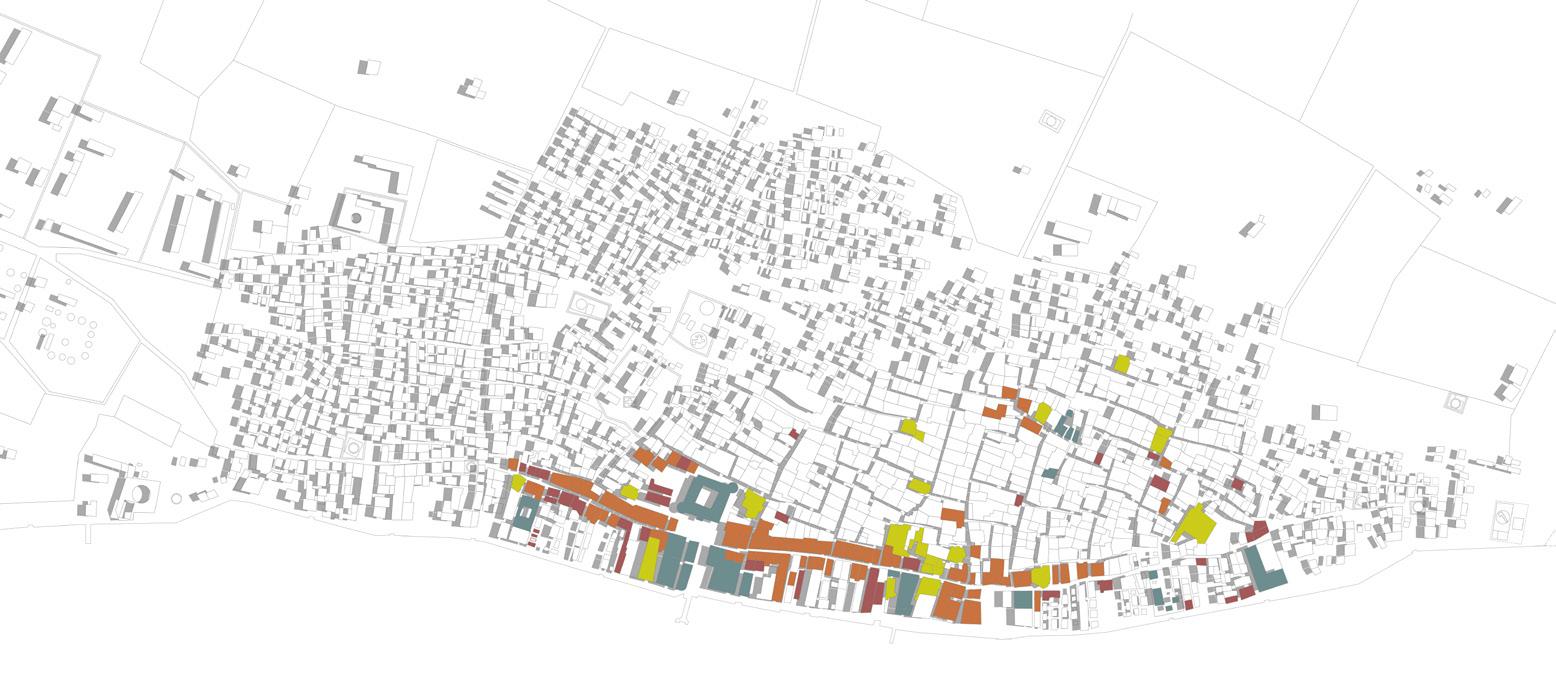
Institutional use
Mixed use
Commercial use
Religious use
Residential use
32 33
2022 Architecture HISTORICAL URBAN REDEVELOPMENT
Street Geometry Land use
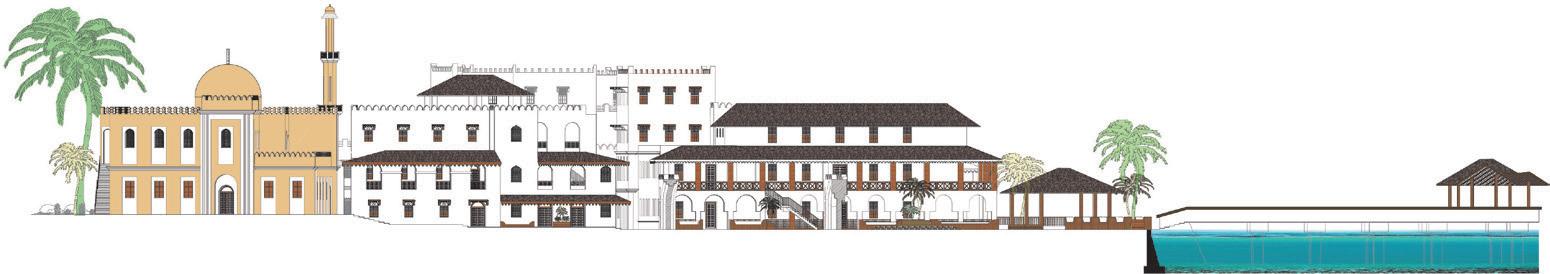
Waterfront elevation
Scale 1:200
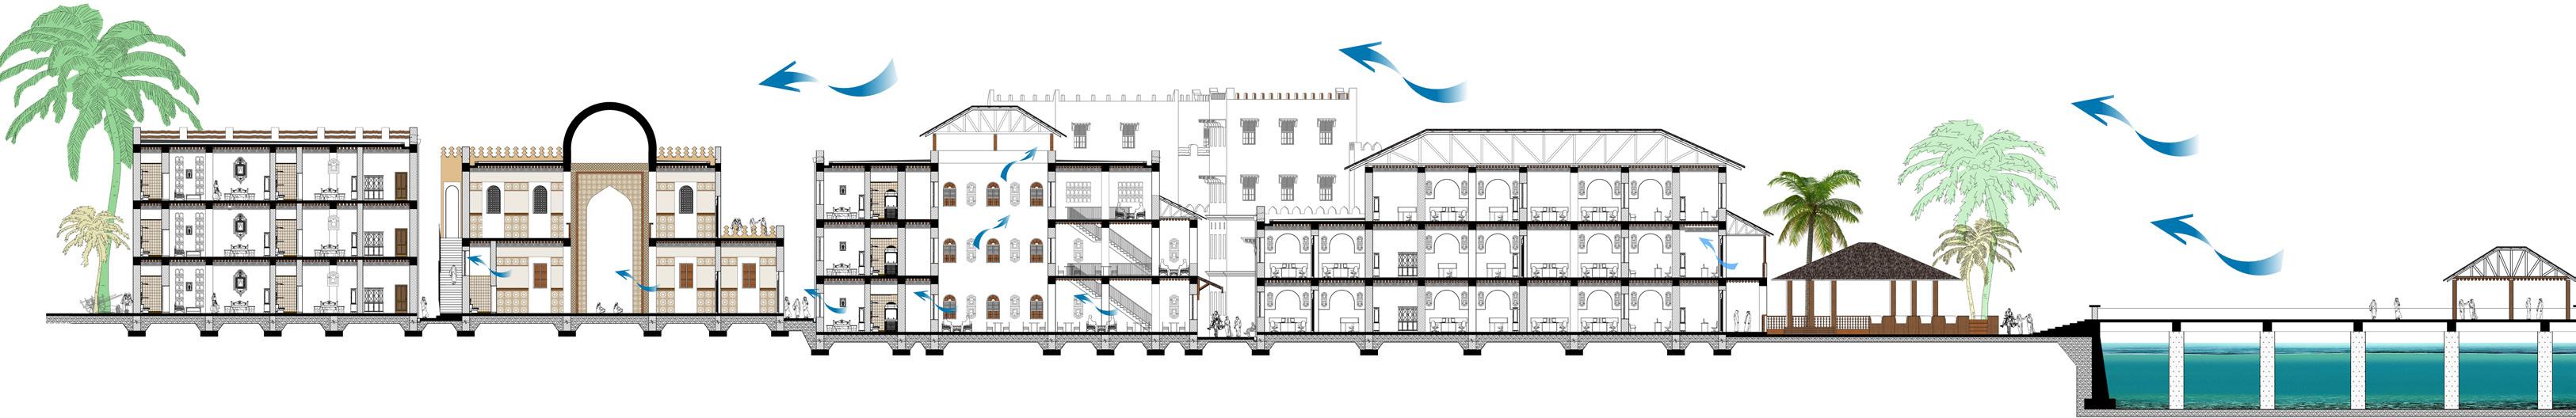
Waterfront section
Scale 1:200
Ground floor plan
Scale 1:200
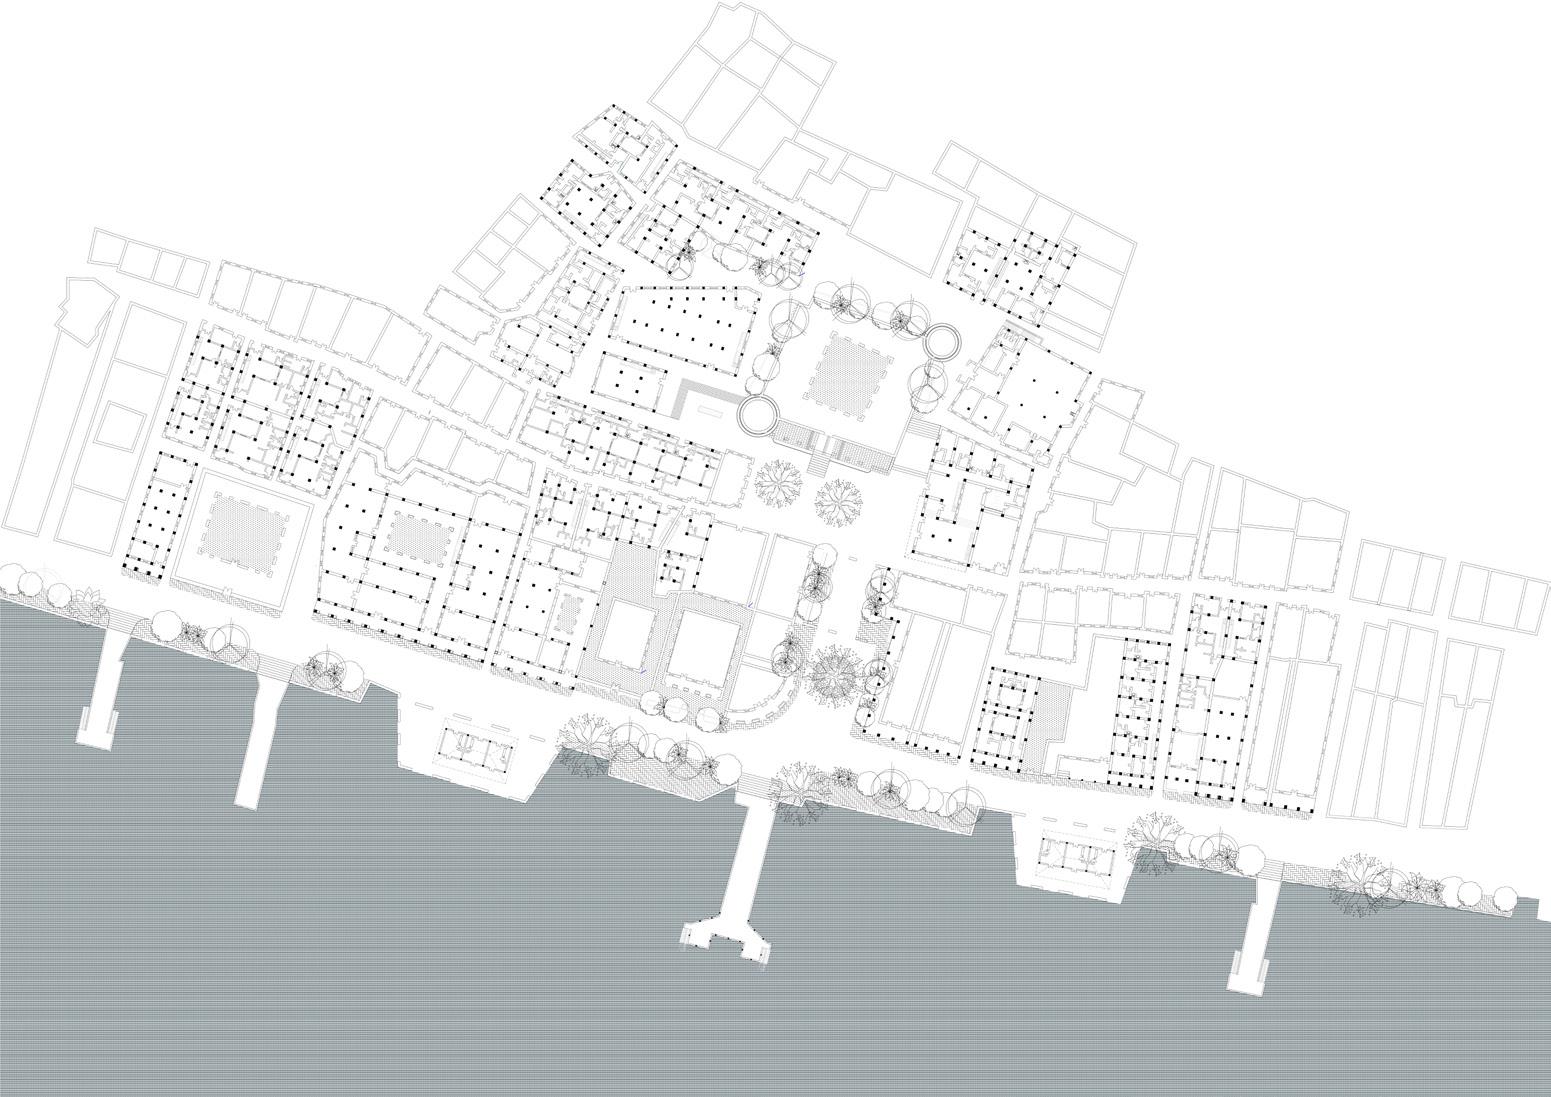
Roof plan
Scale 1:200
36 37
2022 Architecture HISTORICAL URBAN REDEVELOPMENT
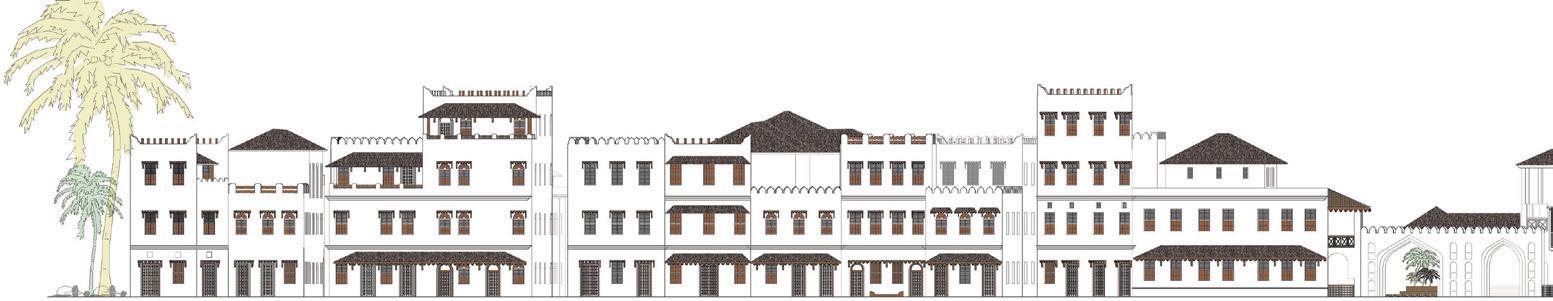
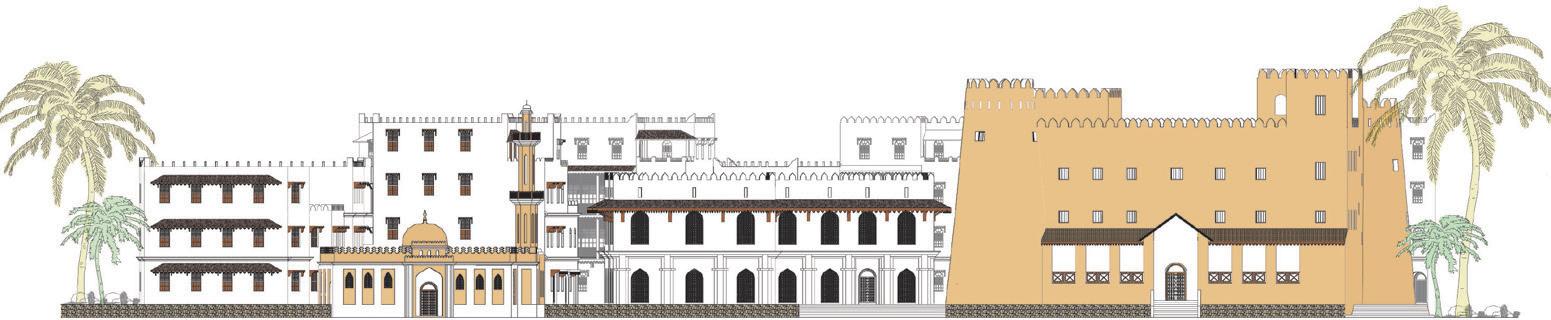
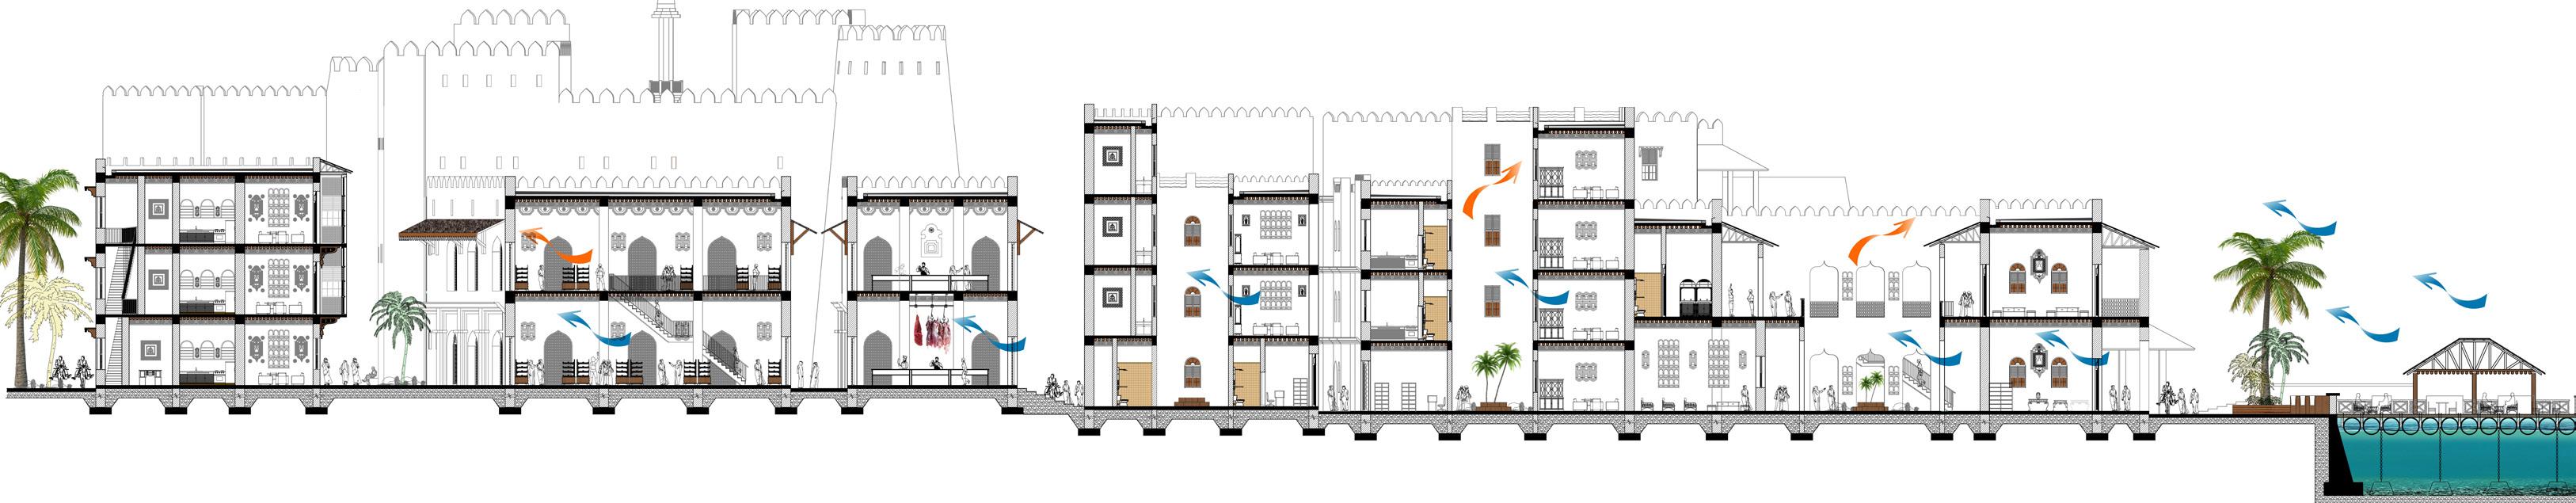
Longitudinal street elevation
Scale 1:200
Cross-sectional street elevation
Scale 1:200
Cross-sectional street elevation
Scale 1:200
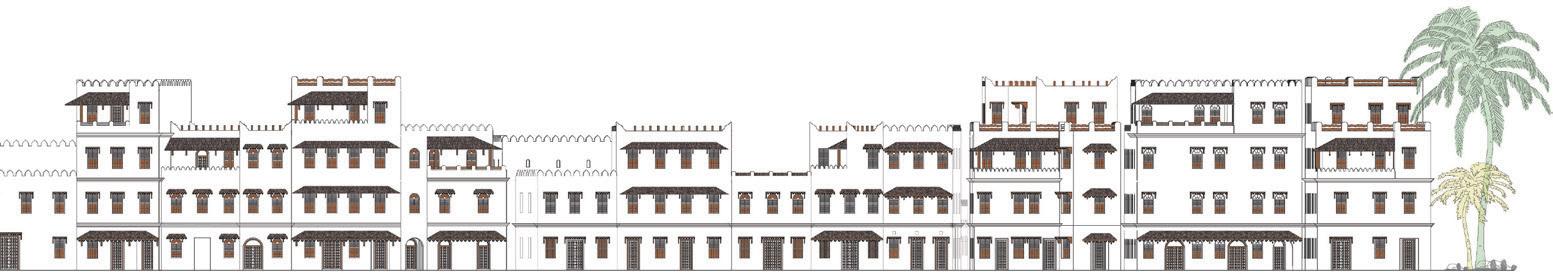
Longitudinal street elevation
Scale 1:200
38 39
2022 Architecture HISTORICAL URBAN REDEVELOPMENT
Scale 1:200
Scale 1:20
Scale 1:20
Scale 1:20
Scale 1:20
Scale 1:200
40 41
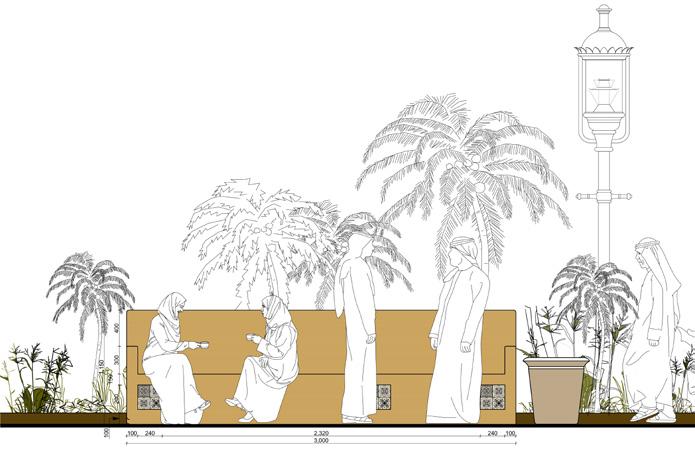
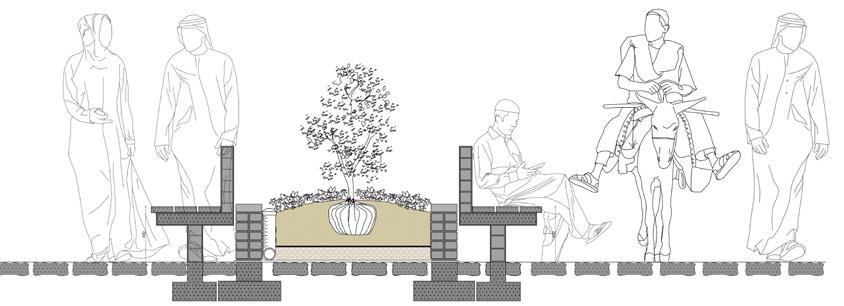
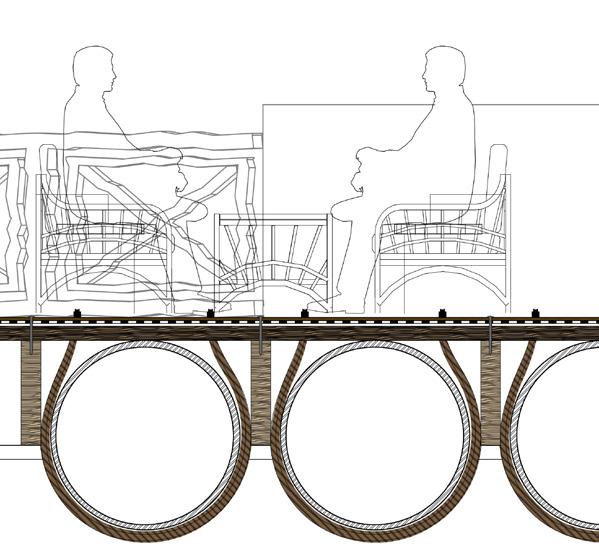
Cross sectional street elevation
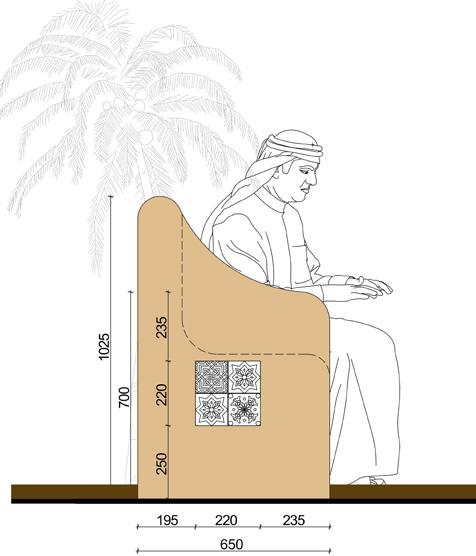
Landscaping detail (Planter seat)
Swahili stone seat detail
Cross sectional street elevation
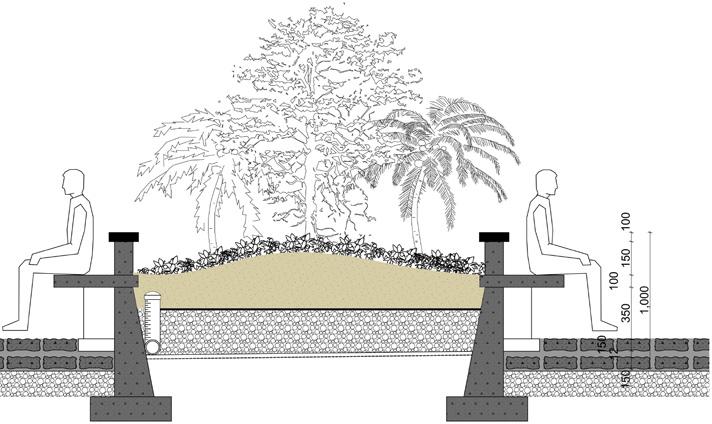
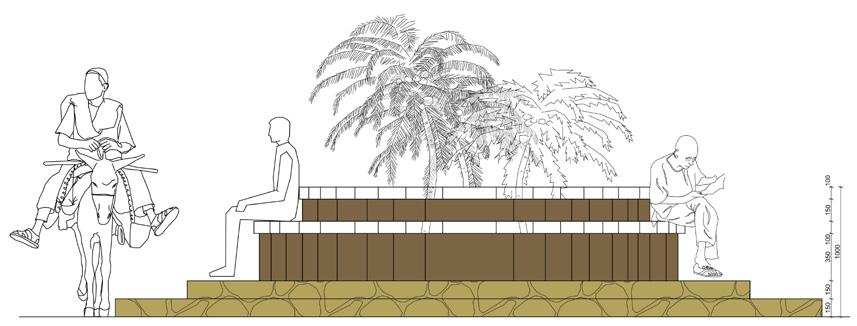
2022 Architecture HISTORICAL URBAN REDEVELOPMENT
Octagonal shaped planter seat detail
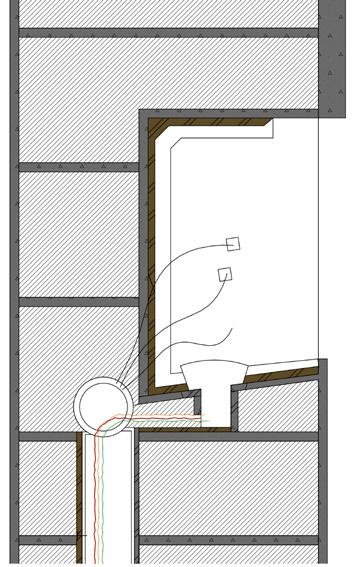
Floating food kiosks detail
Scale 1:20
Scale 1:50
Scale 1:20
Scale 1:20
Scale 1:20
Scale 1:20
Scale 1:50
Scale 1:20
42 43
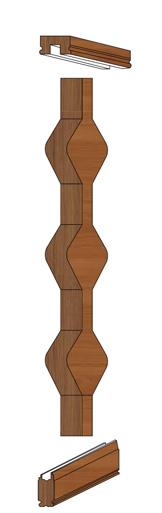
Swahili balcony support detail
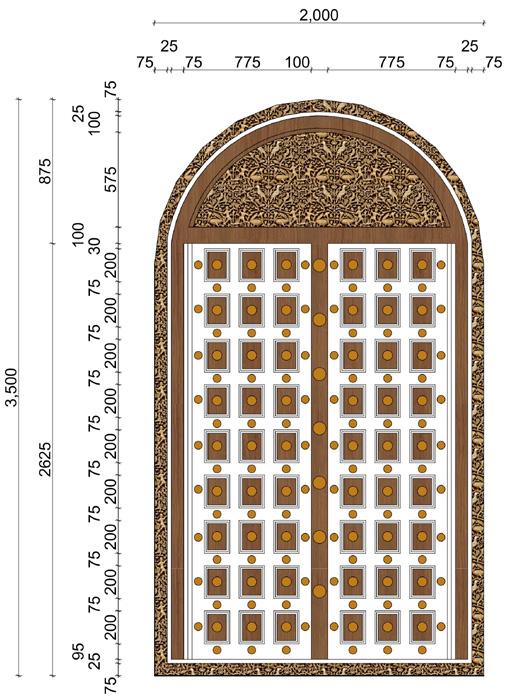
Swahili window detail
Swahili gujarati door detail
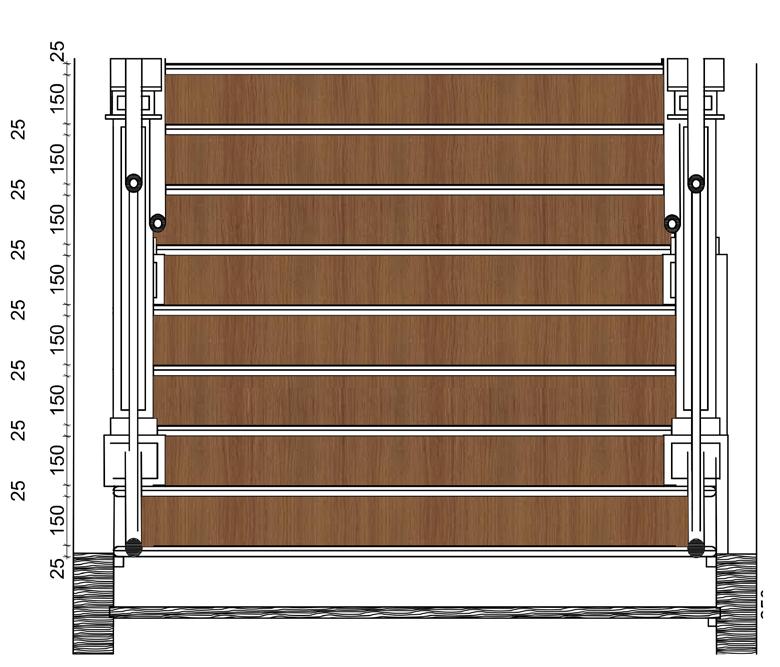
Swahili Timber railing
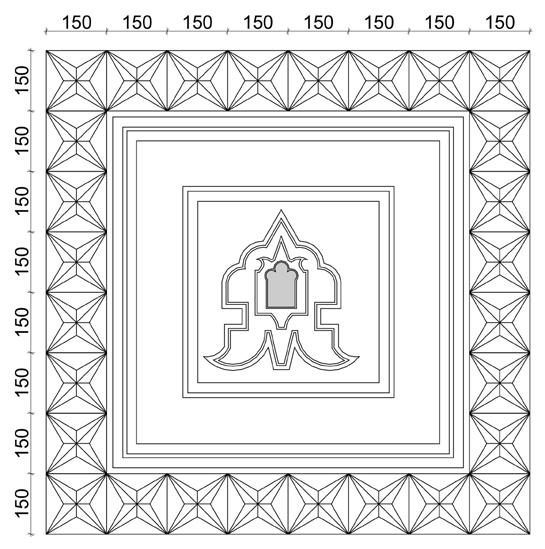
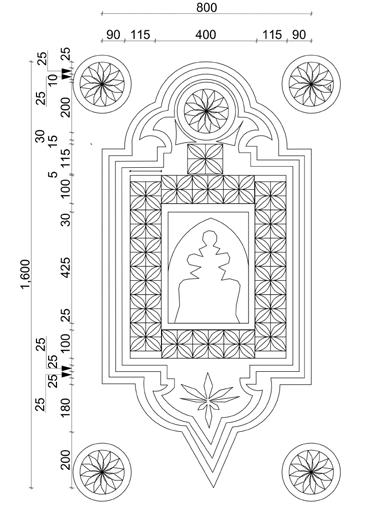
Swahili decorative motifs
Swahili decorative motifs detail
Swahili wall niches/lighting
Swahili timber staircase detail
2022 Architecture HISTORICAL URBAN REDEVELOPMENT
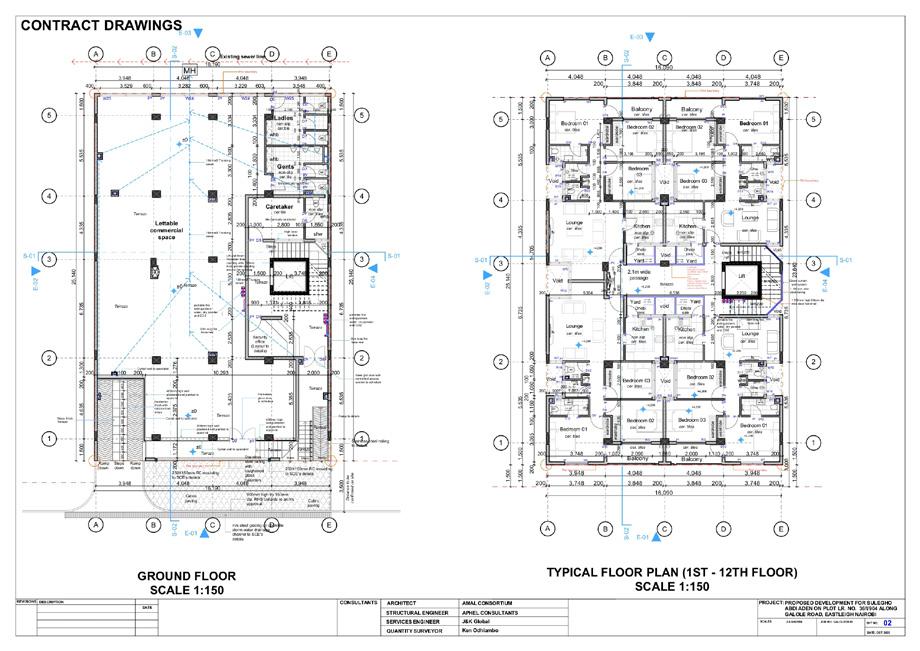
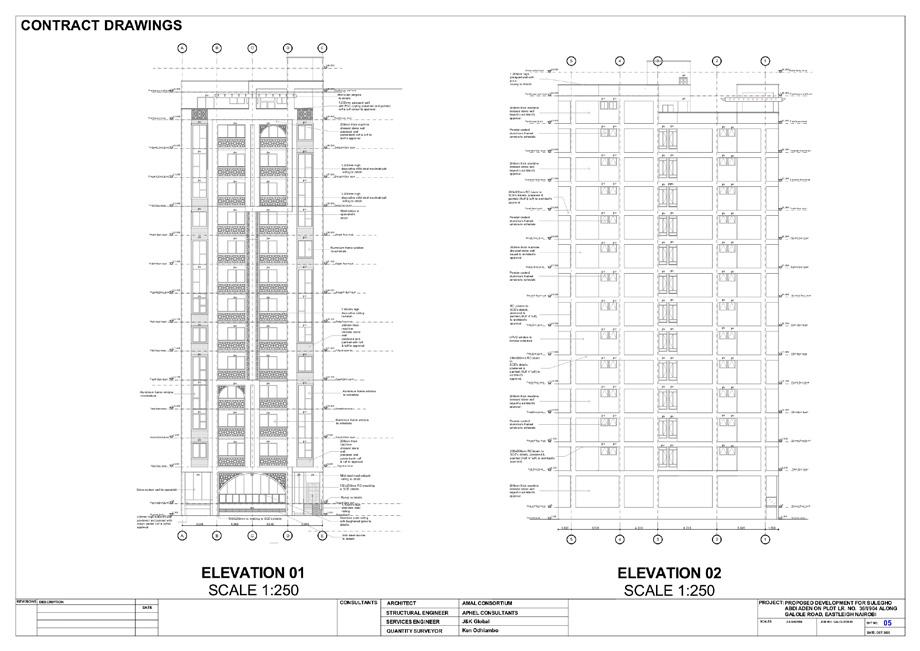
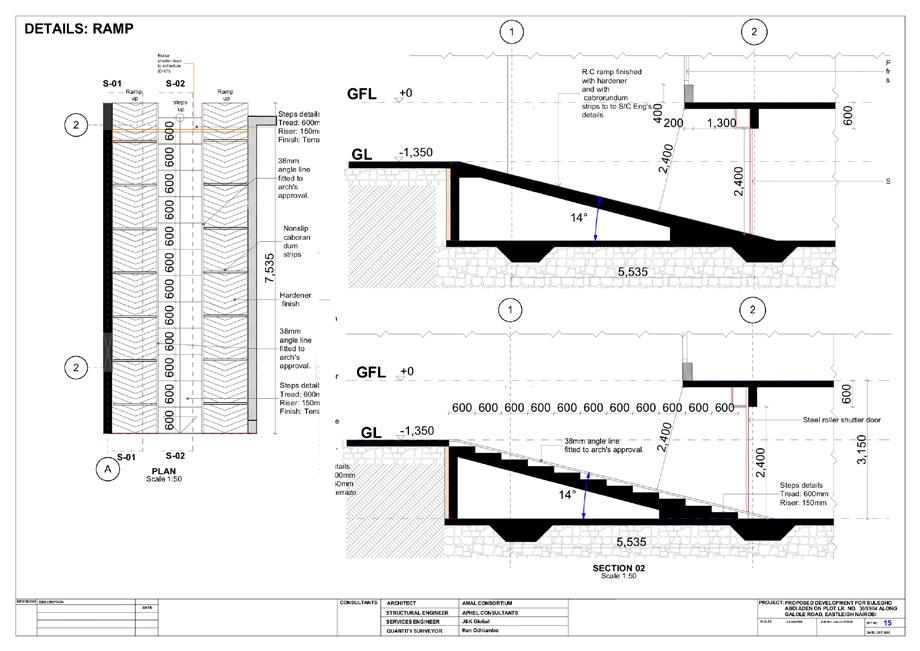
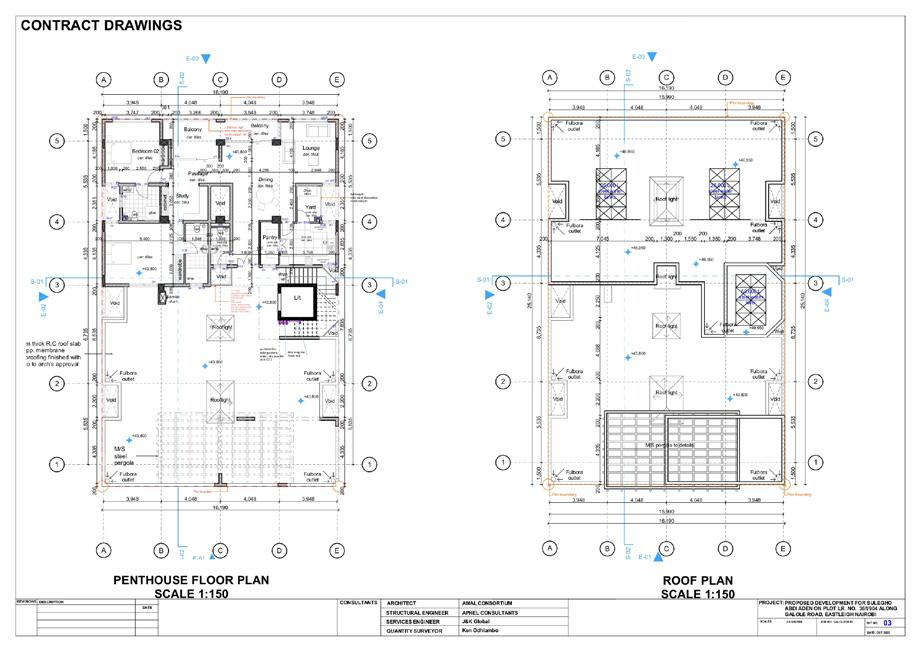
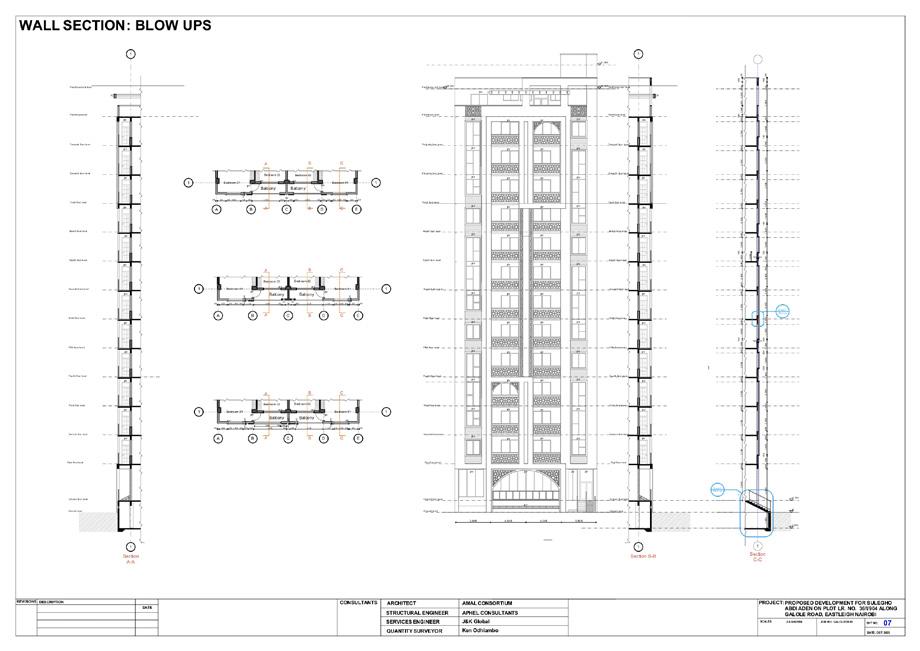
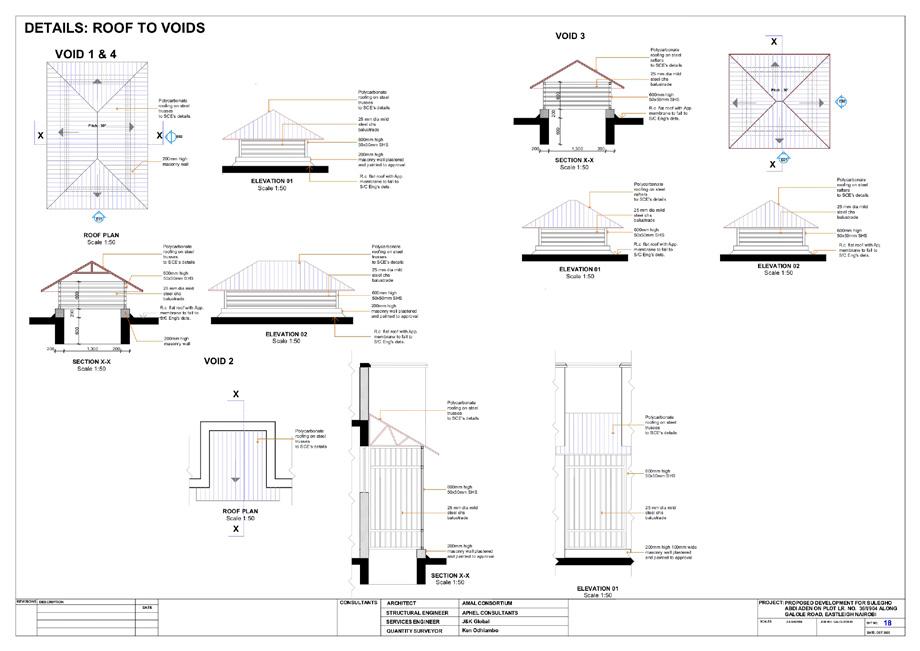
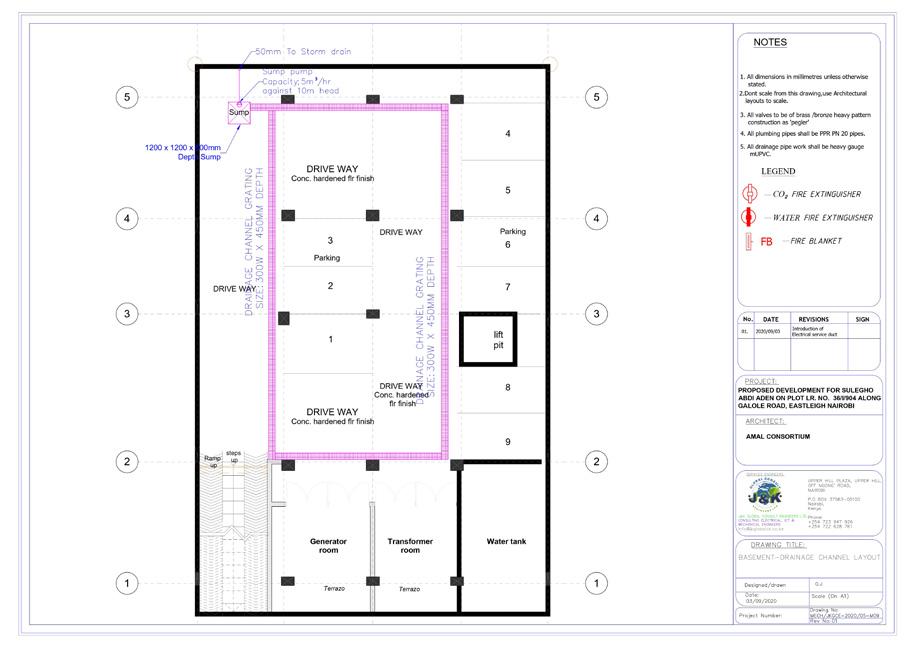
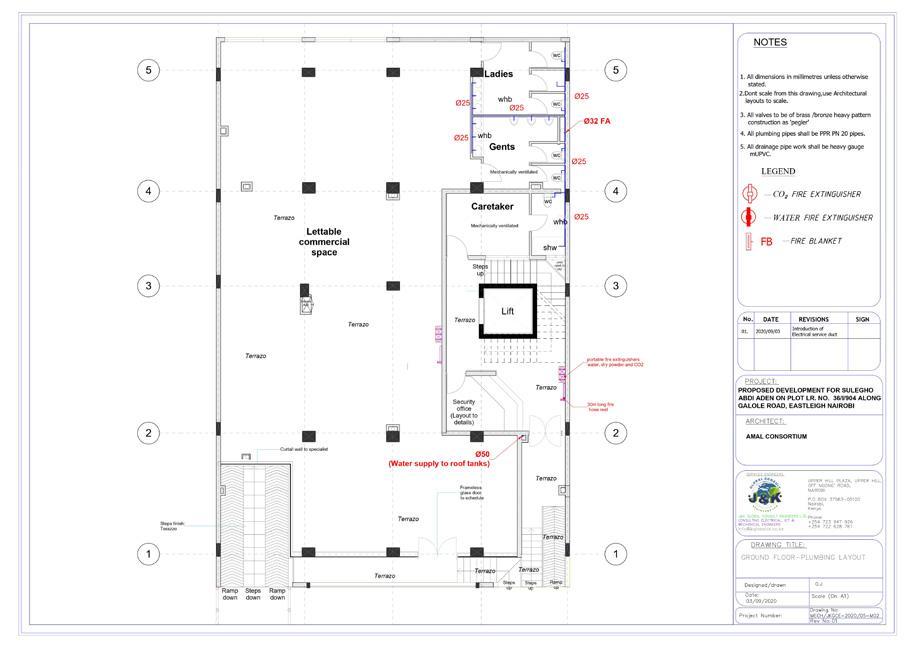
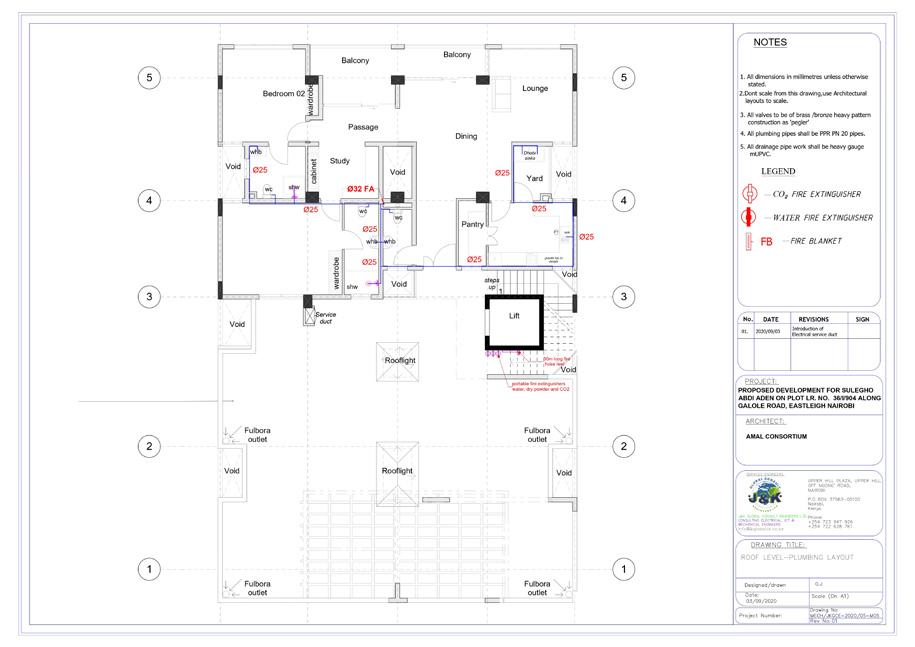
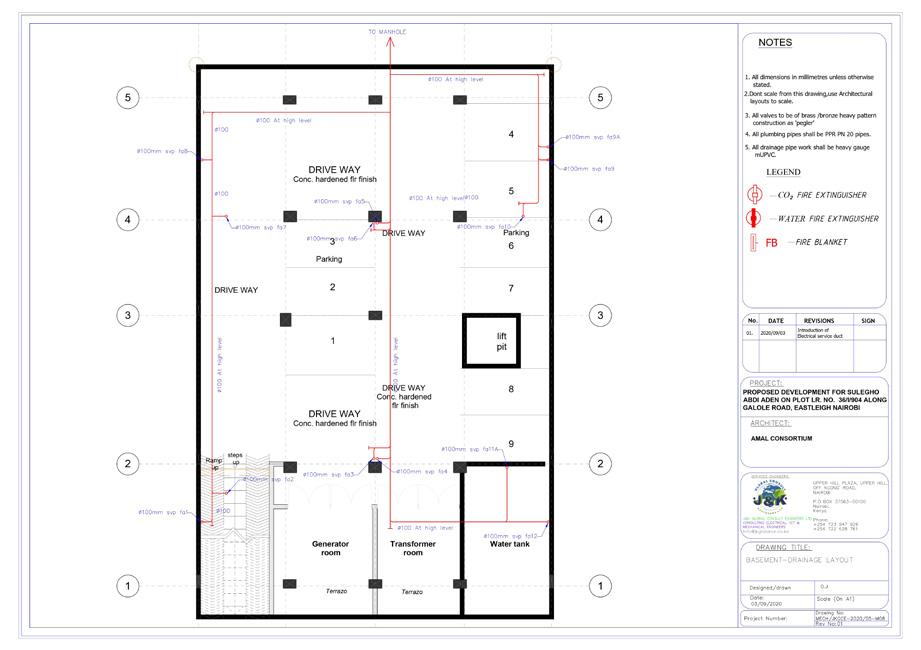
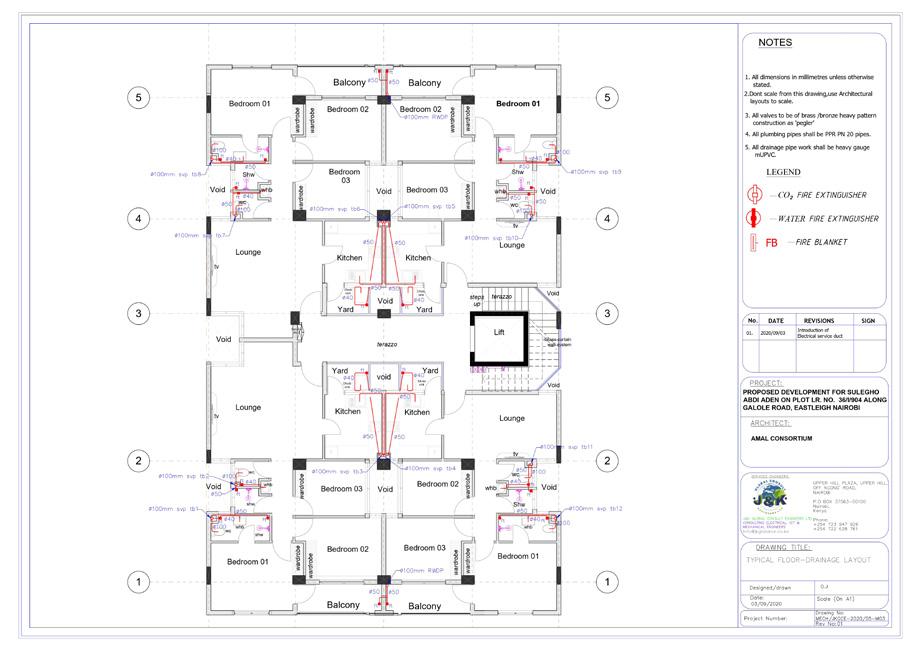
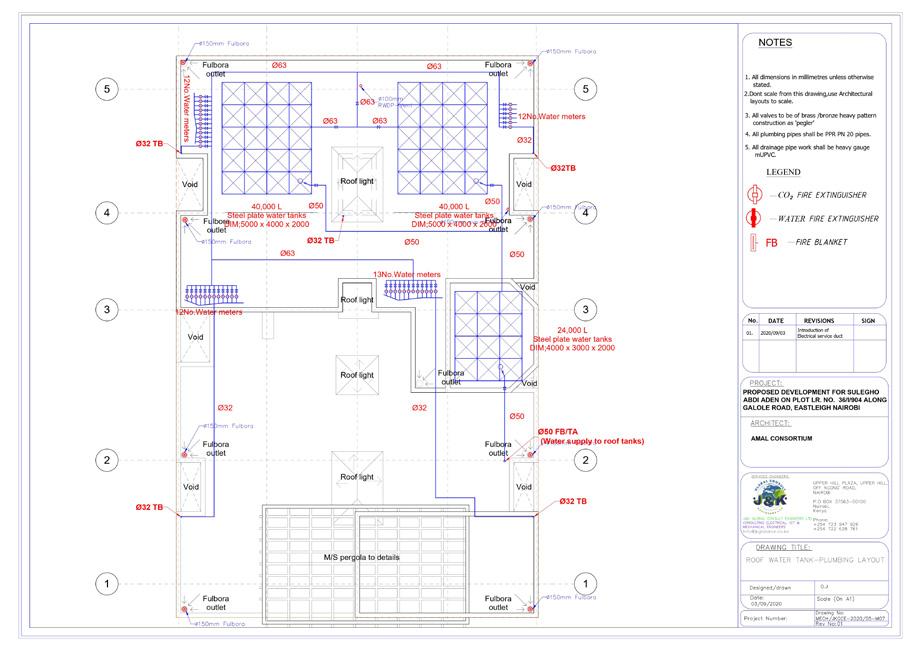
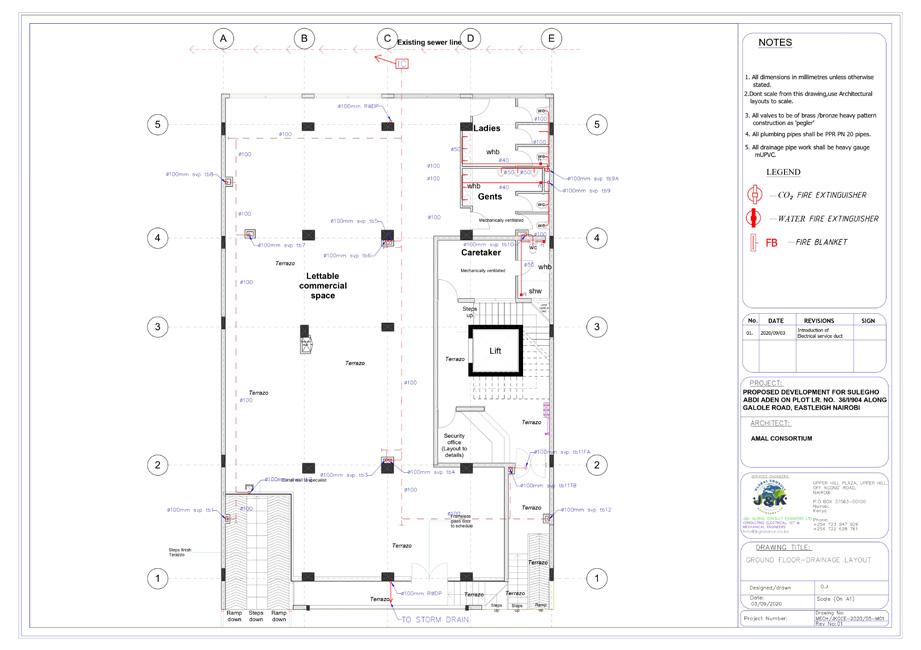
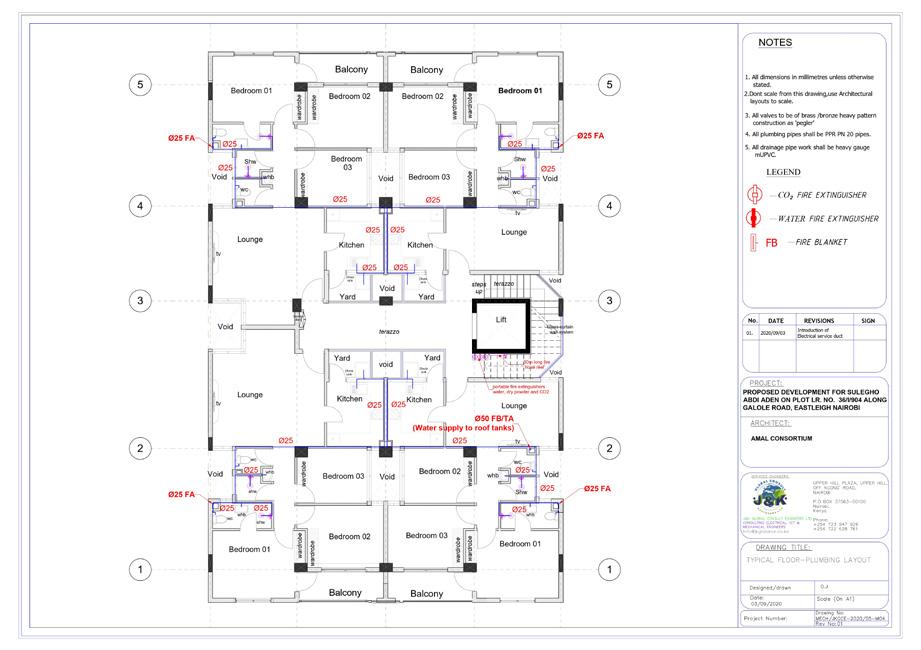
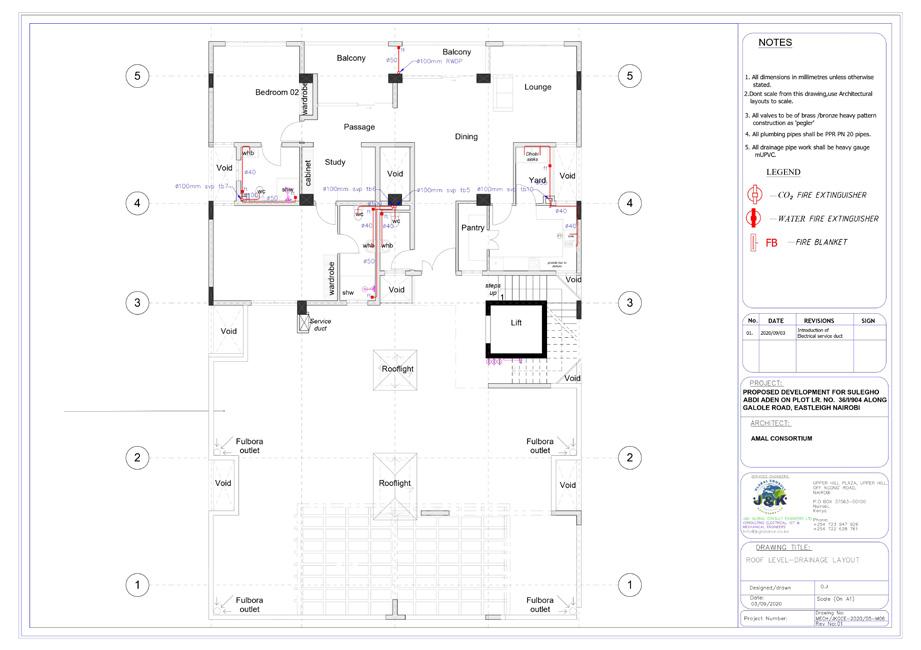
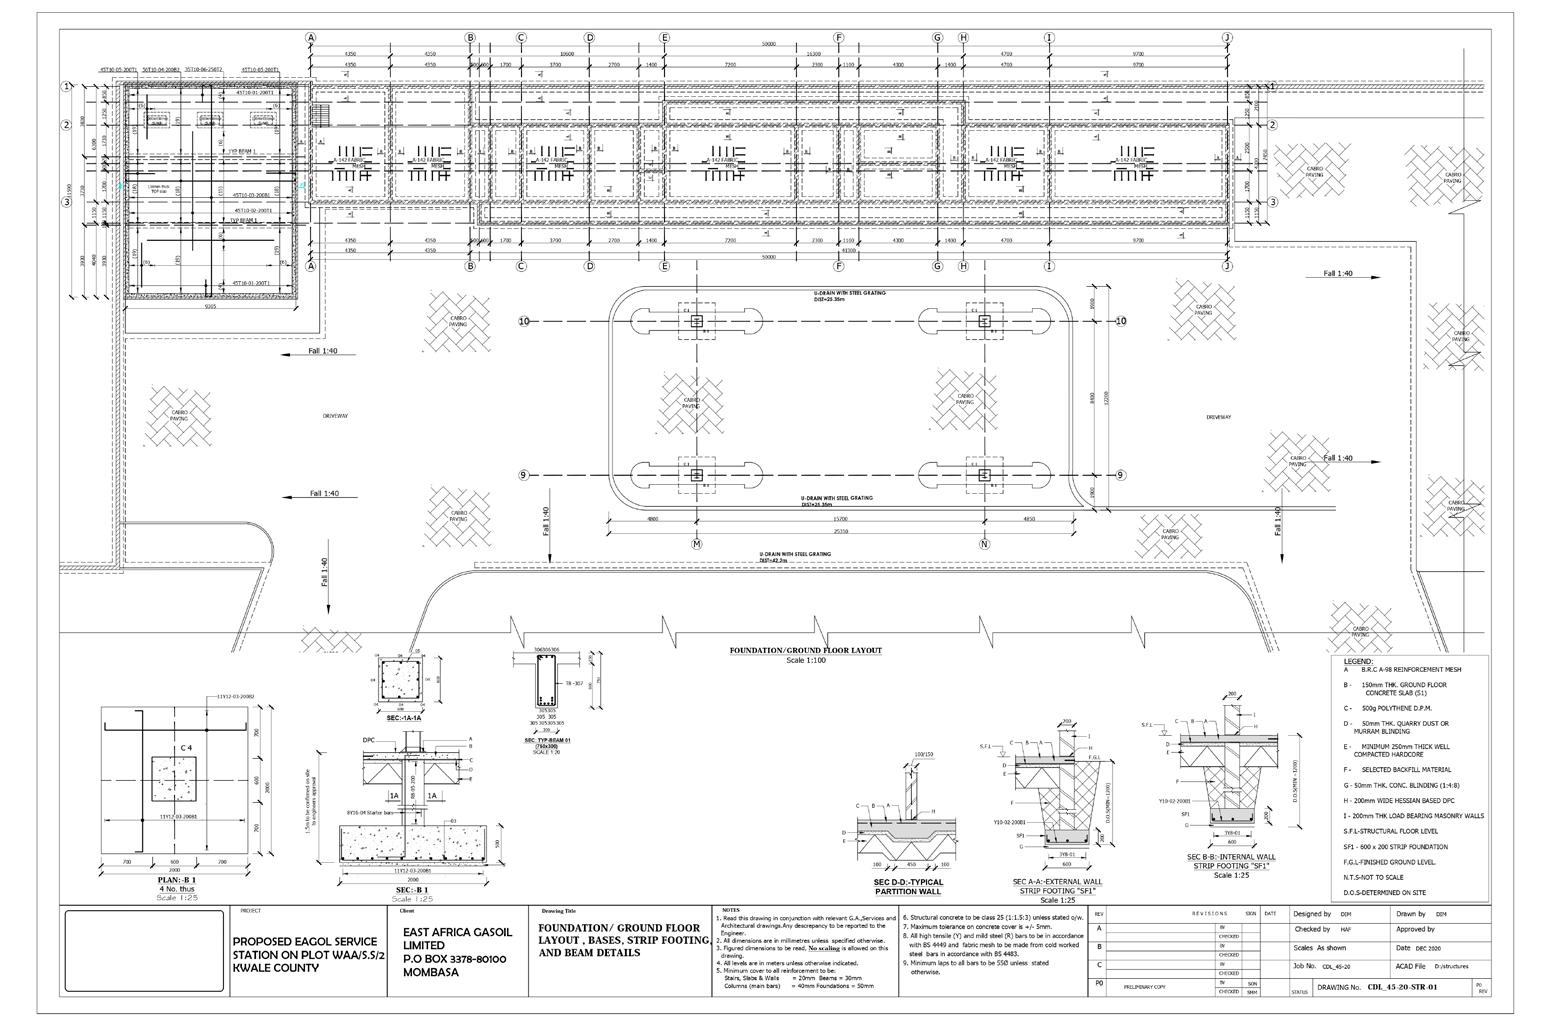
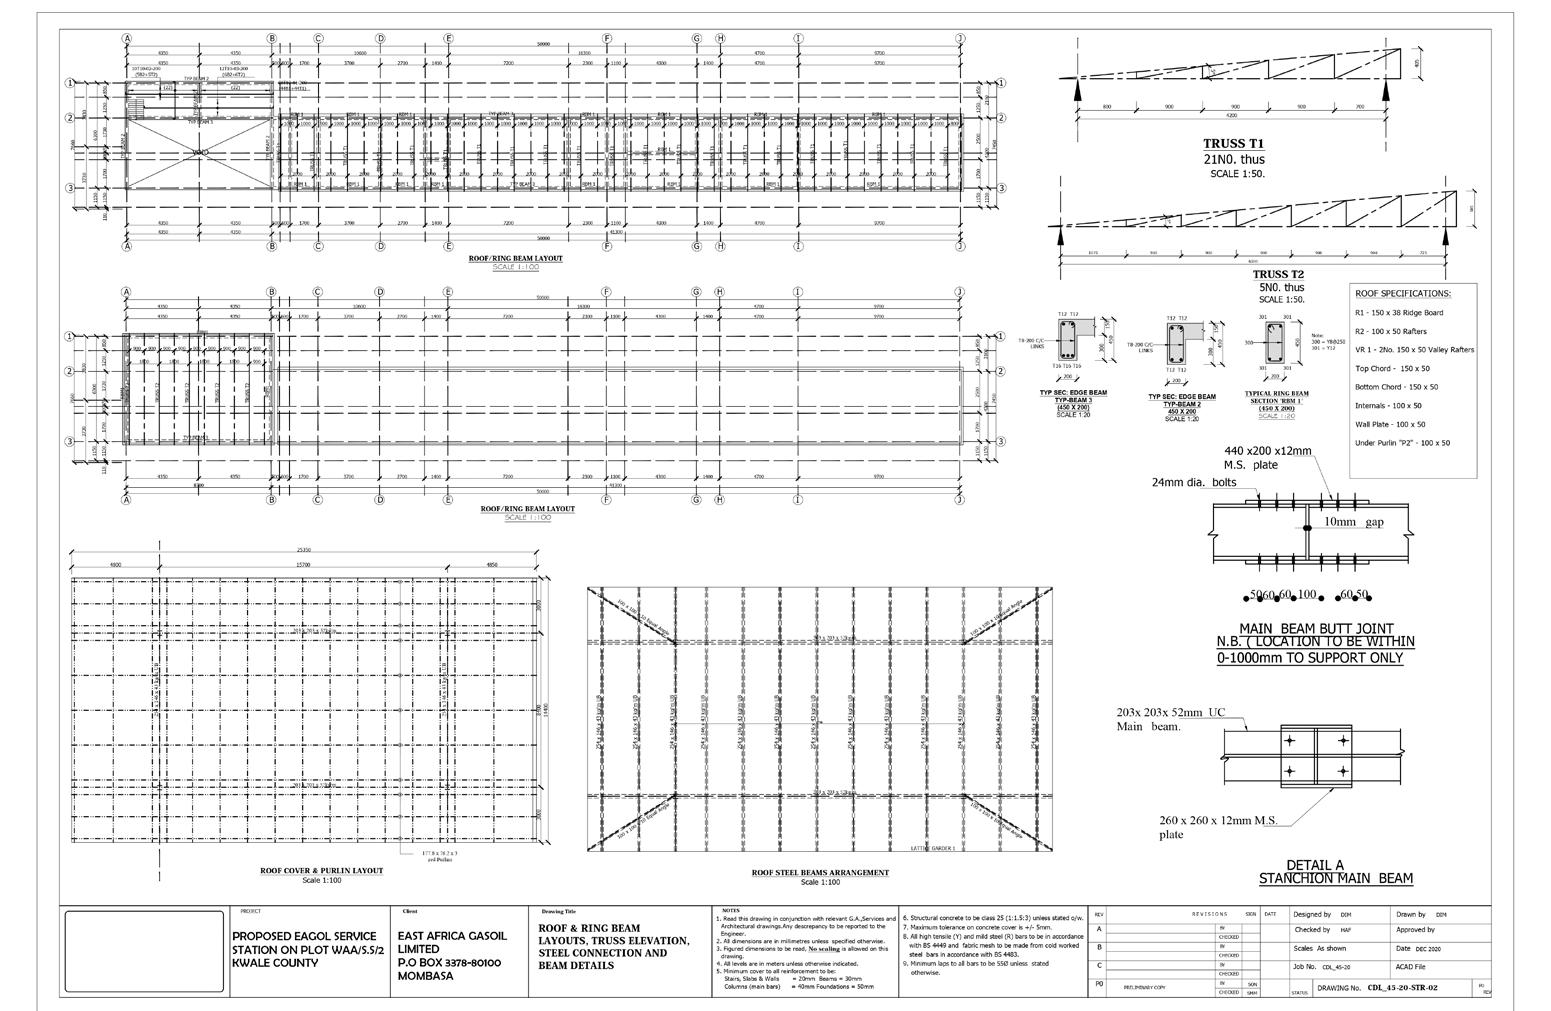
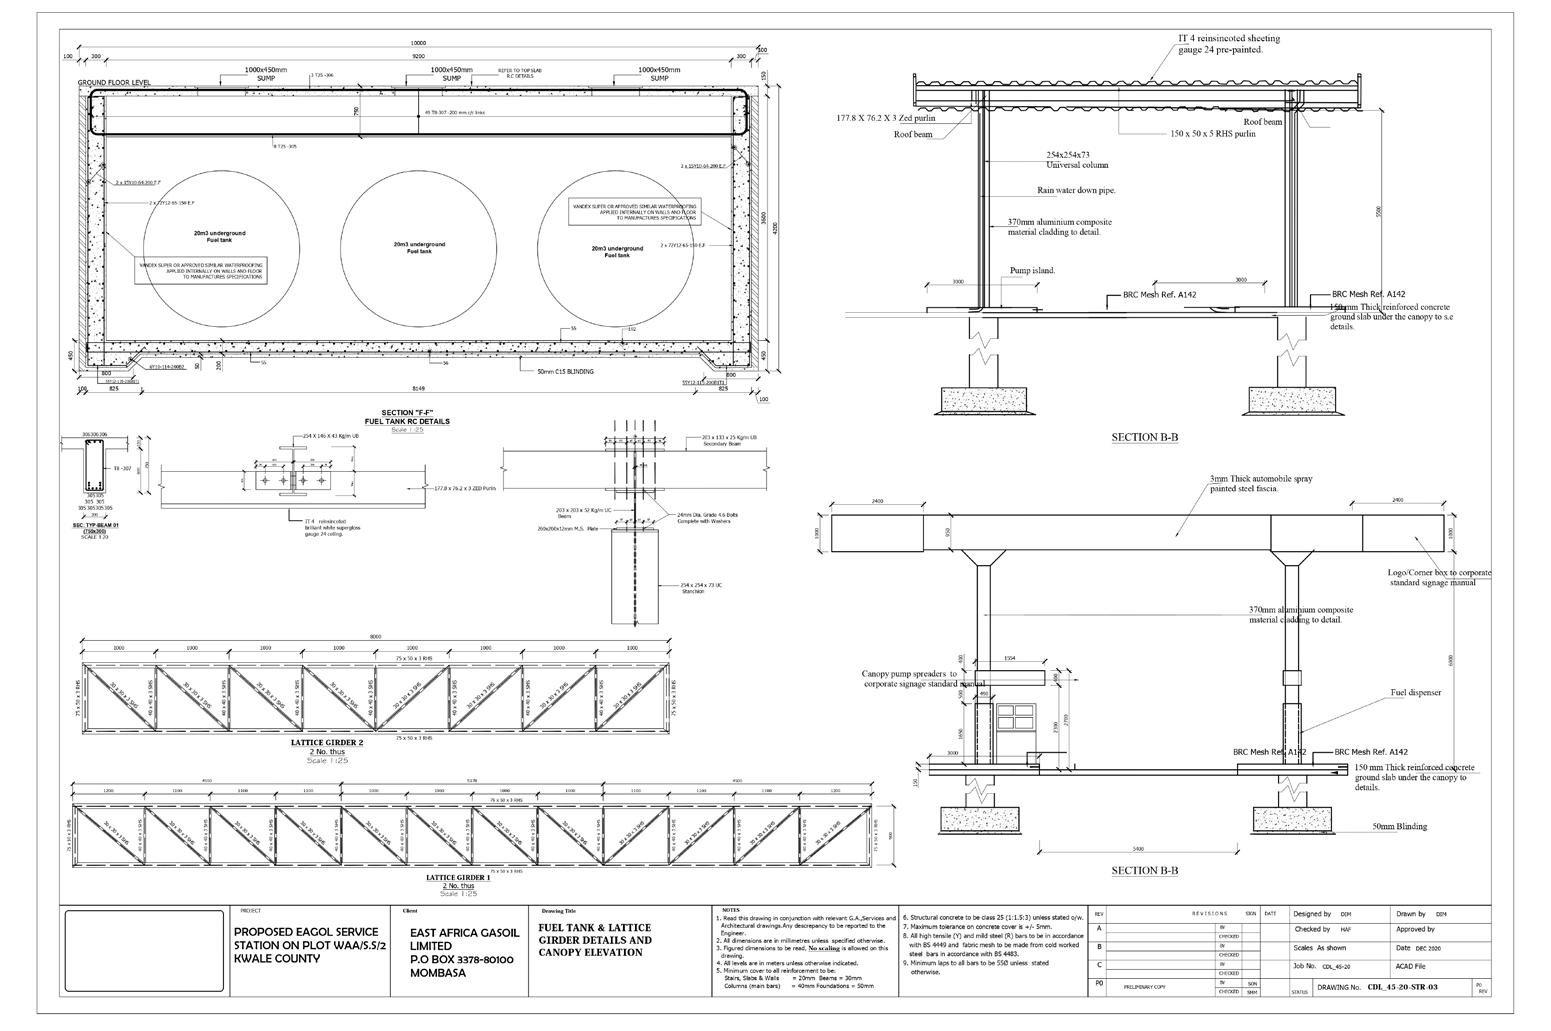
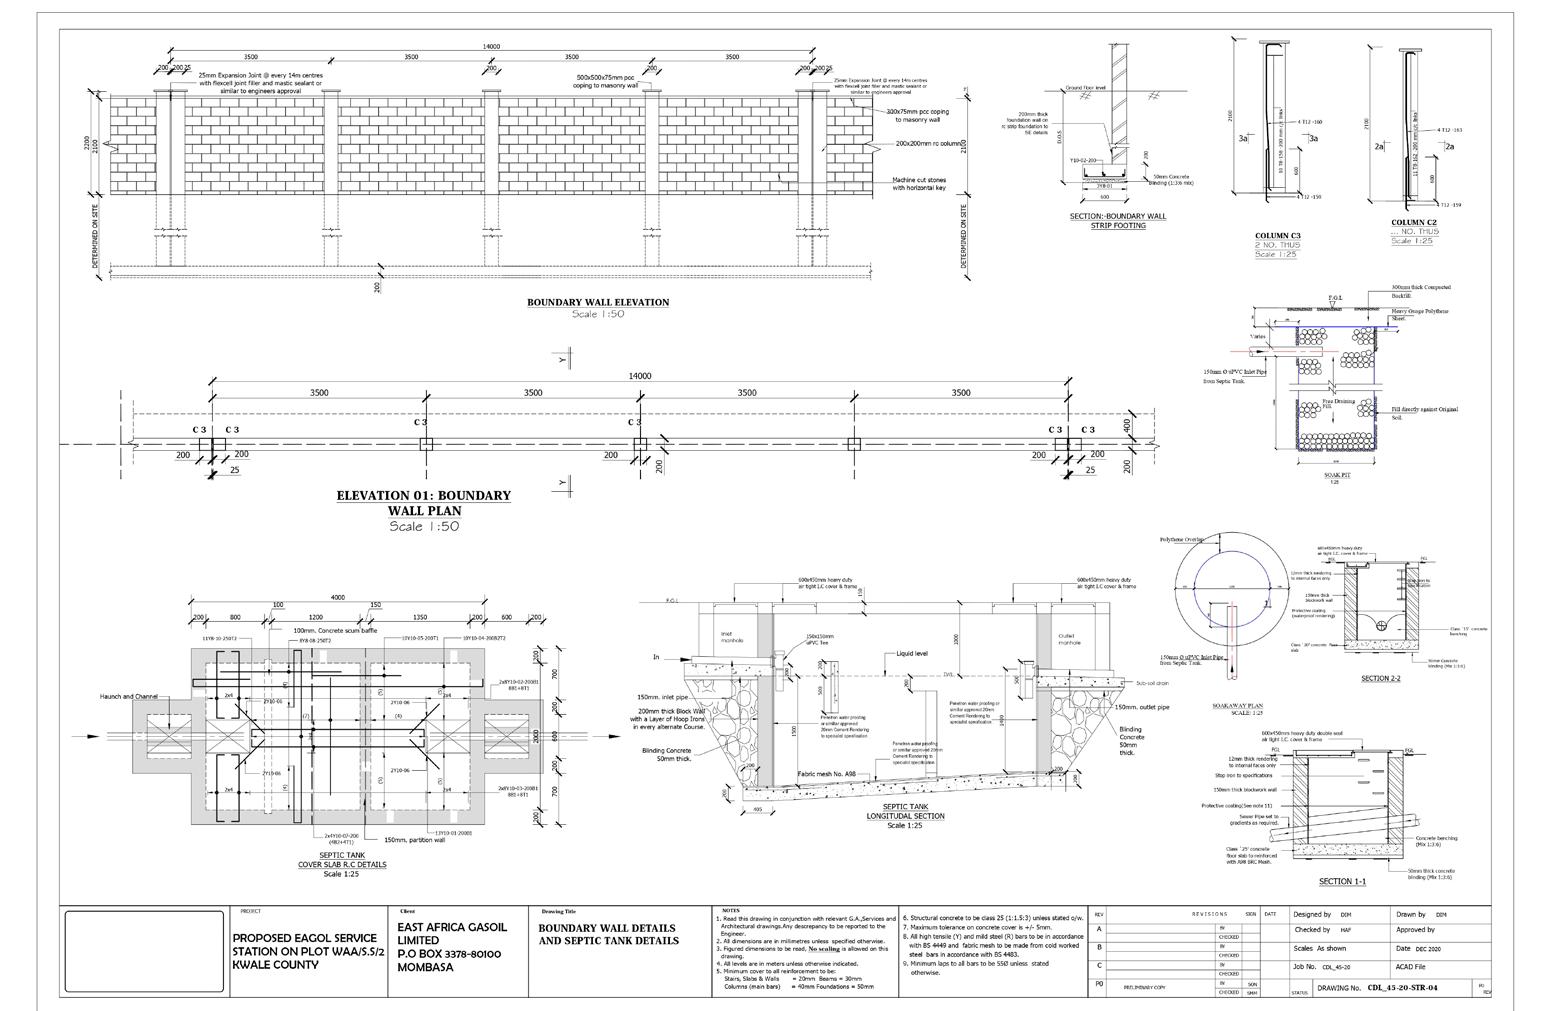
PROFESSIONAL ARCHITECTURE
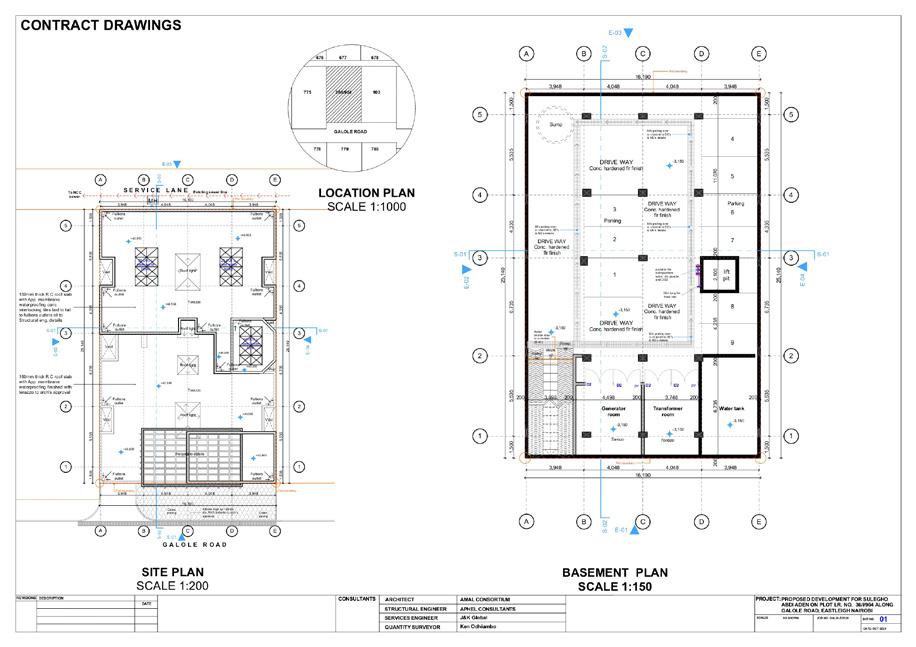
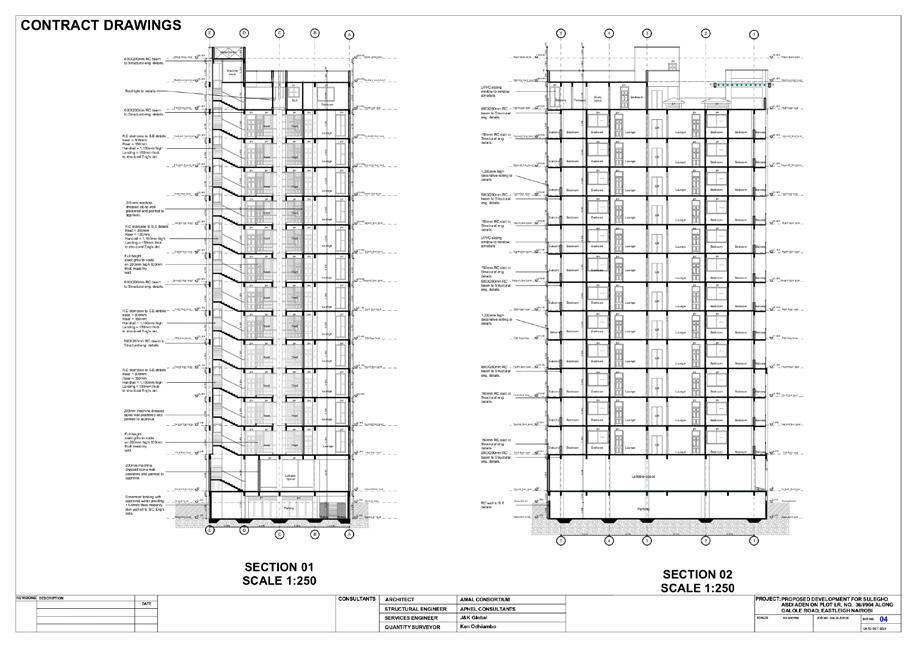
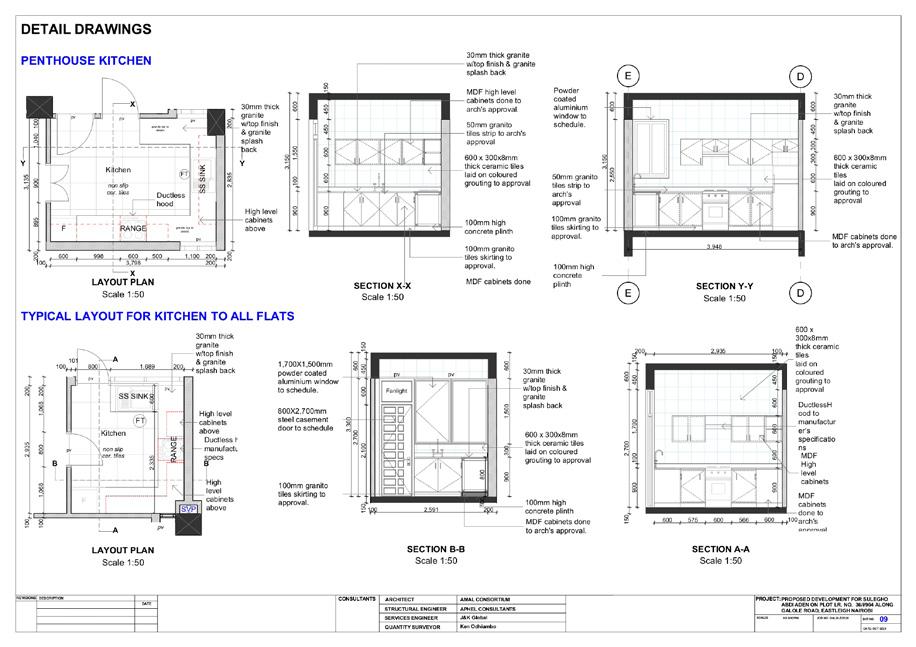
Design-Build Construction Site survey
Year : 2021
Project : Amal Consortium Projects
Applications : Revit, Archicad, Lumion, Adobe Illustrator, Adobe Photoshop, Adobe Indesign
The projects displayed represent my professional projects during my time an architectural designer at a firm called Amal consortium in Nairobi, Kenya. I was responsible for proposing design suggestions and solutions to the principal architect, producing architectural drawnings schedules and presentations, preparing and submitting permit drawings for review by the city, monitoring the development of projects and updating drawings, participating in client meeting and conductng site survey.
44 45
46 47
48 49
50 51
URBANISM
Mapping Visualization Data Geoprocessing Statistics
Year : 2022 - 2023
Project : GSAPP Academic projects
Applications : ArcGIS Pro, Python, Adobe Illustrator, Adobe Photoshop, Adobe Indesign
The projects displayed represent my academic projects during my time at Columbia University ,Graduate School of Architecture, Planning and Preservation Pursuing a Master’s degree in Urban Planning.
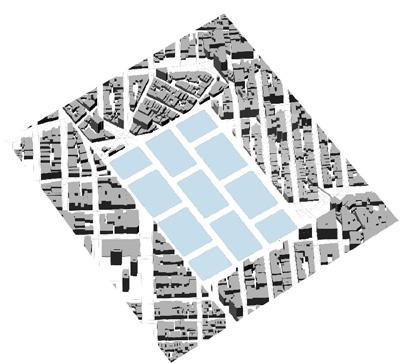
COMPUTATIONAL URBANISM
Year : 2023
Project : Computational design practices, GSAPP
Site Location : New York City
Credit : Individual Project
Role : 100%_ Grasshopper scripting, Rhino Modelling, Presentation
Applications : Rhino, Grasshopper, Adobe Illustrator, Indesign Methods : Urban computation, Urban scale procedural generation, Combining operations, Inputs into procedural types, Procedural building types to an urban model
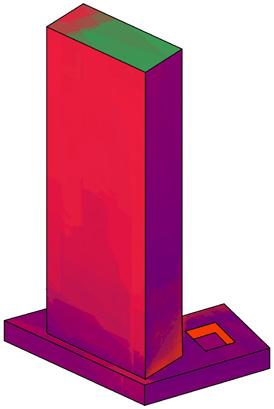
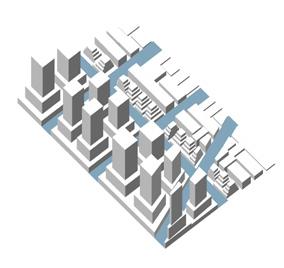
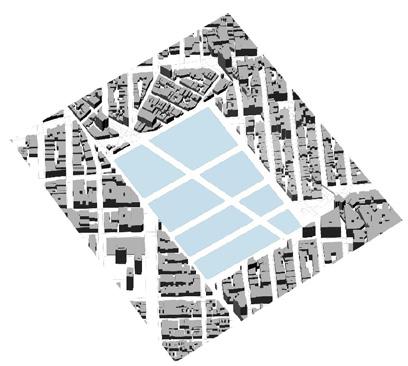
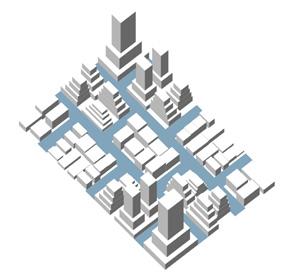
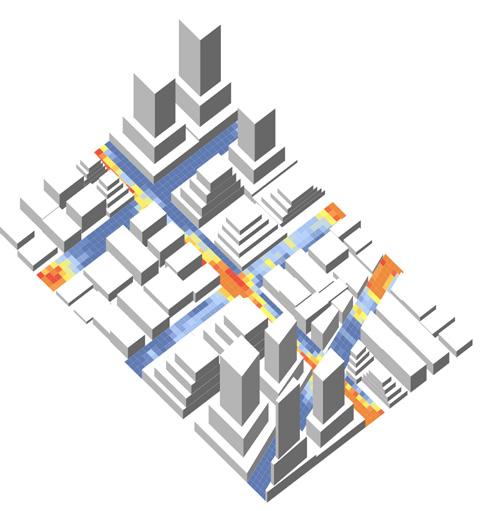
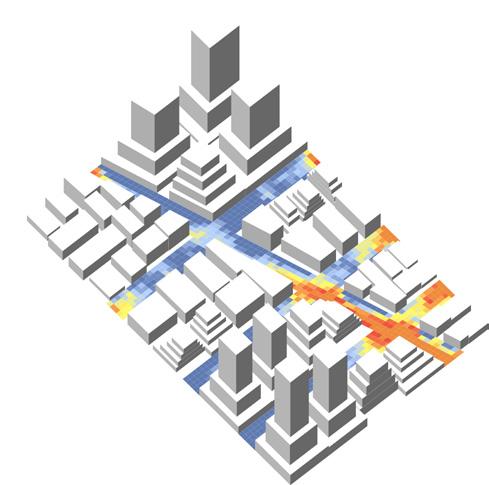
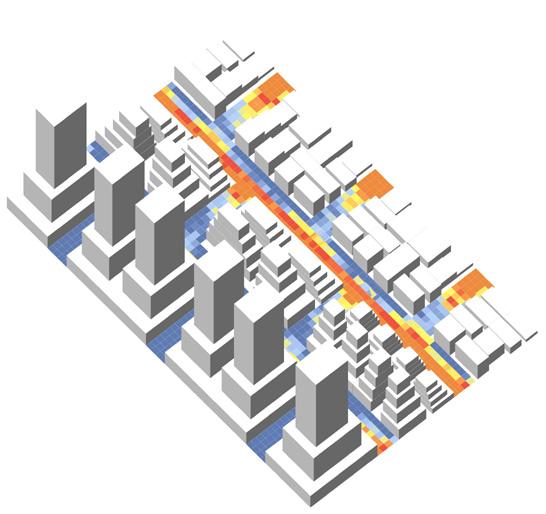
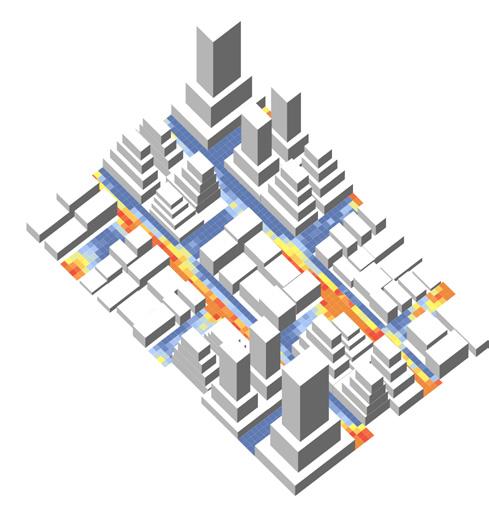
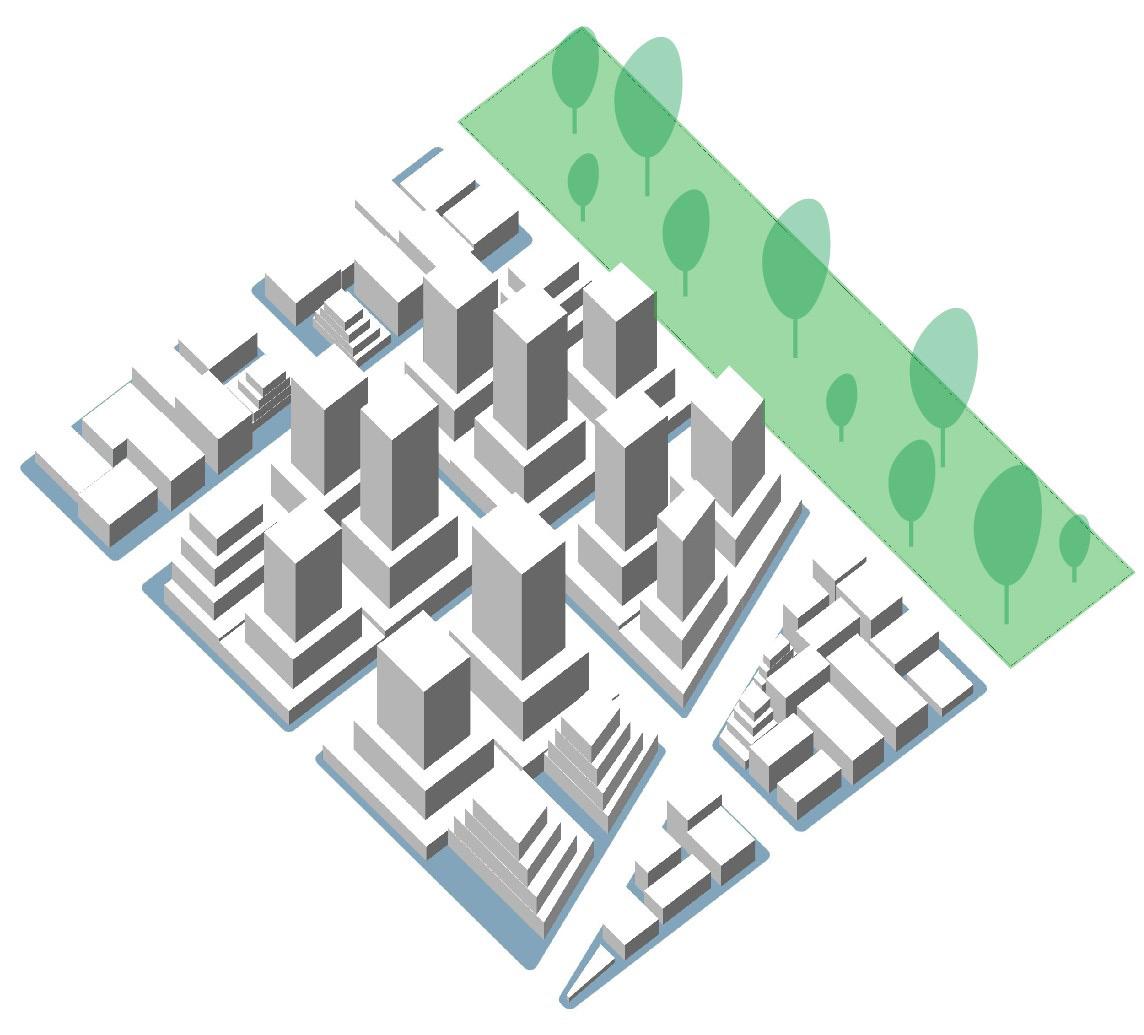
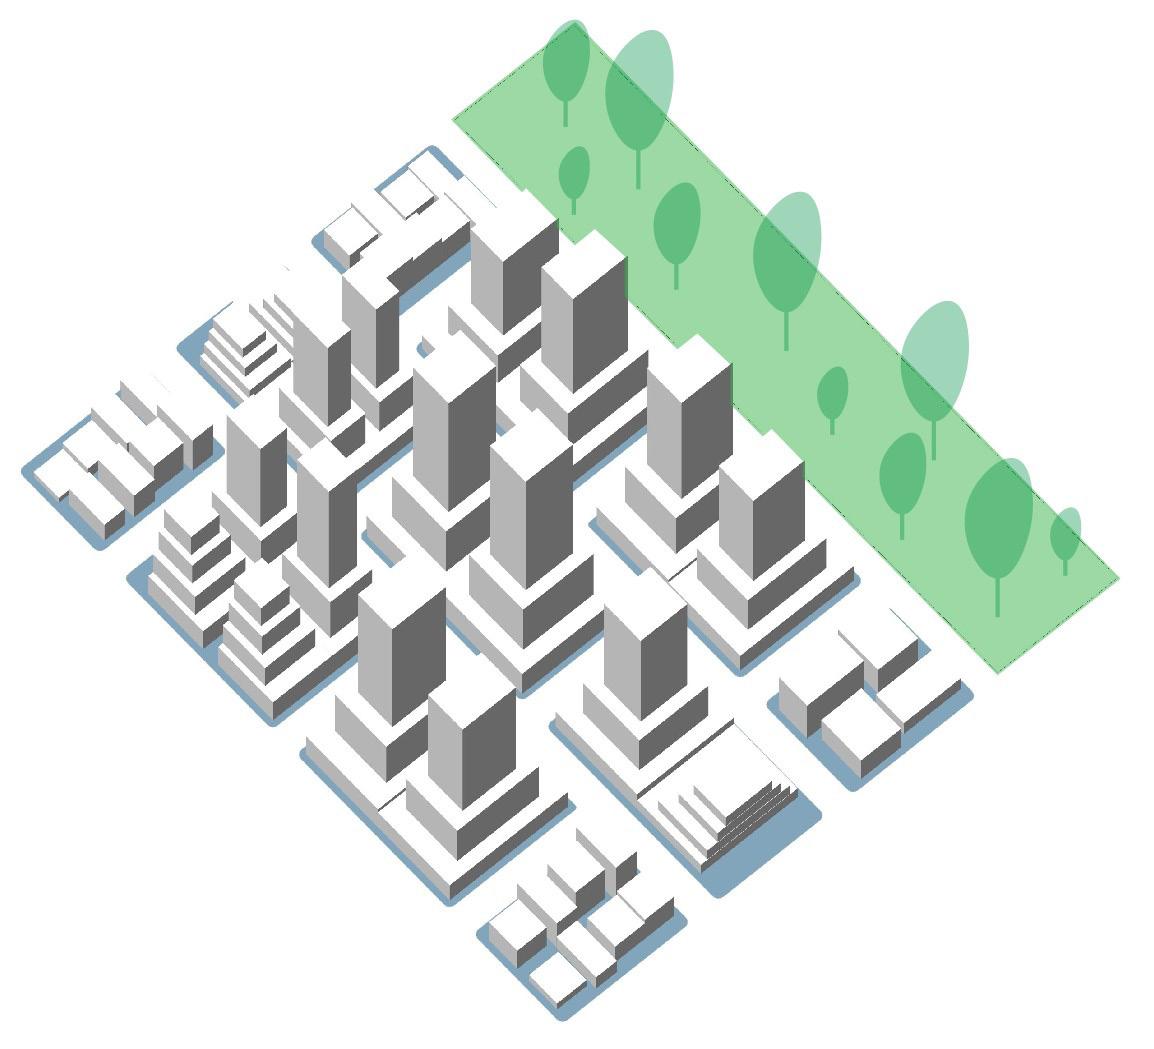
The project is looking urban heat island effect and thermal comfort along the street in our cities. The aim is to investigate the efficiency of urban design strategies in mitigating high temperatures along the streets suggesting that the presence of green spaces and an optimized building-height to street-width ratio could serve as interventions and this is because green spaces have a naturally cooling effect through shade provision and transpiration ( where plants and trees absorb solar radiationa and release water vapor) while the optimized building-height to street -width ratio promotes improved airflow, diminishing heat accumulation in urban areas.
Observation
As heat waves become more increasingly common in urban areas, higher temperatures along the streets are evident in with limited green spaces and lower building heights.
Question
How can the urban heat island effect in cities be quantifiably improved to reduce the impact of extreme heat events along the streets especially among the vulnerable populations?
Hypothesis
Urban heat island effect is alleviated in areas characterized by green spaces and higher building-height to street-width ratios due to diminished heat retention and enhanced cooling by providing shade and improving airflow
Inputs # of options Description of the opti0ns
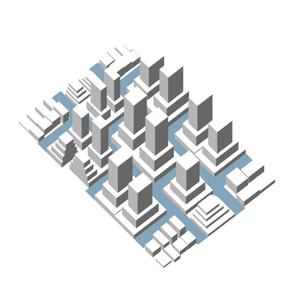
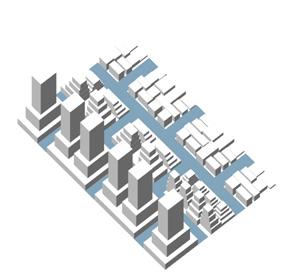
Building Density Distribution
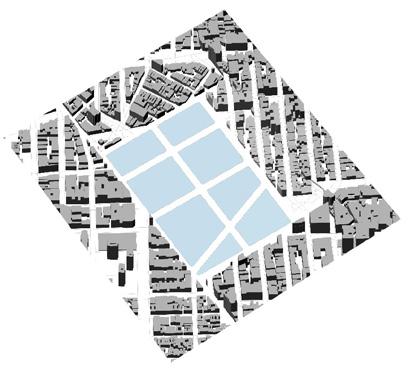
Street Grids
Building Types Park
3
3 3 1 27
Varying density locations
Varying grid layouts
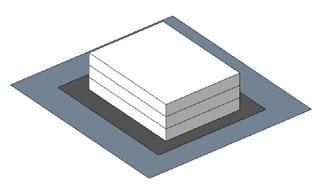
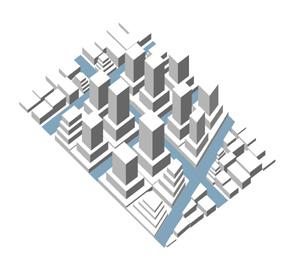
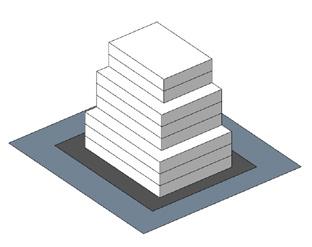
Tower + Podium (High-rise), Stepped building (Mid-rise), Low rise building
Concentrated in one area
Design space size Metrics Unit How to measure
Park Accessibility
No.
Number of lots and buildings within an 8 minute walk to the park
Analysis Framework
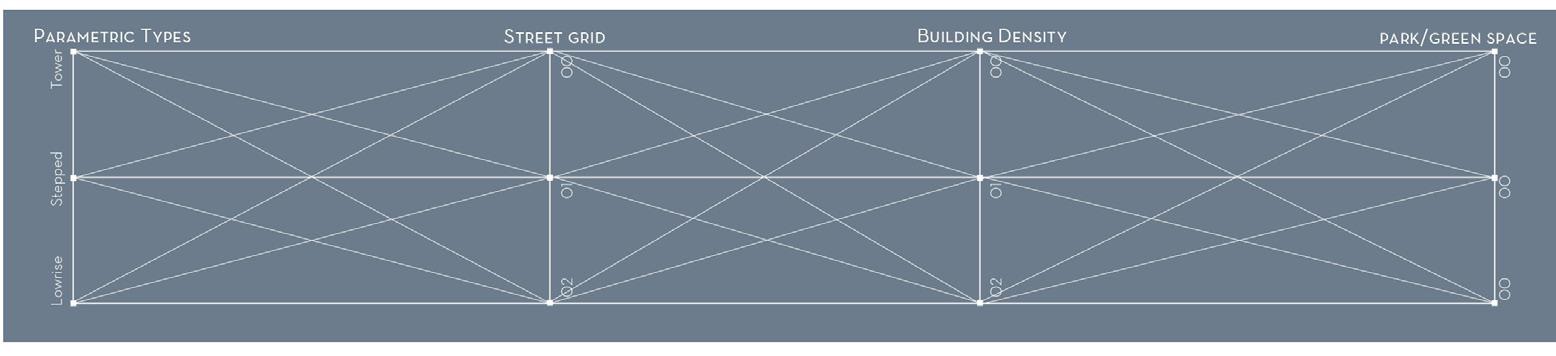
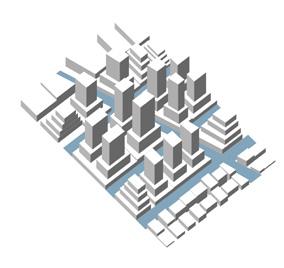
This analysis framework begins by examining the relationship between three different building density distributions and three distinct street grid layouts. Each density distribution, such as distribution 01, will interact with all three street grids in a similar process applied to the subsequent density distributions.
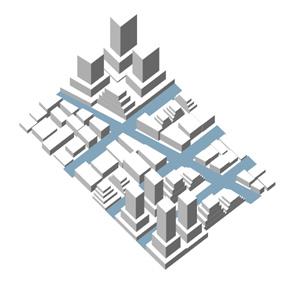
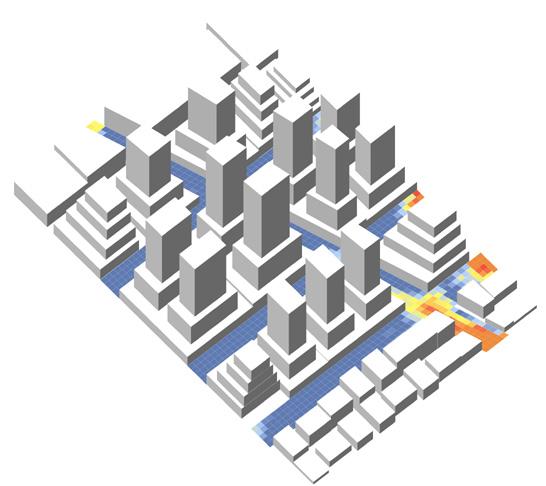
Once the combinations are established, the next step involves assessing the thermal comfort along the streets. This evaluation will be based on sun exposure and so By analyzing the thermal conditions associated with each combination, we can identify which configurations yield optimal thermal comfort for street users.
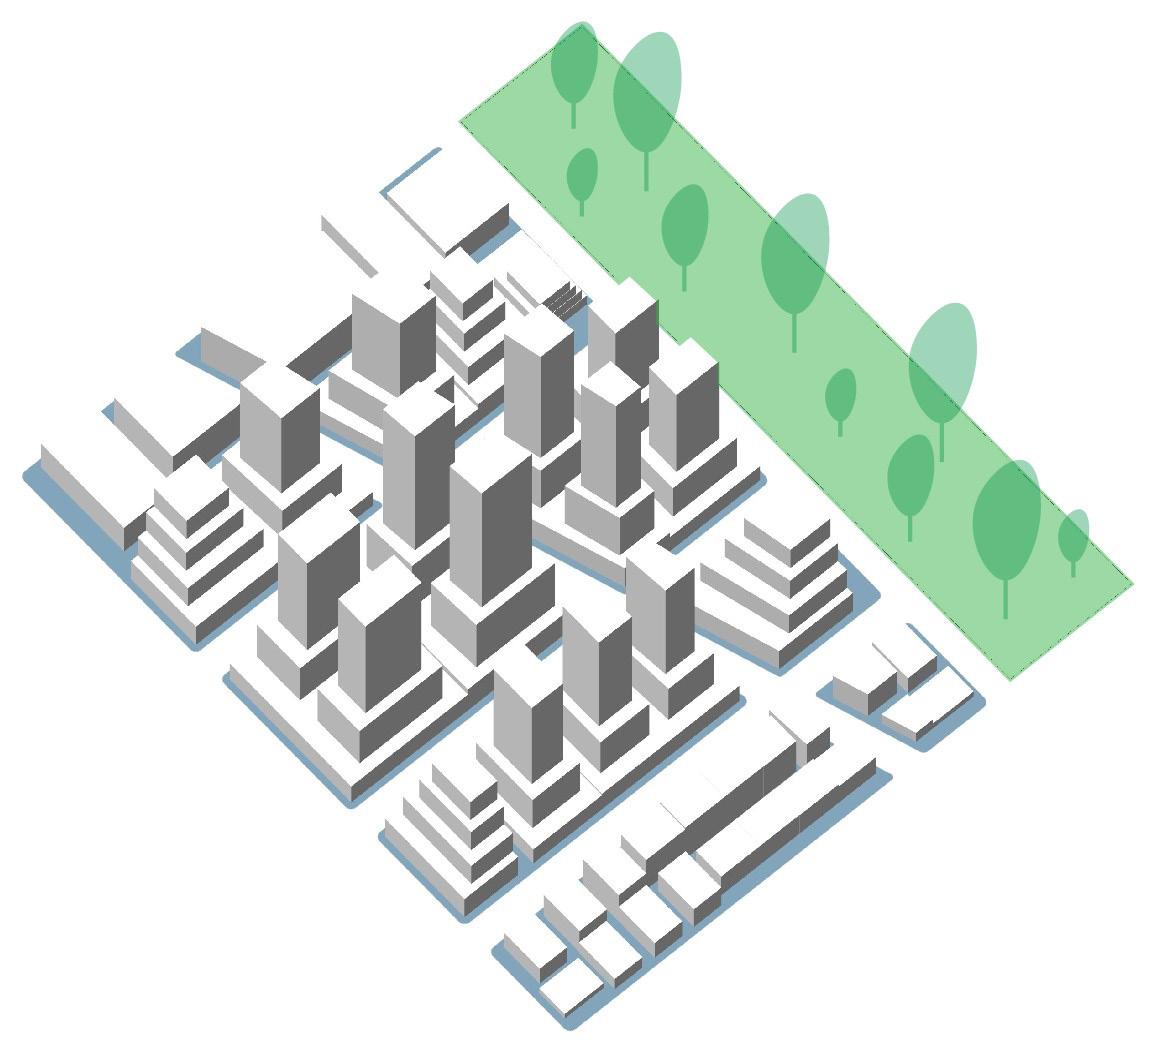
Finally, the introduction of a park into the fabric will help me determine which combination of building density and street grid layout results in more parcels located within an 8-minute walk to the park and additionally, identify configurations that require fewer additional green spaces to achieve optimal temperatures along the streets.
54 55
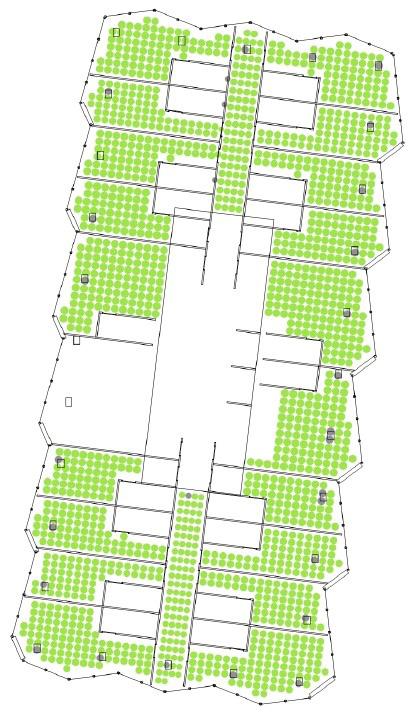
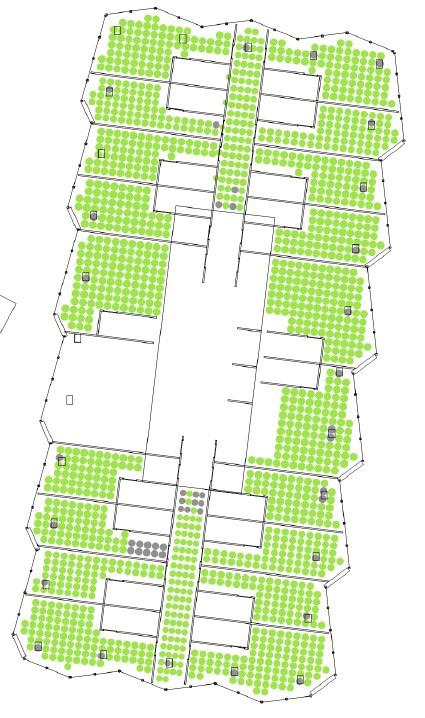
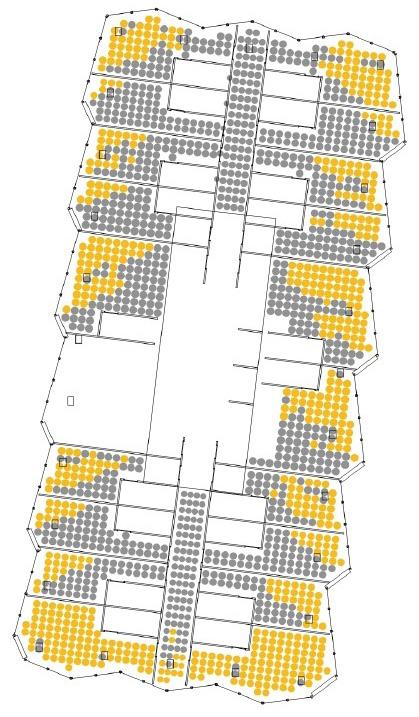
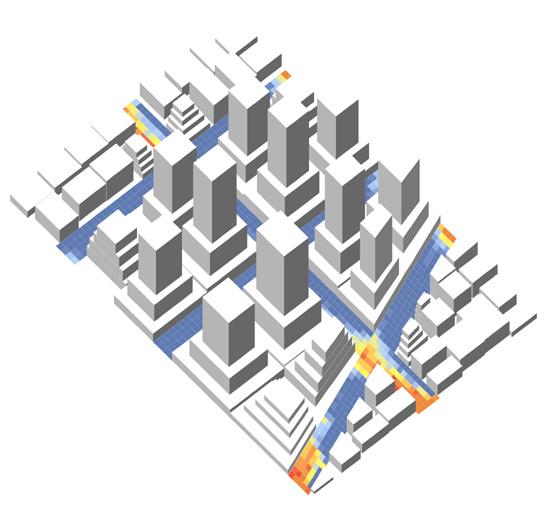
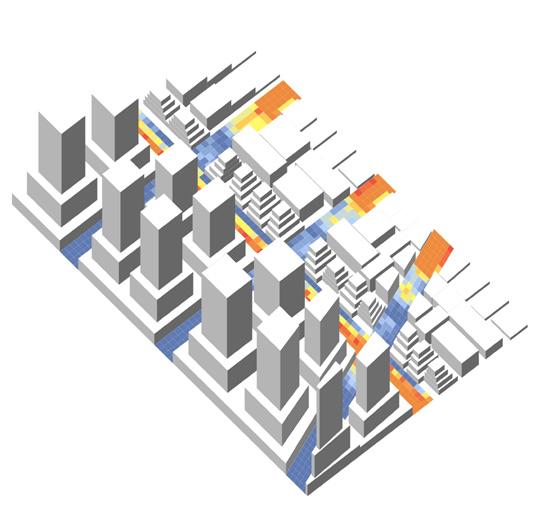
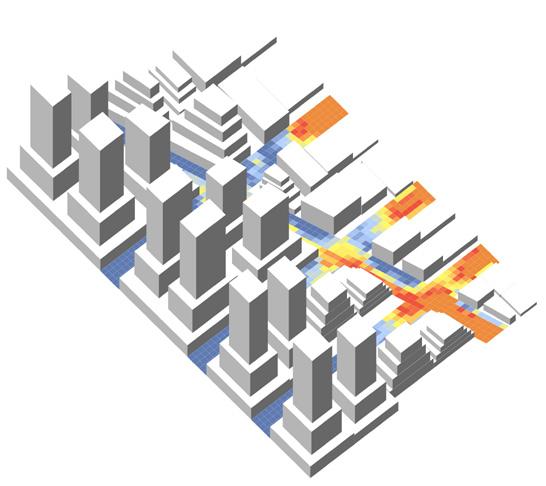
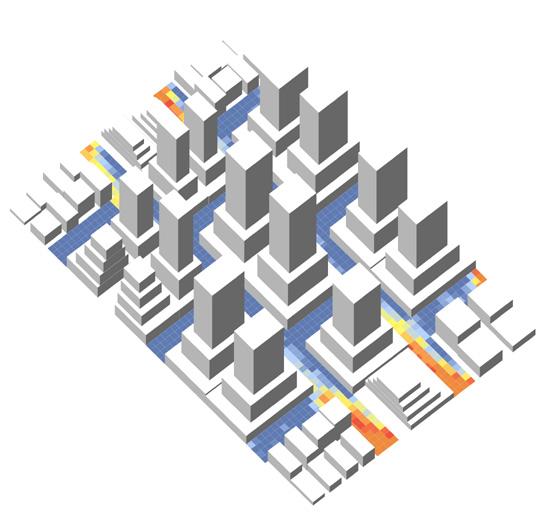
Temperature difference / sunlight exposure between areas with a higher building-height to street-width ratios and those with low building-height to street-width ratio Hours Sunlight Exposure 1 2 3
Parametric types
Three
Street Grids Parcel angles
Iteration 01 Average daylight hours_ 3.70

Iteration 01a
Average daylight hours_ 3.56 Averafe % of day with daylight_ 0.32 % above minimum daylight hours_ 0.56
Day Light Exposure analysis
Degree of sun exposure along the streets
Iteration 02
Average daylight hours_ 5.16 Averafe % of day with daylight_ 0.46
% above minimum daylight hours_ 0.73
Iteration 02a
Iteration 01b
Average daylight hours_ 3.83 Averafe % of day with daylight_ 0.34
Iteration 03
Average daylight hours_ 4.73 Averafe % of day with daylight_ 0.43
% above minimum daylight hours_ 0.79
Average daylight hours_ 4.87 Averafe % of day with daylight_ 0.44 % above minimum daylight hours_ 0.74
Iteration 02b
Average daylight hours_ 5.03 Averafe % of day with daylight_ 0.45
% above minimum daylight hours_ 0.78
Iteration 03a Average daylight hours_ 4.81 Averafe
Iteration 03b
Average daylight hours_ 4.92
% above minimum daylight hours_ 0.82
56 57
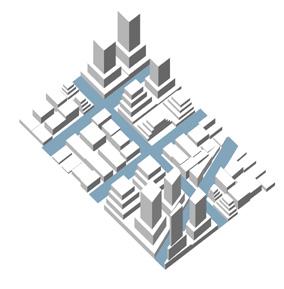
Varying building densities Low-rise Building Mid-rise Stepped Building Street grid option 00 Building density 0 street grid 0 Building density 1 street grid 0 Building density 2 street grid 0 Building density 0 street grid 1 Building density 1 street grid 1 Building density 2 street grid 1 Building density 0 street grid 2 Building density 1 street grid 2 Building density 2 street grid 2 Street grid option 01 Street grid option 02 High-rise tower Building Three Varying street layouts
Density distribution plus street layout configurations
Averafe %
of day with daylight_ 0.33 % above minimum daylight hours_ 0.59
% above minimum daylight hours_ 0.65
%
of day with daylight_ 0.43 % above minimum daylight hours_ 0.87
Averafe % of day with daylight_ 0.44
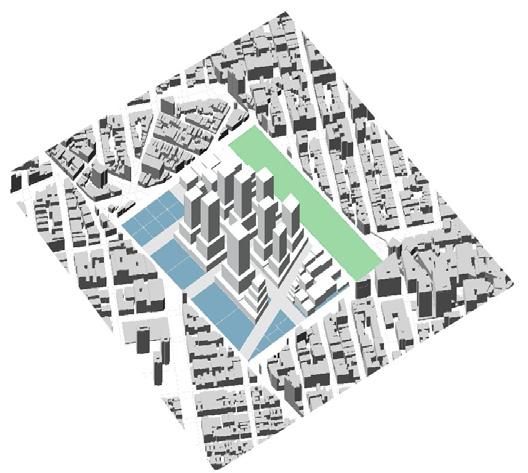
Park introduction
Iteration 01 - [grid 0, density 0]
32 Lots
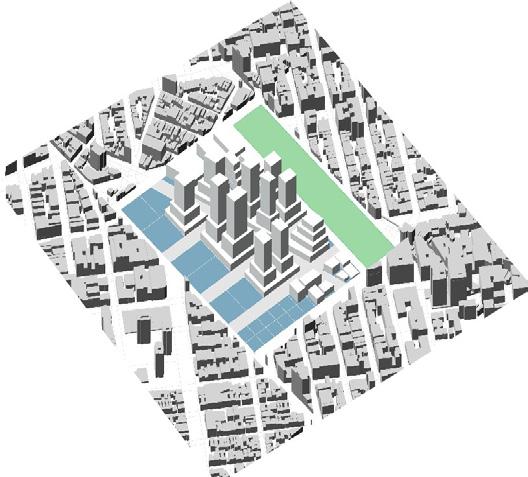
Park introduction
Iteration 01A - [grid 1, density 0]
25 Lots within an 8min
18
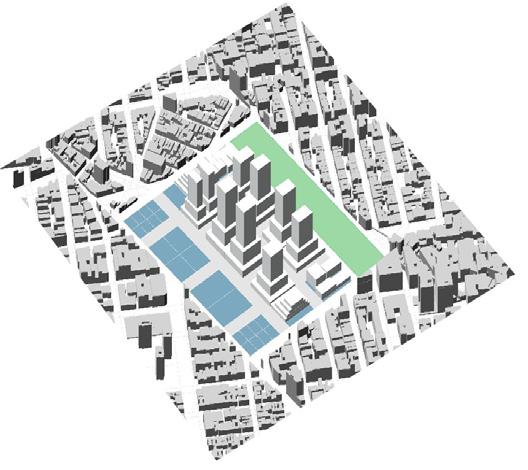
Park introduction
Iteration 01B - [grid 2, density 0]
23 Lots within an 8min walk to park
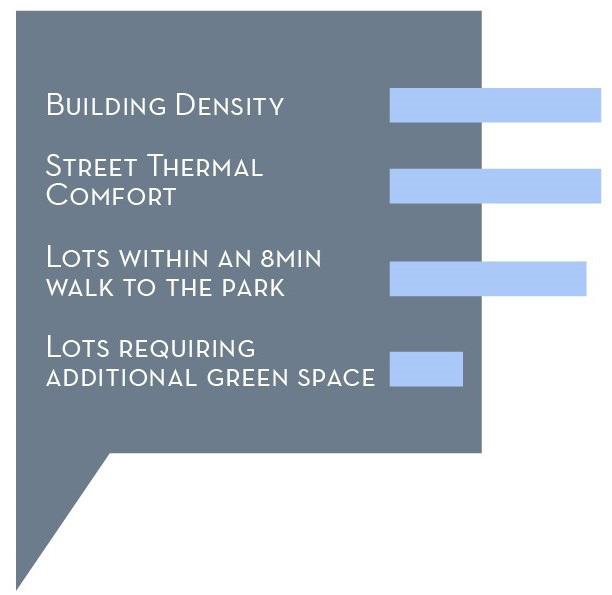
PERFORMANCE ANALYSIS
The best performing layout; thermal comfort, Highest number of lots within an 8min walk to the park and the lowest number of lots that require additional green space
58 59
within an
walk to park 18 lots require additional green space
8min
walk to park
lots require additional green space
require additional green
23 lots
space
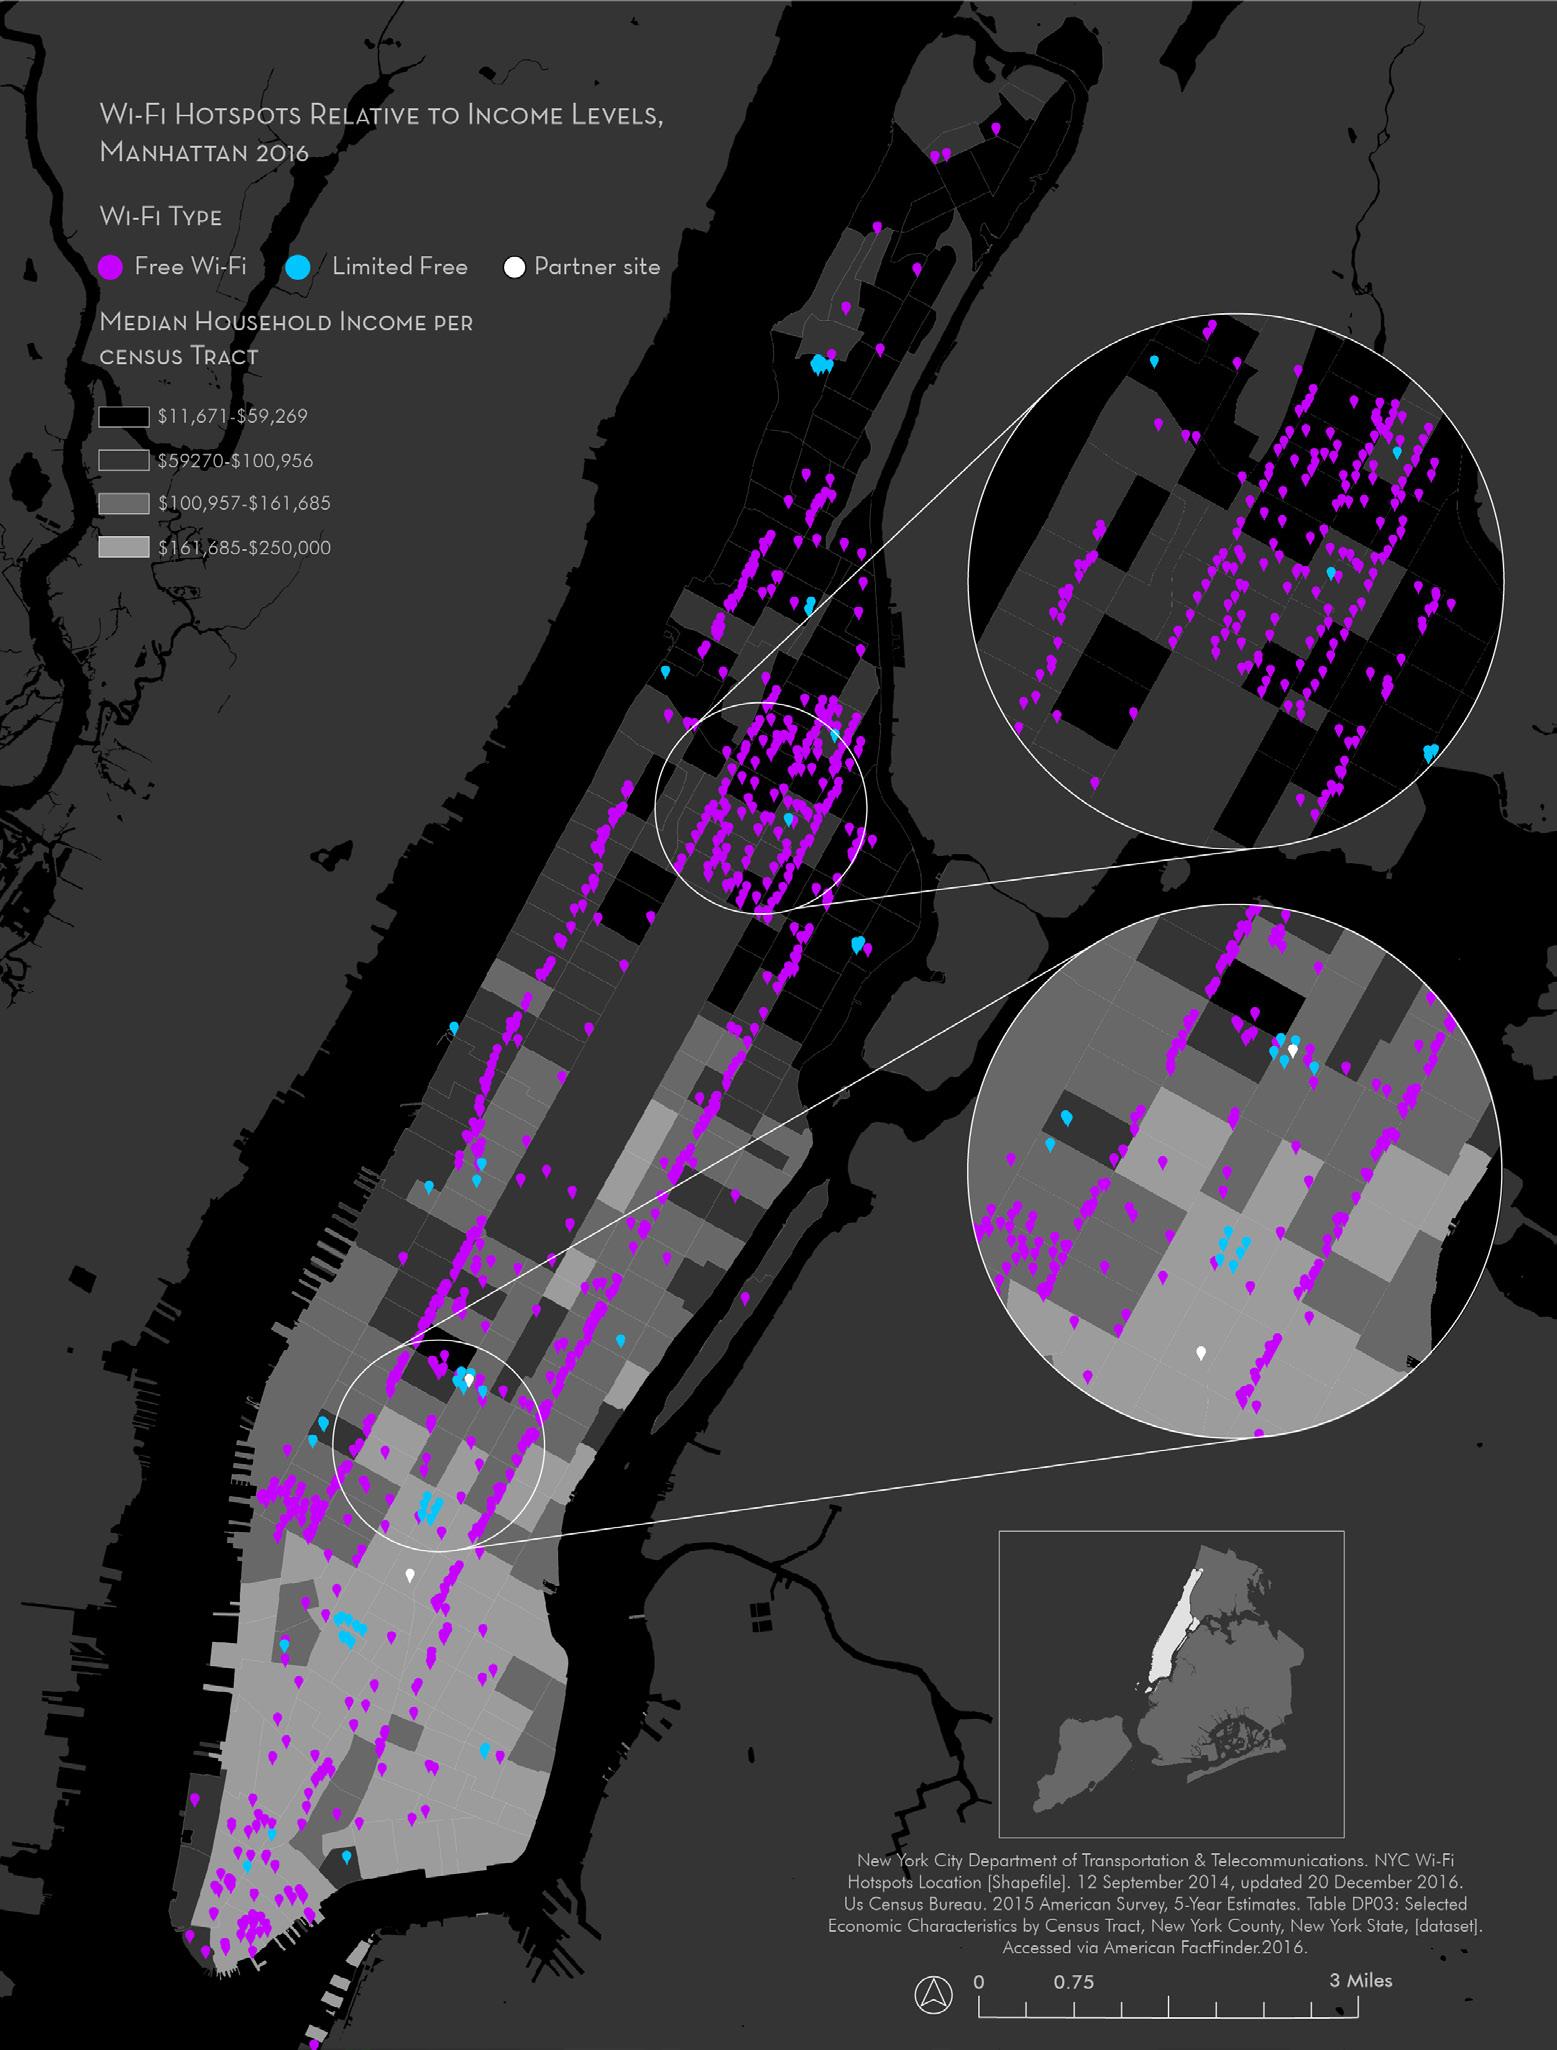
HOW ARE FREE WiFi HOTSPOTS DISTRIBUTED IN MANHATTAN? 2016
Year : 2022
Project : GIS Academic Project, GSAPP
Site Location : New York City Credit : Individual project
Role : 100%_ Research, Design, Presentation
Applications : ArcGIS, Adobe Illustrator, Indesign
Methods : Table Join, Querying by Attribute, Geoprocessing, Summary Statistics, NYC Open Data, ACS, Census
The map illustrates the spatial distribution of Wi-Fi hotspots by type, as well as in relation to median household income by census tract. From the analysis, we discovered that of the 789 total WiFi hotspots, 690 are free, 97 are limited free, and 2 managed by partner sites. These hotspots are located predominantly along subway lines, and in open green spaces, with Central Park being a prime example. Moreover, Wi-Fi hotspots tend to be more evident in in census tracts with higher median incomes such as in the Upper West and East sides. There are noticeably less Wi-Fi hotspots in lower income areas such as in Upper Manhattan, and the Lower East Side.
60 61
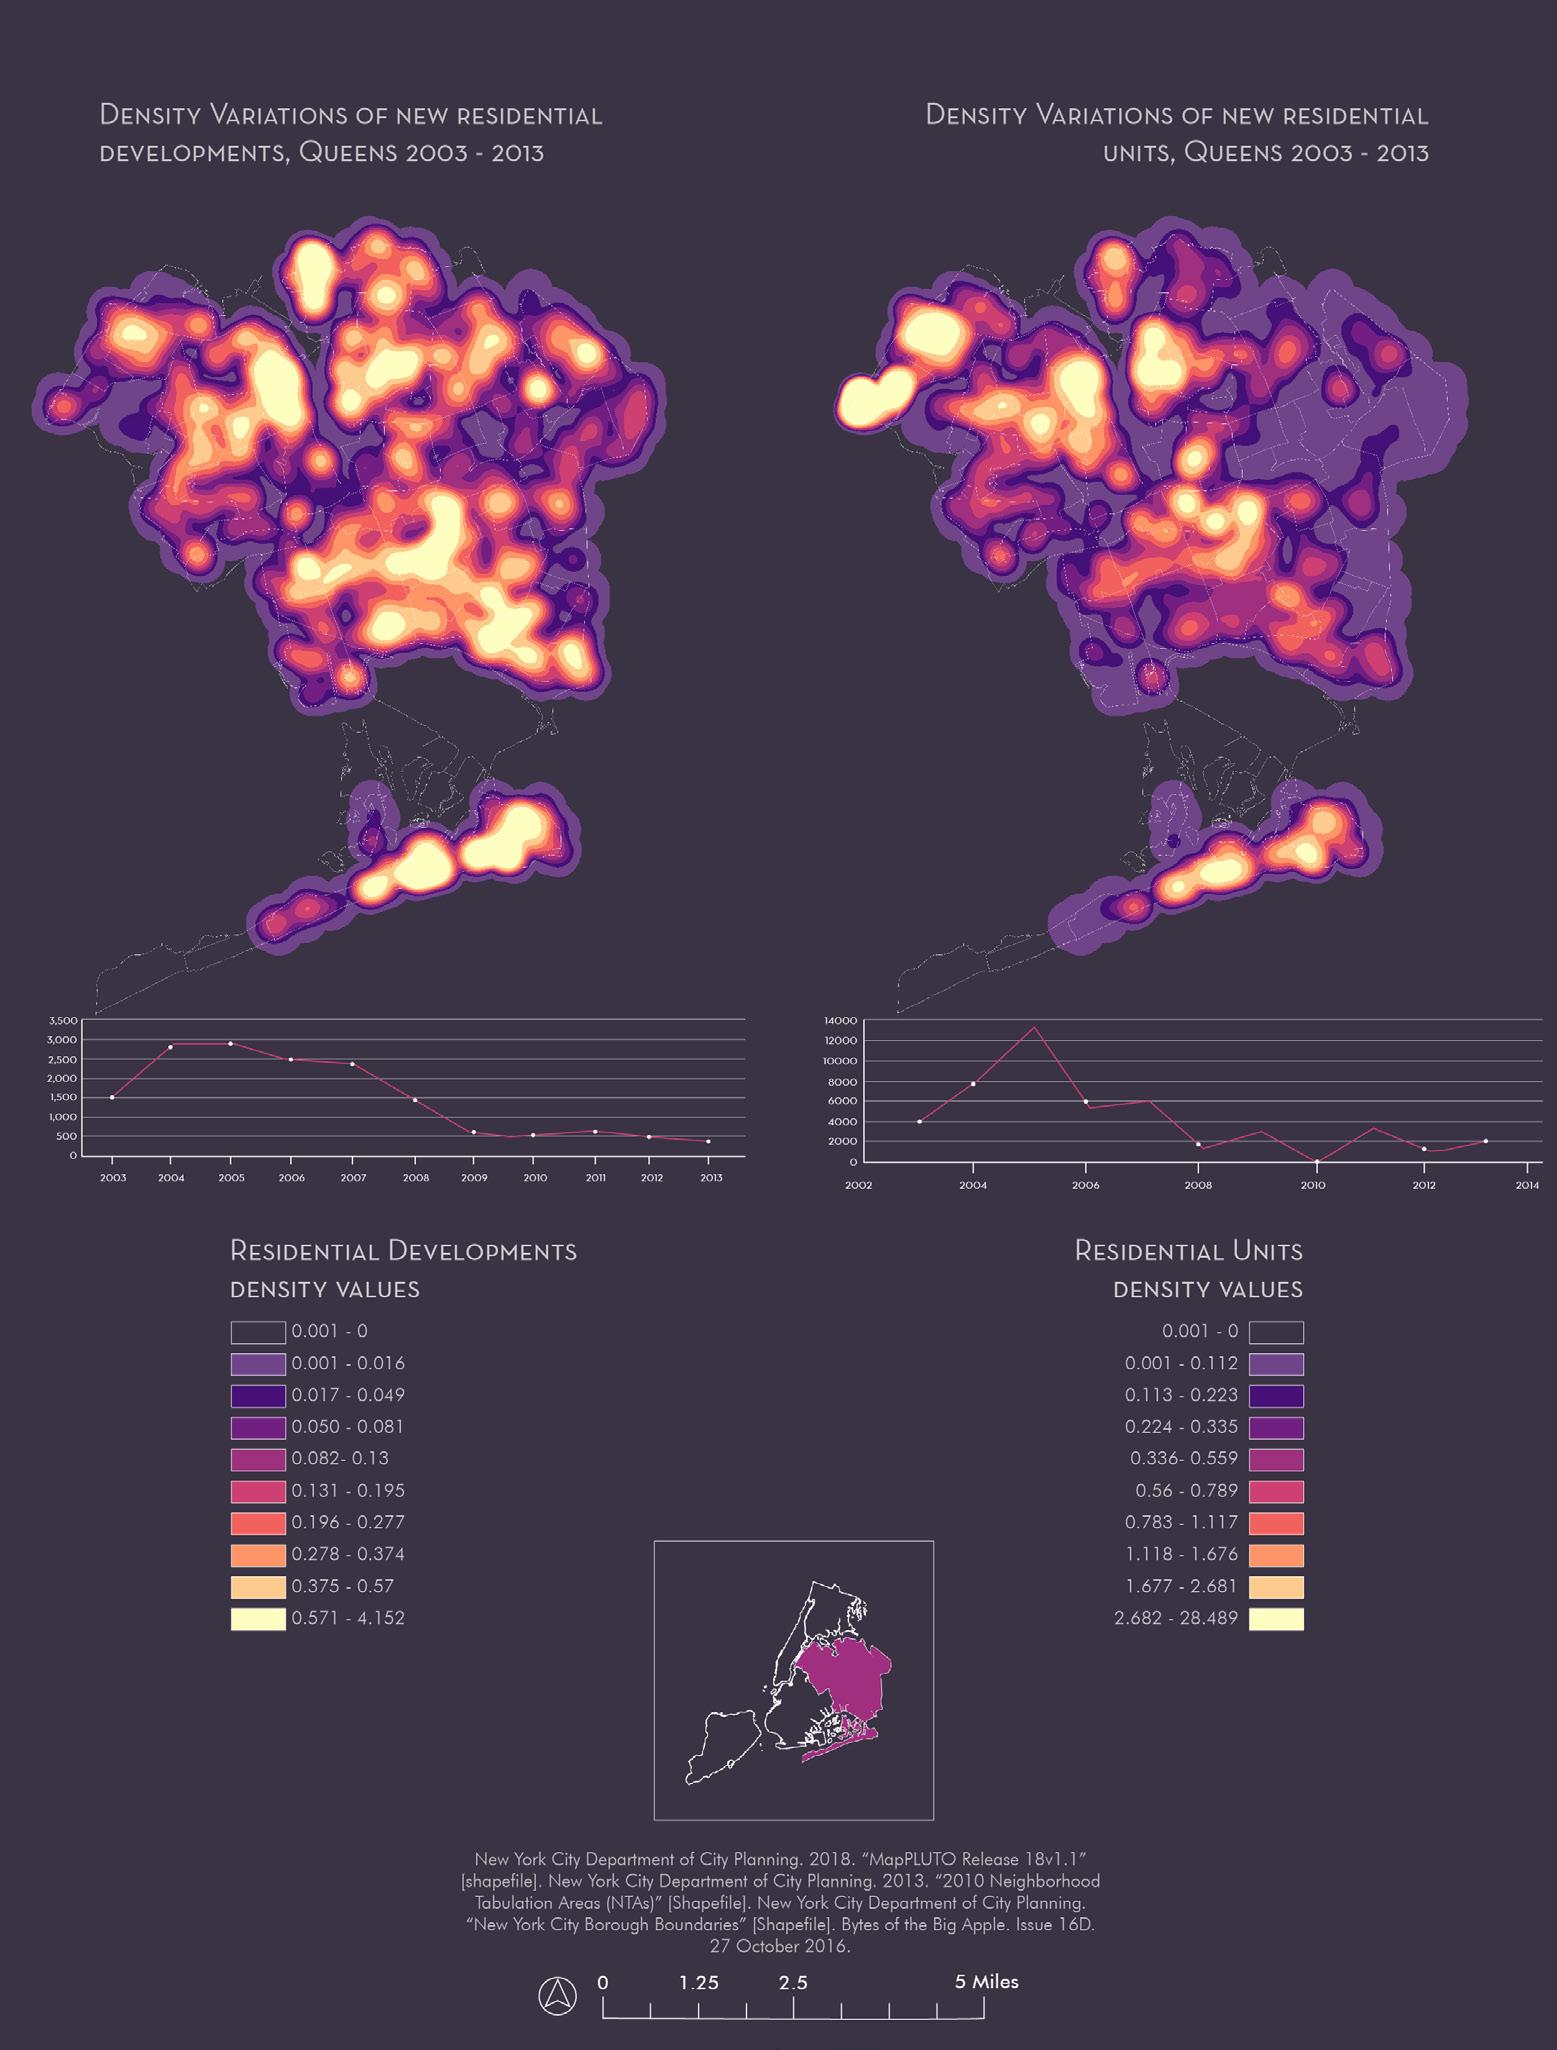
WHICH NEIGHBORHOODS SAW THE GREATEST RATES OF RESIDENTIAL DEVELOPMENTS IN QUEENS?
2003 -2013
Year : 2022
Project : GIS Academic Project, GSAPP
Site Location : New York City
Credit : Individual project
Role : 100%_ Research, Design, Presentation
Applications : ArcGIS, Python, Adobe Illustrator, Indesign
Methods : Kernel Density Analysis, Kernel Density Estimation maps, Euclidean Distance Raster, Reclassification, Map Algebra
To understand the growth of residential development in Queens given a specific time frame, I isolated residential units in the NYC MapPLUTO dataset. I then performed a kernel density analysis on the housing units, testing different parameters. Next, I calculated the density of new residential properties and units per acre by neighborhood tabulation area. I found that Old Astoria had the highest density of residential units, at 6.23 units per acre. New Corona had the highest density of new residential developments at 1.1 developments per acre. In both analyses, Cambria Heights had the lowest density of both residential units and new residential developments at 0.03 and 0.02 units per acre, respectively.
62 63
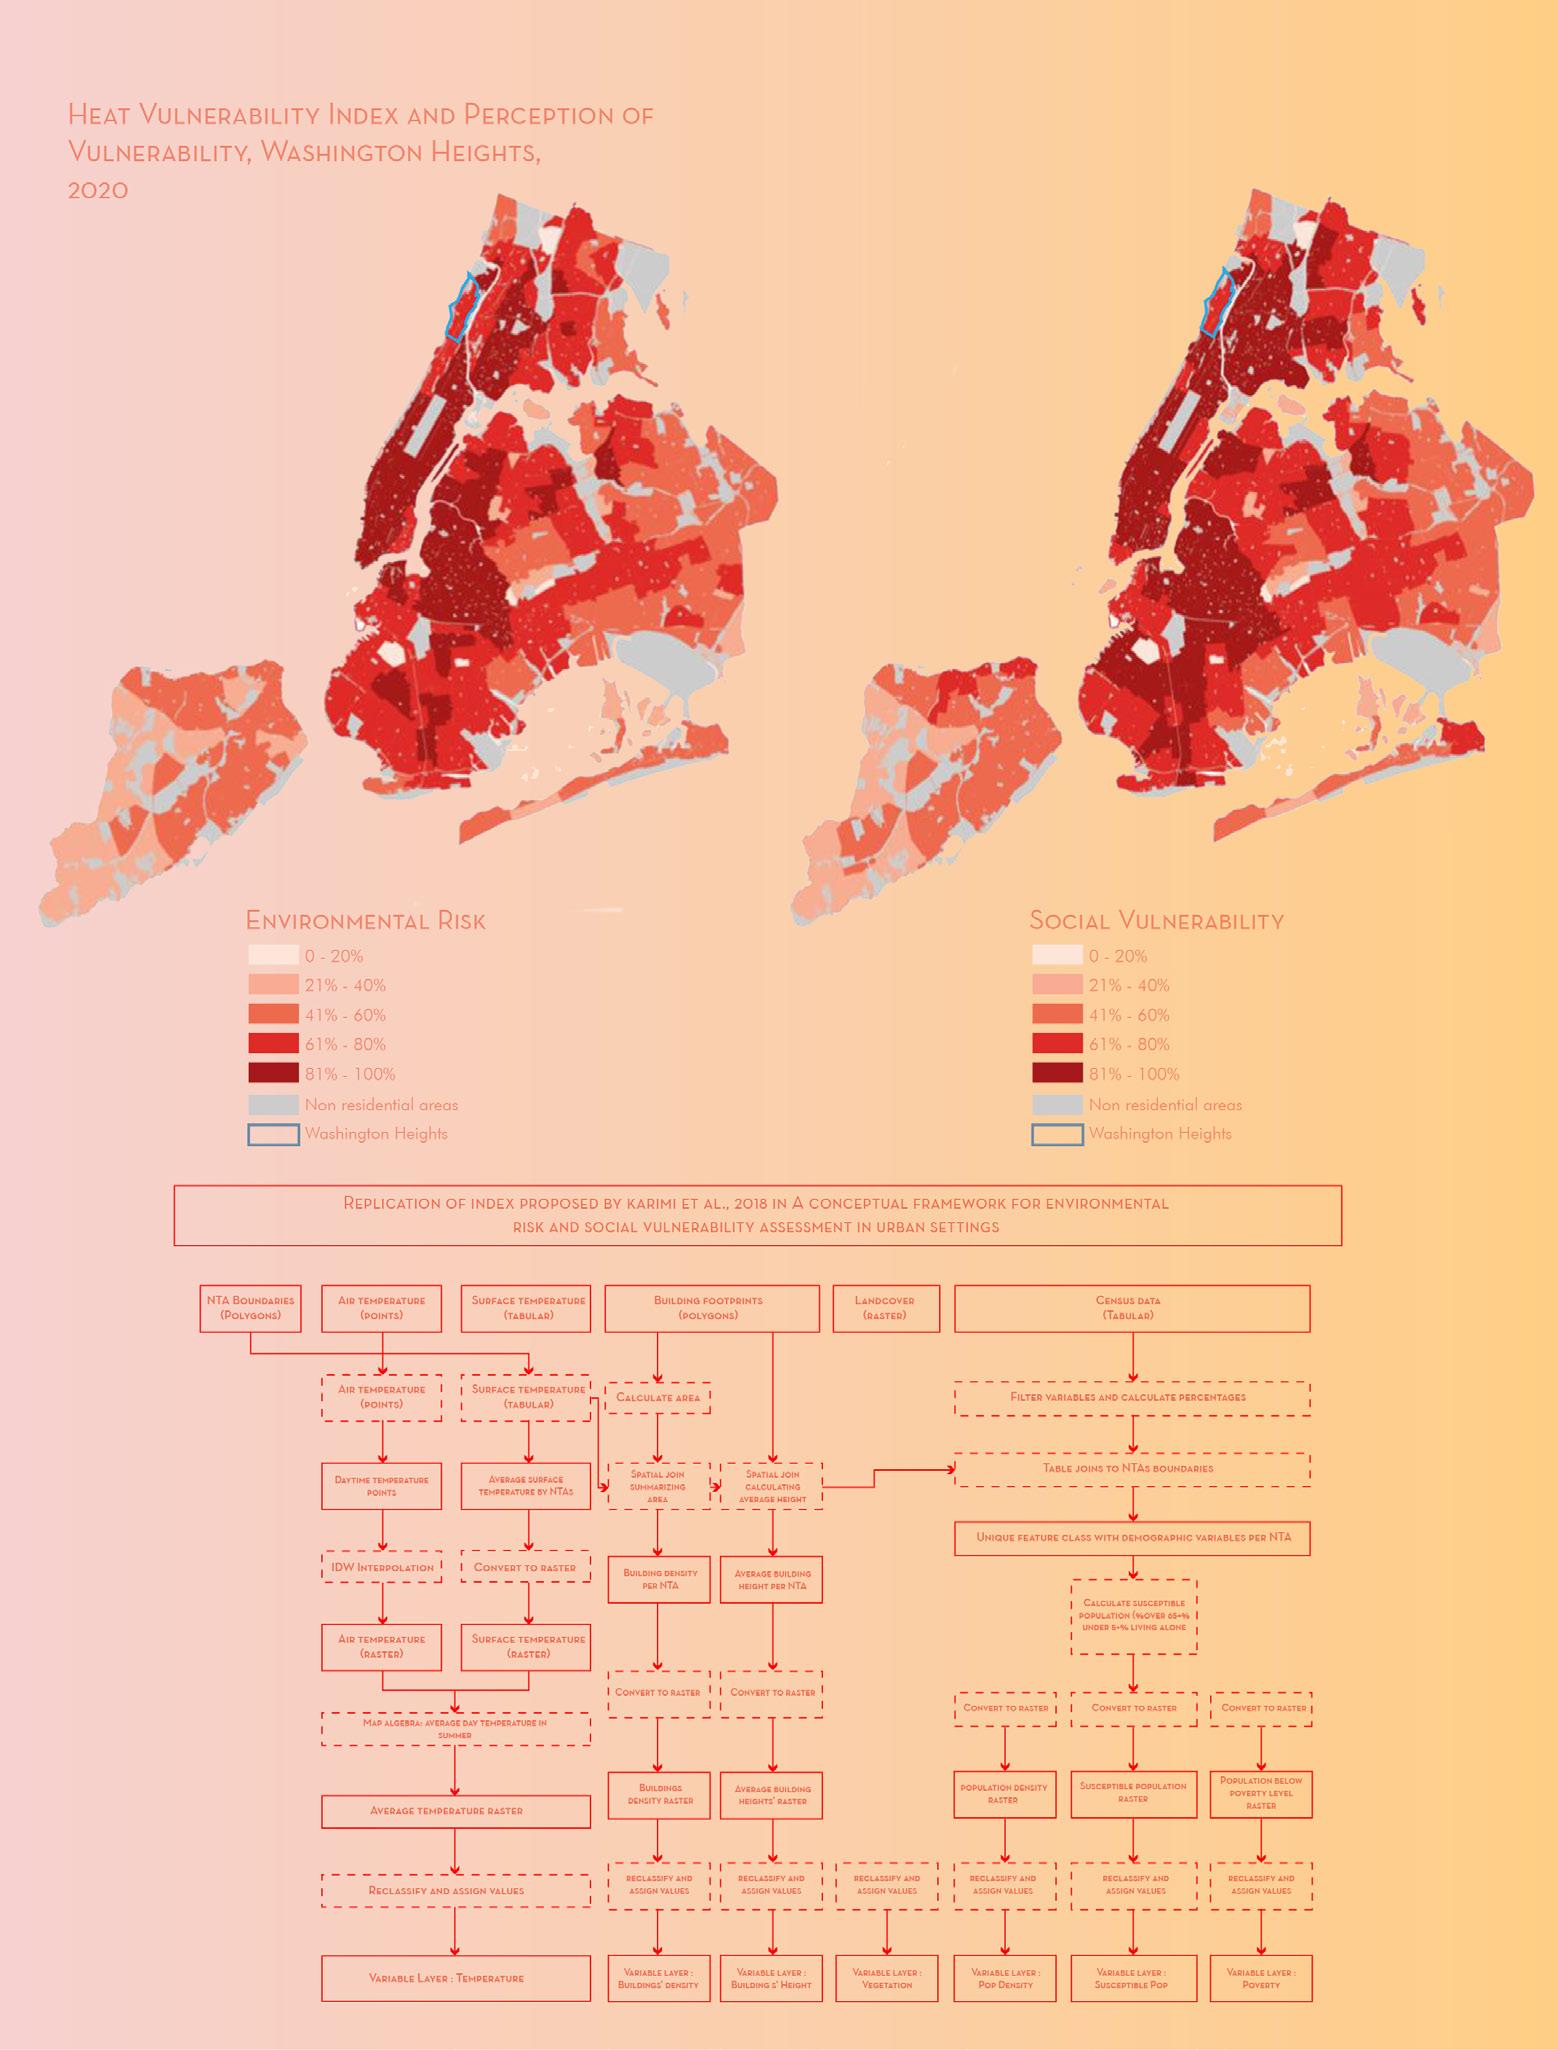
HEAT VULNERABILITY INDEX AND PERCEPTION OF VULNERABILITY, WASHINGTON HEIGHTS 2020
Year : 2022
Project : GIS Academic Project, GSAPP
Site Location : New York City
Credit : Collaboration with Ana Maria Api, Daniela Perleche and Raquel Padilla
Role : 50%_ Research, Mapping, Presentation
Applications : ArcGIS, Adobe Illustrator, Indesign
Methods : Table Join, Querying by Attribute, Geoprocessing, Summary Statistics, NYC Open Data, ACS, Census
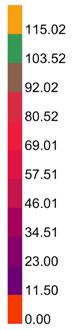
The frequency and intensity of heat waves in New York City have become increasingly concerning in recent years. The majority of those affected by the heat waves were seniors and people from low-income communities. This study therefore aimed to evaluate if HVIs manages to capture the perception of risk by the vulnerable population of Washington Heights and how they assess their vulnerability facing this risk. This study found that a significant portion of the residents in Washington Heights have considered heat waves/ extreme temperatures a problem in the neighborhood, 65% have experienced heat waves in the neighborhood and are somewhat concerned about heat waves/ extreme temperatures. Of the respondents, 40% have experienced heat waves, and 80% are able to adjust their behavior during a heat wave/ extreme temperature. Additionally, 45% of residents consider themselves somewhat informed about heat waves/ extreme temperatures. Dehydration, dizziness, heat stroke, and lack of air are some of the symptoms associated with heat waves that respondents mentioned. Furthermore, the elderly and children are the groups of people that respondents are most concerned about when it comes to heat waves, and many respondents within the data range did not recognize themselves as vulnerable. Finally, some respondents preferred not to be informed about the subject. This research provides insight into the effects of heat waves/ extreme temperatures in Washington Heights, and the need for more public awareness of the subject.
64 65
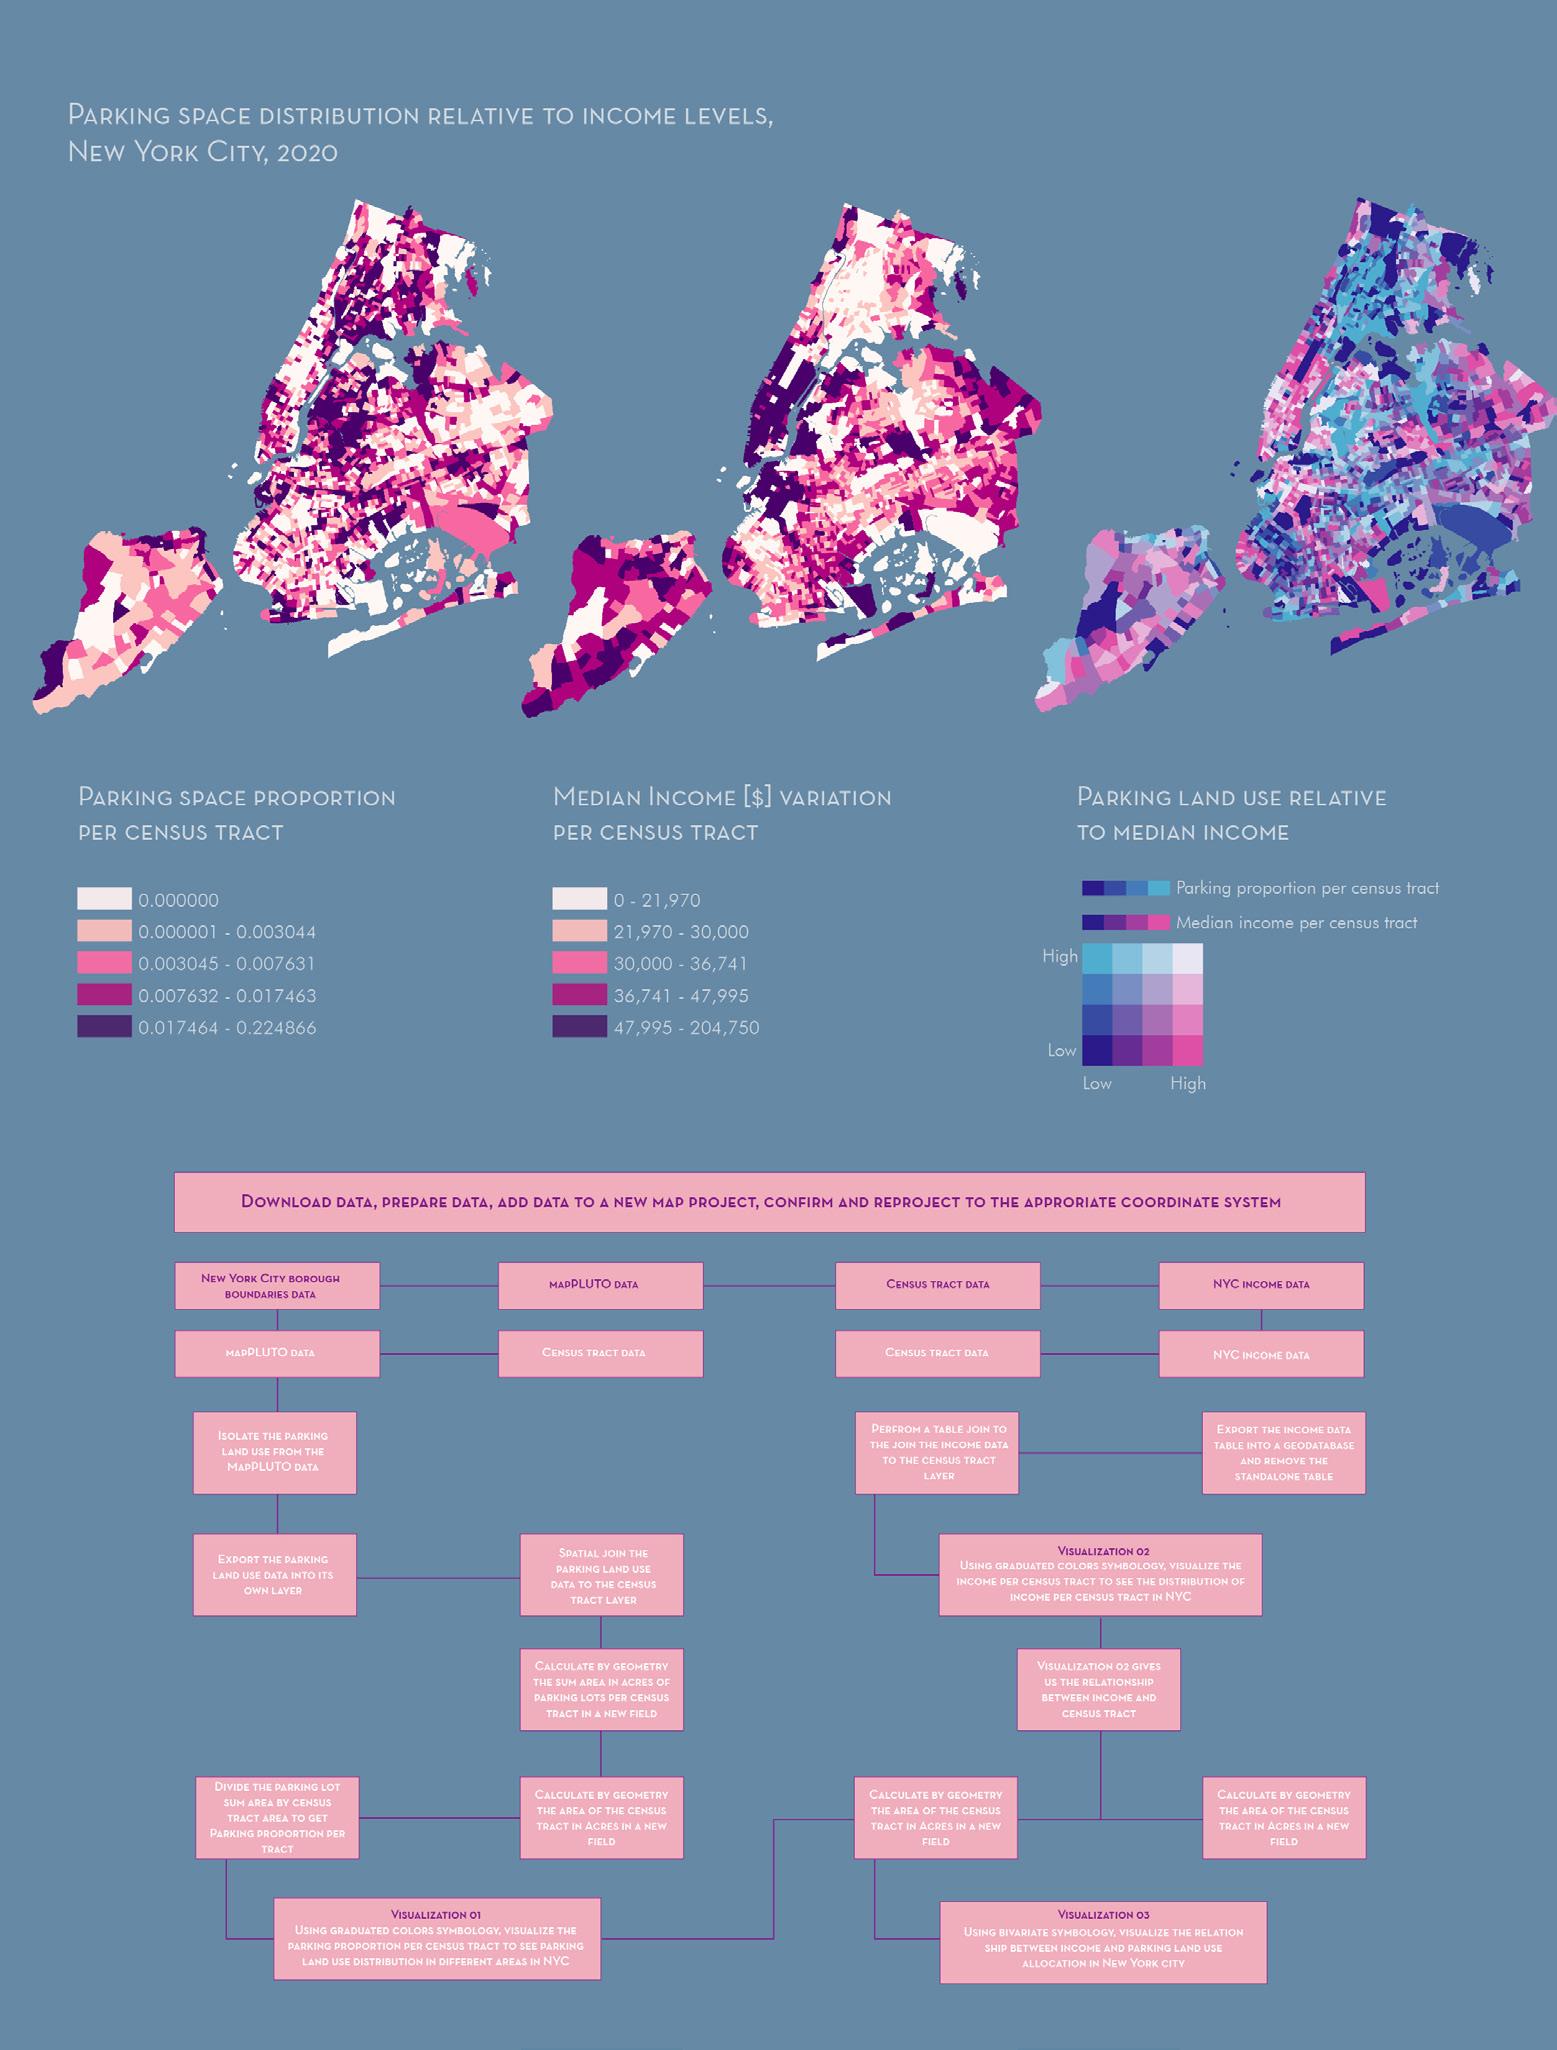
ARE NEIGHBORHOODS WITH MORE PARKING SPACES DEEMED LESS VALUABLE?
Year : 2022
Project : GIS Academic Project, GSAPP
Site Location : New York City
Credit : Colloration with Marcel Subert and Andrew Cronson
Role : 60%_ Mapping, Layout and Presentation
Applications : ArcGIS, Adobe Illustrator, Indesign
Methods : Table Join, Querying by Attribute, Geoprocessing, Summary Statistics, NYC Open Data, ACS, Census
This project aimed to examine the distribution of parking spaces within the five boroughs of New York city by looking at the distribution of surface parking as impacted by the income of various households in New York city. Further, this research determined parking lot usage to see where surface parking infrastructure is located and assess which areas are deemed more or less valuable in terms of land use. The project supposes that low income neighborhoods have a larger amount of available land devoted to surface parking than wealthier areas. It also supposes that as a result of more land devoted to surface parking, the low income neighborhoods are deemed less valuable. The research is intended for the general public as a report on how urban space is allocated to automobile storage. As a type of land use, the presence of parking is an indicator of how land is valued, how citizens live their lives and what priorities are considered for certain communities by city leaders, developers and citizens themselves.
66 67
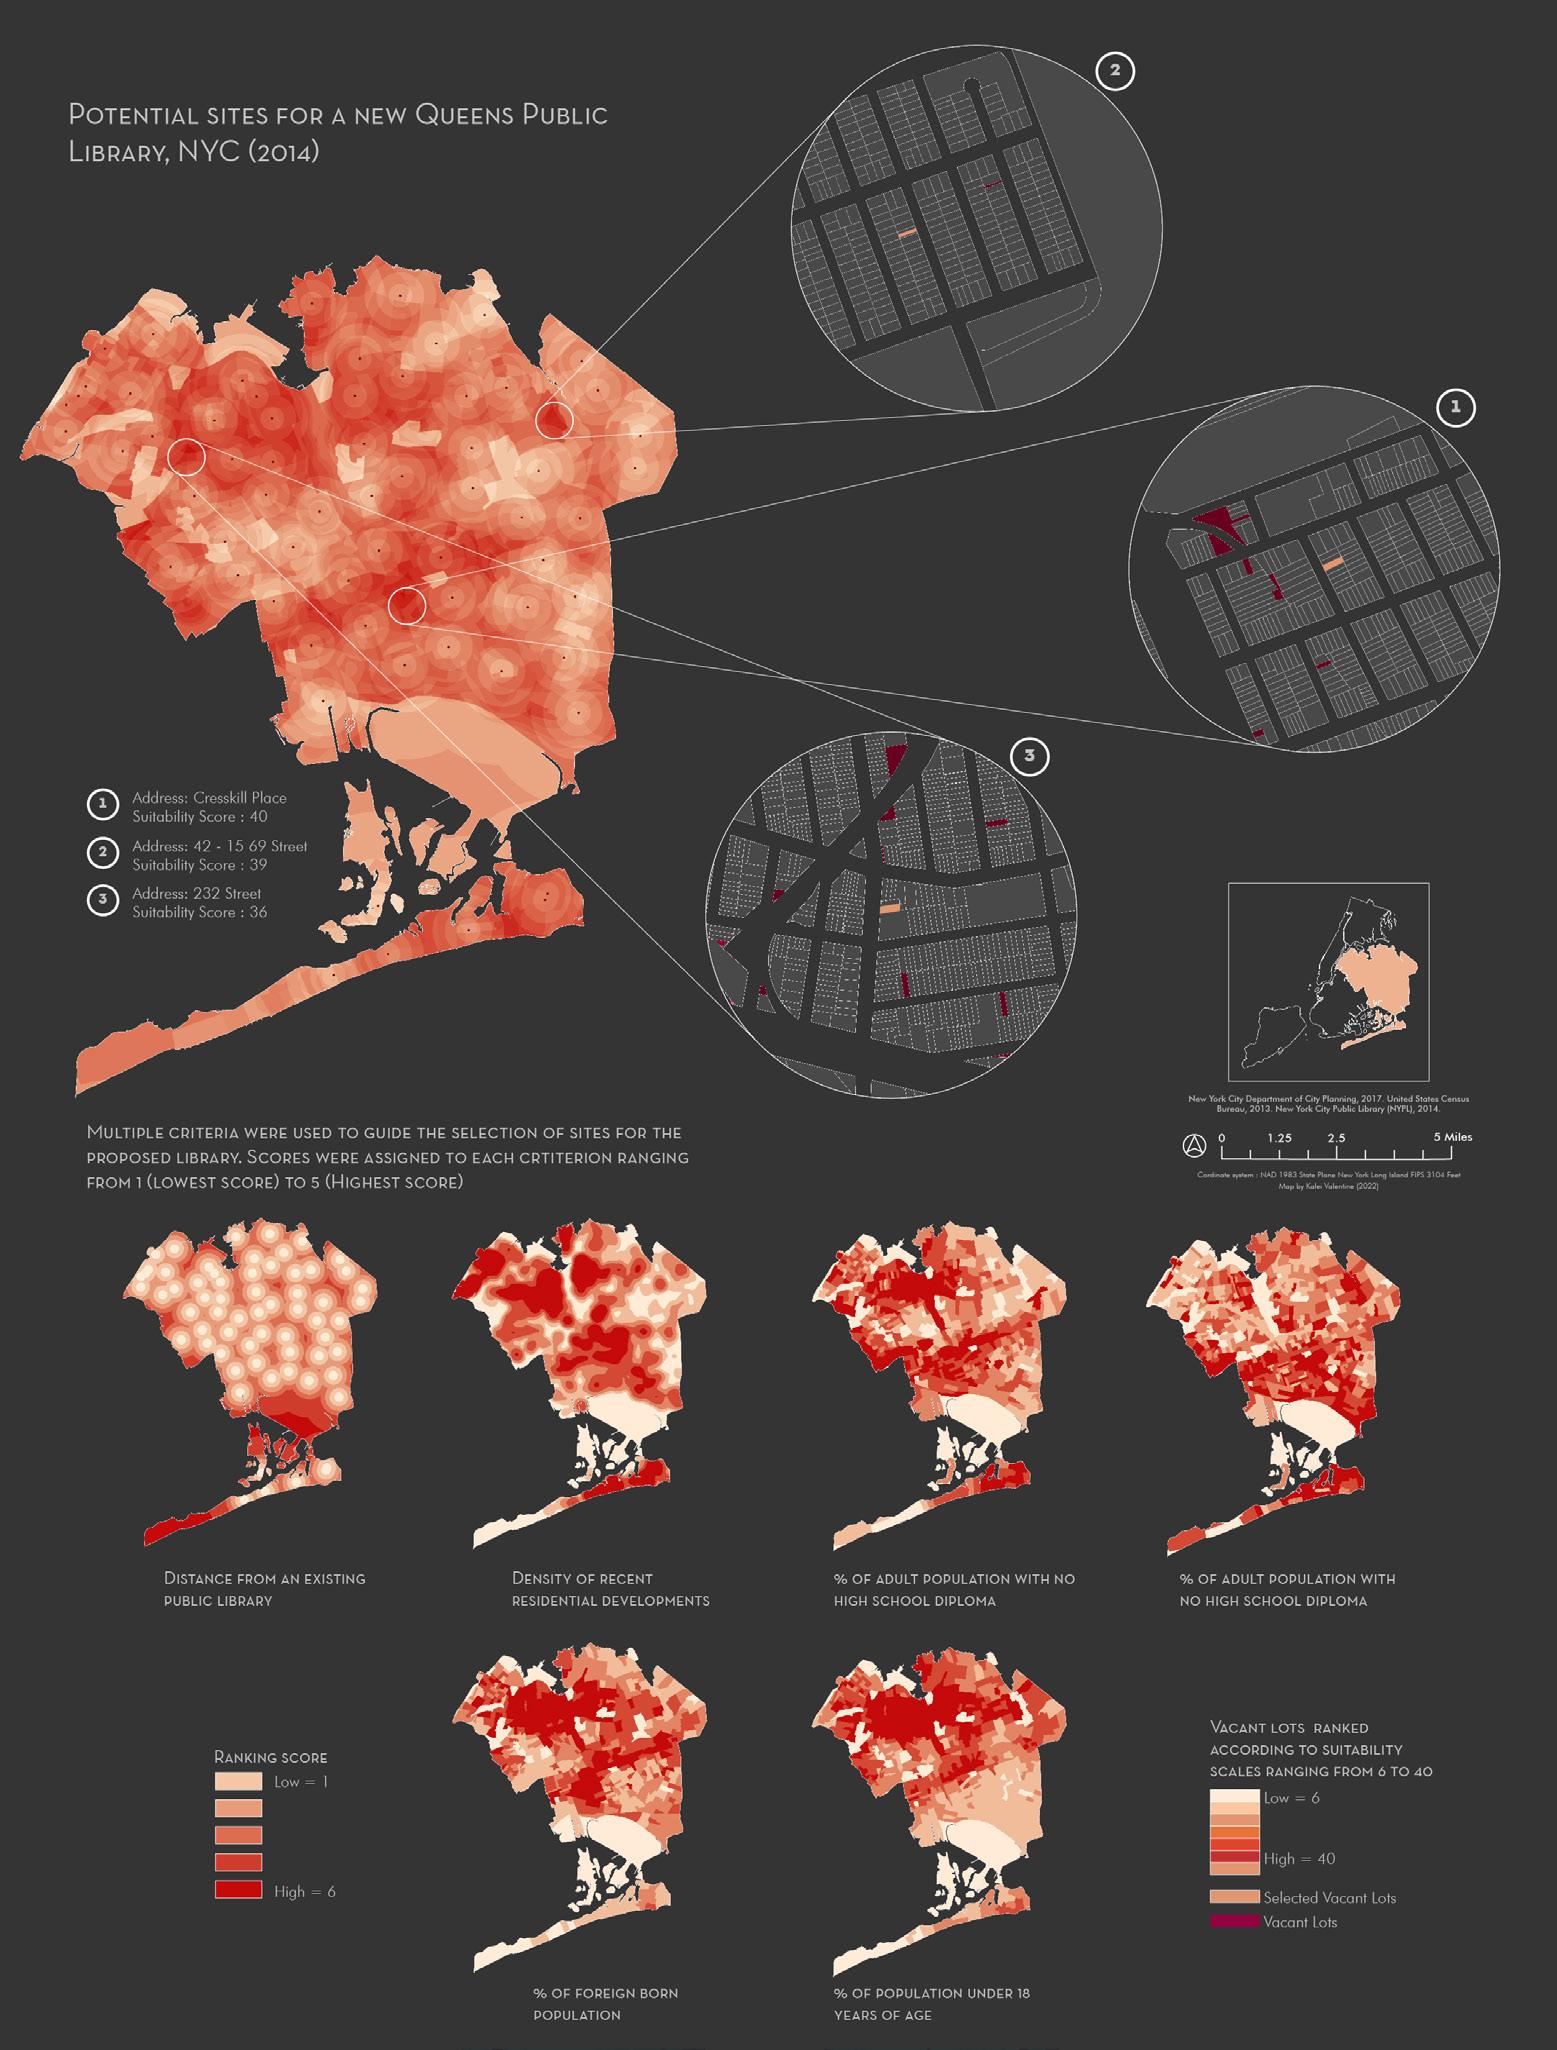
WHICH SITE WOULD BEST BENEFIT FROM A NEW PUBLIC LIBRARY IN QUEENS, NYC?
Year : 2022
Project : GIS Academic Project, GSAPP
Site Location : New York City
Credit : Colloration with Marcel Subert and Andrew Cronson
Role : 100%_ Mapping, Layout and Presentation
Applications : ArcGIS, Adobe Illustrator, Indesign
Methods : Kernel Density Estimations, Euclidian Distance
Raster, Map Algebra, Multi-step, vector- and raster-based, geoprocessing-centric decision analysis
Through a multi-criterion decision analysis, I mapped the suitability of sites for a new public library in Queens, New York. The suitability of the vacant lots was calculated by performing map algebra on the following decision layers: distance from the nearest public library, affordable housing density, percentage of adults without a high school diploma, percentage of populations under 18, percentage of foreign born populations, and percentage of population with English as a second language. The variables were chosen in an effort to increase access to vulnerable populations. Two decision layers, proximity to an existing library and density of residential development, were ranked with more weight. These were weighed three times, and two times more, respectively. Once the suitability scores were calculated, the physical attributes of the lot such as size and shape, were taken into account. Three lots were chosen as recommended sites for new libraries based on the analysis.
68 69
70 71
Kalei Valentine
2021-2023
Architecture Urban planning