


s h .si DD0003 AY 23-24
By n gS u


U2230995H
MENU NguyenH g U2230920A FreyaLowYi U2230851L HoonJengJee U2230 3 2 A2 G03sushisho underchefRene JaredWeeShiEn
DD0003 AY 23-24 G03 Overthinking Sushis
S SHI
U2230014E
verthinking?


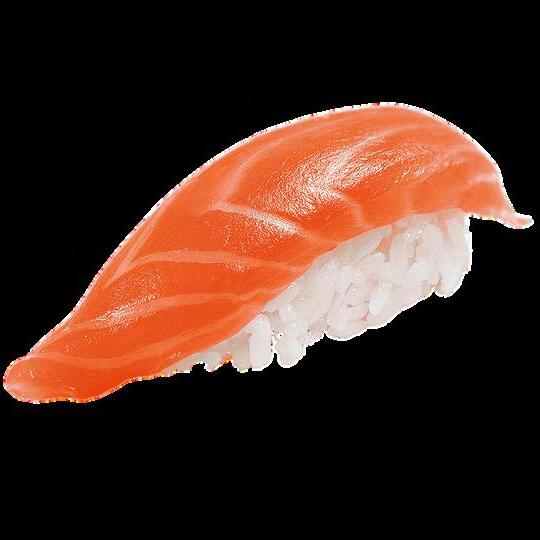
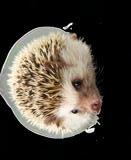
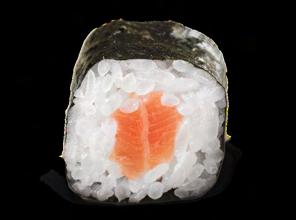
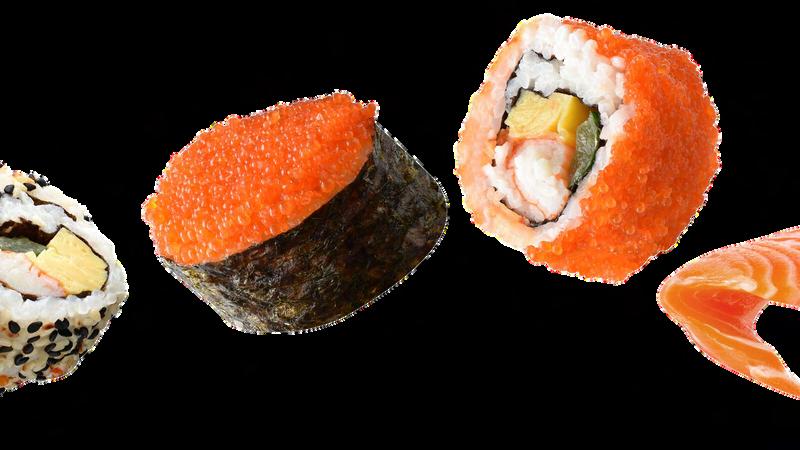
orange for salmon, our group's favorite sushi ingredients!

DD0003 AY 23-24 G03 Overthinking Sushis
why s shis?
Our assorted sushi mascots have their own personalities to reflect the diversity and creativity brought by our ADM and WKW minds to the DD3 fusion restaurant. Thus, we proudly adopted the name "The Overthinking Sushis”.

As we embark on our creative process journal with Information Visualization, I hope it flows as smoothly as a sushi belt.
Researching makes our stomach growls...

DD0003 AY 23-24 G03 Overthinking Sushis
AKIMASU


2
Workshop 1-1: Emoji ice-breaker

3 4 5

Workshop 2-1A: Expressive Lines
Workshop 2-1B: Expressive Lines 2
Workshop 2-2: Visual Variables
Workshop3: Visual Dictionary
Task 1B: Observable Surroundings
Task 1C: Observable Surroundings
WEEK 4
Task 2B: Meal Diary


Task 3B: Retail Therapy
WEEK 5
Workshop 4: RAWGraphs
ITA DD0003 AY 23-24 G03 Overthinking Sushis
emoji ice-breaker


WHOwould’ve meantthoughtthisthrifting?


To avoid misunderstandings, I used a few emojis to represent one word or generalising it instead of being specific. For example I wanted to express that I was a science student before coming to uni. Hence, I had to used these emojis “ ” as there isn’t a “science” emoji.
AHH NO, volunteering!
“Emojis interpretation can either be very straightforward or multifaceted. Apple has over 3,600 emojis, which are a good tool to compliment texts, but are certainly not a definite replacement for written words ”


Don’t like wearing socks? No, I just i don’t like the color of grey socks!


It was definitely challenging to express niche hobbies/actions as compared to guessing our favorite foods. Giang expresses her love for volunteering with this emoji , however we misunderstood it as loving physical touch (hugging!)
DD0003 AY 23-24 G03 Overthinking Sushis
NE WEEK emoji

ice-breaker
Journalism is surprisingly easy to guess.
I’m more proficient with words, so expressing myself with visuals was a little hard. Also I wasn’t sure if the way I interpreted an emoji would be the same as other people who were viewing it
Are you a blueberry lover?
Giang


No no, my favorite color is blue!
Jared

DD0003 AY 23-24 G03 Overthinking Sushis
WEEK TW

expressive lines (1)
I enjoyedseeinghow myfriendsdidtheir pieceswithcontrasting expressionsofstrong emotionsinharshlines orcalmnessinwaves

linesThesemonochromatic allowedmetoget team’sabetterglimpseofmy andthoughtprocess personality.


Overall it was weirdly therapeutic for me.
Seeing emotions consolidated into a single line on paper also solidify how that emotion feels to me whether love is a fuzzy round ball or calmness is one solid circle that is balanced on all ends and equal on all weights.


DD0003 AY 23-24 G03 Overthinking Sushis
Jayne
WEEK TW
expressive lines (1)


Giang Jared
Our most represented emotions seems to be “confusion” & “calm”!
Jeng Jee
DD0003 AY 23-24 G03 Overthinking Sushis
WEEK TW

expressive lines (1)


Confusion
Jayne stands out with her defined, rounded expressive curves.
In one way or another, most of us represented confusion as a form of chaos
distinct experiences or related to various objectives & situations in different phases of our lives that caused us to perceive emotions
My definition of "calm" refers to a transient occurrence with only a single climax/setback.
Repetive, unevenful, smoothsailing time period


It’s intriguing how everyone’s expression and interpretation of emotions are so drastically unique - Maybe our experience with anger and our perception of peace are specific to our lives. Just as no two fingerprints match, each person's perspective on life is a one-of-a-kind masterpiece. (Gasp!)


DD0003 AY 23-24 G03 Overthinking Sushis C
lm
Jared
JengJee Jared Jayne
Giang Jayne
TW WEEK
Expressive Lines (1)
nger Joy


‘Anger’ was the most easy to identify , as it was drawn with harsh lines that expressed strong emotions.”


ve


Some of us drew love as overflowing curves page while some drew it as a tiny shaded circle.”


Giang


Fear
Jeng Jee and I expressed joy like a rainbow explosion or blooming petals (Possibly hinting a connection that may exist between us?)
Expressing my emotions visually felt liberating and validating. It allowed

Mark-making aggressiveness
DD0003 AY 23-24 G03 Overthinking Sushis
JengJee
L
Jared Giang
Jayne
JengJee
JengJee
Giang
Jayne
JengJee
Jayne's portrayal of "love" mirrors her depiction of "calm”!
TW WEEK
Expressive Lines 2

Line style and colours work together to create a cohesive visual

Fromlines1to10,I liberatedmyselffrom overthinking,allowingmy handtoguidethe creation,capturingthe essenceof"expressive lines"beyondmere aesthetics. Giang


DD0003 AY 23-24 G03 Overthinking Sushis
Jared
Whenyoudon’t overthink,you actuallydraw better.
Drawn with left hand
Expressive Lines 2

Giang
Eachpapersheetwas currentshowcase/insightlikeapersonalityto thoughtsfor eachofourmembers

Edgylinesmatched Jayne’soutfitstyles
ThebestpartofitwasthatI wasn’tthinkingtoomuchand simplyallowedanythingthat ontocametomindtotranslate creativitypaper.That’swhenmy reallyflowed.

G03 Overthinking Sushis
Jee
Jeng
TW
TW WEEK
Visual Variables
beAsanartist,therewill mightmomentsthatclients requestforthings tobedoneinacertain way.Westillcanmake themostoutofthe givenperimeters.
I enjoyed getting into the movement of things with each box challenging our perspective in different ways. It was all representative of my headspace .

 Jayne
Jared
Jayne
Jared
TW WEEK Visual Variables
It’s fascinating how we should ‘be within the box’ but also ‘think outside the box’.

Thisactivity mirrors real- world scenarios, where clients andaudiencesmaysetspecific designconstraints.Yetit'san opportunitytonurtureartists tolettheircreativityflourish whilestilladheringtothe guidelines!
Withtheadditionofcoloursandshapes,Icreateda progressivenarrativeforeachoftheverticalrows


If we view restrictions from a positive point of view, it encourages us to think out .” Like how “rules are meant to be broken”.

WEEK
T REE

Being limited to basic shapes was challenging for cute characters and icons have always been in my designs. Hence, I returned to my comfort zone here.


canButIrealisedbasicshapes conveythe lawsinthe simplestway. Aslongasyou anyapplytherulesofproximity, togethershapesthatareclosewillbeperceivedasthe“samecategory”.

Thesimilarityprinciple,akintoanewspaperdesign, amplifiesreadercomprehensionthroughthedeliberate spacingofparagraphstosignifydistinctnews categoriesorsets


DD0003 AY 23-24 G03 Overthinking Sushis
Giang
Emphasis Proximity
Similarity Repetition
WEEK
T REE
Jeng Jee
Itwas challenging differentiating certainlawsfrom eachother
Since a single design can encompass multiple Gestalt principles simultaneously!


hmm... is this emphasis or law of figure ground?

Jayne
Ilearntthatevery designchoicemade


Emphasis Similarity
DD0003 AY 23-24
Giang
Proximity Repetition
WEEK
T REE
I used shapes, dotted lines, and white spaces, to create good proportion and visual harmony within my composition

I like using


It was interesting to learn the different ways we could present data and grouping them by recognisable patterns, similar group elements, space etc.

DD0003 AY 23-24 G03 Overthinking Sushis
Emphasis Proximity Repetition Proximity
WEEK
Visual Dictionary T REE

Jayne designIsawthisactivityfromamore thandataperspectivewhichIrealisedcancreate interestingvisuals.


theIsimplyexaggerated visualizationlawsineverytobe distinctabletoallowforidentification.
Ifocusedonthe emphasisofmaking surethatthelawswere representeddistinctly
DD0003 AY 23-24 G03 Overthinking Sushis
It was easy to group generic items like electronics, but there were some items that forced us to think beyond its purpose.

WEEK Giang
Did you know: the roll of the dice in Monopoly has the power to either make you a billionaire or a prisoner!

HREE
My teammates came up with some very thought-provoking categories like “things that make me laugh or cry” for a

Task 1B: Observable Surroundings DD0003 AY 23-24 G03 Overthinking Sushis
HREE


Task 1B: Observable Surroundings


A lanyard could also be something attached to the wall!

While we had some outliers, some of our categories had way too many objects.
My favourite category was “items attached to the wall” because each item had a different purpose but could be found in similar places.


Hall key fob an sunscreen are a musthave in all our purses!


DD0003 AY 23-24 G03 Overthinking Sushis
eng Jee
0
WEEK
HREE
Task 1B: Observable Surroundings

Wecancreate interestingdatagroups byassociatingwiththings aroundusemotionally.


categorising items this way, we also reached a collective agreement on universally cherished objects


DD0003 AY 23-24 G03 Overthinking Sushis
0 JengJee
canappearThingsthatdifferent besimilartoo.
Giang
WEEK
HREE
Task 1B: Observable Surroundings
The exercise not only honed our analytical skills but also underscored the power of organization of information, simplifying the visualization of extensive data.
It was eye-opening to transform mundane belongings into meaningful groups, shedding light on patterns and insights we often overlook!


DD0003 AY 23-24 G03 Overthinking Sushis
Giang
WEEK
HREE

Task 1B: Observable Surroundings
Jayne
When we expanded our range, it actually became more difficult to categorise them as some objects would fit more than one area.
Everyone had a different way of categorising the items but once we started communicating our thought process, we managed to


DD0003 AY 23-24 G03 Overthinking Sushis
WEEK
HREE
Task 1C: Observable Surroundings
Gian
Itwascertainlymost challengingto decide which elements or data set
I tried to assign simple shapes to the data while using size and length to


isTurningdataintovisuals like giving it a makeover to make it super easy for viewers to spot patterns and see what our objects have in common – it's all about making data fun and friendly!
DD0003 AY 23-24 G03 Overthinking Sushis
WEEK


Counting those items was a bit of a brain workout, and getting them all down just right was quite the adventure! We definitely need some sushi after this!
Ilearntthatitis


I felt like categorising the objects based on the amount/number of it was one of the easiest way to represent the data
 Jeng Jee
With so much data being presented, it was challenging to decide which colours/shapes could best represent the data.


DD0003 AY 23-24
crucialtohavelegends (Andtocolourcode youriconsdistinctly)as theyarethebasisof
WEEK
HREE
Task 1C: Observable Surroundings

Counting all those items was a bit of a chore, but hey, once we did the heavy lifting, anyone checking out the info could breeze through it in no time!
I focused on representing the data and numbers with only colour and shapes felt that focusing on all

peasyImadeiteasy-groupbygivingeach apopof colorsbasedonthe markershadeswe usedtowritethe


DD0003 AY 23-24 G03 Overthinking Sushis
F UR WEEK
Healthy eaters
Eatinghabits analyzingmadeeasy withvisualmodels.

It was interesting that data could be represented in any form and it is ultimately up to one’s creativity.

My own eating habits stood out to me. I never realized d that I am someone with very consistent eating habits.
Jared and Jeng Jee were like

DD0003 AY 23-24 G03 Overthinking Sushis
Identifyinginconsistent mealtrends


home-cookedmealsareabsent

Sunday’s my sleep-in day

Mon & Tue: My morning caffeine buddies for those early classes!
Jeng Jee bottle in DD3 class!
theIwasabletotrack consumedamountoffoodI andtoeatingwhatdegreemy consideredhabitswere “healthy”
Jayne
REALLYTheseeatingpatterns suggestthatthe chartsdepictthelifestyle ofuniversitystudents consistentlivingindorms,where
Giang
F UR WEEK Retail therapy
Observations:
90.1% of our purchases made in Jurong
90% of our purchases were spent on food
63.6% of our purchases were made after 4pm
81.8% of our purchases were less than 5 items
ONLY 18.2% of the items bought were on Sale
72.7% of receipts had a unit number
81.8% of our purchases were made with debit/credit cards
91% of our receipts had no extra charges for carriers

ONLY 27.3% of the receipts had stains on the it
ONLY 9% of the receipts had no description
12. 18.2% of the receipts
most of us stay in the west
Jared
we eat ALOT
most us were out and about during the late afternoon
we are not bulk buyers
some of us are not concerned about price
Most purchases were made on site majority of us used digital modes of payments

majority of us are environmentally friendly

most of us are tidy
one person does not know what he/she bought!

some of us can read more
Most purchases were in the west, tied to our school commitments. Data inference was surprisingly intuitive.
I noticed that most of us spend our money on food because we eat out frequently. Our busy lives really make it challenging to cook.
Jayne
As university students, we mostly spend on food because it's quick, efficient and suits our student lifestyle.

Data says it all, we mainly bought food and drinks under $10, reflecting our budgetconsciousness.
We've never scrutinised our receipts like this before. The challenge was the process of cherry-picking the most insightful information to highlight Giang
DD0003 AY 23-24 G03 Overthinking Sushis
F UR WEEK Retail therapy
So... in what way could the organisation and inference of data be made more efficient or simpler?


We could have categorised the receipts into retail, food etc. from the get-go and assign one person to one category to ensure that receipts are neatly organised and easily identified.
We could have split the reciepts amongst our group members to brainstorm a few ways to categorize data beforehand according purpoe, price, time, venue.tc
Arranging our purchase information chronologically, hierarchically or by emotional reasonings beforehand might do the trick. This would offer a more persuasive and clear communication for our analysis purposes.


If we could utilize intuitive visual cues like font sizes, color, thickness and opacity while organizing the data, it would be much more efficient to analyze than reading through every percentage column as we are doing now.
On the data collector's side, of course it's always messy. But if we can simplify information into shapes and color by using the suitable data sorting tools, retrieving information will be much less time-consuming!
DD0003 AY 23-24 G03 Overthinking Sushis
Jared
Jayne
JengJee
(https://www.perceptualedge.com/blog/?p=1829)


Theyencodecomplexdata
CreatedbyThomas treemapPorostocky,this displays lostworldwideyearsoflife andbycauseusingsize colorintensity TREEMAP https://app.rawgraphs.io/
Igeneratedusing Musical“OrchestrabyIntrsuments” dataset! DD0003 AY 23-24 G03 Overthinking Sushis
VE WEEK RAWGraphs
Giang Treemapsefficientlyrepresent hierarchicaldatastructures dividedintorectangles.
relationshipsinacompact, intuitivewayusingsizeandcolors.
Thisisthetreechart
F
Jeng Jee


https://app.rawgraphs.io/ https://www.behance.net/gallery/126545725/THOU-SHALT-SHRED?tracking_source=search_projects|radar+chart DD0003 AY 23-24 G03 Overthinking Sushis
Radarchartsconsistsoflines representingadifferentvariable. Thesechartsareusedfor comparingmultiplevariables acrossdifferentcategories. Radarchartsareusefulfor performanceanalysisandfeature comparison.
RADAR CHART Thisistheradar chartIgenerated using“FIFAplayers statistics”dataset! CreatedbyMelissa chartMalguy,thisradar evaluates albumsbythetop10metal differentbandsusingfourcategories
WEEK RAWGraphs
F VE
F VE WEEK

This is the sunburst diagram I did using “ Aromas of wine and frequency”
These user-friendly interfaces made data organization more intuitive for us!

Asunburstdiagramshows concentrichierarchythroughaseriesofrings,whereeachring hierarchy.correspondstoalevelintheEachringissegmented proportionallytorepresentits constituentdetails.

https://chartexpo.com/charts/sunburst-chart
https://chartexpo.com/charts/sunburst-chart

DD0003 AY 23-24 G03 Overthinking Sushis SUNBURST DIAGRAM
Giang
F VE WEEK RAWGraphs
Analluvialdiagramsimplifies complexdatabyshowinghow interactcategorieschangeand situations.overtimeoracross spottingIthelpswith trends, andunderstandingrelationships, makingsmarterdecisions.


A very aesthetic and easy to understand alluvial diagram that shows Europe’s migrant crisis.
You’ll never get bored analyzing all these data!
DD0003 AY 23-24 ALLUVIAL DIAGRAM
Jared
https://foreignpolicy.com/2015/09/03/europes-migrant-crisis-by-the-numbers/
F VE WEEK RAWGraphs


Jayne
dimensionsAbubblechartdisplays3 of data, two of whichtheplotsthedataonalocationof graphthroughitsxylocation and the 3rd dimension, in relation to the dot’s size which
Amorecomplexexample ofabubblechart, representingexoplanet locationsaccordingto distanceagainstsurface temperatureofthe planets.


This was a simple bubble chart I generated using the temperatures in Paris during World War 2 data set.


G03 Overthinking Sushis
BUBBLE CHART
https://datavisproject.com/data-type/bubble-chart


DD0003 AY 23-24 G03 Overthinking Sushis
Uniformsushisthis timerepresenting howweALLagree onthis!


YOU
aima s u DD0003 AY 23-24
THANK
FOR DINING WITH US